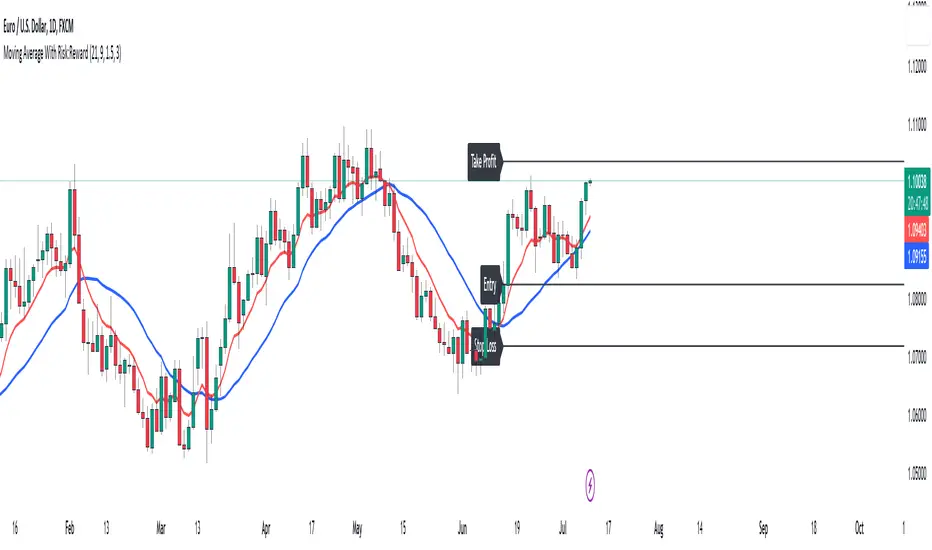
Moving Average With Risk:Reward**Title: A Detailed Guide to Using the Moving Average With Risk:Reward Indicator**
The dynamic world of financial markets offers a myriad of opportunities for market participants to make profitable trades. However, to unlock these opportunities, traders require reliable tools to guide their decisions, tools such as technical indicators. One such indicator is the 'Moving Average With Risk:Reward' Indicator, a versatile tool that combines the simple moving average (SMA), exponential moving average (EMA), Average True Range (ATR) indicator, and automated entry, stop-loss, and take-profit markers to provide a comprehensive analysis of market trends. This article aims to detail the use and interpretation of this indicator.
**Understanding the Building Blocks**
1. **Moving Averages (SMA & EMA):**
Moving averages are arguably some of the most common tools used by traders worldwide. They help smooth out price data to form a trend following indicator. Our custom indicator utilizes both a 21-period SMA, which averages the closing prices of the past 21 periods, and a 9-period EMA, which gives more weight to recent prices. The difference in sensitivity between these two moving averages forms the basis of our trade signals.
2. **Average True Range (ATR):**
The ATR is an essential component of our indicator. It measures market volatility by decomposing the entire range of an asset price for that period. It plays a critical role in determining the stop loss and take profit levels in our indicator, as detailed later.
**How the Indicator Works**
Our custom indicator works by generating buy or sell signals based on crossover and crossunder events between the SMA and EMA. A crossover occurs when the EMA (more sensitive to recent prices) crosses above the SMA, indicating upward momentum and hence triggering a buy signal. Conversely, a crossunder, where the EMA moves below the SMA, indicates increasing downward momentum and generates a sell signal.
Upon the generation of a signal, the indicator draws lines on the chart to represent the entry point, stop loss, and take profit levels. The user has the freedom to adjust the color of these lines for visual clarity. The script will also delete previous lines whenever a new signal is generated to avoid clutter and confusion.
**Determining the Stop Loss and Take Profit Levels**
Our custom indicator uses the ATR and a predetermined multiplier to calculate stop loss and take profit levels, thus incorporating market volatility into these critical decisions. The user can input their preferred multiplier for both stop loss and take profit.
Stop Loss (SL): SL is set at a level that is the ATR value multiplied by the stop-loss multiplier subtracted from (for a long position) or added to (for a short position) the closing price.
Take Profit (TP): Conversely, TP is set at a level that is the ATR value multiplied by the take-profit multiplier added to (for a long position) or subtracted from (for a short position) the closing price.
These SL and TP levels get plotted as horizontal lines on the chart, extending to the right. Labels are also placed to easily identify these levels.
**Making the Most of the Indicator**
A significant advantage of this indicator lies in its simplicity and clarity. Traders can clearly see the entry point, stop loss, and take profit levels on the chart. They can modify these levels based on their risk tolerance or trading strategy.
The combination of SMA and EMA offers the best of both worlds, with SMA providing a lagging, stable trend indication and EMA offering a more responsive indication to recent price changes. The indicator's use of ATR for SL and TP settings also ensures that these levels adapt to changing market volatility.
It is essential to remember that while this indicator can be an invaluable tool in a trader's arsenal, it is not infallible. Markets can often behave unpredictably, and even the most robust and reliable indicators can occasionally generate false signals. Therefore, traders should always employ sound money management strategies and use this indicator in conjunction with other technical analysis tools and fundamental analysis to confirm signals and make informed trading decisions.
In conclusion, the Moving Average With Risk:Reward indicator provides a comprehensive and versatile tool that can significantly enhance trading strategies. Its integration of trend-following moving averages, volatility-adjusted stop loss and take profit levels, and clear chart visualizations make it a potent tool in the financial markets. By fully understanding how to interpret and utilize this indicator, traders can navigate the markets with increased confidence and precision.
Cari dalam skrip untuk "stop loss"
Anchored VWAP Pinch & Handoff, Intervals, and Signals"Anchored VWAP Pinch & Handoff, Intervals, and Signals" is an AVWAP toolbox for those who like to use various VWAP trading techniques. The indicator is currently comprised of the following three sections:
• The Pinch & Handoff section (shown above on chart) allows manually setting an upper and lower AVWAP (Pinch) along with an additional AVWAP (Handoff) by entering dates or by dragging the vertical anchor lines to the desired significant events on chart. Each of these three AVWAPs can also be set to show zones above and/or below by a percentage or standard deviation amount. The theory behind this method is that the upper and lower AVWAPs may act as dynamic support and resistance levels, effectively creating a price range or channel. As price moves between these two VWAP levels, it becomes squeezed or consolidated within that range. Further conjecture is that the longer the price remains within the range of the two anchored VWAP values, the higher the potential for an explosive breakout. Traders using this strategy may interpret the prolonged consolidation as a period of price compression, with the expectation that a significant move in either direction is likely to occur. Traders employing the AVWAP Pinch strategy might look for specific chart patterns or additional confirmation signals to enter a trade. For example, a breakout above the upper anchored VWAP level could trigger a long trade, while a breakdown below the lower anchored VWAP level could signal a short trade. Stop-loss orders and profit targets are typically set based on the trader's risk tolerance and the volatility of the asset. The third AVWAP (Handoff) is typically set after price has broken through the Pinch, and is used as a new level of support or resistance. The "Pinch & Handoff" phrase is believed to have been coined by Brian Shannon, who has popularized this method.
• The Intervals section (shown above on chart) is comprised of six periodic AVWAPs which cyclically reset. Their default settings are 1 Day, 2 Days, 1 Week, 1 Month, 1 Quarter, and 1 Year. They each may be set to desired period and when they are enabled the VWAPs whose periods are lower than the current chart timeframe are automatically hidden. For example a 1 Day AVWAP is not useful on a 1 Week chart so it would be hidden from that timeframe. When using AVWAPs from higher timeframes it may be helpful to set your chart to "Scale price chart only". This can be enabled by right clicking on your chart's price column and then left clicking "Scale price chart only" to enable that option.
• The Auto section (shown above on chart) is comprised of two automatic Anchored VWAPs. There are choices for setting anchors automatically based upon Highest Source, Highest Volume, Lowest Source, Lowest Volume, Pivot High, and Pivot Low. Because these two VWAPs work retroactively they are drawn with lines instead of plots. There is currently a limitation of 500 lines that may be drawn at any given time and the logic within this indicator uses a line for every bar of VWAP that is drawn, so if the combined length of both of these VWAPs exceeds 500 bars the earliest lines would disappear. For typical use of looking for the highest high in the last 50 bars or the last fractal this limitation should not be an issue.
---
All of the plots have been titled including hidden plots that are generated for the AVWAP line drawings. All of the various types of AVWAP within the indicator should be available as choices within the Alert creation dialog if use of alerts is desired.
---
NOTICE: This is an example script and not meant to be used as an actual strategy. By using this script or any portion thereof, you acknowledge that you have read and understood that this is for research purposes only and I am not responsible for any financial losses you may incur by using this script!

Pro Trading Art - Head And ShouldersHow the Script Works:
1. The script identifies potential Head and Shoulders patterns by searching for specific pivot highs and pivot lows in the price data.
2. It checks for the presence of a left shoulder, head, and right shoulder based on the conditions defined in the script.
3. If a valid Head and Shoulders pattern is found, the script plots lines and labels on the chart to visualize the pattern.
4. The script also identifies Inverted Head and Shoulders patterns using similar logic but with different conditions.
5. It plots lines and labels for the Inverted Head and Shoulders pattern.
6. The script generates short and long conditions based on the patterns. Short conditions trigger when the close price crosses below the neck level of a Head and Shoulders pattern, while long conditions trigger when the close price crosses above the neck level of an Inverted Head and Shoulders pattern.
7. It plots sell and buy signal shapes on the chart when the short and long conditions are met, respectively.
8. The script can also trigger alerts to notify the user when a valid Head and Shoulders or Inverted Head and Shoulders pattern is detected.
9. The script provides visual cues on the chart to help users identify potential trading opportunities.
10. The logic and parameters of the script can be modified by the user to customize the behavior and adapt it to different trading strategies.
How Users Can Make Profit Using This Script:
1. Identify potential short-selling opportunities: When a valid Head and Shoulders pattern is detected and a short condition is met, it indicates a potential trend reversal. Traders can consider opening short positions to profit from a downward price movement.
2. Identify potential long-buying opportunities: When a valid Inverted Head and Shoulders pattern is detected and a long condition is met, it suggests a potential trend reversal. Traders can consider opening long positions to profit from an upward price movement.
3. Combine with additional analysis: Users can utilize this script as a tool in their overall trading strategy. They can combine the signals generated by the script with other technical indicators, fundamental analysis, or market sentiment to make more informed trading decisions.
4. Define appropriate entry and exit points: Traders can use the lines and labels plotted by the script to determine entry and exit points for their trades. For example, they may choose to enter a short position after the price crosses below the neck level and exit when the price reaches a predetermined target or when the pattern is invalidated.
5. Set risk management measures: It is important for users to implement proper risk management strategies when trading based on the script's signals. They should define stop-loss orders to limit potential losses if the trade goes against them and consider setting profit targets to secure profits when the trade moves in their favor.

TradeEasy - KintroThe TradingView script provided is a custom indicator named "TradeEasy - Kintro". It is created by the author Kintro and is designed to help traders identify potential buy and sell signals in the market. The indicator is based on the Exponential Moving Average (EMA) and uses two different EMAs, one with a period of 20 and the other with a period of 50.
The indicator is meant to be used on the 5-minute timeframe and it is recommended to use TradingView in Dark Mode for better appearance. The author also reminds users that no strategy works 100% accurately and backtesting should be done before trading with a real account. The author is not responsible for any losses incurred by traders.
The indicator uses a simple set of rules to generate trading signals. The thick line on the chart represents the 50 EMA while the thin line represents the 20 EMA. When the thin line crosses upwards over the thick line, it indicates a bullish signal. After the crossover, traders are advised to wait for the price to pullback between the two lines. A range should then be created while the price moves through the thin line.
On the break of the range, an entry signal is generated, and the stop loss should be set below the range. The author advises traders to exit their profits according to their own analysis or price action and not to re-enter on the next pullback of the same trend. The same rules apply when the thin line crosses downwards over the thick line.
The author emphasizes that range creation is mandatory on crossing and that traders should not try to go against the trend. If the price is above both lines, traders should only go for buy orders, and vice versa.
If there is no range created while crossing, traders are advised not to enter the market. Traders should wait for the opportunity and not force a trade.
The indicator also includes a plot of the 34 EMA, and a range is created above and below the price action using the "up" and "down" variables. The author uses the "fill" function to color the background of the chart to highlight the range. The "dummy" variable is used to plot circles above or below the price action, depending on the trend.
In summary, the "TradeEasy - Kintro" indicator is a custom indicator designed to help traders identify potential buy and sell signals based on the crossing of two EMAs. The author provides a set of rules to generate trading signals and advises traders to wait for the opportunity and not force a trade. The indicator also includes a visual representation of the range created on the chart. As always, traders are advised to conduct their own research and analysis before entering any trades.

OmidCapitalCalWith this tool, traders are able to calculate position leverage based on risk percentage
// ------ Settings Inputs -----------------------------------------------------------------------------------------------------
// "Capital" -- enter your portfolio balance
// "Risk" -- enter the percent of your portfolio you are willing to lose if the stop loss is hit
// "Entry" -- enter the price at which you will enter the trade
// "Stop" -- enter the price at which your stop loss will be set
// "Target" -- enter the price at which your take profit will be set
// ----------------------------------------------------------------------------------------------------------------------------
// ------ Outputs -------------------------------------------------------------------------------------------------------------
// "Capital" -- displays the portfolio balance entered in settings
// "Risk" -- displays the % loss entered in settings and the corresponding amount of your portfolio
// "Entry" -- displays the entry price entered in settings
// "Stop" -- displays the stop loss price entered in settings
// "Stop %" -- displays the calculated percentage loss from the entry price
// "Target" -- displays the take profit price entered in settings
// "Target %" -- displays the calculated percentage profit from the entry price
// "Leverage" -- displays the calculated leverage based on your max loss and stop loss settings

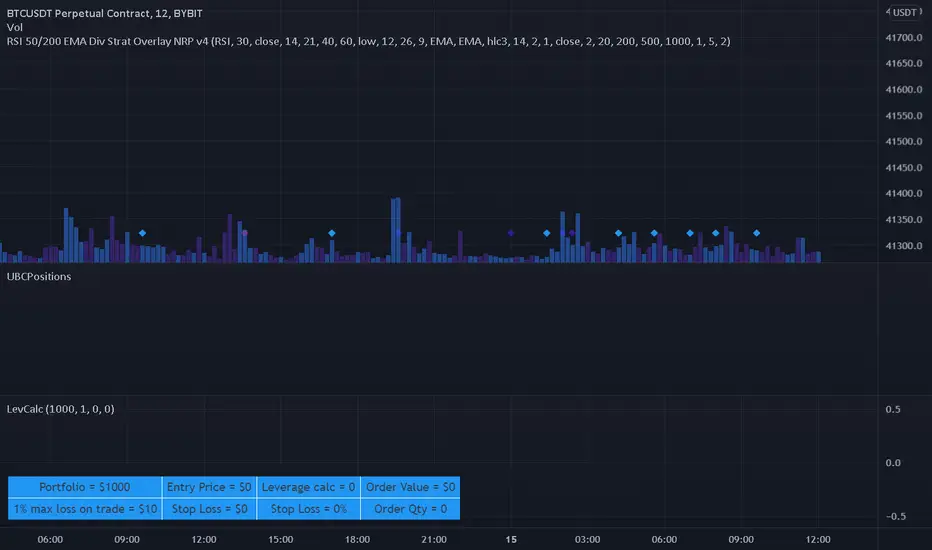
Leverage CalculatorThis script is intended to be used as a risk management calculator.
It will calculate the best leverage to use based on the maximum percentage of loss you are willing to incur on your trading portfolio.
Also calculates the order value and order qty based on your inputs.
Please note this calculator does not take into account any trading fees imposed by the exchange you are using.
*** Only risking 1% to 5% of your portfolio is considered good risk management ***
*** Not financial advice ***
------ Settings Inputs -----------------------------------------------------------------------------------------------------
"Portfolio Size" -- enter your portfolio balance
"% Willing to lose on this trade" -- enter the percent of your portfolio you are willing to lose if the stop loss is hit
"Entry Price" -- enter the price at which you will enter the trade
"Stop Loss Price" -- enter the price at which your stop loss will be set
----------------------------------------------------------------------------------------------------------------------------
------ Outputs -------------------------------------------------------------------------------------------------------------
"Portfolio" -- displays the portfolio balance entered in settings
"max loss on trade" -- displays the % loss entered in settings and the corresponding amount of your portfolio
"Entry Price" -- displays the entry price entered in settings
"Stop Loss Price" -- displays the stop loss price entered in settings
"Stop Loss %" -- displays the calculated percentage loss from the entry price
"Leverage calc" -- displays the calculated leverage based on your max loss and stop loss settings
"Order Value" -- displays the value of the order based on the calculated leverage
"Order Qty" -- displays the calculated order qty based on the calculated leverage
[TT$] Trade Tracker - By BlueJayBirdUSE:
- For visually tracking your trades in a floating pane (label).
- Most of the features are described in the image.
MAIN FEATURES:
- Better long-position and short-position tool wannabe.
- Visual data for tracking your trade position.
- Automatic setting of some common values in trades risk management.
- Switching from long-position to short-position can be done by just dragging the target or the entry point around.
EMOJIS:
- ⏰ Entry time: : Confirmed manually when the tool is added to the chart.
- 🎲 Entry: Confirmed manually when the tool is added to the chart.
- 🎯 Target: Confirmed manually when the tool is added to the chart.
- ⛔ Stop-Loss: Set automatically by the code.
- 🪓 Break Even: Set automatically by the code.
- 👻 Else: Set manually from the settings.
- 💲 Current: Automatic.
NOTES:
- Be aware of the "time zone" feature. Change it to the time you're currently using for your trades.
- QUOTE use is really optional. I'd rather not use it.
- The 👻 is just an extra feature. Do whatever you want with it (example: for pointing out a dangerous zone).
- 💱: "Fee" feature is not working, but it will. Sorry for that.

Trade Helper [Trading Nerd]Position Size Calculator / Lot Size Calculator
Disclaimer: I do my best to avoid wrong calculations and bugs. I provide this indicator without warranties of any kind. You bear all risks associated with the use of this indicator.
Inputs:
Market: Adds a name tag to the Table to keep track of the trades.
Entry Price: The entry Price of the Position.
Entry Time: The entry Time/Candle of the Position. If Stop Loss Type is 'ATR' or 'HH/LL' the Value for this is calculated by this Candle.
Stop Loss Type: Changes the Stop Loss Type.
Direction: Define if the trade direction is 'Long' or 'Short'. Has no effect on Stop Loss Type 'Custom'. For this you can just set the Stop Loss below/above the Entry Price .
ATR Multiplier: Multiplies the ATR Value by this number. Has only an effect on Stop Loss Type 'ATR'.
HH/LL Lookback Length: Lookback length for determine Highest High/Lowest Low value. Has only an effect on Stop Loss Type 'HH/LL'.
Custom SL Price: The Stop Loss Price if the Stop Loss Type is set to 'Custom'.
Risk Reward Ratio: The Risk is multiplied by this number to determine the Take Profit Price.
Balance: Balance Amount and Currency
Contract Size: The Position Size is divided by this number. E.G. in Forex one Lot is 100.000 Contracts. Change this Value depending on your Broker and Market.
Risk in %: Percent that is risked of the Balance for one Trade.

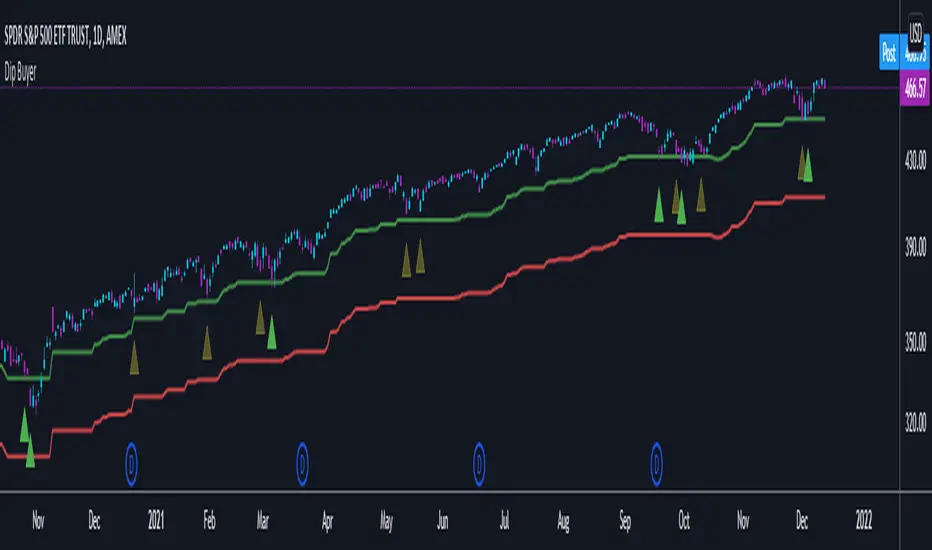
Dip BuyerThis was created for a friend and only has SPY in mind.
This indicator gives signals based on the previous All-Time High
Default values are
Watch Signal: 4% from ATH
Buy Signal: 5% from ATH
Stop Loss: 13% from ATH
All values are configurable
ATR Trailing Stop v5 One of my favorite stops is the ATR Trailing Stop-loss. With the implementation of PineScript v5, a code update was needed in order to use this stop/exit-strategy with newer strategy scripts. A timeframe selector that was not featured on earlier versions is also included. This new version can be plugged into PineScript v5 strategies, and also has a simpler/cleaner code that makes the code logic easier to follow than prior versions.
For those that are unfamiliar with the ATR Trailing Stop exit strategy; it is a trailing stop that takes into account the volatility of the underlying asset by trailing the price series using a multiple of the Average True Range (ATR). In practice I’ve found that this exit can be more effective than traditional trailing stops, depending on the volatility of the asset you are trading. More detailed information can be found at www.stockopedia.com
How do I use it? Add it to your chart as an indicator to visualize where the ATR stop would be with your settings. Or, copy and add it to your v5 strategy with the addition of a ta.crossunder(close, ATRTrailingStop) or ta.crossover(close, ATRTrailingStop) function. Special thanks and credit to HPotter who coded an earlier version of this in pine!

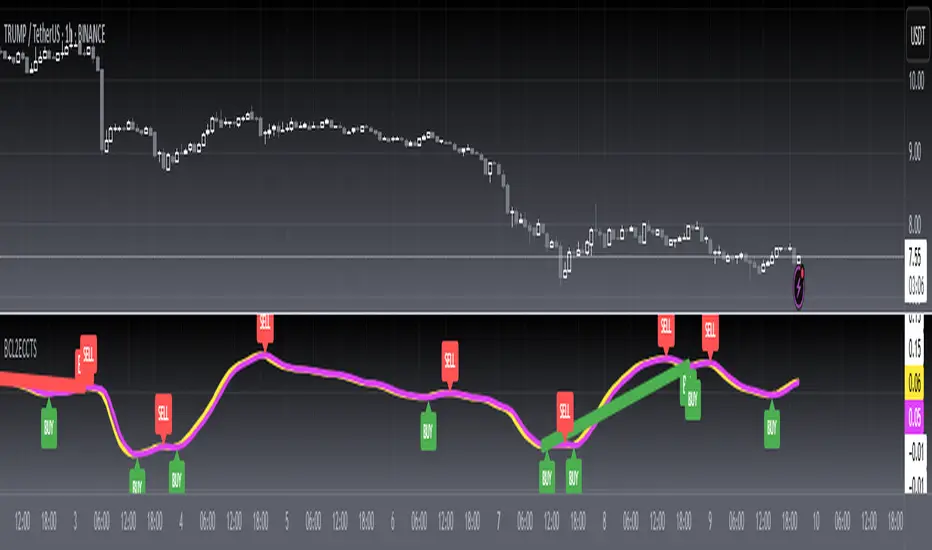
tunnel trading betaThe original author of the tunnel trading system: youtuber:Teacher Jin
This is a set of indicators system that trades completely based on the moving average. It belongs to the right trading. The idea is as follows:
(1) Basic trend (major trend)
When the short-term moving average is higher than the long-term moving average, it is an upward trend; otherwise, it is a downward trend.
The tentative short-term moving average is ema12, and the long-term moving average is ema169.
(2) The first type of buying point (or short point): trend establishment
Starting from the bar where the uptrend is established, the first outgoing bar is the first buying point. (Outgoing means that the closing price is higher than the opening price and higher than the high point of the previous bar)
Starting from the bar where the downtrend is established, the first bar to fall is the first shorting point. (Fall means that the closing price is lower than the opening price and lower than the low point of the previous bar)
(3) The second type of buying point (or short point): the buying point when pulling back (or the short point when rebounding)
The buying point at the time of pullback (callback) means that the general trend is up, but the small trend is down. You can buy when it is clear that the down trend is over.
Two concepts need to be defined here: "pullback (callback)" and "end of down trend". The definition of pullback is that when the general trend is rising, bar falls below the long-term moving average, and at this time the short-term moving average is still higher than the long-term moving average; The definition of the end of a down trend is that it is outgoing and ema12 is on the rise.
In the same way, we can know what is the "short point when rebounding":
The big trend is down, but the small trend is up. When it is clear that the rise is over, you can go short.
(4) Setting of Stop Loss and Take Profit
When going long:
Stop Loss Price: The low point of a bar before the buying point.
Stop-profit price: After the stop-loss price is determined, the profit-loss ratio is 3:1 to determine the stop-profit price. (The default value is 3, the user can modify it)
When shorting:
Stop Loss Price: The high point of a bar before the purchase point.
Stop-profit price: After the stop-loss price is determined, the profit-loss ratio is 3:1 to determine the stop-profit level. (The default value is 3, the user can modify it)
Chinese introduction:
隧道交易体系的原作者:油管金老师看盘室
这是一套完全根据均线进行交易的指标体系,属于右侧交易,思路如下:
(1) 基本趋势(大趋势)
短期均线高于长期均线时,是上涨趋势;反之,是下降趋势。
暂定短期均线为ema12,长期均线为ema169。
(2) 第一种买入点(或做空点):趋势确立
从上涨趋势确立的那根bar开始,第一个出头的bar,是第一买入点。(出头,是指收盘价高于开盘价,且高于前一根bar的高点)
从下降趋势确立的那根bar开始,第一个落尾的bar,是第一做空点。(落尾,是指收盘价低于开盘价,且低于前一根bar的低点)
(3) 第二种买入点(或做空点):拉回时的买入点(或反弹时的做空点)
拉回时(回调时)的买入点,是指大趋势是上涨,但小趋势是下跌,当明确下跌结束时,可以买入。
这里需要定义2个概念:“拉回(回调)”和“下跌结束”。拉回的定义是,大趋势是上涨时,bar跌破长期均线,此时短期均线仍高于长期均线;下跌结束的定义是,出头且ema12在上升。
同理可知什么是“反弹时的做空点”:
大趋势是下跌,但小趋势是上涨,当明确上涨结束时,可以做空。
(4) 止损位和止盈位的设置
做多时:
止损位:买入点前一根bar的低点。
止盈位:止损位确定后,按盈亏比3:1确定止盈位。(默认值为3,用户可以修改)
做空时:
止损位:买入点前一根bar的高点。
止盈位:止损位确定后,按盈亏比3:1确定止盈位。(默认值为3,用户可以修改)

[CP]Pivot Boss Candlestick Scanner - No Repainting This indicator is based on the high probability candlestick patterns described in the ’Secrets of a Pivot Boss’ book.
The indicator does not suffer from repainting.
I have kept this indicator open source, so that you can take this indicator and design a complete trading system around it.
Although the patterns have some statistical edge in the markets, blindly using them as Buy/Sell Indicators will certainly result in a heavy loss.
I like some of these setups more than others, and I have listed them in the order of my likeness.
The first one I like the most, the last one, I like the least.
The patterns are universal and work well in both intraday, daily and even larger timeframes.
Signals in the example charts are manually marked by,
Hammer - profitable short signal
Rocket - profitable long signal
X - unprofitable long or short signal
GENERAL USER INPUTS:
These settings exist as the indicator uses ‘Labels’ to mark the patterns and Pine Script limits a maximum of 500 labels on a chart.
If you want to go back in the past and check how the indicator was doing, set the Start and End dates both and check the ’Use the date range above to mark the Candlestick Setups?’ option.
EXTREME REVERSAL SETUP:
This is by far my favorite setup in the lot. Classic Mean Reversion setup.
The logic, as explained in the book, goes like this,
1. The first bar of the pattern is about two times larger than the average size of the candles in the lookback period.
2. The body of the first bar of the pattern should encompass more than 50 percent of the bar’s total range, but usually not more than 85 percent.
3. The second bar of the pattern opposes the first.
The setup works extremely well in high beta stocks like Vedanta VEDL.
Feel free to play with the settings in order to better align this pattern with your favorite stock.
Check out the examples below,
No indicator is perfect, failed patterns are marked with an X.
OUTSIDE REVERSAL SETUP:
My second favorite setup, it is quite good at catching intraday trends.
Here’s the logic,
1. The engulfing bar of a bullish outside reversal setup has a low that is below the prior bar’s low and a close that is above the prior bar’s high. Reverse the conditions for bearish outside reversal.
2. The engulfing bar is usually 5 to 25 percent larger than the size of the average bar in the lookback period.
Settings for this pattern simply reflect these conditions. Feel free to modify them as you wish.
The pattern is pretty powerful and will sometimes help you catch literally all the highs and lows of the market, as shown in the examples of Vedanta VEDL and RELIANCE stocks below.
As usual, this pattern is not PERFECT either.
DOJI REVERSAL SETUP:
Doji candles signify market indecision and this pattern tries to profit off these market conditions.
Logic:
1. The open and close price of the doji should fall within 10 percent of each other, as measured by the total range of the candlestick.
2. For a bullish doji, the high of the doji candlestick should be below the ten-period simple moving average. Vice-versa for bearish.
3. For a bullish doji setup, one of the two bars following the doji must close above the high of the doji. Vice-versa for bearish.
Feel free to modify the settings and optimize according to the stock you are trading.
Don't optimize too much :)
This pattern works brilliantly well on larger intraday timeframes, like 15m/30m/60m.
This pattern also has a higher propensity to give false indications than the two described above.
Doji reversal typically helps to catch larger trend reversals. Check out the examples below from RELIANCE and NIFTY charts,
Note that the RELIANCE chart below is the same as shown for the Outside Reversal Setup above, notice the confluence of Outside
Reversal and Doji Reversal on the 31st August.
Confluence of patterns usually increases the probability of success.
RELIANCE 15m Chart - Pattern can catch nice trends on higher timeframes
NIFTY 15m Chart
WICK REVERSAL SETUP:
This pattern tries to capture candlesticks with large wick sizes, as they often indicate trend reversal when coupled with significant support and resistance levels.
Logic:
1. The body is used to determine the size of the reversal wick. A wick that is between 2.5 to 3.5 times larger than the size of the body is ideal.
2. For a bullish reversal wick to exist, the close of the bar should fall within the top 35 percent of the overall range of the candle.
3. For a bearish reversal wick to exist, the close of the bar should fall within the bottom 35 percent of the overall range of the candle.
This pattern must always be coupled with important support resistance levels, else there will be a lot of false signals.
The chart below is the same NIFTY chart as above with the Wick Reversal candles marked as well.
You can see that there are a lot of false signals, but the price also indicates ’pausing’ at important levels by printing a wick reversal setup.
You can use this information to your advantage when riding a trend.
FINAL WORDS:
Settings for various patterns simply reflect the logic described.
You will probably need to tweak and optimize the pattern settings for the stock that you are trading.
Higher Beta/Higher Volatility stocks are a great choice for these patterns.
Using these patterns at critical support and resistance levels will result in dramatically high accuracy.
Be creative and try to develop a proper system around this indicator, with rules for position sizing, stop loss etc.
You do not have to trade all the patterns. Even trading just one pattern with a proper system is good enough.
DO NOT USE THIS INDICATOR AS A BUY/SELL SYSTEM, YOU WILL LOSE MONEY.
Feel free to drop any feedback in the comments section below, or if you have any unique candlestick patterns that you would like me to code.

CPR Strategy - (Call and Put Option Selling)The strategy is designed using CPR and Donchian Channels.
STRATEGY RULES:
We need to wait for "Sell Call" or "Sell Put" arrow on the chart.
Sell call or put on the next candle.
Sell call strike above CPR resistance and candle close above it will be stop loss.
Similarly, sell put strike below CPR support and candle close below it will be stop loss.
This strategy is purely based on theta decay principle.
Hence, always use this strategy on weekly option.
Also, never trade on Monday or Friday to avoid volatility.
Hope you enjoy this strategy and become a professional trader.
Enjoy! :-)
Drop your message below if you have any doubts. Thanks.

ATR BandsIt has happened to everybody. You enter the market, the position gets a stop loss, then later the market goes in the direction you originally planned. Worse yet - you enter a position, the market goes in your favor, gets near the target, and then it reverses and you get stopped.
We brazilians call this a "violinado", or getting violinated. It happens either because:
1. You put the stop loss too close, or the target too far
2. You entered in the right direction, but at a wrong time
While the second point cannot be programmly adressed, the first can. One popular way of setting a stop loss is by using the average of the true range, it even has a built-in indicator in TV. The problem with it is that you can still get violinated, since as the trend develops, the stop loss only goes up, never down. So if you enter at the wrong time, one slip can still take you out of the market.
Since I got sick of losing money using a conventional stop loss, I made these ATR bands. When you add this indicator to your graph, 6 lines are going to show up, 3 above the price, 3 below it. These lines are calculated from the ATR of the last 20 periods (can be configurated). The upper lines are the high of the last candle + the ATR * the multiplicator factor, the lower lines are the low - ATR * multiplicator factor. There are three multiplicator factors: 1.0, 1.618 and 2.0, and you change them to be whatever you want.
The logic behind it is that theses bands represents the region in which the market is more likely to stay. So if you enter the market at 50.00, you can't expect it to reach 500.00 in the next hour if the ATR is 5.00. And if you set the stop loss at 49.99, it is very likely that the market is going to stop you. By using the ATR bands, you can get a more reasonable price range, so you would set the stop loss at 45.00 and the take profit level at 60.00.
There are two types os ATR you can use: the regular, calculated with RMA, and another using a custom WMA, which puts greater emphasis on large amplitudes. By default, the average uses the past 20 true ranges. You can also choose to use either the closing price or the extremes of the candle as a basis.
Another thing I've added is the violation statistics, which shows the percentages of the times that a band was violated in the next 5 candles (can be configurated). With this, you can get a broader view on the probability of the bands actually being reached.
You may have notice that the bands are lagged by 1 period. I did this so that there is no way you can use future data. You can disable it or increase it, but I recommend just letting it be 1. These bands are the range in which the price is most likely to stay in, if you change the lag you are essentially breaking it's whole purpose.

[blackcat] L2 Ehlers Cyber Cycle Trading StrategyLevel: 2
Background
John F. Ehlers introuced Cyber Cycle Trading Strategy in his "Cybernetic Analysis for Stocks and Futures" chapter 4 on 2004.
Function
With cyber cycle alone, the Trigger lags the Cycle by one bar, so that their crossing introduces at least another bar of lag. Finally, Dr Ehler concluded that we can’t execute the trade until the bar after the signal is observed. In total, that means our trade execution will be at least four bars late. If we are working with an eight-bar cycle, that means the signal will be exactly wrong. We could do better to buy when the signal says sell, and vice versa.
The difficulties arising from the lag suggest a way to build an automatic trading strategy. Suppose we choose to use the trading signal in the opposite direction of the signal. That will work if we can introduce lag so the correct signal will be given in the more general case, not just the case of an eight-bar cycle. Therefore, the Cyber Cycle trading strategy was introduced by Dr. Ehlers. It starts exactly the same as the Cyber Cycle Indicator. Dr. Ehlers then introduce the variable Signal, which is an exponential moving average of the Cycle variable. The exponential moving average generates the desired lag in the trading signal. The relationship between the alpha of an exponential moving average and lag is alpha2 = 1/ (Lag+1). This relationship is used to create the variable alpha2 in the code and the variable Signal using the exponential moving average. The trading signals using the variable Signal crossing itself delayed by one bar are exactly the opposite of the trading signals I would have used if there were no delay. But, since the variable Signal is delayed such that the net delay is less than half a cycle, the trading signals are correct to catch the next cyclic reversal. The idea of betting against the correct direction by waiting for the next cycle reversal can be pretty scary because that reversal may “never” happen because the market takes off in a trend. For this reason Dr. Ehlers included two lines of code that are escape mechanisms if we were wrong in our entry signal. These last two Signal lines of code reverse the trading position if we have been in the trade for more than eight bars and the trade has an open position loss.
Key Signal
Cycle ---> Cyber Cycle fast line
Cycle (2) ---> Cyber Cycle slow line
Signal ---> Trading signal fast line
Signal(1) ---> Trading signal slow line
Pros and Cons
100% John F. Ehlers definition translation of original work, even variable names are the same. This help readers who would like to use pine to read his book. If you had read his works, then you will be quite familiar with my code style.
Remarks
The 25th script for Blackcat1402 John F. Ehlers Week publication.
Readme
In real life, I am a prolific inventor. I have successfully applied for more than 60 international and regional patents in the past 12 years. But in the past two years or so, I have tried to transfer my creativity to the development of trading strategies. Tradingview is the ideal platform for me. I am selecting and contributing some of the hundreds of scripts to publish in Tradingview community. Welcome everyone to interact with me to discuss these interesting pine scripts.
The scripts posted are categorized into 5 levels according to my efforts or manhours put into these works.
Level 1 : interesting script snippets or distinctive improvement from classic indicators or strategy. Level 1 scripts can usually appear in more complex indicators as a function module or element.
Level 2 : composite indicator/strategy. By selecting or combining several independent or dependent functions or sub indicators in proper way, the composite script exhibits a resonance phenomenon which can filter out noise or fake trading signal to enhance trading confidence level.
Level 3 : comprehensive indicator/strategy. They are simple trading systems based on my strategies. They are commonly containing several or all of entry signal, close signal, stop loss, take profit, re-entry, risk management, and position sizing techniques. Even some interesting fundamental and mass psychological aspects are incorporated.
Level 4 : script snippets or functions that do not disclose source code. Interesting element that can reveal market laws and work as raw material for indicators and strategies. If you find Level 1~2 scripts are helpful, Level 4 is a private version that took me far more efforts to develop.
Level 5 : indicator/strategy that do not disclose source code. private version of Level 3 script with my accumulated script processing skills or a large number of custom functions. I had a private function library built in past two years. Level 5 scripts use many of them to achieve private trading strategy.
Position CalculatorThis script calculates how much cryptos or dollars you have to bet with 4 variables : Risk Loss , Leverage, Entry and Stop Loss.
When you want to open a position, just complete the parameters and the script will tell you how much you have to bet in dollars or cryptos units, depending the way you're trading.
Note : don't foreget that you have to pay fees on exchanges whose are not included here, specially with high leverage trades.

Leverage and %Stop Loss Risk SimDrawdown Simulator.
Will simulate a series of percent based stop losses being triggered in a row if you risked x% of capital per trade.
Also simulates what the capital outcome would be if you were in a leveraged position.
Default settings simulate the use of $3000 starting capital balance , 1% Risk per trade and 5 Losing trades in a row with no leverage (1x).
This will not account of commission fees.

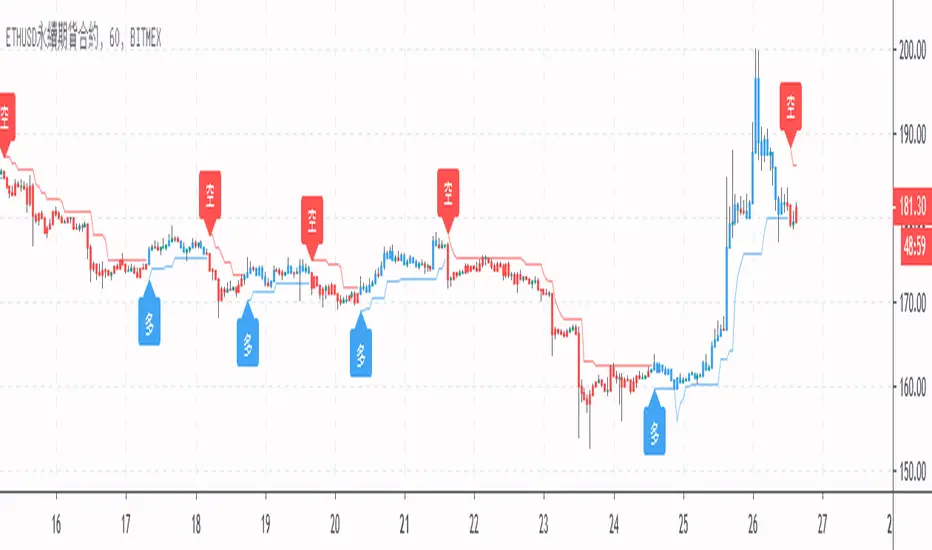
[LunaOwl] 超級趨勢 (SuperTrend)SuperTrend indicator was developed by Olivier Seban. it shows trend direction. In addition,it provides buy/sell signal. while using super trend indicator, it is better to put stop loss. In fact, you can use the line for stop loss. In addition, you can also trail it as the price move in either direction. wish you a happy trade life.
超級趨勢是奧利維爾.塞班所開發。它可以顯示趨勢和買賣訊號,使用超級趨勢請設置止損單。其實你可以用移動止損線設置。也能價格波動的時候進行追蹤。祝大家交易愉快。
The purpose of publishing Chinese Scripts is to make Pine close to more Chinese user.
發布中文腳本的目的,是希望可以讓 Pine 親近更多中文圈的使用者。
Trade Manager (Open Source Version)Hello my young padawans looking for the FORCE to get richer on your next trade
I got pinged at least three times today asking where the hell is the indicator of the day. You asked, I delivered :)
Here's your free open-source Trade Manager Version. My associates might kill me for sharing that one... anyway this is a real GIFT.
I won't share such quality indicators too often for FREE so hope you'll appreciate its value. It can really help with your day to day trading (on top of making your charts looking more awesome)
This is an even better version compared to my previous Trade Manager Trade-Manager . It's basically a standalone version, meaning you'll have to update with 2 lines your own indicator and follow my educational post from yesterday (pasted it below also) to learn how to do it
Please read this educational post I published for you before proceeding further : How-to-connect-your-indicator-with-the-Trade-Manager
From here you normally connected the data source of your own indicator to the Trade Manager. If not, here's a reminder of the article mentionned above
Step 1 - Update your indicator
For the screenshot you see above, I used this indicator : Two-MM-Cross-MACD/ . "But sir are you really advertising your other indicators here ??" ... hmmm.... YES but I gave them for free so ... stop complaining my friend :)
Somewhere in the code you'll have a LONG and a SHORT condition. If not, please go back to study trading for noobs (I'm kidding !!!)
So it should look to something similar
nUP = ma_crossover and macd_crossover
nDN = ma_crossunder and macd_crossunder
What you will need to add at the very end of your script is a Signal plot that will be captured by the Trade Manager. This will give us :
// Signal plot to be used as external
// if crossover, sends 1, otherwise sends -1
Signal = (nUP) ? 1 : (nDN) ? -1 : na
plot(Signal, title="Signal")
The Trade Manager engines expects to receive 1 for a bullishg signal and -1 for bearish .
Step 2 - Add the Trade Manager to your chart and select the right Data Source
I feel the questions coming so I prefer to anticipate :) When you add the Trade Manager to your chart, nothing will be displayed. THIS IS NORMAL because you'll have to select the Data Source to be "Signal"
Remember our Signal variable from the Two MM Cross from before, now we'll capture it and.....drumb rolll...... that's from that moment that your life became even more AWESOME
The Engine will capture the last signal from the MM cross or any indicator actually and will update the Stop Loss, Take Profit levels based on the parameters you set on the Trade Manager
It should work with any indicator as long as you're providing a plot Signal with values 1 and -1 . In any case, you can change the Trade Manager you'll find a better logic for your trading
Now let's cover the different parameters of the tool
It should be straightforward but better to explain everything here
+Label lines : if unchecked, no SL/TPs/... will be displayed
+Show Stop Loss Signal : Will display the stop loss label. You have the choice between three options :
By default, the Stop Loss is set to NONE. You'll have to select a different option to enable the Stop Loss for real
++Percentage : Will set the SL at a percent distance from the price
++Fixed : SL fixed at a static price
++Trailing % : Trailing stop loss based on percentage level
The following is a KEY feature and I got asked for it many times those past two days. I got annoyed of getting the same request so I just did it
++Trailing TP: Will move the Stop Loss if the take profit levels are hit
Example: if TP1 is hit, SL will be moved to breakeven. If TP2 is hit, SL will be moved from TP1 to TP2
+Take Profit 1,2,3 : Visually define the three Take Profit levels. Those are percentage levels .
Meaning if you set TP1 = 2, it will set the TP1 level 2% away from the entry signal
Please note that once a Take profit level is reached, it will magically disappear. This is to be expected
I'll share in the future a way more complete version with invalidation, stop loss/take profits based on indicator, take profit based on supports/resistances, ...
I believe is such a great tool because can be connected to any indicator. I confess that I tried it only with a few... if you find any that's not working with the Trade manager, please let me know and I'll have a look
PS
I want to give a HUUUUUUUGE shoutout to the PineCoders community who helped me finishing it
Wishing you all the best and a pleasant experience with my work
David

Sinyal GhoibLeading Signal!!!
Long entry while long signal appears.
Short entry while short signal appears.
This signal only effective on BitMex | 5m | XBTUSD.
Take profit: 0,6% from entry price
Stop loss: 0,6% from entry price
Leverage: 10x - 50x
For donation
BTC: 3E7rUPX7upS8iTj42JdLt7keJVbJLfvMoH
ETH: 0x094ed88e4c5a9b225e936586cbc2d61f4a027f68
BitMex Referral: P81ZCO
Thank you & happy trading!

Advanced Larry Williams 9.2- By EduHit rate greater than Setup 9.1
However, the stop of this setup becomes more expensive in certain situations.
PURCHASE SIGN
1 - Paper comes in a bullish trend in the operational term to be operated.
2 - Exponential moving average of 9 upward periods.
3 - Wait for a candle to make the largest closing (candle reference).
4 - If the next candle CLOSES below the minimum of the candle reference the setup is armed.
5 - Mark the candle maxim that closed below the reference. It's the trigger!
6 - If the next candle exceeds this maximum by 1 cent the trade is triggered. Put the stop loss at the low of the candle that closed below (0.01 to 0.10 below)
7 - If the next candle does not fire, let's lower the trigger to the lower maximums, SINCE the mm9exp does not turn down.
8 - It exceeded the maximum we will have the entrance.
9 - Original stop-loss in the minimum of the candle we set the maximum activated.
SIGN OF SALE
1 - Paper comes in a downtrend in the operating period to be operated.
2 - Exponential moving average of 9 periods descending.
3 - Wait for a candle that makes the lowest closing (candle reference).
4 - If the next candle CLOSE above the maximum of the reference candle the setup is armed.
5 - Bookmark the candle that closed above the reference. It's the trigger!
6 - If the next candle breaks this minimum, the trade is triggered.
7 - Place the stop-loss at the maximum of the candle that closed up.
8 - If the next candle does not trigger, we will raise the trigger to the highest minimums SINCE the exponential moving average of 9 periods does not turn upwards.
9 - It broke the minimum we will have the entrance.
10 - Stop-loss original in the maximum of the candle that we set the minimum activated.
*********************************************************************************************************************************************************
Índice de acerto Superior ao Setup 9.1
Porém o stop deste setup acaba se tornando mais caro em determinadas situações.
SINAL DE COMPRA
1 - Papel vem em tendência de alta no prazo operacional a ser operado.
2 - Média móvel exponencial de 9 períodos ascendente.
3 - Aguardar um candle que faça o maior fechamento (candle referência).
4 - Se o próximo candle FECHAR abaixo da mínima do candle referência o setup está armado.
5 - Marcar a máxima do candle que fechou abaixo do referência. É o gatilho!
6 - Se o próximo candle superar essa máxima em 1 centavo o trade é acionado. Colocar o stop-loss na mínima do candle que fechou abaixo (0,01 a 0,10 abaixo)
7 - Se o próximo candle não acionar, vamos abaixando o gatilho para as máximas menores DESDE QUE a mm9exp não vire para baixo.
8 - Superou a máxima teremos a entrada.
9 - Stop-loss original na mínima do candle que marcamos a máxima ativada.
SINAL DE VENDA
1 - Papel vem em tendência de baixa no prazo operacional a ser operado.
2 - Média móvel exponencial de 9 períodos descendente.
3 - Aguardar um candle que faça o menor fechamento (candle referência).
4 - Se o próximo candle FECHAR acima da máxima do candle referência o setup está armado.
5 - Marcar a mínima do candle que fechou acima do referência. É o gatilho!
6 - Se o próximo candle romper essa mínima o trade é acionado.
7 - Colocar o stop-loss na máxima do candle que fechou acima.
8 - Se o próximo candle não acionar, vamos levantando o gatilho para as mínimas maiores DESDE QUE a média móvel exponencial de 9 períodos não vire para cima.
9 - Rompeu a mínima teremos a entrada.
10 - Stop-loss original na máxima do candle que marcamos a mínima ativada.

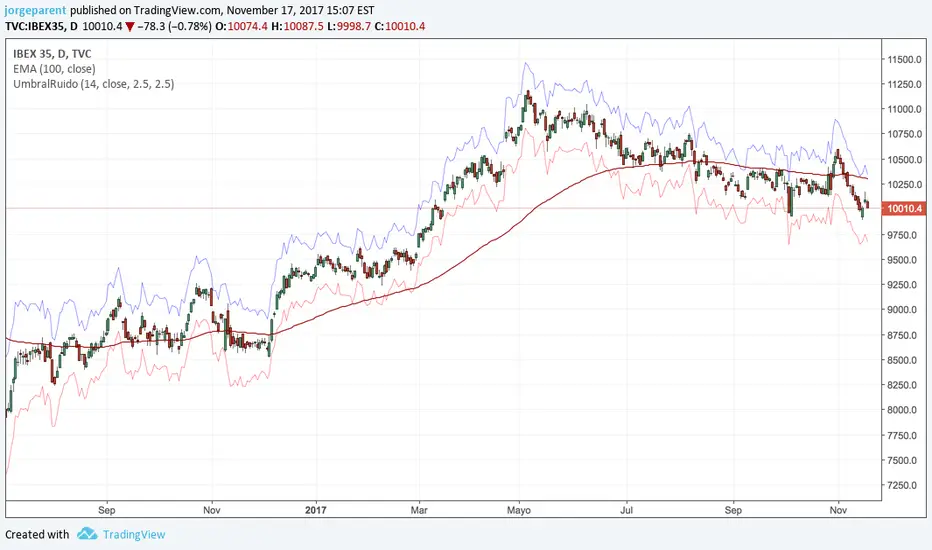
Umbral de RuidoSe trata de usar el ATR para crear un umbral de ruido alrededor del precio. La rotura de ese umbral nos dara señales de entrada y salida. El ATR viene multiplicado por una constante que suele ser de entre 1.5 y 3.0. Se recomiendan valores cercanos a 3 para el stoploss y 1.5 o 2.0 para la entrada.
Esta estrategia esta recomentada para activos que tengan una volatilidad controlada. Da buenos resultados en los indices, pero por lo que yo he probado no es buena para el EURUSD, me gustaria probarla tambien en acciones. Pero de momento la tengo funcionando en DAX con buenos resultados.
Procedimiento para largos:
Usamos la banda superior para marcar la entrada. Siempre que la banda marque un valor menor colocaremos una orden pendiente ahi. Con stoploss en su banda inferior. Si el valor de la banda aumenta, no actualizaremos la orden. Por lo tanto buscamos el menor valor posible del umbral de ruido.
Cuando el precio atraviese ese valor empezaremos a actualizar el stoploss siempre a un valor superior. Es decir si el umbral nos da un valor de stoploss menor nosotros no lo bajaremos.
La salida se produce por stop loss.
Procedimiento para cortos:
Usamos la banda inferior para marcar la entrada. Siempre que la banda marque un valor mayor colocaremos una orden pendiente ahi. Con stoploss en su banda superior. Si el valor de la banda disminuye, no actualizaremos la orden. Por lo tanto buscamos el mayor valor posible del umbral de ruido.
Cuando el precio atraviese ese valor empezaremos a actualizar el stoploss siempre a un valor inferior. Es decir si el umbral nos da un valor de stoploss menor nosotros no lo subiremos.
La salida se produce por stop loss.
Funciona mejor combinado con una media lenta de 100 o 200 para filtrar si ir a largos o cortos.
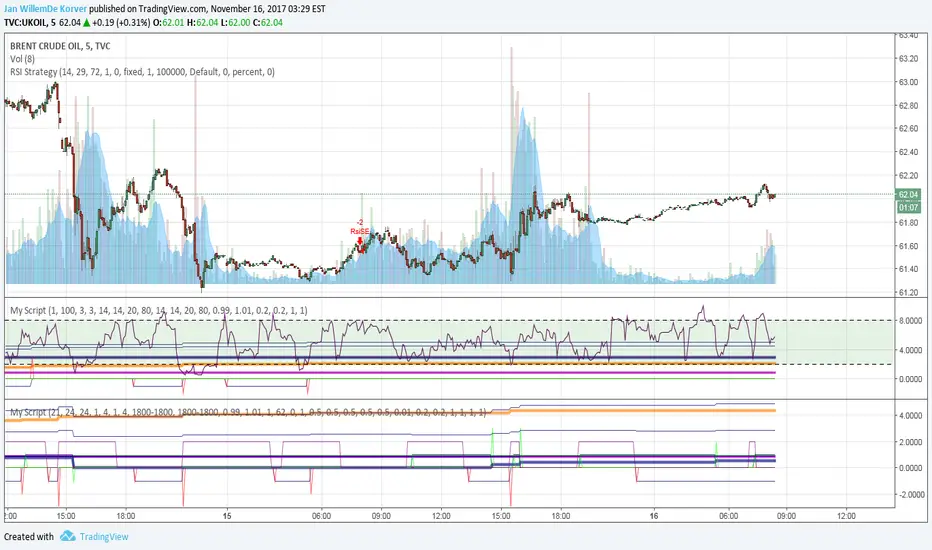
Price X volume relative trade algoThe script multiplies the price time the volumes. Than relatively calculates whether the stock or product is oversold or overbought. One can subsequently set when to go short or when to go long. The way it works is that there is a small 1 for a long and a -1 for a short. If it is 1 and the followed by a 2 one has a profit. If a -1 is followed by a -2 you traded a short with a profit.
If however a 1 is followed by a -1 you lost a long. Vice verse for the short: if the -1 is followed by a 1 you have a loss.
Once can also set a target and arrange the stop loss they way you want. A little bit complicated with many parameters to set in the setting window. But for the one who has the patient to understand the script I believe it can be very useful.
Jan de Korver:
Search the secret www.behance.net