SSL Channel BFSSL Channel Close is a great all-rounder based on 2 Simple Moving Averages, one of recent Highs, one of recent Lows.
The calculation prints a channel on the chart consisting of 2 lines.
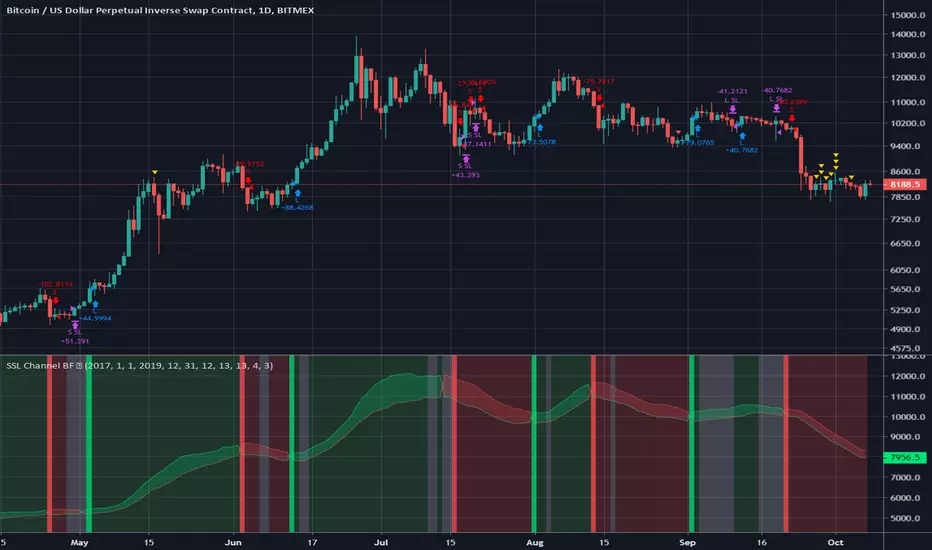
This strategy gives a Long signal when price closes above the top of these 2 lines and a Short signal when it closes below the bottom.
Trading in choppy sideways markets can compound losses so we avoid that here by using recent ATR to determine relative volatility and refrain from trading when the background is White.
We use a basic 3% stop loss.
Charted on XBT/USD Bitmex Daily chart.
INSTRUCTIONS
Green = long
Red = short
White Background= No trade
The way I have set this strategy up is that if we get stopped out but we are still in a green or red background, we re-enter. Closing the trade only occurs on an opposing signal or if we get stopped out.
Strategi Pine Script®