SuperTrendSuperTrend is one of the most common ATR based trailing stop indicators.
In this version you can change the ATR calculation method from the settings. Default method is RMA, when the alternative method is SMA.
The indicator is easy to use and gives an accurate reading about an ongoing trend. It is constructed with two parameters, namely period and multiplier. The default values used while constructing a superindicator are 10 for average true range or trading period and three for its multiplier.
The average true range (ATR) plays an important role in 'Supertrend' as the indicator uses ATR to calculate its value. The ATR indicator signals the degree of price volatility.
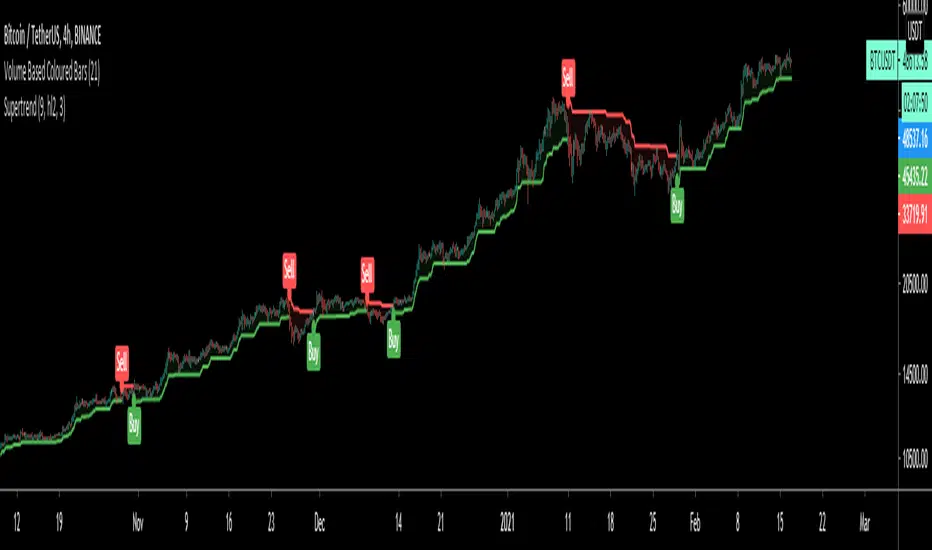
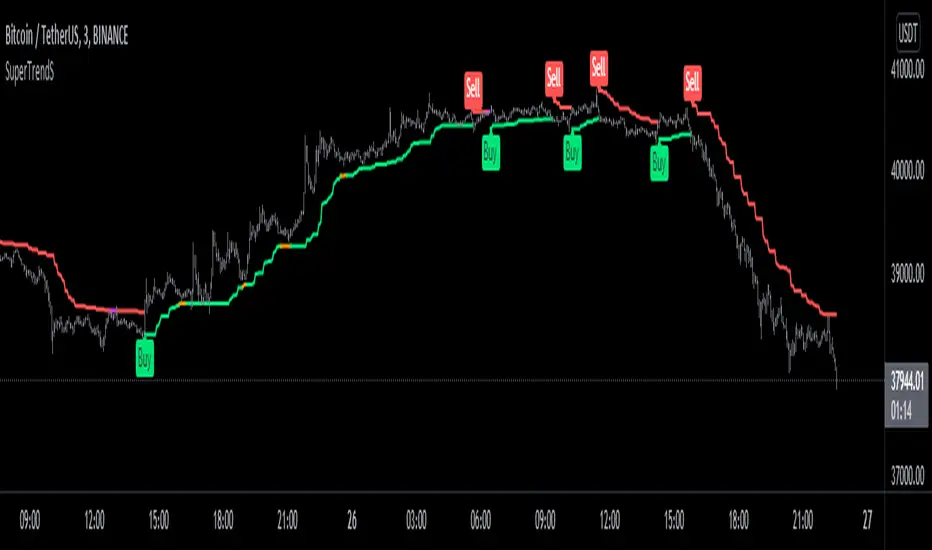
The buy and sell signals are generated when the indicator starts plotting either on top of the closing price or below the closing price. A buy signal is generated when the ‘Supertrend’ closes above the price and a sell signal is generated when it closes below the closing price.
It also suggests that the trend is shifting from descending mode to ascending mode. Contrary to this, when a ‘Supertrend’ closes above the price, it generates a sell signal as the colour of the indicator changes into red.
A ‘Supertrend’ indicator can be used on equities, futures or forex, or even crypto markets and also on daily, weekly and hourly charts as well, but generally, it fails in a sideways-moving market.
I had converted Supertrend indicator code for various platforms like Metastock in 2017, but in this TradingView version special credit goes to everget - Alex Orekhov which gave a great inspiration to look my indicators better with highlights, signals and alarms. Thank you Alex.
Cari dalam skrip untuk "supertrend"
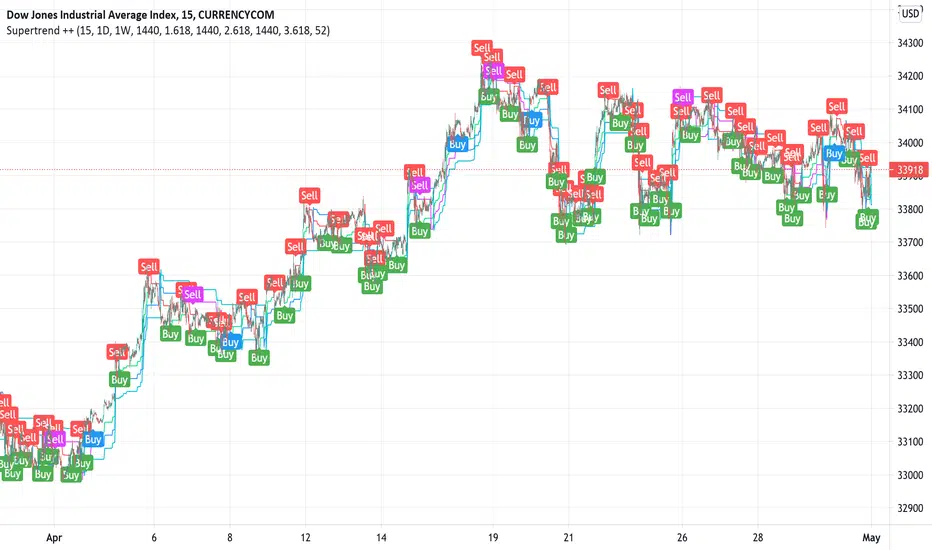
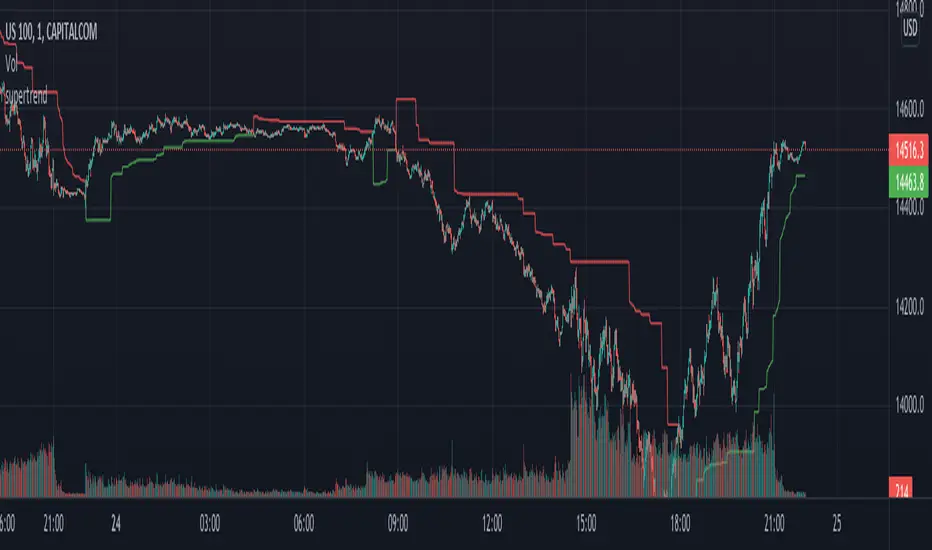
Supertrend ++Supertrend ++ is an HTF (HigherTimeFrame) Supertrend with an optional Volume Filter with adjustable value in the Settings.
Signals are represented by Green Labels (Buy) to indicate a Long Entry or Red Labels (Sell) to indicate a Short Entry.
Note that the script does not Repaint and that you have the option of placing a single Alert for the two available Alerts.
Always use the option "Once per bar" and not "Once per bar close" when placing an Alert of individual type.
If you have any suggestions or need help, please let us know in the comment area.
Good Trade everyone and remember, Risk Management remains the most important.
Supertrend x4 w/ Cloud FillSuperTrend is one of the most common ATR based trailing stop indicators.
The average true range (ATR) plays an important role in 'Supertrend' as the indicator uses ATR to calculate its value. The ATR indicator signals the degree of price volatility. In this version you can change the ATR calculation method from the settings. Default method is RMA, when the alternative method is SMA.
The indicator is easy to use and gives an accurate reading about an ongoing trend. It is constructed with two parameters, namely period and multiplier.
The implementation of 4 supertrends and cloud fills allows for a better overall picture of the higher and lower timeframe trend one is trading a particular security in.
The default values used while constructing a supertrend indicator is 10 for average true range or trading period.
The key aspect what differentiates this indicator is the Multiplier. The multiplier is based on how much bigger of a range you want to capture. In our case by default, it starts with 2.636 and 3.336 for Set 1 & Set 2 respectively giving a narrow band range or Short Term (ST) timeframe visual. On the other hand, the multipliers for Set 3 & Set 4 goes up to 9.736 and 8.536 for the multiplier respectively giving a large band range or Long Term (LT) timeframe visual.
A ‘Supertrend’ indicator can be used on equities, futures or forex, or even crypto markets and also on minutes, hourly, daily, and weekly charts as well, but generally, it fails in a sideways-moving market. That's why with this implementation it enables one to stay out of the market if they choose to do so when the market is ranging.
This Supertrend indicator is modelled around trends and areas of interest versus buy and sell signals. Therefore, to better understand this indicator, one must calibrate it to one's need first, which means day trader (shorter timeframe) vs swing trader (longer time frame), and then understand how it can be utilized to improve your entries, exits, risk and position sizing.
Example:
In this chart shown above using SPX500:OANDA, 15R Time Frame, we can see that there is at any give time 1 to 4 clouds/bands of Supertrends. These four are called Set 1, Set 2, Set 3 and Set 4 in the indicator. Set's 1 & 2 are considered short term, whereas Set's 3 & 4 are considered long term. The term short and long are subjective based on one's trading style. For instance, if a person is a 1min chart trader, which would be short term, to get an idea of the trend you would have to look at a longer time frame like a 5min for instance. Similarly, in this cases the timeframes = Multiplier value that you set.
Optional Ideas:
+ Apply some basic EMA/SMA indicator script of your choice for easier understanding of the trend or to allow smooth transition to using this indicator.
+ Split the chart into two vertical layouts and applying this same script coupled with xdecow's 2 WWV candle painting script on both the layouts. Now you can use the left side of the chart to show all bearish move candles only (make the bullish candles transparent) and do the opposite for the right side of the chart. This way you enhance focus to just stick to one side at a given time.
Credits:
This indicator is a derivative of the fine work done originally by KivancOzbilgic
Here is the source to his original indicator: ).
Disclaimer:
This indicator and tip is for educational and entertainment purposes only. This not does constitute to financial advice of any sort.

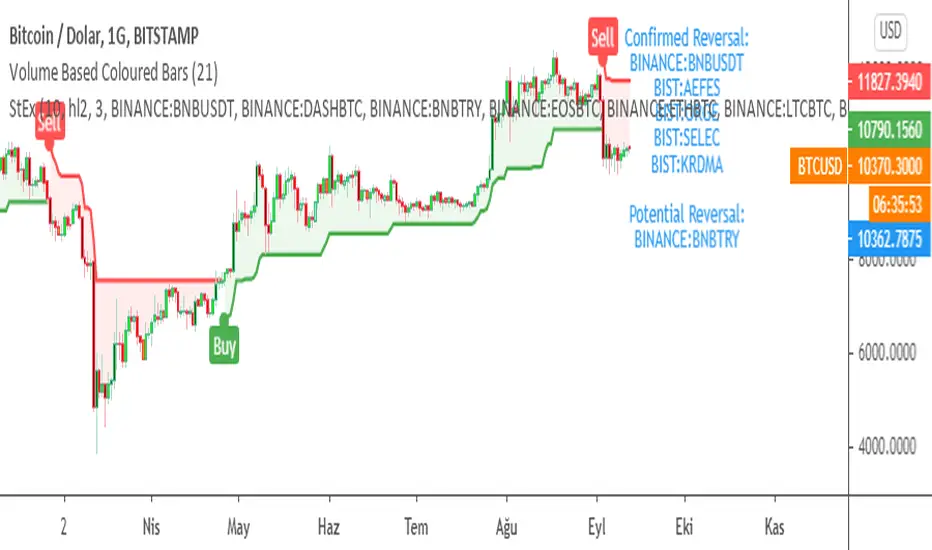
SuperTrend EXPLORER / SCREENERSUPERTREND EXPLORER / SCREENER screens the BUY and SELL signals (trend reversals) for 38 user defined different tickers in Tradingview charts.
Simply input the short name of the ticker in Tradingview that you want to screen.
Script is derived from zzzcrypto123 's work. Thanks for the permission letting me to use his logic.
Terminology explanation:
Confirmed Reversal: Supertrend reversal that happened in the last bar and cannot be repainted.
Potential Reversal: Supertrend reversal that might happen in the current bar but can also not happen depending upon the timeframe closing price.
Screener has also got a built in SuperTrend indicator which users can confirm the reversals on graphs.
Screener explores the 38 tickers in current graph's time frame and also in desired parameters of the SuperTrend indicator.
SUPERTREND INDICATOR:
STRATEGY version of SuperTrend Indicator:
SuperTrend is one of the most common ATR based trailing stop indicators.
In this version you can change the ATR calculation method from the settings. Default method is RMA, when the alternative method is SMA .
The indicator is easy to use and gives an accurate reading about an ongoing trend. It is constructed with two parameters, namely period and multiplier. The default values used while constructing a superindicator are 10 for average true range or trading period and three for its multiplier.
The average true range (ATR) plays an important role in 'Supertrend' as the indicator uses ATR to calculate its value. The ATR indicator signals the degree of price volatility .
The buy and sell signals are generated when the indicator starts plotting either on top of the closing price or below the closing price. A buy signal is generated when the ‘Supertrend’ closes above the price and a sell signal is generated when it closes below the closing price.
It also suggests that the trend is shifting from descending mode to ascending mode. Contrary to this, when a ‘Supertrend’ closes above the price, it generates a sell signal as the colour of the indicator changes into red.
A ‘Supertrend’ indicator can be used on equities, futures or forex, or even crypto markets and also on daily, weekly and hourly charts as well, but generally, it fails in a sideways-moving market.
Source function added to use the indicator as the ATR Trailing Stop indicator.
Just change source type hl2 to close.
different variations might be useful.
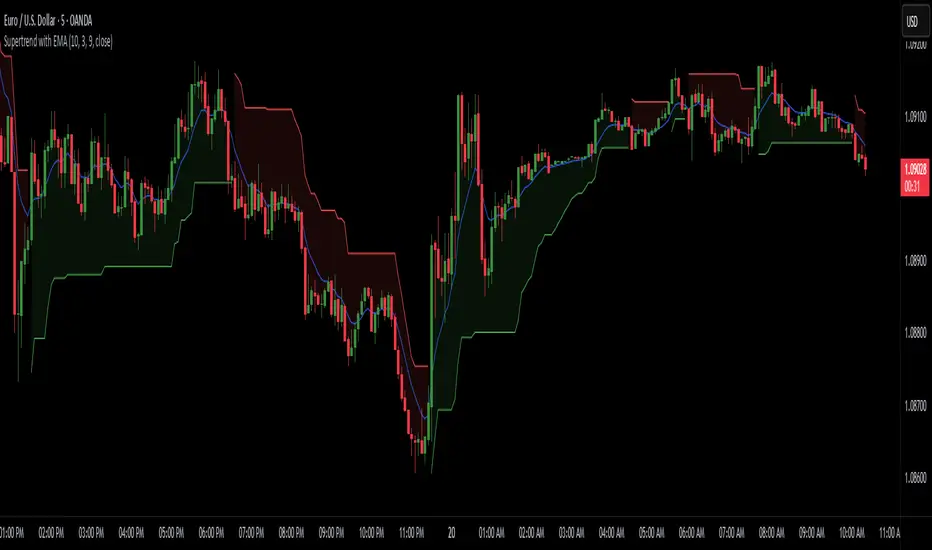
Supertrend with EMASupertrend + EMA Indicator
This custom indicator combines the popular Supertrend and Exponential Moving Average (EMA) indicators to enhance trend analysis and signal accuracy. The Supertrend tracks price volatility to identify potential trend directions, while the EMA provides a smooth moving average to help refine entries and exits based on trend momentum.
Features:
Supertrend: Detects trend reversals by using price action and volatility, making it effective in trending markets.
Exponential Moving Average (EMA): Smoothens price fluctuations, helping you gauge the trend’s strength and filter out false signals.
Versatile for multiple timeframes and asset classes.
Ideal for traders looking to catch sustained trends and avoid false breakouts, this indicator offers an improved way to follow market momentum and confirm trend strength. Customize the Supertrend ATR multiplier and EMA length to suit your trading style and timeframe.
Supertrend by JKRSupertrend by JKR is a trend-following overlay that plots dynamic support/resistance bands around price and flips when the trend changes.
It builds a smoothed baseline using your selected moving average type (SMA, TMA, WMA, VWMA, TEMA, HMA, EMA, or VMA). Around this baseline, it computes a volatility/range offset (classic ATR mode or Dual-Thrust range mode) and creates two trailing bands:
UpTrend band (active during bullish conditions)
DownTrend band (active during bearish conditions)
When price closes beyond the active band, the indicator flips trend direction and switches to the opposite band. While the trend remains active, the band “trails” price and updates in a way that avoids stepping backwards, which helps keep the trend structure clean and stable.
Options
Trend-change arrows (optional)
Bar coloring or candle overlay (optional)
Designed to evaluate on bar close for stable signals
Tip: Increase the Multiplier to reduce flips and widen bands; reduce Period to make the trend more responsive.

SuperTrend Multi Time Frame with Alerts V.1SuperTrend Multi Time Frame with Alerts.
You can add long and short alerts for all supertrend viewed on the graph.
The script plot 5min, 1H and D Supertrend.
Enjoy!

SuperTrend AI Oscillator StrategySuperTrend AI Oscillator Strategy
Overview
This strategy is a trend-following approach that combines the SuperTrend indicator with oscillator-based filtering.
By identifying market trends while utilizing oscillator-based momentum analysis, it aims to improve entry precision.
Additionally, it incorporates a trailing stop to strengthen risk management while maximizing profits.
This strategy can be applied to various markets, including Forex, Crypto, and Stocks, as well as different timeframes. However, its effectiveness varies depending on market conditions, so thorough testing is required.
Features
1️⃣ Trend Identification Using SuperTrend
The SuperTrend indicator (a volatility-adjusted trend indicator based on ATR) is used to determine trend direction.
A long entry is considered when SuperTrend turns bullish.
A short entry is considered when SuperTrend turns bearish.
The goal is to capture clear trend reversals and avoid unnecessary trades in ranging markets.
2️⃣ Entry Filtering with an Oscillator
The Super Oscillator is used to filter entry signals.
If the oscillator exceeds 50, it strengthens long entries (indicating strong bullish momentum).
If the oscillator drops below 50, it strengthens short entries (indicating strong bearish momentum).
This filter helps reduce trades in uncertain market conditions and improves entry accuracy.
3️⃣ Risk Management with a Trailing Stop
Instead of a fixed stop loss, a SuperTrend-based trailing stop is implemented.
The stop level adjusts automatically based on market volatility.
This allows profits to run while managing downside risk effectively.
4️⃣ Adjustable Risk-Reward Ratio
The default risk-reward ratio is set at 1:2.
Example: A 1% stop loss corresponds to a 2% take profit target.
The ratio can be customized according to the trader’s risk tolerance.
5️⃣ Clear Trade Signals & Visual Support
Green "BUY" labels indicate long entry signals.
Red "SELL" labels indicate short entry signals.
The Super Oscillator is plotted in a separate subwindow to visually assess trend strength.
A real-time trailing stop is displayed to support exit strategies.
These visual aids make it easier to identify entry and exit points.
Trading Parameters & Considerations
Initial Account Balance: Default is $7,000 (adjustable).
Base Currency: USD
Order Size: 10,000 USD
Pyramiding: 1
Trading Fees: $0.94 per trade
Long Position Margin: 50%
Short Position Margin: 50%
Total Trades (M5 Timeframe): 1,032
Visual Aids for Clarity
This strategy includes clear visual trade signals to enhance decision-making:
Green "BUY" labels for long entries
Red "SELL" labels for short entries
Super Oscillator plotted in a subwindow with a 50 midline
Dynamic trailing stop displayed for real-time trend tracking
These visual aids allow traders to quickly identify trade setups and manage positions with greater confidence.
Summary
The SuperTrend AI Oscillator Strategy is developed based on indicators from Black Cat and LuxAlgo.
By integrating high-precision trend analysis with AI-based oscillator filtering, it provides a strong risk-managed trading approach.
Important Notes
This strategy does not guarantee profits—performance varies based on market conditions.
Past performance does not guarantee future results. Markets are constantly changing.
Always test extensively with backtesting and demo trading before using it in live markets.
Risk management, position sizing, and market conditions should always be considered when trading.
Conclusion
This strategy combines trend analysis with momentum filtering, enhancing risk management in trading.
By following market trends carefully, making precise entries, and using trailing stops, it seeks to reduce risk while maximizing potential profits.
Before using this strategy, be sure to test it thoroughly via backtesting and demo trading, and adjust the settings to match your trading style.

Supertrend B&SSuperTrend is one of the most common ATR based trailing stop indicators.
In this version you can change the ATR calculation method from the settings. Default method is RMA, when the alternative method is SMA .
The indicator is easy to use and gives an accurate reading about an ongoing trend. It is constructed with two parameters, namely period and multiplier. The default values used while constructing a superindicator are 10 for average true range or trading period and three for its multiplier.
The average true range (ATR) plays an important role in 'Supertrend' as the indicator uses ATR to calculate its value. The ATR indicator signals the degree of price volatility .
The buy and sell signals are generated when the indicator starts plotting either on top of the closing price or below the closing price. A buy signal is generated when the ‘Supertrend’ closes above the price and a sell signal is generated when it closes below the closing price.
It also suggests that the trend is shifting from descending mode to ascending mode. Contrary to this, when a ‘Supertrend’ closes above the price, it generates a sell signal as the colour of the indicator changes into red.
A ‘Supertrend’ indicator can be used on equities, futures or forex, or even crypto markets and also on daily, weekly and hourly charts as well, but generally, it fails in a sideways-moving market.

SuperTrend - With Exits & Trade ZonesSuperTrend - With Exits & Trade Zones
Overview
An advanced trend-following indicator that combines pivot points with the SuperTrend methodology to create a complete trading system with entry signals, exit signals, and visual trade zones. This indicator adapts to market structure rather than just price action, providing more reliable trend identification.
What Makes This Unique
Unlike standard SuperTrend indicators that use moving averages, this version:
Uses actual pivot points to calculate a dynamic center line
Provides multiple entry mode options for different trading styles
Shows clear exit signals (both trailing stop and take profit)
Color-codes the entire chart into trade zones (Long, Short, No Trade)
Eliminates guesswork about when to enter, exit, and stay out
Features
📊 Core Indicator Components
Pivot Point Detection: Identifies local highs and lows in price structure
Dynamic Center Line: Weighted calculation using detected pivot points
ATR-Based Bands: Volatility-adjusted upper and lower bands
Trailing Stop Line: Adaptive stop-loss that follows the trend
🎯 Entry Signals
Four entry modes to match your trading style:
Immediate Mode ⚡
Signals right when the trailing stop breaks
Fastest entries for aggressive traders
Best for strong trending markets
Aggressive Mode 🔥 (Recommended)
Signals when price closes beyond break candle OR opens beyond it
Balanced speed and confirmation
Good for most market conditions
Balanced Mode ⚖️
Requires entire candle to close beyond break level
Moderate confirmation
Reduces false breakouts
Conservative Mode 🛡️
Waits for candle to open AND stay completely beyond break level
Highest confirmation, slowest entries
Best for choppy markets
🚪 Exit Signals
Three exit strategies:
Trailing Stop
Exits when price crosses back through the trailing stop line
Lets profits run in trending markets
Protects gains when trend weakens
Take Profit %
Exits at predetermined profit target
Locks in gains at specific percentage
Good for range-bound markets
Both
Uses whichever exit comes first
Combines profit protection with trend following
Recommended for most traders
🎨 Visual Trade Zones
Color-coded backgrounds eliminate confusion:
🟢 Light Green: Active LONG position
🔴 Light Red: Active SHORT position
⚫ Gray: NO TRADE ZONE (between exit and next signal)
📍 Additional Visual Elements
Diamond markers: Show when trailing stop is first broken
BUY/SELL labels: Clear entry signals in green/red
EXIT markers: Gray X for stop loss, Orange X (TP) for take profit
Pivot points: Optional display of detected highs/lows (H/L markers)
Support/Resistance: Optional circles at pivot levels
Settings & Parameters
Basic Settings
Pivot Point Period (default: 2)
Controls sensitivity of pivot detection
Lower = more pivots detected (more responsive)
Higher = fewer pivots (more stable)
ATR Factor (default: 3)
Distance multiplier for trailing stop bands
Lower = tighter stops (more signals, earlier exits)
Higher = wider stops (fewer signals, longer trades)
ATR Period (default: 10)
Lookback period for volatility calculation
Affects how quickly bands adapt to volatility changes
Entry Configuration
Entry Mode: Select from Immediate/Aggressive/Balanced/Conservative
Determines how quickly the indicator generates signals after a trend break
Exit Configuration
Exit Method: Choose Trailing Stop, Take Profit %, or Both
Take Profit % (default: 2%)
Set your profit target as percentage of entry price
Adjust based on volatility and timeframe
Display Options
Show Buy/Sell Labels: Toggle entry signal labels
Show Exit Signals: Toggle exit markers
Show Break Candles: Toggle diamond markers on trend breaks
Show Pivot Points: Display H/L markers at pivot points
Show PP Center Line: Display the dynamic center line
Show Support/Resistance: Display circles at S/R levels
How to Use
For Swing Traders
Set Entry Mode to "Balanced" or "Conservative"
Use "Both" exit method with 3-5% take profit
Enable all visual elements for complete market picture
Trade only in direction of colored zones
For Day Traders
Set Entry Mode to "Aggressive" or "Immediate"
Use "Trailing Stop" exit method to catch intraday trends
Lower ATR Factor to 2-2.5 for tighter stops
Watch for quick signals in the first 2 hours of trading
For Position Traders
Use higher timeframes (Daily/Weekly)
Set Entry Mode to "Conservative"
Increase Take Profit % to 5-10%
Use larger ATR Factor (4-5) for wider stops
General Trading Rules
✅ DO: Enter on BUY/SELL signals (green/red backgrounds)
✅ DO: Exit on EXIT/TP markers
❌ DON'T: Enter during gray NO TRADE ZONE
❌ DON'T: Counter-trend trade against the colored zone
Alerts
Set up the following alerts for automated trading notifications:
Buy Signal: Triggers when long entry conditions are met
Sell Signal: Triggers when short entry conditions are met
Exit Long: Triggers when long position should be closed
Exit Short: Triggers when short position should be closed
Trailing Stop Broken: Triggers on initial trend change
Best Practices
Timeframe Selection
1-5 min: Scalping (use Immediate/Aggressive mode)
15-60 min: Day trading (use Aggressive/Balanced mode)
4H-Daily: Swing trading (use Balanced/Conservative mode)
Weekly: Position trading (use Conservative mode)
Risk Management
Always use the EXIT signals - don't hold through gray zones
Position size based on distance to trailing stop
Never risk more than 1-2% per trade
Consider wider stops on higher timeframes
Market Conditions
Trending markets: Use Aggressive mode, Trailing Stop exits
Ranging markets: Use Conservative mode, Take Profit exits
High volatility: Increase ATR Factor, use Both exits
Low volatility: Decrease ATR Factor for tighter stops
Technical Details
Calculation Method
Detect pivot highs and lows using specified period
Calculate weighted center line: (previous_center × 2 + new_pivot) / 3
Calculate bands: Upper = Center - (ATR Factor × ATR), Lower = Center + (ATR Factor × ATR)
Determine trend based on price position relative to bands
Trail stop line follows the active trend direction
Signal Logic
Entry signals generated based on selected confirmation mode
Position tracking maintains state from entry to exit
Exit signals calculated from both trailing stop and take profit levels
Trade zones update in real-time based on position state
Limitations & Considerations
Works best in trending markets; may generate false signals in tight ranges
Not a holy grail - should be used with proper risk management
Past performance does not guarantee future results
Recommended to backtest on your specific instrument and timeframe
Consider combining with volume analysis or other indicators for confirmation
Version History
v1.0: Initial release with entry signals and confirmation modes
v1.1: Added exit signals (trailing stop and take profit)
v1.2: Added color-coded trade zones (Long/Short/No Trade)
Credits
Original Pivot Point SuperTrend concept by LonesomeTheBlue
Modified with exit signals and trade zone visualization
License
Mozilla Public License 2.0
Example Setups
Conservative Swing Trading
Pivot Point Period: 2
ATR Factor: 3
ATR Period: 10
Entry Mode: Conservative
Exit Method: Both
Take Profit %: 4%
Aggressive Day Trading
Pivot Point Period: 2
ATR Factor: 2.5
ATR Period: 10
Entry Mode: Aggressive
Exit Method: Trailing Stop
Position Trading
Pivot Point Period: 3
ATR Factor: 4
ATR Period: 14
Entry Mode: Balanced
Exit Method: Both
Take Profit %: 8%
Disclaimer: This indicator is for educational purposes only. Trading involves substantial risk. Always do your own research and never trade with money you cannot afford to lose.

SuperTrend Heikin AshiSupertrend Heikin Ashi is an indicator based on the standard calculation of the Supertrend with the difference of using the Open and Close value of the Heikin Ashi candles instead of the normal Candle Sticks.
In this way the main characteristic of the HA candles is exploited, thus filtering movements that could generate false signals.
I recommend using SPY, SPX, QQQ to be aware of the market situation, not operating (or paying great attention) long on stocks when the indicator is red and the price is below the drawn line.

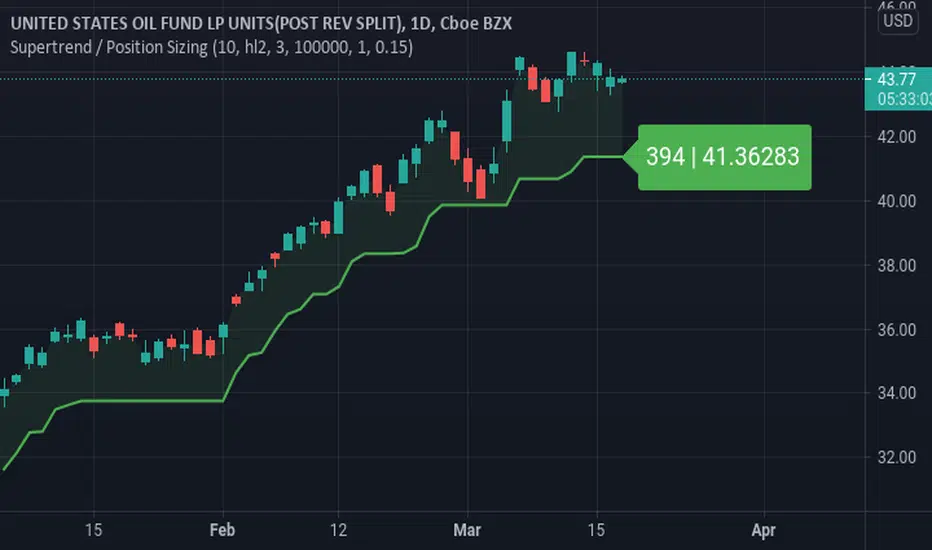
Supertrend / Position SizingSuperTrend with position sizing calculator.
This is based on SuperTrend by Kivanc. I only added the position size calculation and displaying the result.
SuperTrend MultiTimeFrame with Alerts V.1SuperTrend Multi Time Frame with Multi Alerts ... you can insert alerts for all supertrend viewed on graph.
Different alerts for long and short.
This script plot 5min, 1H and 1D!
Enjoy!

Supertrend CloudSupertrend is a simple yet great indicator which is based hard data, especially when combined with an additional ST line which has its multiplication doubled.
Enjoy :)

SuperTrend V.1 AlertThis script is to use with "SuperTrend V1.0 - Buy or Sell Signal" by Rajandran.r
Use it with original Strategy for add TradingView Alert.
Enjoy!

supertrendHere is an extensive library on different variations of supertrend.
Library "supertrend"
supertrend : Library dedicated to different variations of supertrend
supertrend_atr(length, multiplier, atrMaType, source, highSource, lowSource, waitForClose, delayed) supertrend_atr: Simple supertrend based on atr but also takes into consideration of custom MA Type, sources
Parameters:
length : : ATR Length
multiplier : : ATR Multiplier
atrMaType : : Moving Average type for ATR calculation. This can be sma, ema, hma, rma, wma, vwma, swma
source : : Default is close. Can Chose custom source
highSource : : Default is high. Can also use close price for both high and low source
lowSource : : Default is low. Can also use close price for both high and low source
waitForClose : : Considers source for direction change crossover if checked. Else, uses highSource and lowSource.
delayed : : if set to true lags supertrend atr stop based on target levels.
Returns: dir : Supertrend direction
supertrend : BuyStop if direction is 1 else SellStop
supertrend_bands(bandType, maType, length, multiplier, source, highSource, lowSource, waitForClose, useTrueRange, useAlternateSource, alternateSource, sticky) supertrend_bands: Simple supertrend based on atr but also takes into consideration of custom MA Type, sources
Parameters:
bandType : : Type of band used - can be bb, kc or dc
maType : : Moving Average type for Bands. This can be sma, ema, hma, rma, wma, vwma, swma
length : : Band Length
multiplier : : Std deviation or ATR multiplier for Bollinger Bands and Keltner Channel
source : : Default is close. Can Chose custom source
highSource : : Default is high. Can also use close price for both high and low source
lowSource : : Default is low. Can also use close price for both high and low source
waitForClose : : Considers source for direction change crossover if checked. Else, uses highSource and lowSource.
useTrueRange : : Used for Keltner channel. If set to false, then high-low is used as range instead of true range
useAlternateSource : - Custom source is used for Donchian Chanbel only if useAlternateSource is set to true
alternateSource : - Custom source for Donchian channel
sticky : : if set to true borders change only when price is beyond borders.
Returns: dir : Supertrend direction
supertrend : BuyStop if direction is 1 else SellStop
supertrend_zigzag(length, history, useAlternateSource, alternateSource, source, highSource, lowSource, waitForClose, atrlength, multiplier, atrMaType) supertrend_zigzag: Zigzag pivot based supertrend
Parameters:
length : : Zigzag Length
history : : number of historical pivots to consider
useAlternateSource : - Custom source is used for Zigzag only if useAlternateSource is set to true
alternateSource : - Custom source for Zigzag
source : : Default is close. Can Chose custom source
highSource : : Default is high. Can also use close price for both high and low source
lowSource : : Default is low. Can also use close price for both high and low source
waitForClose : : Considers source for direction change crossover if checked. Else, uses highSource and lowSource.
atrlength : : ATR Length
multiplier : : ATR Multiplier
atrMaType : : Moving Average type for ATR calculation. This can be sma, ema, hma, rma, wma, vwma, swma
Returns: dir : Supertrend direction
supertrend : BuyStop if direction is 1 else SellStop
SuperTrendSHey! By using this script you can choose between the Regular SuperTrend and Pivot Point SuperTrend.
Pivot Point SuperTrend differs in calculation from the regular SuperTrend and as the name suggests, Pivot Points are used instead of ATR.
I made this script to make it easier to switch and compare between one another.
Also included Jurik RSX as a Momentum Indicator. SuperTrend changes color to purple when it's a bear trend and RSX is in an overbought state. And orange when it's a bull trend and RSX is in an oversold state. A reversal might be expected when color changes to purple & orange occur.
Special thanks to;
Kivanc Ozbilgic for SuperTrend
LonesomeTheBlue for Pivot Point SuperTrend
& everget for Jurik RSX
Enjoy!
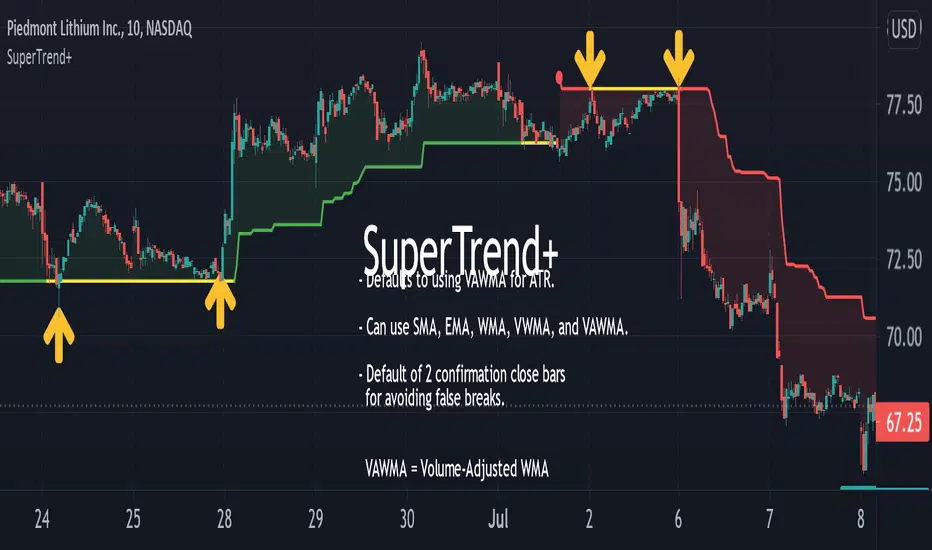
SuperTrend+Based upon popular SuperTrend (AKA: ATR Trailing Stop) indicator with the following differences and improvements:
Defaults to using Volume-Adjusted WMA ( VAWMA ) for ATR. (Can still be configured to behave exactly like classic SuperTrend.)
Can use SMA, EMA, WMA, VWMA, and VAWMA instead of just SMA.
Confirmation close bars for avoiding false breaks.
Details:
If the confirmation closing bars value is greater than zero (default of two bars), the trend will only reverse if the price closes outside the boundary for that number of bars (does not need to be consecutive) or if the opposite side of the bar exceeds the boundary.
The confirmation bar count will reset if the trend has resumed (opposite boundary is broken).
Confirmation examples:
In a down-trend, but the previous two bars close above the boundary.
In a down-trend, but the low of the previous bar exceeds the boundary.
In a down-trend, but the high of the previous bar exceeds the boundary when confirmation bars are set to zero.
SuperTrend_ChannelThis set up created to understand support and resistance as per ATR (Average True Range)
Existing setup of supertrend modified to Channel set up
It is created for study purpose , Buying or selling not suggested as per this
Thank you

SupertrendThis indicator is based on Multi timeframe supertrend . i use pine script function ta.supertrend() ..
The Multiple Timeframe Supertrend is a technical analysis indicator that helps traders identify the overall market trend across different timeframes. It is based on the concept of the Supertrend indicator, which is designed to follow the trend and provide buy or sell signals.
The Multiple Timeframe Supertrend takes into account the Supertrend indicator's values on multiple timeframes, typically a higher timeframe (e.g., daily or weekly) and a lower timeframe (e.g., hourly or 15 minutes). By considering the trend direction on both timeframes, traders can get a broader perspective on the market trend and potentially improve their trading decisions.
general approach to using the Multiple Timeframe Supertrend indicator
Determine the timeframes: Choose the higher timeframe and the lower timeframe you want to analyze. For example, you might use the daily and hourly charts.
Calculate the Supertrend on each timeframe: Apply the Supertrend indicator separately on each timeframe, using the appropriate parameters (such as period and multiplier).
Analyze the trend: Compare the Supertrend values on both timeframes. If the Supertrend is bullish (indicating an uptrend) on both timeframes, it suggests a stronger bullish bias. Conversely, if both timeframes show a bearish Supertrend, it indicates a stronger bearish bias.
Trading decisions: Based on the analysis, you can make trading decisions. For example, if the higher timeframe shows an uptrend and the lower timeframe confirms the same trend, you might look for buying opportunities. Conversely, if both timeframes indicate a downtrend, you might consider selling or shorting.

SupertrendAn implementation of the supertrend indicator as it'll be implemented in build-in pine function
Supertrend calculates two values:
-supertrend
-direction
using the direction resistance and support are plotted.
SuperTrendThis is a redesign of the SuperTrend indicator. It removes stupid transitions between SuperTrend states and highlights initial points for both lines.
SuperTrend is a moving stop and reversal line based on the volatility (ATR).

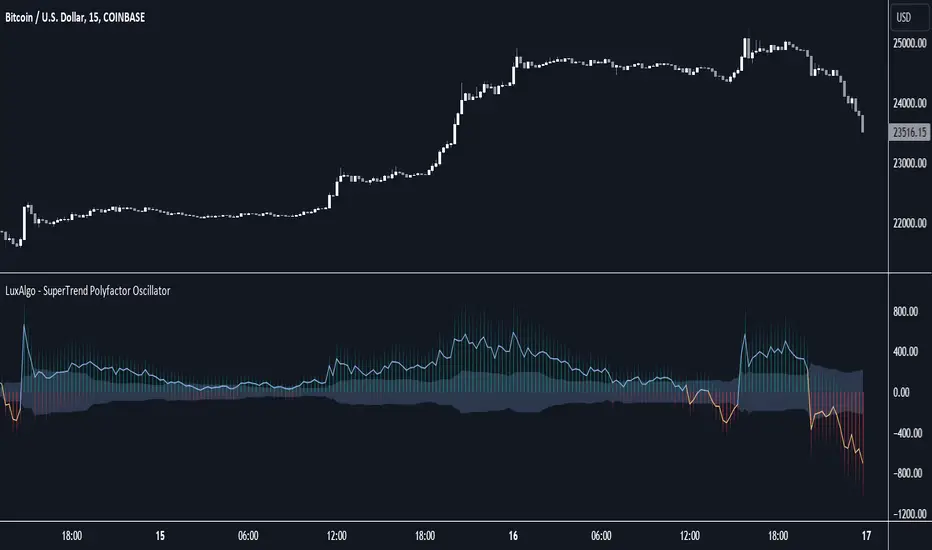
SuperTrend Polyfactor Oscillator [LuxAlgo]The SuperTrend Polyfactor Oscillator is an oscillator based on the popular SuperTrend indicator that aims to highlight information returned by a collection of SuperTrends with varying factors inputs.
A general consensus is calculated from all this information, returning an indication of the current market sentiment.
🔶 USAGE
Multiple elements are highlighted by the proposed oscillator. A mesh of bars is constructed from the difference between the price and a total of 20 SuperTrends with varying factors. Brighter colors of the mesh indicate a higher amount of aligned SuperTrends indications.
The factor input of the SuperTrends is determined by the user from the Starting Factor setting which determines the factor of the shorter-term SuperTrend, and the Increment settings which control the step between each factor inputs.
Using higher values for these settings will return information for longer-term term price variations.
🔹 Consensus
From the collection of SuperTrends, a consensus is obtained. It is calculated as the median of all the differences between the price and the collection of SuperTrends.
This consensus is highlighted in the script by a blue and orange line, with a blue color indicating an overall bullish market, and orange indicating a bearish market.
Both elements can be used together to highlight retracements within a trend. If we see various red bars while the general consensus is bullish, we can interpret it as the presence of a retracement.
🔹 StDev Area
The indicator includes an area constructed from the standard deviation of all the differences between the price and the collection of SuperTrends.
This area can be useful to see if the market is overall trending or ranging, with a consensus over the area indicative of a trending market.
🔹 Normalization
Users can decide to normalize the results and constrain them within a specific range, this can allow obtaining a lower degree of variations of the indicator outputs. Two methods are proposed "Absolute Sum", and "Max-Min".
The "Absolute Sum" method will divide any output returned by the indicator by the absolute sum of all the differences between the price and SuperTrends. This will constrain all the indicator elements in a (1, -1) scale.
The "Max-Min" method will apply min-max normalization to the indicator outputs (with the exception of the stdev area). This will constrain all the indicator elements in a (0, 1) scale.
🔶 SETTINGS
Length: ATR Length of all calculated SuperTrends.
Starting Factor: Factor input of the shorter-term SuperTrend.
Increment: Step value between all SuperTrends factors.
Normalize: Normalization method used to rescale the indicator output.