Adaptive MA SuperTrendAdaptive MA SuperTrend
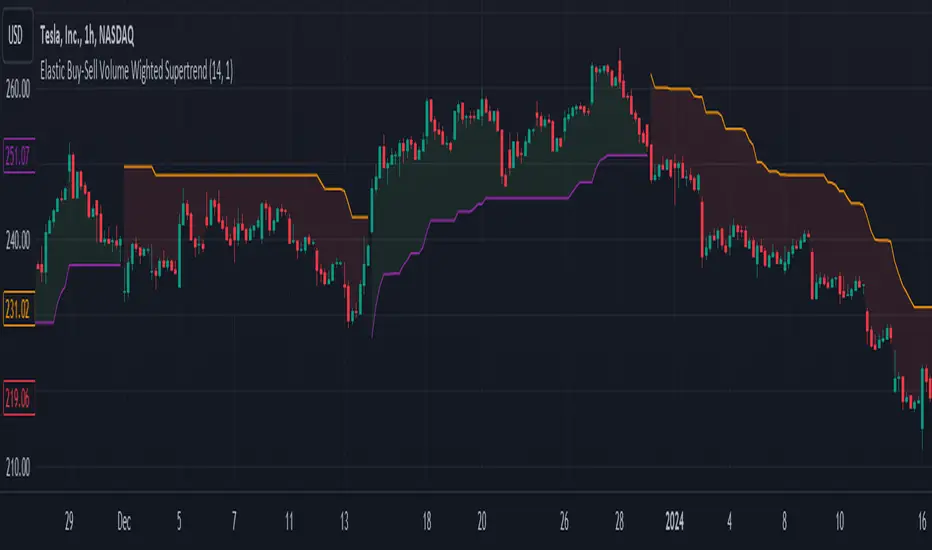
Adaptive MA SuperTrend is a trend-following overlay indicator designed to deliver smoother and more responsive signals than the classical SuperTrend by dynamically combining two moving averages with volatility-based band calculations.
Instead of relying on a single average, the script calculates a selectable pair of moving averages and continuously assigns them as the upper or lower base depending on which value is greater at each bar. This adaptive swapping allows the structure to respond better to changing market conditions while preserving overall trend stability.
A volatility component is then added to the bases using either:
• Average True Range (ATR)
• Standard Deviation (SD)
The selected volatility measure is multiplied by a configurable factor to create adaptive bands around the moving-average bases. Price crossing these bands determines trend direction changes.
When price crosses above the upper band, the trend switches bullish and the lower band becomes the trailing support line. When price crosses below the lower band, the trend switches bearish and the upper band becomes the trailing resistance line. Only the active trend side is plotted to reduce visual noise and improve chart clarity.
Multiple moving-average pair options are provided, allowing users to choose combinations that match their preferred balance between smoothness and responsiveness, including SMA, EMA, WMA, HMA, VWMA, DEMA, TEMA, and ALMA-based combinations. Additional parameters are available when ALMA is selected.
⚙️ Key Features
• Adaptive swapping between two moving averages
• Choice of MA pairs with different responsiveness profiles
• ATR or Standard Deviation volatility bands
• Configurable volatility length and multiplier
• Optional ALMA tuning parameters
• Trend visualization with color-coded support/resistance lines
• Signal markers displayed on trend transitions
🧩 Inputs Overview
• Moving average pair selection
• Moving average length and price source
• Volatility method, length, and multiplier
• Optional ALMA offset and sigma parameters
📌 Usage Notes
• Designed to help visualize prevailing trend direction and potential trend shifts.
• Can be combined with confirmation tools or risk management rules within broader strategies.
• Signals are generated when price crosses volatility-adjusted moving-average bands; signals may update intrabar, especially on lower timeframes.
• This script is intended for analytical purposes and does not constitute financial advice. Users should test and validate performance within their own workflow before applying it to live trading.
Penunjuk Pine Script®