Penunjuk Pine Script®
Cari dalam skrip untuk "supertrend"

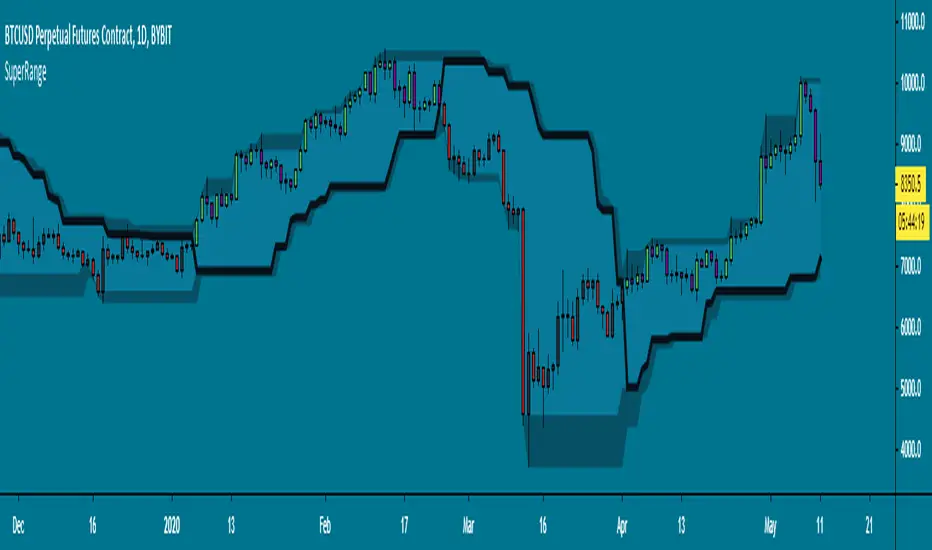
SuperRange - evoA SuperTrend like indicator based on highest and lowest candle close from a few bars back. It looks almost the same as Donchian Channels but with a dominant trend direction inside (Black line).
Uptrend: Candle closed higher than highest close
Downtrend: Candle closed lower than lowest close
This works best on higher time frames since a daily close is more powerful than a 15 minute close.
A few examples how you could use this:
Use support & resistance
Apply a moving average
Buy and sell the break-out
All perfect world examples, this does not happen all the time off course.. Its just for the idea. There are many ways to trade this so feel free to share in the comments, good luck and follow the trend! :)
Penunjuk Pine Script®
Penunjuk Pine Script®

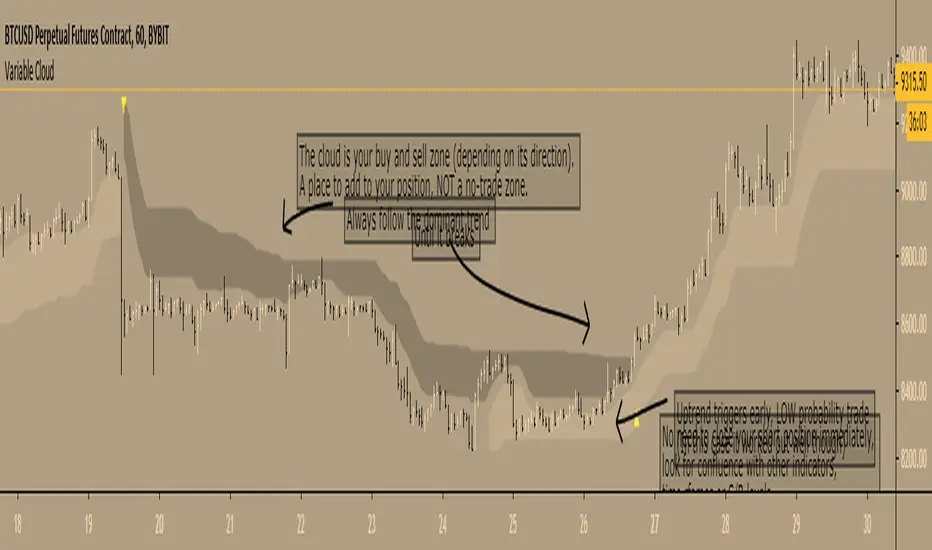
Variable Cloud - evoA Super Trend based on the high and low of a Moving Average, to get an easy view what the current trend is and where to buy and sell.
TIPS
- The 'Closing Source' option is the candle value that triggers the clouds. 'High/Low System' means that a downtrend is over when the candle LOW closes greater than the downtrend (dark cloud), an uptrend is over when the candle HIGH closes less than the uptrend (light cloud). The other options speak for themselves.
- Ideally place your stop loss outside the cloud, as you want to stay in the trend until it breaks to the opposite direction (but that's up to you of course).
- Reversal trades are low probability, you can see them as reversals or ranging before the market continues, I like to lower my risk on those set ups till it breaks the dominant trend.
Here are the scripts I used:
Everget's SuperTrend
LazyBear's VMA
Thanks LazyBear and Everget, I learn a lot from your scripts :)
Penunjuk Pine Script®
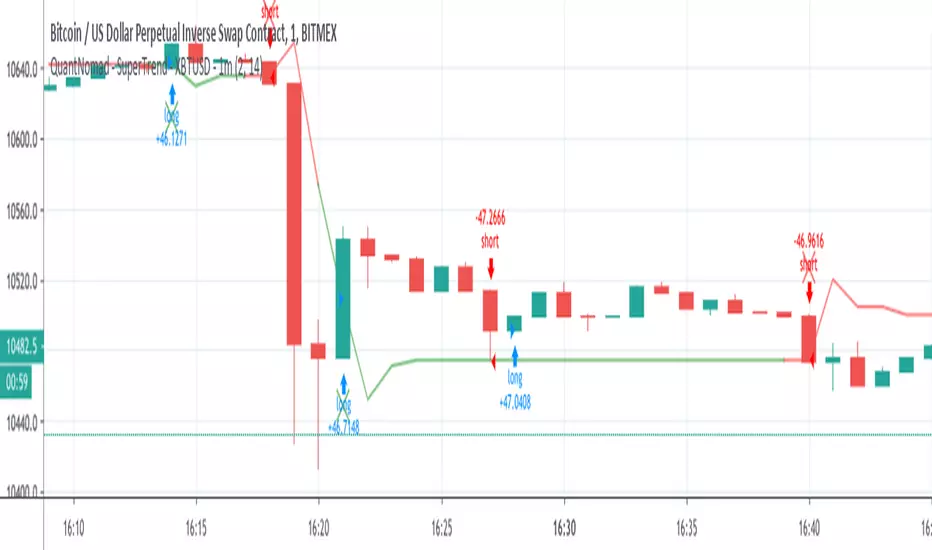
QuantNomad - SuperTrend - XBTUSD - 1mInteresting performance for Super Trend strategy for XBTUSD 1m chart.
Params: ST Mult: 2, ST Period 14.
Performance: 144% profit, 1988 trades, only 41% prof, 2.04% dd , 2.51 Sharpe.
On its own, it might be not a very good strategy, but the big amount of trades allows you to add more filters and improve it.
And remember:
Past performance does not guarantee future results.
Strategi Pine Script®
QuantNomad - SuperTrend - TSLA - 1mInteresting performance for Super Trend strategy for Tesla ( TSLA ) 1m chart.
Params: ST Mult: 3, ST Period 120.
Performance:61% profit, 637 trades, only 33% prof, 4.84% dd , 0.4 Sharpe.
On its own, it might be not a very good strategy, but the big amount of trades allows you to add more filters and improve it.
The strategy is not bad both with "when" params when strategy executed on open of next bar and with stop orders when strategy enters on exact Super Trend level.
You can comment/uncomment lines in the code and switch from one approach to another.
And remember:
Past performance does not guarantee future results.
Strategi Pine Script®

Penunjuk Pine Script®

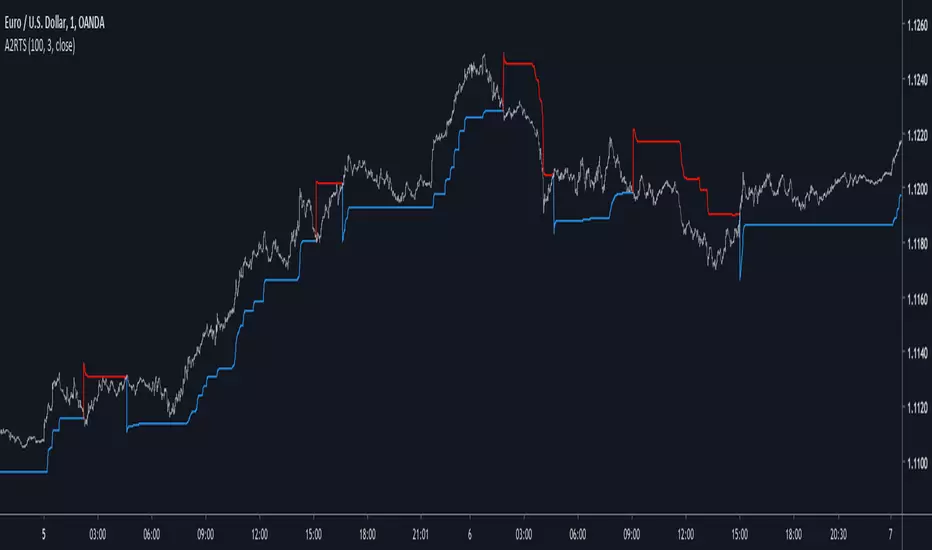
Adaptive Autonomous Recursive Trailing StopIntroduction
Trailing stop are important indicators in technical analysis, today i propose a new trailing stop A2RTS based on my last published indicator A2RMA (1), this last indicator directly used an error measurement thus providing a way to create enveloppes, which provide a direct way to create trailing stops based on highest/lowest rules.
The Indicator
If you need a more detailed explanation of this indicator i encourage you to check the A2RMA indicator post i made, parameters does not differ from the supertrend, thus having a length parameter and a factor parameter who is here described as gamma , gamma control how far away are the bands from each others thus spotting longer terms trends when gamma is higher.
On BTCUSD
Something worth mentioning is that the indicator sometimes behave like my MTA trailing stop indicator (2) who is closer to the price when a trend persist thus providing early exit points, however A2RTS behave a bit better.
Price can sometimes break the trailing stop, this can be interpreted as a support/resistance or just as an exit point, the support resistance methodology on trailing stop is not the most recommended.
Sometimes it is recommended to have an higher length rather than an high gamma like in this case for INTEL CORP, below gamma = 3 and length = 20
The microprocessor market like to use higher length's instead of higher gamma's , A2RMA is a non-linear filter, this would explain such behaviour.
Conclusion
Trailing stops might not suffer as much from whipsaw trades than MA crossovers but they still remain inefficient when market is not trending, results of the proposed indicator on major forex pairs are more than disappointing, but i hope this will serve as basis for other trailing stops that might act a little bit better. I conclude this post by thanking everyone who support my work and i encourage you to modify this indicator and share it with the community.
Thanks for reading !
Cited Articles
Penunjuk Pine Script®
Doji's/Engulfing Candles/Supertrend v1.0The Script locates Bearish/Bullish Engulfing Candlesticks and Dojis in combination with Supertrend v1.0.
Original Authors: HPotter + Rajandran R
Penunjuk Pine Script®

Noro's SuperTrend Strategy v2.0 LimitThis strategy same as "Noro's SuperTrend Strategy v1.0". But it is used limit orders. The price for the limit orders is the price of closing of the previous bar. The color filter of a candle is used.
Strategi Pine Script®

RSI ST MTFUsing this script with some changes
I try to build the RSI SUPERTREND model with MTF function
I think its need more work to refine it but as idea its nice
Penunjuk Pine Script®

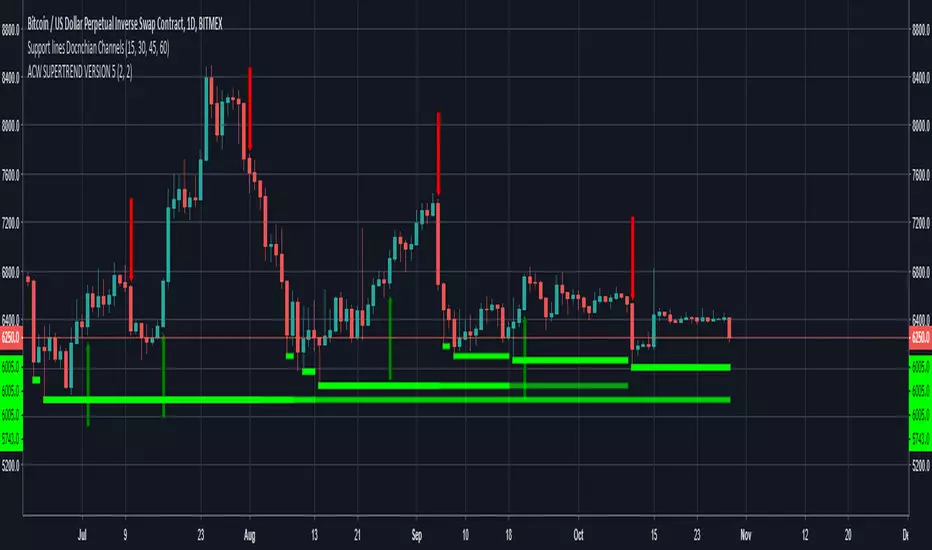
ACW SUPERTREND VERSION 5 Updated 29 October 2018//Author - PRINZ MASTER TRADER
//ACW SUPERTREND VERSION 5
numerous code changes that enable more accurate signal delivery and accuracy
removed false signals
enabled higher roe targets on higher time frames
works best on H2 with ethusd bitmex and all time frames on xbtusd bitmex
Penunjuk Pine Script®
Alpha Capital Wealth - Supertrend Any Crypto Any TimeframeAlpha Capital Wealth - Supertrend Any Crypto Any Timeframe
Penunjuk Pine Script®

ACW SUPERTREND v3 as per testing
xbtusd works fine on 5,15,30 and above
100% accuracy on 30mins
ethusd works on any time frame
100% accuracy on 30mins
updated the code script to provide go long , go short 2/3 candles as compared to acw supertrend v2
script is still being updated
Penunjuk Pine Script®

Noro's SuperTrend Strategy v1.0The SuperTrend indicator is used. This indicator is necessary for definition of a trend.
If now a uptrend and a candle red - to open a long position (and to close short)
If now a downtrend and a candle green - to open a short position (and to close long)
Strategi Pine Script®

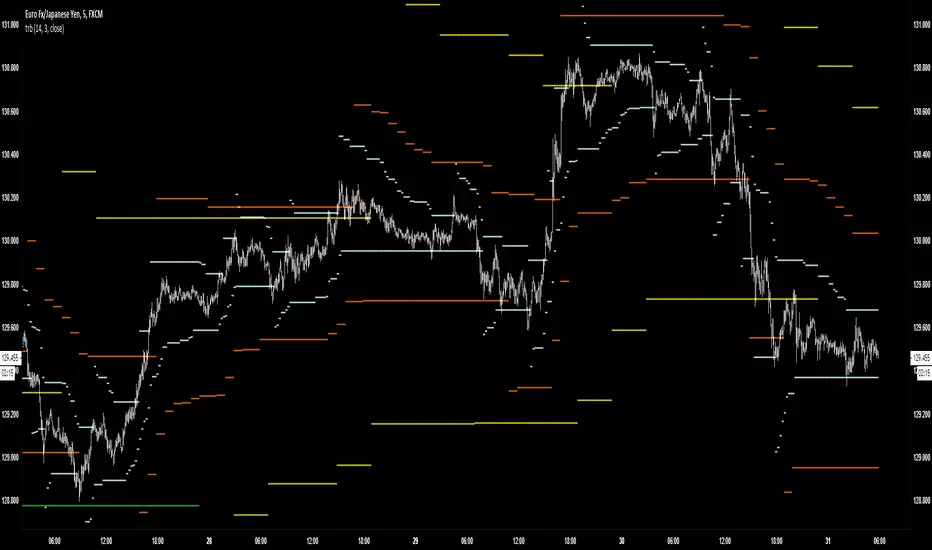
TRBTrue Range Bands; the 'Supertrend', also known as a volatility stop, using a 14 period length and 3x multiplier.
Penunjuk Pine Script®
Penunjuk Pine Script®

Cash Glow IndicatorThis indicator shows you where buyers and sellers are active on the chart, highlighting key areas where price has previously reacted. Each zone includes a count that tracks how many times that level has been revisited, giving you a clear sense of its importance. The more times an area is revisited, the stronger and more relevant it becomes, helping you focus on zones that consistently influence price movement.
Penunjuk Pine Script®

Penunjuk Pine Script®

Strategi Pine Script®
SSL MACD - nhuthang83supertrend method, supertrend method, supertrend method, supertrend method, supertrend method,
Strategi Pine Script®

Strategi Pine Script®

SuperTrended Moving Averages Strategyself use
used in 1 second timeframe
please let me publish it aaa
Strategi Pine Script®
