7-Channel Trend Meter v3🔥 7-Channel Trend Meter – Ultimate Trend Confirmation Tool 💹
Purpose: Supplementary indicator used as confirmation
The 7-Channel Trend Meter offers an all-in-one confirmation system that combines 7 high-accuracy indicators into one easy-to-read visual tool. Say goodbye to guesswork and unnecessary tab-switching—just clear, actionable signals for smarter trades. Whether you're trading stocks, crypto, or forex, this indicator streamlines your decision-making process and enhances your strategy’s performance.
⚙️ What’s Inside The Box?
Here is each tool that the Trend Meter uses, and why/how they're used:
Average Directional Index: Confirms market strength ✅
Directional Movement Index: Confirms trend direction ✅
EMA Cross: Confirms reversals in trend through average price ✅
Relative Strength Index: Confirms trend through divergences ✅
Stochastic Oscillator: Confirms shifts in momentum ✅
Supertrend: Confirms trend-following using ATR calculations ✅
Volume Delta: Confirms buying/selling pressure weight by finding differences ✅
🧾 How To Read It:
🟨 Bar 1 – Market Strength Meter:
Light Gold 🟡: Strong market with trending conditions.
Dark Gold 🟤: Weakening market or consolidation—proceed with caution.
📊 Bars 2 to 7 – Trend Direction Confirmations:
🟩 Green: Bullish signal, uptrend likely.
🟥 Red: Bearish signal, downtrend likely.
💯 Why it's helpful to traders:
✅ 7 Confirmations in 1 View: No need to flip between multiple charts.
✅ Visual Clarity: Spot trends instantly with a quick glance.
✅ Perfect for Entry Confirmation: Confirm trade signals before pulling the trigger.
✅ Boosts Your Win Rate: Make data-backed decisions, not guesses.
✅ Works Across Multiple Markets: Stocks, crypto, forex—you name it 🌍.
🤔 "What's with the indicator mashup/How do these components work together? 🤔
The 7-Channel Trend Meter is designed as an original and useful tool that integrates multiple indicators to enhance trading decisions, rather than merely combining existing tools without logical coherence. This strategic mashup creates a comprehensive analysis framework that offers deeper insights into market conditions by capitalizing on each component's unique strengths. The careful integration of seven indicators creates a unified system that eliminates conflicting signals and enhances the decision-making process. Rather than simply merging indicators for the sake of it, the 7-Channel Trend Meter is designed to streamline trading strategies, making it a practical tool for traders across various markets. By leveraging the combined strengths of these indicators, traders can act with greater confidence, backed by comprehensive data rather than fragmented insights. Here’s how they synergistically work together:
Average Directional Index (ADX) and Directional Movement Index (DMI): The reason for this mashup is because ADX indicates the strength of the prevailing trend, while the DMI pinpoints its direction. Together, they equip traders with a dual framework that not only identifies whether to engage with a trend but also quantifies its strength, allowing for more decisive trading strategies.
EMA Cross: The reason for this addition to the mashup is because this tool signals potential trend reversals by identifying moving average crossovers. When combined with the ADX and DMI, traders can better differentiate between genuine trend shifts and market noise, leading to more accurate entries.
Relative Strength Index (RSI) and Stochastic Oscillator: The reason for this mashup is because by using both momentum indicators, traders gain a multifaceted view of market dynamics. The RSI assesses overbought or oversold conditions, while the Stochastic Oscillator confirms momentum shifts. When both agree with the trend signals from the DMI, it enhances the reliability of reversal or continuation strategies.
Supertrend: The reason for this addition to the mashup is because as a trailing stop based on market volatility, the Supertrend indicator works hand-in-hand with the ADX’s strength assessment, allowing traders to ride strong trends while managing risk. This cohesion prevents premature exits during minor pullbacks.
Volume Delta: The reason for this addition to the mashup is because integrating volume analysis helps validate signals from the price action indicators. Significant volume behind a price movement reinforces the likelihood of its continuation, ensuring that traders can act on well-supported signals.
🔍 How it does what it says it does 🔍
While the exact calculations remain proprietary, the following outlines how the components synergistically work to aid traders in making informed decisions:
Market Strength Assessment: Average Directional Index (ADX)
This component is used as confirmation by measuring the strength of the market trend on a scale from 0 to 100. A reading above 20 generally indicates a strong trend, while readings below 20 suggest sideways movement. The Trend Meter flags strong trends, effectively helping traders identify optimal conditions for entering positions.
Trend Direction Confirmation: Directional Movement Index (DMI)
This component is used as confirmation by distinguishing between bullish and bearish trends by evaluating price movements. This combination allows traders to confirm not only if a trend exists but also its direction, informing whether to buy or sell.
Trend Reversal Detection: Exponential Moving Average (EMA) Cross
This component is used as confirmation by calculating two EMAs (one shorter and one longer) to identify potential reversal points. When the shorter EMA crosses above the longer EMA, it signals a bullish reversal, and vice versa for bearish reversals. This helps traders pinpoint optimal entry or exit points.
Momentum Analysis: Relative Strength Index (RSI) and Stochastic Oscillator
These components are used as confirmation by providing insights into momentum. The RSI assesses the speed and change of price movements, indicating overbought or oversold conditions. The Stochastic Oscillator compares a particular closing price to a range of prices over a specified period. This helps identify whether momentum is slowing or speeding up, offering a clear view of potential reversal points. When both the RSI and Stochastic Oscillator converge on signals, it increases the reliability of those signals in trading decisions.
Volatility-Based Trend Following: Supertrend
This component is used as confirmation by utilizing Average True Range (ATR) calculations to help traders stay in momentum-driven trades by providing dynamic support and resistance levels that adapt to volatility. This enables better risk management while allowing traders to capture stronger trends.
Volume Confirmation: Volume Delta
This component is used as confirmation by analyzing buying and selling pressure by measuring the difference between buy and sell volumes, offering critical insights into market sentiment. Significant volume behind a price movement increases confidence in the sustainability of that move.
🧠 Pro Tip:
When all 7 bars line up in green or red, it’s time to take action: load up for a confirmed move or sit back and wait for market confirmation. Let the Trend Meter guide your strategy with precision.
Conclusion:
Integrate the 7-Channel Trend Meter as useful confirmation for your TradingView strategy and stop trading like the average retail trader. This tool eliminates the noise and helps you stay focused on high-confidence trades.
Cari dalam skrip untuk "supertrend"

Options Scalping V2This Indicator is Owned by Team Option Scalping.
It has 4 Plots and 2 Tables.
This indicator to be used only in BankNifty Futures
VWAP ( Volume weighted average price )
• User can input the source and enable/disable the VWAP from input section.
• When price is more than the VWAP its Bullish Trend and vice versa.
VWMA ( Volume weighted moving average )
• Default value of 20 is used in VWMA . User can enable/disable it from input section.
• When price is more than the VWMA its Bullish Trend and vice versa.
Parabolic SAR
• User can input “start”, “increment” and “maximum” values from input section and can enable/disable SAR also.
• When price is more than the Parabolic SAR its Bullish Trend and vice versa.
SuperTrend
• User can input ATR Period and ATR Multiplier values from input section. By defaults it’s 10 and 2.
• User have option of enable/disable “Change ATR calculation Method”, if enabled then ATR is calculated differently for SuperTrend.
• Enable/disable “BUY/SELL signals” on SuperTrend.
• When price is more than the SuperTrend its Bullish Trend and vice versa.
Top Right Corner TABLE ( 6 , 10 )
When you are trading in Banknifty futures , we have to check major Banks which is contributing to Banknifty move. So we have given that in this tab.
This table consist data of 9 following stocks:
• BankNifty
• Nifty
• Dow
• INDIA
• VIX
• HDFC
• ICICI
• KOTAK
• AXIS
• SBI
And following data of each stock has been provided:
• LTP
• Daily Change
• Daily Percentage Change
• 15-minute Change Percentage
• 1-Hour Change Percentage
Bottom Right Corner TABLE (3, 6 )
This table consist of 4 indicators values and Up/Down indicator:
• VWMA (When price is more than the VWMA its Bullish and vice versa)
• SuperTrend (10.2, When price is more than the SuperTrend its Bullish and vice versa.)
• RSI (14)
• VWAP (When price is more than the VWAP its Bullish and vice versa.)

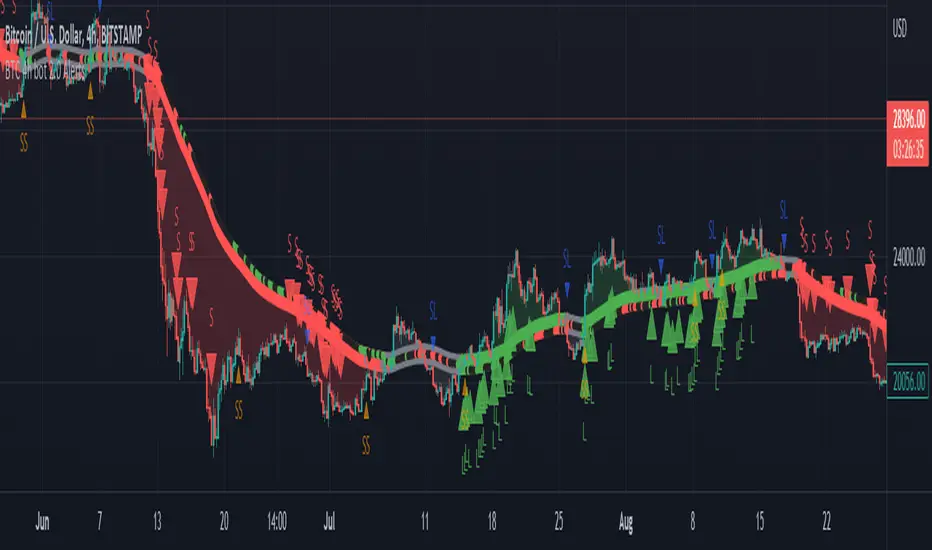
BTC 4h bot 2.0 AlertsThis is Alert version of BTC 4h bot 2.0.
Optimized for pairs BTC vs stablecoins, 4h timeframe.
HOW IT WORKS:
Script is based on the fact that there are certain phases of the market when there is a greater probability that BTC will go to one side or the other. To evaluate which phase we are in, the script uses "Main trend" and "Confirmation signals".
Main trend
- Is composed of a combination of several supertrends and moving averages. A Supertrend is a trend following indicator that helps in identifying whether we are in an uptrend or a downtrend. A higher factor is used to capture the main trend and not just small movements. In case the market goes sideways, the Supertrend does not work well, so it is a combination of multiple supertrends along with moving averages to differentiate a real strong trend from a range.
- It can be seen on the graph as a thick solid line.
- In an uptrend is green, in a downtrend red, gray represents the neutral zone.
Confirmation signals
- Are several script-evaluated indicators such as RSI , MACD , ADX and others, which serve to confirm the trend. In this case, it is the opposite way to the Main trend. Confirmation signals are used here to detect small movements. They are trying to capture bullish and bearish price momentum.
- On the graph they are seen as dashed lines above or below the Main trend (in the gray zone they are in the middle).
- It indicates only two signals, green for buy and red for sell.
HOW TO USE IT:
if the Main trend and Confirmation signals are of the same color, it will send a buy or sell signal, depending on which phase of the trend it is in. If the Main trend is e.g. in an uptrend and the market is going up, Confirmation signals should generate a lot of signals. But if the market starts to go in the opposite direction, Confirmation signals should generate fewer signals or none at all, thus reducing the number of wrong trades. In the gray zone of the Main trend it does not open positions.
To close position is possible to use stop loss and take profit or alternative could be to set very high TP value, thereby letting the script close the positions by itself by Stop Long or Stop Short.
The recommended setting is:
TP: 3.9%
SL: 4.7%.
In this case, it is a Alert version, where can be seen all the signals, which the script generates.
Green triangels indicate open Long.
Red triangels indicate open Short.
Small blue triangels indicate Stop Long position.
Small orange triangels indicate Stop Short position.
Signal is valid after bar is closed, so do not open a position before.
Script works well on Bitstamp, but also other exchanges with pair BTC/USD or BTC/stablecoins.
The script works consistently well over a long period of time, using past probabilities, but this does not guarantee future results.
Gedhusek MasterReversionThe MasterReversion Indicator works as a scanner for possible price reversals.
How does it work?:
The main feature of this indicator is finding extreme price deviations from its mean. This is reached by calculating the average price deviation from its mean and then comparing it with the current price deviation. This deviation is expressed as a percentage in relation to the historically highest price deviation --> if the maximum deviation is 200 points and the current deviation is 180 points, than the percentage displayed is going to be 90%.
With knowing how extreme the current deviation is, we can do some good decision making about whether the market is ready to reverse to its mean or not.
The next feature of this indicator is classic SuperTrend indicator. This tool is mainly used for identifying shifts in the market trend and in this case it becomes very useful when catching the actual price reversion.
The key idea:
The main idea behind this tool is that the price can be away from moving average, but cant stay that way forever. Therefore its convenient to know when the reversion part might happen
How to use:
Generally, you would want to wait until the current price reaches certain percentage (you can see a label on the latest bar displaying current percentage deviation). After that happens, wait for a sign of pullback. For that you can use the built-in SuperTrend indicator or any other strategy that you like. Your potential Take Profit should be somewhere around the main moving average (it has a white colour) as you are speculating on mean reversion.
[
Settings:
MA Period = Period of a moving average. Price deviations will be relative to this moving average, so as the value is larger, you will catch more significant price deviations and vice versa
Percentage Trigger = Specifies what percentage do you consider as significant.
ATR Period = Settings for a SuperTrend. Specifies a period of an ATR indicator. I like to use values 22 or 34. As the value is higher, the indicator will be generally less sensitive
ATR Multiplier = Also specifies a sensitivity of SuperTrend. As the value is higher, the SuperTrend is going to be less sensitive and vice versa
I would personally encourage you to experiment with the indicator first, so you can decide which inputs are the best ones for your style of trading.
Which markets and Time Frame:
This indicator works best on Forex and can be used on any TF.
It is possible to use it also on other instruments, but the settings has to be adjusted more.

Uptrick: MultiTrend Squeeze System**Uptrick: MultiTrend Squeeze System Indicator: The Ultimate Trading Tool for Precision and Versatility 📈🔥**
### Introduction
The MultiTrend Squeeze System is a powerful, multi-faceted trading indicator designed to provide traders with precise buy and sell signals by combining the strengths of multiple technical analysis tools. This script isn't just an indicator; it's a comprehensive trading system that merges the power of SuperTrend, RSI, Volume Filtering, and Squeeze Momentum to give you an unparalleled edge in the market. Whether you're a day trader looking for short-term opportunities or a swing trader aiming to catch longer-term trends, this indicator is tailored to meet your needs.
### Key Features and Unique Aspects
1. **SuperTrend with Dynamic Adjustments 📊**
- **Adaptive SuperTrend Calculation:** The SuperTrend is a popular trend-following indicator that adjusts dynamically based on market conditions. It uses the Average True Range (ATR) to calculate upper and lower bands, which shift according to market volatility. This script takes it further by combining it with the RSI and Volume filtering to provide more accurate signals.
- **Direction Sensitivity:** The SuperTrend here is not static. It adjusts based on the direction of the previous SuperTrend value, ensuring that the indicator remains relevant even in choppy markets.
2. **RSI Integration for Overbought/Oversold Conditions 💹**
- **RSI Calculation:** The Relative Strength Index (RSI) is incorporated to identify overbought and oversold conditions, adding an extra layer of precision. This helps in filtering out false signals and ensuring that trades are taken only in optimal conditions.
- **Customizable RSI Settings:** The RSI settings are fully customizable, allowing traders to adjust the RSI length and the overbought/oversold levels according to their trading style and market.
3. **Volume Filtering for Enhanced Signal Confirmation 📉**
- **Volume Multiplier:** This unique feature integrates volume analysis, ensuring that signals are only generated when there is sufficient market participation. The Volume Multiplier can be adjusted to filter out weak signals that occur during low-volume periods.
- **Optional Volume Filtering:** Traders have the flexibility to turn the volume filter on or off, depending on their preference or market conditions. This makes the indicator versatile, allowing it to be used across different asset classes and market conditions.
4. **Squeeze Momentum Indicator (SMI) for Market Pressure Analysis 💥**
- **Squeeze Detection:** The Squeeze Momentum Indicator detects periods of market compression and expansion. This script goes beyond the traditional Bollinger Bands and Keltner Channels by incorporating true range calculations, offering a more nuanced view of market momentum.
- **Customizable Squeeze Settings:** The lengths and multipliers for both Bollinger Bands and Keltner Channels are customizable, giving traders the flexibility to fine-tune the indicator based on their specific needs.
5. **Visual and Aesthetic Customization 🎨**
- **Color-Coding for Clarity:** The indicator is color-coded to make it easy to interpret signals. Bullish trends are marked with a vibrant green color, while bearish trends are highlighted in red. Neutral or unconfirmed signals are displayed in softer tones to reduce noise.
- **Histogram Visualization:** The primary trend direction and strength are displayed as a histogram, making it easy to visualize the market's momentum at a glance. The height and color of the bars provide immediate feedback on the strength and direction of the trend.
6. **Alerts for Real-Time Trading 🚨**
- **Custom Alerts:** The script is equipped with custom alerts that notify traders when a buy or sell signal is generated. These alerts can be configured to send notifications through various channels, including email, SMS, or directly to the trading platform.
- **Immediate Reaction:** The alerts are triggered based on the confluence of SuperTrend, RSI, and Volume signals, ensuring that traders are notified only when the most robust trading opportunities arise.
7. **Comprehensive Input Customization ⚙️**
- **SuperTrend Settings:** Adjust the ATR length and factor to control the sensitivity of the SuperTrend. This allows you to adapt the indicator to different market conditions, whether you're trading a volatile cryptocurrency or a more stable stock.
- **RSI Settings:** Customize the RSI length and thresholds for overbought and oversold conditions, enabling you to tailor the indicator to your specific trading strategy.
- **Volume Settings:** The Volume Multiplier and the option to toggle the volume filter provide an additional layer of customization, allowing you to fine-tune the indicator based on market liquidity and participation.
- **Squeeze Momentum Settings:** The lengths and multipliers for Bollinger Bands and Keltner Channels can be adjusted to detect different levels of market compression, providing flexibility for both short-term and long-term traders.
### How It Works: A Deep Dive Into the Mechanics 🛠️
1. **SuperTrend Calculation:**
- The SuperTrend is calculated using the ATR, which measures market volatility. The indicator creates upper and lower bands around the price, adjusting these bands based on the current level of market volatility. The direction of the trend is determined by the position of the price relative to these bands.
- The script enhances the standard SuperTrend by ensuring that the bands do not flip-flop too quickly, reducing the chances of false signals in a choppy market. The direction is confirmed by checking the position of the close relative to the previous band, making the trend detection more reliable.
2. **RSI Integration:**
- The RSI is calculated over a customizable length and compared to user-defined overbought and oversold levels. When the RSI crosses below the oversold level, and the SuperTrend indicates a bullish trend, a buy signal is generated. Conversely, when the RSI crosses above the overbought level, and the SuperTrend indicates a bearish trend, a sell signal is triggered.
- The combination of RSI with SuperTrend ensures that trades are only taken when there is a strong confluence of signals, reducing the chances of entering trades during weak or indecisive market phases.
3. **Volume Filtering:**
- The script calculates the average volume over a 20-period simple moving average. The volume filter ensures that buy and sell signals are only valid when the current volume exceeds a multiple of this average, which can be adjusted by the user. This feature helps filter out weak signals that might occur during low-volume periods, such as just before a major news event or during after-hours trading.
- The volume filter is particularly useful in markets where volume spikes are common, as it ensures that signals are only generated when there is significant market interest in the direction of the trend.
4. **Squeeze Momentum:**
- The Squeeze Momentum Indicator (SMI) adds a layer of market pressure analysis. The script calculates Bollinger Bands and Keltner Channels, detecting when the market is in a "squeeze" — a period of low volatility that typically precedes a significant price move.
- When the Bollinger Bands are inside the Keltner Channels, the market is in a squeeze (compression phase). This is often a precursor to a breakout or breakdown. The script colors the histogram bars black during this phase, indicating a potential for a strong move. Once the squeeze is released, the bars are colored according to the direction of the SuperTrend, signaling a potential entry point.
5. **Integration and Signal Generation:**
- The script brings together the SuperTrend, RSI, Volume, and Squeeze Momentum to generate highly accurate buy and sell signals. A buy signal is triggered when the SuperTrend is bullish, the RSI indicates oversold conditions, and the volume filter confirms strong market participation. Similarly, a sell signal is generated when the SuperTrend is bearish, the RSI indicates overbought conditions, and the volume filter is met.
- The combination of these elements ensures that the signals are robust, reducing the likelihood of entering trades during weak or indecisive market conditions.
### Practical Applications: How to Use the MultiTrend Squeeze System 📅
1. **Day Trading:**
- For day traders, this indicator provides quick and reliable signals that can be used to enter and exit trades multiple times within a day. The volume filter ensures that you are trading during the most liquid times of the day, increasing the chances of successful trades. The Squeeze Momentum aspect helps you catch breakouts or breakdowns, which are common in intraday trading.
2. **Swing Trading:**
- Swing traders can use the MultiTrend Squeeze System to identify longer-term trends. By adjusting the ATR length and factor, you can make the SuperTrend more sensitive to catch longer-term moves. The RSI and Squeeze Momentum aspects help you time your entries and exits, ensuring that you get in early on a trend and exit before it reverses.
3. **Scalping:**
- For scalpers, the quick signals provided by this system, especially in combination with the volume filter, make it easier to take small profits repeatedly. The histogram bars give you a clear visual cue of the market's momentum, making it easier to scalp effectively.
4. **Position Trading:**
- Even position traders can benefit from this indicator by using it to confirm long-term trends. By adjusting the settings to less sensitive parameters, you can ensure that you are only entering trades when a strong trend is confirmed. The Squeeze Momentum indicator will help you stay in the trade during periods of consolidation, waiting for the next big move.
### Conclusion: Why the MultiTrend Squeeze System is a Game-Changer 🚀
The MultiTrend Squeeze System is not just another trading indicator; it’s a comprehensive trading strategy encapsulated within a single script. By combining the power
of SuperTrend, RSI, Volume Filtering, and Squeeze Momentum, this indicator provides a robust and versatile tool that can be adapted to various trading styles and market conditions.
**Why is it Unique?**
- **Multi-Dimensional Analysis:** Unlike many other indicators that rely on a single data point or calculation, this script incorporates multiple layers of analysis, ensuring that signals are based on a confluence of factors, which increases their reliability.
- **Customizability:** The vast range of input settings allows traders to tailor the indicator to their specific needs, whether they are trading forex, stocks, cryptocurrencies, or commodities.
- **Visual Clarity:** The color-coded bars, labels, and signals make it easy to interpret the market conditions at a glance, reducing the time needed to make trading decisions.
Whether you are a novice trader or an experienced market participant, the MultiTrend Squeeze System offers a powerful toolset to enhance your trading strategy, reduce risk, and maximize your potential returns. With its combination of trend analysis, momentum detection, and volume filtering, this indicator is designed to help you trade with confidence and precision in any market condition.

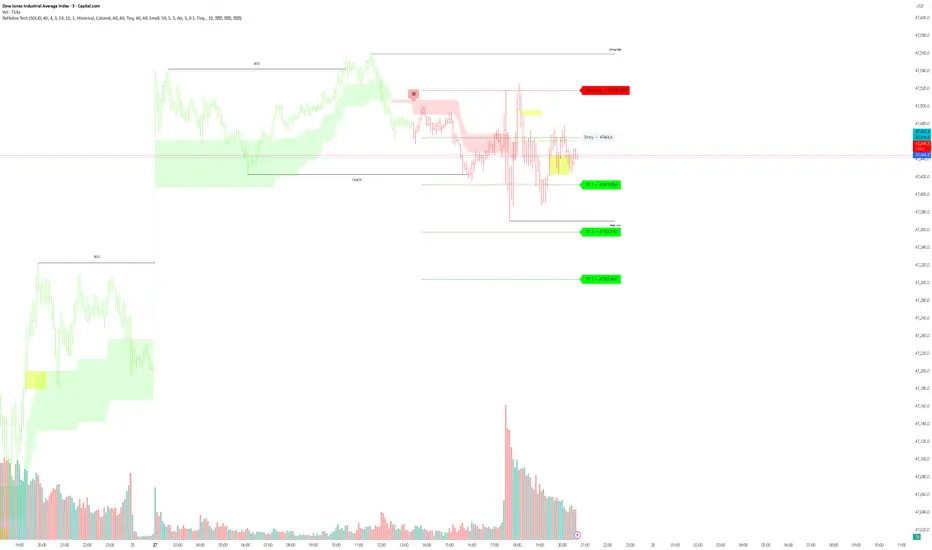
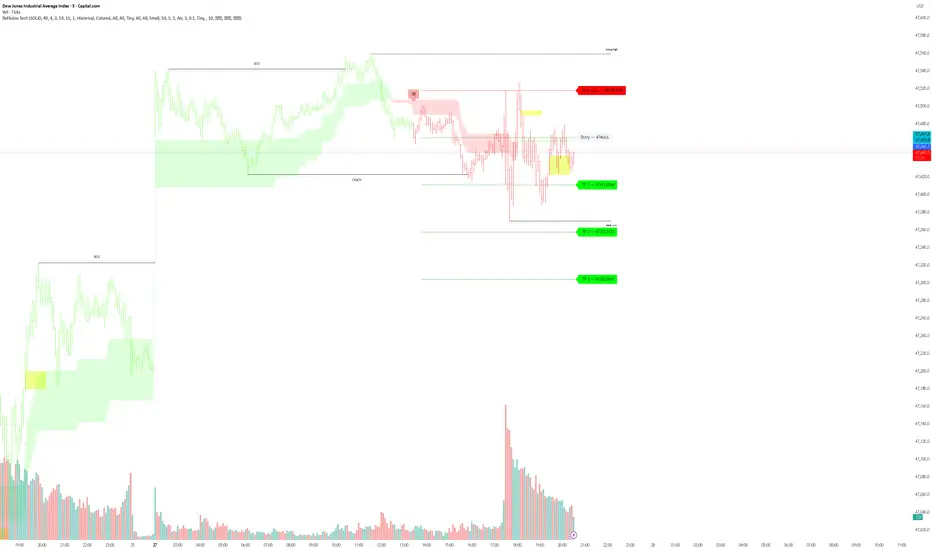
Strong Candle and Probability Levels Light [SYNC & TRADE]Indicator Description: "Strong Candle and Probability Levels Light "
Core Philosophy: This indicator is not just a collection of random signals. It is a complete trading system built around two core concepts: Strength (Volume-based Candles) and Probability (Fibonacci Levels), synchronized between spot and futures markets to filter out noise and manipulations.
🎯 The "Strong Candle Defense" Strategy
The primary tactic is to enter in the direction of the market's dominant force at an optimal price.
1. Identifying Strength: The indicator identifies "Strong Candles" in real-time — candles with anomalously high volume and significant delta (buyer/seller dominance), confirmed across multiple timeframes. They are marked with circles (blue for bullish, red for bearish) and Z-level labels showing the statistical significance of the move.
2. "Ladder" Entry: We do not chase the market. The strategy is to wait for a pullback (retest) to the body of the strong candle or its key internal Fibonacci levels (38.2%, 50%, 61.8%) for a favorable entry. The position is built in parts ("scaling in") as the bounce is confirmed.
3. Profit-Taking Targets: The main take-profit targets are set at the external Fibonacci extension levels:
First Target: 161.8% — The classic level to secure the first portion of profits.
Second Target: 261.8% (or 227% in Light mode) — The level for capturing extended moves, where the remaining position is exited.
Refined Stop-Loss Rules and Strategy Invalidation Conditions:
Primary Stop-Loss: Placed beyond the extreme of the strong candle (the Fibonacci grid's 0% level). For a long position — below the strong candle's low; for a short position — above its high.
Strategy Invalidation Criterion: The strategy is considered invalidated, and the position should be exited, if the price closes a candle's body beyond the key protective level. This specifically means:
For a Long: A candle closes (the close price) below the low of the strong candle.
For a Short: A candle closes (the close price) above the high of the strong candle.
This criterion, especially on lower timeframes, provides a stricter and more timely signal of a setup failure than a mere wick break.
Alternative Supertrend Stop-Loss: The proprietary Supertrend line can be used as a dynamic trailing stop. The stop-loss is placed behind the Supertrend line, and a candle close beyond this line also signals a trend violation and the need to exit the position.
📊 Unique Automated Fibonacci Grids
Our Fibonacci grids are not the standard, static drawing tool. They are a dynamic profit-taking and management system.
Automatic Plotting: A new grid is automatically drawn on every new strong candle, freeing the trader from manual work.
Smart Management:
Self-Cleaning: When enabled, the grid automatically removes itself after the price has fully "filled" its range (reached the 0% level), preventing chart clutter.
Dynamic Levels: Depending on the selected type (Fibonacci Light, Standard, Extended, Geometric), a different set of internal and external levels is plotted, adapting the tool to various trading styles from scalping to position trading.
Key Difference from Standard Tools: Unlike the basic Fibonacci tool, our grids are an integral part of the trading logic. They are tied to strong candles (high-probability points), update automatically, and act as an execution system for the strategy, not just an analysis tool.
📈 Proprietary Supertrend with Advanced Filtering
We do not use the standard, off-the-shelf Supertrend. Our version is a hybrid algorithm, supercharged with volume analysis.
Dynamic ATR Multiplier: The indicator's multiplier adapts to market conditions. During high volume delta (strong buying/selling pressure), the multiplier increases, making the trend line less sensitive and helping you stay in the trade during strong impulses.
Strong Candle Filter: Supertrend signal changes can be optionally restricted to confirm only on strong candles. This drastically reduces false entries. The trend doesn't change just based on volatility (ATR), but upon confirmation by real strength (volume).
Profit Potential: Combining signals from this filtered Supertrend with the "Strong Candle Defense" strategy allows for precise entry timing in the direction of the major trend, with clear and statistically sound profit targets.
⚙️ Additional Systems for Enhanced Accuracy
Spot & Futures Sync: The indicator compares strength between spot and futures markets. A divergence (e.g., a strong long candle on spot but weakness on futures) is marked as a potential "Manipulation" (X), warning you of an unreliable signal.
Multi-Timeframe Volume Analysis: Delta and volume are analyzed from lower timeframes, providing a more granular picture within a single candle of your current TF.
Supertrend Table: A quick overview of the trend direction across all major timeframes (from 5m to 1W) in a single table.
Conclusion:
The "Strong Candle and Probability Levels Light" indicator is a professional suite for traders who want to trade not just signals, but probabilities. The strategy, built around defending strong candles, combined with unique automated Fibonacci grids and an adaptive Supertrend, provides a clear plan from entry to exit. The use of market synchronization and multi-timeframe volume analysis minimizes noise and false signals, allowing you to focus on high-quality setups.

eFkolos Tech IndicatorMachine learning-enhanced SuperTrend indicator that uses k-means clustering to adaptively optimize SuperTrend parameters based on historical performance. Let me break down what makes this unique:
Key Innovation
Instead of using a single fixed SuperTrend factor, this indicator:
Calculates multiple SuperTrends simultaneously (with factors from 1 to 5 by default, stepped at 0.5)
Tracks performance of each variant using exponential smoothing
Clusters them into 3 groups (Best/Average/Worst) using k-means algorithm
Adapts by selecting the average factor from your chosen cluster
Clever Technical Aspects
Performance Metric: Uses a smart approach where performance = EMA of (price_change × signal_direction), giving positive values when the SuperTrend correctly predicts direction.
K-means Implementation: Properly initializes centroids using quartiles and iterates until convergence - this is solid unsupervised learning.
Adaptive MA Layer: The perf_ama that adapts faster when the performance index is high (more confidence) and slower when low.
Memory Management: Uses UDTs (User Defined Types) efficiently with arrays to handle multiple SuperTrend instances.
eFkolos TechMachine learning-enhanced SuperTrend indicator that uses k-means clustering to adaptively optimize SuperTrend parameters based on historical performance. Let me break down what makes this unique:
Key Innovation
Instead of using a single fixed SuperTrend factor, this indicator:
Calculates multiple SuperTrends simultaneously (with factors from 1 to 5 by default, stepped at 0.5)
Tracks performance of each variant using exponential smoothing
Clusters them into 3 groups (Best/Average/Worst) using k-means algorithm
Adapts by selecting the average factor from your chosen cluster
Clever Technical Aspects
Performance Metric: Uses a smart approach where performance = EMA of (price_change × signal_direction), giving positive values when the SuperTrend correctly predicts direction.
K-means Implementation: Properly initializes centroids using quartiles and iterates until convergence - this is solid unsupervised learning.
Adaptive MA Layer: The perf_ama that adapts faster when the performance index is high (more confidence) and slower when low.
Memory Management: Uses UDTs (User Defined Types) efficiently with arrays to handle multiple SuperTrend instances.
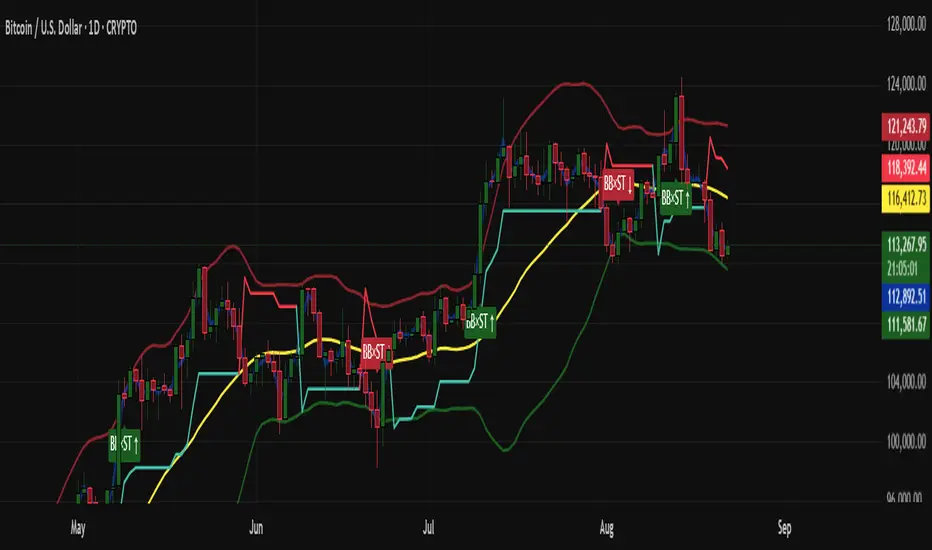
BandBreak Pro (BB×ST×SRC) — Live-Sync Indicator📌 Overview
BandBreak Pro is a volatility + trend confirmation indicator designed to provide traders with clean breakout signals.
It synchronizes Bollinger Bands (BB), a selectable SRC line (price source), and Super trend (ST) into one unified logic.
⚡ Signals only trigger when price breaks the Bollinger Bands and the Super trend confirms the same direction.
📖 Basics & Definitions
1. Bollinger Bands (BB)
Bollinger Bands measure volatility by building an envelope around price.
Middle line (Basis) = Simple Moving Average (SMA).
Upper Band = SMA + (Multiplier × Standard Deviation).
Lower Band = SMA – (Multiplier × Standard Deviation).
👉 Meaning: A break above the upper band often suggests bullish strength, while a break below the lower band suggests bearish momentum.
2. SRC Line (Source Line)
The SRC line is a chosen price input: close, hlc3, or ohlc4.
It acts as the backbone since both BB and ST derive from it.
Benefit: Ensures everything is perfectly synchronized and avoids repainting issues.
3. Super trend (ST)
Supertrend is an ATR (Average True Range) based trend filter.
If price is above the ST line → Uptrend (Green).
If price is below the ST line → Downtrend (Red).
👉 Meaning: ST is a simple yet powerful filter to confirm trend direction and reduce false breakouts.
📌 CONCEPTS (with Calculations)
Hybrid Sync (History vs Realtime)
History: All calculations use confirmed OHLC via request.security (no lookahead) → no repaint.
Realtime: (if ON) calculations follow live chart OHLC → what you see is what you get.
Strict No-Repaint: Forces realtime bar to also use confirmed OHLC values.
👉 Formula:
if strict = true → use confirmed OHLC only
else if realtime and followChart = true → use chart OHLC
else → use confirmed OHLC
SRC Line (Selected Source)
User can select close, hlc3 = (high+low+close)/3, or ohlc4 = (open+high+low+close)/4.
This SRC drives Bollinger Bands and Supertrend.
👉 Formula:
SRC = close | hlc3 | ohlc4 (user choice)
Bollinger Bands (BB Break Logic)
Basis:
Basis = SMA(SRC, Length)
Standard Deviation:
Dev = StDev(SRC, Length)
Bands:
Upper = Basis + (Multiplier × Dev)
Lower = Basis - (Multiplier × Dev)
Breakout Filter:
UpBB = Upper × (1 + Buffer%)
DnBB = Lower × (1 – Buffer%)
👉 Meaning: Breakouts only count when price crosses filtered bands.
Supertrend (Directional Filter)
True Range:
TR = max(High – Low, |High – PrevClose|, |Low – PrevClose|)
ATR:
ATR = RMA(TR, ST_Length)
Bands:
BasicUp = (High+Low)/2 + (ST_Factor × ATR)
BasicDn = (High+Low)/2 – (ST_Factor × ATR)
Final Line (flip logic):
If Close > PrevUp → Trend = UP → use Dn line
If Close < PrevDn → Trend = DOWN → use Up line
Signal Formation (Confirmed Bar Only)
Long Condition:
Long = crossover(SRC, UpBB) AND Supertrend = UP
Short Condition:
Short = crossunder(SRC, DnBB) AND Supertrend = DOWN
Validation: Signals trigger only on barstate.isconfirmed (bar close).
🛠️ FEATURES
Clean, synced plots: Bollinger Bands, Basis line, SRC line, Supertrend line.
Hybrid sync modes: live-follow or strict no-repaint.
Bollinger controls: length, multiplier, buffer %, show/hide.
Supertrend controls: enable, ATR length, factor, show/hide.
Signal labels: BB×ST ↑ and BB×ST ↓.
Alerts: Built-in LONG/SHORT ready to use.
Overlay = true; optimized for intraday with higher label capacity.
📊 HOW TO USE
Timeframes: 5m–1H intraday; 2H–1D for swing trades.
Markets: Crypto, Forex, Indices, Equities.
Workflow:
Keep chart clean with only BandBreak Pro.
Start BB = 20 length, 2.0 multiplier. Use buffer 0.25–0.75% in choppy pairs.
Keep Supertrend ON to reduce false signals. Lower factor = faster flips.
After breakout, manage trades using S/R or BB midline.
SL = opposite ST line, TP = midline or nearest support/resistance.
⚠️ LIMITATIONS
Ranging markets may produce whipsaws.
Strict mode = safest but slower signals.
Not a strategy → no backtesting/PnL.
Parameters must be tuned for volatile/illiquid assets.
Always use with risk management.
🔔 ALERTS
BB×ST LONG → SRC crosses above upper band + ST = UP.
BB×ST SHORT → SRC crosses below lower band + ST = DOWN.
👉 Recommended: “Once Per Bar Close”.
NOTES
Buffer % = micro filter, useful for high-volatility assets.
Higher ST factor = fewer flips, more trend fidelity.
Lower ST factor = faster flips, more frequent signals.
🌟 Why BandBreak Pro is Unique
✅ Both BB and ST are calculated from the same hybrid OHLC SRC source → perfectly aligned & repaint-free.
✅ Only issues dual-confirmation signals → fewer false breakouts.
✅ Beginner-friendly (clear definitions included) + Pro-level customization (buffer %, sync modes).
✅ Multi-market: Crypto, Forex, Indices, Stocks.
🙏 Thanks
Bollinger Bands = John Bollinger’s volatility framework.
Supertrend = ATR-based classic TA tool.
SRC + Hybrid Sync = original implementation adapted for TradingView.
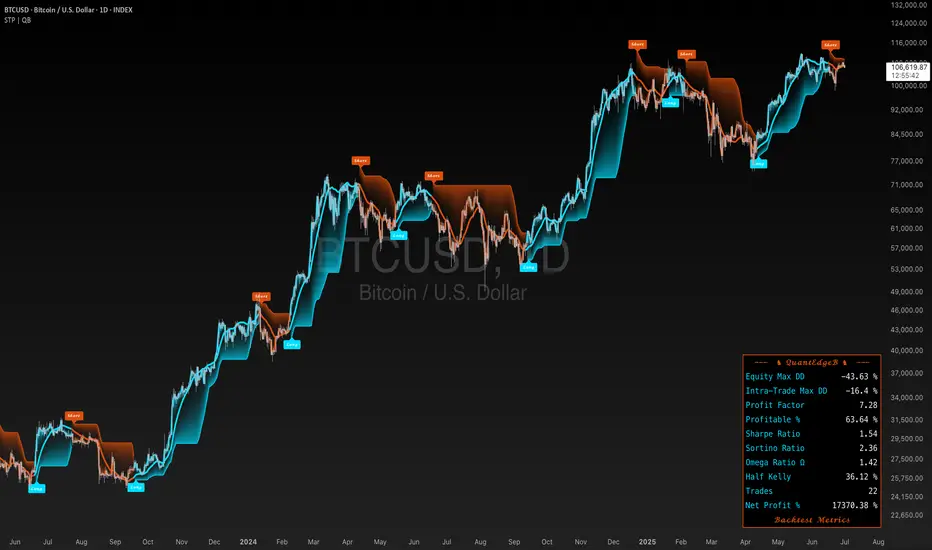
SigmaTrend Prime | QuantEdgeBIntroducing SigmaTrend Prime (STP) by QuantEdgeB
🛠️ Overview
SigmaTrend Prime (STP) is an advanced trend-following indicator that combines double exponential moving averages (DEMA) with a volatility-adjusted SuperTrend framework.
Unlike traditional ATR-based SuperTrends, STP dynamically adjusts trend thresholds using a standard deviation filter derived from price percentiles. This ensures that the trend signals remain highly adaptive, filtering out short-term noise while maintaining robustness across different market conditions.
By leveraging a DEMA core, STP minimizes lag while preserving strong trend identification, making it a powerful tool for traders looking to capture directional moves with enhanced precision.
_____
✨ Key Features
🔹 DEMA-Driven Trend Filtering
SigmaTrend Prime minimizes lag and enhances responsiveness using a double exponential moving average (DEMA) core.
🔹 Volatility-Adaptive SuperTrend
STP applies a percentile-based price smoothing technique, ensuring that the trend filter dynamically adjusts to market conditions.
🔹 Standard Deviation (SD) Filtering for Noise Reduction
By applying a rolling standard deviation derived from smoothed price action, STP eliminates false breakouts and enhances trend clarity.
🔹 Customizable Visual & Signal Settings
Includes multiple color modes, backtest metrics, and signal labels, making it highly adaptable for different trading styles.
📊 How It Works
1️⃣ DEMA-Based Trend Smoothing
SigmaTrend Prime uses DEMA (Double Exponential Moving Average) as its trend foundation, offering a smoother and more responsive trend structure:
🔹 Why DEMA?
✔ Minimizes lag compared to standard EMA.
✔ Maintains trend sensitivity while reducing market noise.
✔ Stronger confirmation of directional moves in volatile environments.
2️⃣ Adaptive Volatility Filtering with Standard Deviation (SD)
Unlike conventional SuperTrend indicators that rely on ATR for trend filtering, SigmaTrend Prime applies an SD-based smoothing mechanism.
📌 How it Works?
✔ Price Percentile Calculation → Uses percentile price ranking for better trend representation.
✔ Rolling Standard Deviation Calculation → Applies a volatility-adjusted filter to prevent false signals.
✔ Dynamic Trend Band Expansion → Factors (Factor1 & Factor2) multipliers to adjust trend sensitivity based on current price behavior.
🔹 Why SD-Based Filtering?
✔ More adaptive to different volatility regimes.
✔ Improves trend accuracy in both trending and ranging markets.
✔ Avoids excessive whipsaws common with ATR-based models.
3️⃣ Signal Generation & Trend Confirmation
SigmaTrend Prime detects trend shifts based on SD-filtered breakouts:
✅ Long Signal → Triggered when price crosses above the SuperTrend upper band.
❌ Short Signal → Triggered when price crosses below the SuperTrend lower band.
📌 Additional Features:
✔ Adaptive Signal Labels → Shows "Long" or "Short" trade signals dynamically.
✔ Trend-Following Mode → Stays in position until a confirmed reversal signal occurs.
✔ Customizable Sensitivity → Traders can adjust Factor1 & Factor2 multipliers and other settings to refine signal responsiveness.
👥 Who Should Use It?
✅ Trend Traders & Momentum Followers → Identify strong directional trends with greater accuracy.
✅ Swing & Position Traders → Gain precise trend confirmation signals for optimized entries/exits.
✅ Volatility-Aware Traders → Benefit from adaptive trend filtering based on real-time market conditions.
✅ Systematic & Quant Traders → Implement STP within automated trading systems for improved trend detection.
⚙️ Customization & Default Settings
🔧 Key Custom Inputs:
• DEMA Source (Default: HLC3) → Defines the price input for DEMA calculations.
• DEMA Length (Default: 30) → Controls the smoothing period for trend calculation.
• Percentile SD Length (Default: 10) → Determines historical percentile ranking for volatility
assessment.
• Volatility SD Length (Default: 30) → Defines rolling SD length for dynamic filtering.
• Trend Sensitivity Factors:
🔹 Factor1 (Default: 25) → Adjusts lower SD band responsiveness.
🔹 Factor2 (Default: 40) → Controls upper SD band expansion.
• Visual Customizations → Multiple color modes, backtest metrics, and trend labels available.
🚀 By default, STP is optimized for adaptive trend-following while remaining flexible for customization.
_____
📌 How to Use SigmaTrend Prime in Trading
1️⃣ Trend-Following Strategy (Momentum Confirmation)
✔ Enter long positions when STP confirms a bullish trend shift above its upper trend band.
✔ Enter short positions when STP confirms a bearish trend shift below its lower trend band.
✔ Stay in trades as long as STP maintains trend direction, filtering out false reversals.
2️⃣ Volatility-Adaptive Strategy (Dynamic Trend Adjustments)
✔ Use Factor1 & Factor2 adjustments to fine-tune STP’s sensitivity to price movements.
✔ Increase Factor1 for slower trend shifts and reduce Factor2 for more aggressive trend detection.
📌 Why?
• In high-volatility conditions, adjust trend bands wider to prevent whipsaws.
• In low-volatility conditions, tighten trend bands for faster signal responsiveness.
_____
📊 Backtest Mode
SigmaTrend Prime includes an optional backtest table, enabling traders to assess its historical effectiveness before applying it in live trading conditions.
🔹 Backtest Metrics Displayed:
• Equity Max Drawdown → Largest historical loss from peak equity.
• Profit Factor → Ratio of total profits to total losses, measuring system efficiency.
• Sharpe Ratio → Assesses risk-adjusted return performance.
• Sortino Ratio → Focuses on downside risk-adjusted returns.
• Omega Ratio → Evaluates return consistency & performance asymmetry.
• Half Kelly → Optimal position sizing based on risk/reward analysis.
• Total Trades & Win Rate → Assess STP’s historical success rate.
📌 Disclaimer:
Backtest results are based on past performance and do not guarantee future success. Always incorporate real-time validation and risk management in live trading.
🚀 Why This Matters?
✅ Strategy Validation → Gain insight into historical trend accuracy.
✅ Customization Insights → See how different STP settings impact performance.
✅ Risk Awareness → Understand potential drawdowns before deploying capital.
_____
📌 Conclusion
SigmaTrend Prime (STP) is an advanced trend-following solution that merges DEMA-based trend smoothing with standard deviation-adaptive filtering. By utilizing percentile-based price smoothing, STP enhances trend accuracy while ensuring that signals remain adaptive to different market environments.
🔹 Key Takeaways:
1️⃣ Lag-Minimized Trend Filtering – DEMA enhances trend responsiveness while reducing noise.
2️⃣ SD-Based Volatility Adaptation – More reliable than ATR-based trend models, reducing false breakouts.
3️⃣ Customizable & Dynamic – Easily fine-tune sensitivity settings for various market conditions.
📌 Master the market with precision and confidence | QuantEdgeB
🔹 Disclaimer: Past performance is not indicative of future results. No trading strategy can guarantee success in financial markets.
🔹 Strategic Advice: Always backtest, optimize, and align parameters with your trading objectives and risk tolerance before live trading.
Asset Rotation System [InvestorUnknown]Overview
This system creates a comprehensive trend "matrix" by analyzing the performance of six assets against both the US Dollar and each other. The objective is to identify and hold the asset that is currently outperforming all others, thereby focusing on maintaining an investment in the most "optimal" asset at any given time.
- - - Key Features - - -
1. Trend Classification:
The system evaluates the trend for each of the six assets, both individually against USD and in pairs (assetX/assetY), to determine which asset is currently outperforming others.
Utilizes five distinct trend indicators: RSI (50 crossover), CCI, SuperTrend, DMI, and Parabolic SAR.
Users can customize the trend analysis by selecting all indicators or choosing a single one via the "Trend Classification Method" input setting.
2. Backtesting:
Calculates an equity curve for each asset and for the system itself, which assumes holding only the asset deemed optimal at any time.
Customizable start date for backtesting; by default, it begins either 5000 bars ago (the maximum in TradingView) or at the inception of the youngest asset included, whichever is shorter. If the youngest asset's history exceeds 5000 bars, the system uses 5000 bars to prevent errors.
The equity curve is dynamically colored based on the asset held at each point, with this coloring also reflected on the chart via barcolor().
Performance metrics like returns, standard deviation of returns, Sharpe, Sortino, and Omega ratios, along with maximum drawdown, are computed for each asset and the system's equity curve.
3 Alerts:
Supports alerts for when a new, confirmed optimal asset is identified. However, due to TradingView limitations, the specific asset cannot be included in the alert message.
- - - Usage - - -
1. Select Assets/Tickers:
Choose which assets or tickers you want to include in the rotation system. Ensure that all selected tickers are denominated in USD to maintain consistency in analysis.
2. Configure Trend Classification:
Decide on the trend classification method from the available options (RSI, CCI, SuperTrend, DMI, or Parabolic SAR, All) and adjust the settings to your preferences. This customization allows you to tailor the system to different market conditions or your specific trading strategy.
3. Utilize Backtesting for Calibration:
Use the backtesting results, including equity curves and performance metrics, to fine-tune your chosen trend indicators.
Be cautious not to overemphasize performance maximization, as this can lead to overfitting. The goal is to achieve a robust system that performs well across various market conditions, rather than just optimizing for past data.
- - - Parameters - - -
Tickers:
Asset 1: Select the symbol for the first asset.
Asset 2: Select the symbol for the second asset.
Asset 3: Select the symbol for the third asset.
Asset 4: Select the symbol for the fourth asset.
Asset 5: Select the symbol for the fifth asset.
Asset 6: Select the symbol for the sixth asset.
General Settings:
Trend Classification Method: Choose from RSI, CCI, SuperTrend, DMI, PSAR, or "All" to determine how trends are analyzed.
Use Custom Starting Date for Backtest: Toggle to use a custom date for beginning the backtest.
Custom Starting Date: Set the custom start date for backtesting.
Plot Perf. Metrics Table: Option to display performance metrics in a table on the chart.
RSI (Relative Strength Index):
RSI Source: Choose the price data source for RSI calculation.
RSI Length: Set the period for the RSI calculation.
CCI (Commodity Channel Index):
CCI Source: Select the price data source for CCI calculation.
CCI Length: Determine the period for the CCI.
SuperTrend:
SuperTrend Factor: Adjust the sensitivity of the SuperTrend indicator.
SuperTrend Length: Set the period for the SuperTrend calculation.
DMI (Directional Movement Index):
DMI Length: Define the period for DMI calculations.
Parabolic SAR:
PSAR Start: Initial acceleration factor for the Parabolic SAR.
PSAR Increment: Increment value for the acceleration factor.
PSAR Max Value: Maximum value the acceleration factor can reach.
Notes/Recommendations:
While this system is operational, it's important to recognize that it relies on "basic" indicators, which may not be ideal for generating trading signals on their own. I strongly suggest that users delve into the code to grasp the underlying logic of the system. Consider customizing it by integrating more sophisticated and higher-quality trend-following indicators to enhance its performance and reliability.
Disclaimer:
This system's backtest results are historical and do not predict future performance. Use for educational purposes only; not investment advice.

DILM TRADING - Market Sentiment and FibonacciDILM TRADING - Market Sentiment and Fibonacci
Overview
The DILM TRADING - Market Sentiment and Fibonacci indicator is designed to provide traders with a comprehensive view of market trends and potential trading opportunities. By combining several popular technical indicators such as the SuperTrend, Fibonacci levels, and multiple sentiment indicators, this tool offers a deep analysis of market dynamics. Each component has been carefully selected to work in harmony, providing users with reliable entry and exit signals and helping them navigate volatile markets.
Why This Combination?
This indicator brings together different elements with specific purposes:
SuperTrend: A trend-following indicator that helps identify the market's current direction and acts as a dynamic stop-loss tool.
Fibonacci Levels: Known for pinpointing potential market reversal points, these levels provide crucial support and resistance areas for traders to set stop-losses and take-profits.
Sentiment Indicators: Tools like RSI, MACD, and Ichimoku are combined to gauge market momentum, allowing traders to assess whether a market is overbought or oversold, and whether the current trend is strong enough to continue or reverse.
The combination of these indicators gives traders a complete framework for analyzing the market: trend direction, market sentiment, and key price levels. Each of these elements works in tandem to provide signals that are both timely and accurate.
Key Features
SuperTrend
Based on the Average True Range (ATR), the SuperTrend indicator is an excellent way to determine the current trend. If the price is above the SuperTrend line, it suggests an uptrend, whereas if the price is below it, a downtrend is indicated. It is also a highly effective tool for setting trailing stop-losses, thereby improving risk management.
Fibonacci Levels
The script automatically calculates Fibonacci retracement levels based on the highest and lowest points within a specific timeframe. These levels are essential for identifying potential reversal zones, key areas for stop-losses, and take-profit levels. The levels adjust according to the prevailing trend, making them a dynamic and responsive tool for any market condition.
Sentiment Indicators
This section integrates multiple sentiment indicators to give a holistic view of market direction:
Ichimoku Cloud: Measures the strength of trends and identifies potential reversal zones using clouds (Kumo).
OBV (On-Balance Volume): Tracks volume changes to confirm the direction of price movements.
CMF (Chaikin Money Flow): Monitors the money flow to identify buying or selling pressure.
RSI (Relative Strength Index): Highlights overbought or oversold conditions, signaling potential trend reversals.
MACD: A reliable tool for identifying bullish and bearish crossovers.
ADX (Average Directional Index): Determines the strength of the prevailing trend, helping to confirm whether it's likely to continue or weaken.
Volatility Filter
The ATR (Average True Range) acts as a filter to identify periods of high or low volatility, helping traders to adapt their strategies to the current market environment. High volatility suggests larger price swings, potentially offering better trading opportunities, while low volatility indicates consolidation or range-bound conditions.
Order Blocks
The script visually identifies bullish and bearish order blocks on the chart. These zones represent areas where significant buying or selling occurred, making them crucial for spotting potential breakout or reversal points.
How to Use
Entry/Exit: Fibonacci levels (50% or 61.8%) serve as potential entry points, while the 0% and 100% levels can be used to set take-profit and stop-loss levels.
Sentiment Analysis: The overall market sentiment is derived from the combination of Ichimoku, OBV, CMF, RSI, ADX, and other tools, helping traders make informed decisions on whether to buy or sell.
Risk Management: Use SuperTrend and Fibonacci levels to set precise stop-loss points and improve risk management.
New Feature: Moving Average and RSI Confirmation
A recent addition allows users to calculate two moving averages (short and long) and the RSI on a timeframe of their choice. An entry signal is generated when the short moving average crosses above the long, and the RSI is below a specific threshold. Conversely, a sell signal is displayed when the short moving average crosses below the long, and the RSI is above a defined level.
Limitations
This indicator may be less effective during periods of low volatility or range-bound markets. It's important to use this tool in conjunction with other analysis techniques, as relying on a single indicator could lead to false signals.
DILM TRADING - Sentiment de marché et Fibonacci
Vue d'ensemble
L'indicateur DILM TRADING - Sentiment de marché et Fibonacci a été conçu pour offrir une vue d'ensemble des tendances du marché et des opportunités de trading potentielles. En combinant plusieurs indicateurs techniques populaires, tels que le SuperTrend, les niveaux de Fibonacci, et divers indicateurs de sentiment, cet outil fournit une analyse complète des dynamiques du marché. Chaque composant a été soigneusement sélectionné pour fonctionner ensemble, offrant des signaux d'entrée et de sortie fiables.
Pourquoi cette combinaison ?
Cette combinaison d'indicateurs permet de fournir un cadre complet pour analyser le marché. Le SuperTrend permet d'identifier la tendance, tandis que les niveaux de Fibonacci aident à déterminer les zones de retournement clés. Les indicateurs de sentiment, comme le RSI et le MACD, ajoutent une dimension supplémentaire en mesurant la force et la direction du marché.
Caractéristiques clés et Utilisation
SuperTrend : Indique la tendance actuelle et propose des niveaux de stop-loss dynamiques.
Niveaux de Fibonacci : Utilisés pour repérer des points de retournement potentiels et définir des niveaux de stop-loss et de take-profit.
Indicateurs de Sentiment : Outils comme l'Ichimoku, le RSI, et l'ADX fournissent une analyse globale du marché, permettant de prendre des décisions éclairées.
Nouvelle fonctionnalité : Confirmation des Moyennes Mobiles et RSI
Cette fonctionnalité permet d'utiliser deux moyennes mobiles et le RSI pour générer des signaux d'achat et de vente basés sur les croisements et les niveaux de surachat/survente du RSI.
Conclusion
Le DILM TRADING - Sentiment de marché et Fibonacci est un outil puissant et polyvalent, conçu pour les traders cherchant à affiner leurs stratégies grâce à une analyse complète des tendances et du sentiment du marché.

KV Box v1.0 - Buy / Sell signalKV BOX is a trading indicator. It combines Darvas box theory (developed by Nicolas Darvas), breakout strategy, multi-timeframe trading and ALMA (Arnaud Legoux Moving Averages). This indicator helps identify BUY signals when the price is in the entry zone and SELL when the price breaks out of the uptrend.
---
How to use?
KV BOX can be used in both SPOT and FUTURE (Long/Short) trading
BUY (LONG):
• Entry: When the BUY signal appears.
• Stop loss: LOWER than LOW of first and second candlestick IN THE BOX WHERE BUY SIGNAL APPEARS of 1H, 4H, 1D timeframe.
• Take profit: When the SELL signal appears.
SELL (SHORT):
• Entry: When the SELL signal appears.
• Stop loss: HIGHER than the HIGH of first and second candlestick IN THE BOX WHERE SELL SIGNAL APPEARS of 1H, 4H, 1D timeframe.
• Take profit: When a BUY signal appears.
---
Attention:
KV BOX is only displayed on 1H, 4H and 1D timeframe. 1H for short-term trades (a few days), 4H for mid-term trades (a few weeks), 1D for long-term trades (weeks to months).
---
Options setting:
- Kelvin box on: KV BOX activates
- ALMA mode on: KV BOX activation according to Arnaud Legoux Moving Average (ALMA) method
- Pinbar indicator: activate the indicator when the pinbar candlestick appears
- Supertrend: trend continuation or reversal indicator
============================
KV BOX là 1 chỉ báo mua / bán kết hợp giữa nguyên lý hộp Darvas, phương pháp phá vỡ (break out), giao dịch đa khung thời gian và đường trung bình ALMA (Arnaud Legoux Moving Averages). Chỉ báo này giúp xác định tín hiệu mua khi giá ở vùng entry và bán khi giá phá vỡ khỏi trend tăng (up trend).
---
Cách sử dụng:
KV box có thể dùng trong giao dịch SPOT và FUTURE (Long/Short).
Mua khi có tín hiệu BUY, bán khi có tín hiệu SELL.
MUA:
• Entry: Khi có tín hiệu BUY.
• Cắt lỗ: thấp hơn giá thấp nhất cùa 2 nến đầu tiên trong hộp xuất hiện tín hiệu BUY của khung 1H, 4H, 1D.
• Chốt lời: Khi có tín hiệu SELL xuất hiện.
BÁN:
• Entry: Khi có tín hiệu SELL.
• Cắt lỗ: cao hơn giá cao nhất của 2 nến đầu tiên trong hộp xuất hiện tín hiệu SELL cùa khung 1H, 4H, 1D.
• Chốt lời: Khi có tín hiệu BUY xuất hiện.
---
Chú ý:
KV BOX chỉ hiển thị trên khung 1H, 4H và 1D. 1H cho giao dịch ngắn hạn (vài ngày), 4H cho giao dịch trung hạn (vài tuần), 1D cho giao dịch dài hạn (vài tuần đến vài tháng).
---
Tùy chọn setting:
- Kelvin box on: kích hoạt KV BOX
- ALMA method on: kích hoạt KV box theo phương pháp Arnaud Legoux Moving Averages (ALMA)
- Pinbar indicator: kích hoạt chỉ báo khi xuất hiện nến pinbar đảo chiều
- Supertrend: chỉ báo xu hướng tiếp diễn hoặc đảo chiều

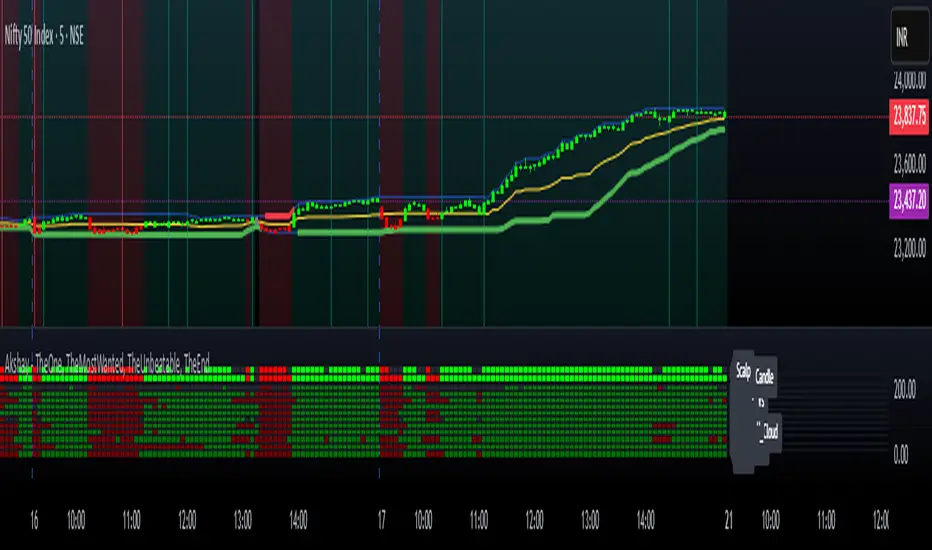
Akshay - TheOne, TheMostWanted, TheUnbeatable, TheEnd➤ All-in-One Solution (❌ No repaint):
This Technical Chart contains, MA24 Condition, Supertrend Indicator, HalfTrend Signal, Ichimoku Cloud Status, Parabolic SAR (P_SAR), First 5-Minute Candle Analysis (ORB5min), Volume-Weighted Moving Average (VWMA), Price-Volume Trend (PVT), Oscillator Composite, RSI Condition, ADX & Trend Strength.
Technicals don't lie.
🚀 Overview and Key Features
Comprehensive Multi-Indicator Approach:
The script is built to be an all-in-one technical indicator on TradingView. It integrates several well-known indicators and overlays—including Supertrend, HalfTrend, Ichimoku Cloud, various moving averages (EMA, SMA, VWMA), oscillators (Klinger, Price Oscillator, Awesome Oscillator, Chaikin Oscillator, Ultimate Oscillator, SMI Ergodic Oscillator, Chande Momentum Oscillator, Detrended Price Oscillator, Money Flow Index), ADX, and Donchian Channels—to create a composite picture of market sentiment.
Signal Generation and Alerts:
It not only calculates these indicators but also aggregates their output into “Master Candle” signals. Vertical lines are drawn on the chart with corresponding alerts to indicate potential buy or sell opportunities based on robust, combined conditions.
Visual Layering:
Through the use of colored histograms, custom candle plots, trend lines, and background color changes, the script offers a multi-layered visual representation of data, providing clarity about both short-term signals and overall market trends.
⚙️ How It Works and Functionality
MA24 Condition:
Uses the 24-period moving average as a proxy; if the price is above it, the bar is colored green, and red if below, with neutrality when conditions aren’t met.
Supertrend Indicator:
Evaluates price relative to the Supertrend level (calculated via ATR), coloring green when price is above it and red when below.
HalfTrend Signal:
Determines trend shifts by comparing the current close to a calculated trend level; green indicates an upward trend, while red suggests a downtrend.
Ichimoku Cloud Status:
Analyzes the relationship between the Conversion and Base lines; a bullish (green) signal is given when price is above both or the Conversion line is higher than the Base line.
Parabolic SAR (P_SAR):
Colors the signal based on whether the current price is above (green) or below (red) the Parabolic SAR marker, indicating stop and reverse conditions.
First 5-Minute Candle Analysis (ORB5min):
Uses key levels from the first 5-minute candle; if price exceeds the candle’s low, VWAP, and MA, it’s bullish (green), otherwise bearish (red).
Volume-Weighted Moving Average (VWMA):
Compares the current price to volume-weighted averages; a price above these levels is shown in green, below in red.
Price-Volume Trend (PVT):
Determines bullish or bearish momentum by comparing PVT to its VWAP—green when above and red when below.
Oscillator Composite:
Aggregates signals from multiple oscillators; a majority of positive results turn it green, while negative dominance results in red.
RSI Condition:
Uses a simple RSI threshold of 50, with values above signifying bullish (green) momentum and below marking bearish (red) conditions.
ADX & Trend Strength:
Reflects overall trend strength through ADX and directional movements; a combination favoring bullish conditions colors it green, with red signaling bearish pressure.
Master Candle Overall Signal:
Combines multiple indicator outputs into one “Master” signal—green for a consensus bullish trend and red for a bearish outlook.
Scalp Signal Variation:
Focused on short-term price changes, this signal adjusts quickly; green indicates improving short-term conditions, while red signals a downturn.
📊 Visualizations and 🎨 User Experience (❌ no repaint)
Dynamic Histograms & Bar Plots:
Each indicator is represented as a colored bar (with added vertical offsets) to facilitate easy comparison of their respective bullish or bearish contributions.
Clear Color-Coding & Labels:
Green (e.g., GreenFluorescent) indicates bullish sentiment.
Red (e.g., RedFluorescent) indicates bearish sentiment.
Custom labels and descriptive text accompany each bar for clarity.
Interactive Charting:
The overall background color adapts based on the “Master Candle” condition, offering an instant read on market sentiment.
The current candlestick is overlaid with color cues to reinforce the indicator’s signal, enhancing the trading experience.
Real-Time Alerts:
Vertical lines appear on signal events (buy/sell triggers), complemented by alerts that help traders stay on top of actionable market moves.
Sharp lines:
The Sharp lines are plotted based upon the EMA5 cross over with the same market trend, marks this as good time to reentry.
🔧 Settings and Customization
Flexible Timeframe Input:
Users can select their preferred timeframe for analysis, making the indicator adaptable to intraday or longer-term trading styles.
Customizable Indicator Parameters:
➤ Supertrend: Adjust ATR length and multiplier factors.
➤ HalfTrend: Tweak amplitude and channel deviation settings.
➤ Ichimoku Cloud & Oscillators: Fine-tune the conversion/base lines and oscillator lengths to match individual trading strategies.
Visual Customization:
The script’s color schemes and plotting styles can be altered as needed, giving users the freedom to tailor the interface to their taste or existing chart setups.
🌟 Uniqueness of the Concept
Integrated Multi-Indicator Synergy:
Combines a diverse range of trend, momentum, and volume-based indicators into a single cohesive system for a holistic market view.
Master Candle Aggregation:
Consolidates numerous individual signals into a "Master Candle" that filters out noise and provides a clear, consensus-based trading signal.
Layered Visual Feedback:
Uses color-coded histograms, adaptive background cues, and dynamic overlays to deliver a visually intuitive guide to market sentiment at a glance.
Customization and Flexibility:
Offers adjustable parameters for each indicator, allowing users to tailor the system to fit diverse trading styles and market conditions.
✅ Conclusion:
Robust Trading Tool & Non-Repainting Reliability:
This versatile technical analysis tool computes an extensive range of indicators, aggregates them into a stable, non-repainting “Master Candle” signal, and maintains consistent, verifiable outputs on historical data.
Holistic Market Insight & Consistent Signal Generation:
By combining trend detection, momentum oscillators, and volume analysis, the indicator delivers a comprehensive snapshot of market conditions and generates dependable signals across varying timeframes.
User-Centric Design with Rich Visual Feedback:
Customizable settings, clear color-coded outputs, adaptive backgrounds, and real-time alerts work together to provide actionable, transparent feedback—enhancing the overall trading experience.
A Unique All-in-One Solution:
The integrated approach not only simplifies complex market dynamics into an easy-to-read visual guide but also empowers systematic traders with a powerful, adaptable asset for accurate decision-making.
❤️ Credits:
Pine Script™ User Manual
Supertrend
Ichimoku Cloud
Parabolic SAR
Price Volume Trend (PVT)
Average Directional Index (ADX)
Volume Oscillator
HalfTrend
Donchian Trend
Liquidation Reversal Signals [AlgoAlpha]🟠 OVERVIEW
This tool detects potential liquidation-driven reversals by combining z-score analysis of up/down volume with the classic Supertrend. It watches for abnormal surges in directional volume (on a lower timeframe) and links them to trend flips on the main chart. When both align within a short window, it flags a probable reversal caused by forced liquidations. The goal is to help traders identify exhaustion points where aggressive liquidation moves may mark the end of a trend leg.
🟠 CONCEPTS
The logic revolves around Z-score normalization of up and down volume to locate statistical extremes. When up-volume z-scores exceed a threshold during a bearish Supertrend, it implies trapped shorts being squeezed; the opposite applies for long liquidations. The script tracks these liquidation spikes and monitors whether a Supertrend regime change follows soon after. If confirmed within the allowed timeout, a colored signal marks the event.
In essence:
Z-score outliers = potential forced liquidations.
Supertrend = structural regime context.
Combined = statistically confirmed reversal signals, not random flips.
This pairing reduces false positives by ensuring that both volatility structure and order-flow extremes agree before flagging a reversal.
🟠 FEATURES
Z-score detection for liquidation spikes with adjustable lookback and threshold.
Confirmation logic linking liquidations to Supertrend flips.
Alerts for liquidation spikes and confirmed reversal starts.
On-chart “No Volume” warning to avoid misreads on illiquid assets.
🟠 USAGE
Setup : Add the script to your main chart. Choose a lower timeframe (default 15m) to capture more granular liquidation flows. Adjust Z-Score Length to control how far back the script measures normal behavior and Threshold to decide what counts as extreme. Keep Timeout Bars low (e.g. 20–50) for faster reversals, or higher for slower markets.
Read the chart :
• Circles appear below bars when long liquidations occur; above bars for short liquidations.
• A Supertrend flip with a recent liquidation spike will display an arrow and color shift.
• Fills between candles and trend lines show which side dominates: green for bullish reversal, red for bearish.
• Candle color fades based on the magnitude of liquidation pressure.
Settings that matter :
• Z-Score Length : Longer smooths noise but delays signal; shorter reacts faster.
• Z-Score Threshold : Higher means only extreme liquidations trigger; lower finds smaller squeezes.
• Timeout Bars : Defines how long after a liquidation the Supertrend flip remains valid.
• Lower Timeframe : Determines the precision of volume readings; too low may increase noise.

Advanced Multi-Timeframe Trend & Signal System═══════════════════════════════════════════════════════════════
ADVANCED MULTI-TIMEFRAME TREND & SIGNAL SYSTEM v1.0
═══════════════════════════════════════════════════════════════
Created by: Zakaria Safri
License: Mozilla Public License 2.0
A comprehensive technical analysis tool designed for traders seeking
multi-dimensional market insights. This indicator combines proven
technical analysis methods with modern visualization techniques.
═══════════════════════════════════════════════════════════════
KEY FEATURES
═══════════════════════════════════════════════════════════════
✓ SUPERTREND SIGNAL GENERATION
- Customizable sensitivity settings
- Clear long/short entry signals
- Automatic trend direction detection
- ATR-based dynamic calculations
✓ MULTI-TIMEFRAME DASHBOARD
- Real-time trend analysis across 6 timeframes
- Synchronized trend confirmation
- Customizable table position and size
- Current: 1M, 5M, 15M, 1H, 1D coverage
✓ QQE REVERSAL DETECTION
- Quantitative Qualitative Estimation algorithm
- Early reversal signal identification
- Adjustable RSI and smoothing parameters
- Confirmation-based plotting
✓ DYNAMIC SUPPORT & RESISTANCE
- Pivot-based level calculation
- Quick and standard pivot detection
- Color-coded zones (8 levels)
- Automatic level updates
✓ MOMENTUM BREAKOUT SIGNALS
- Ichimoku-inspired calculations
- Bullish and bearish breakout detection
- Visual zone highlighting
- Trend confirmation filters
✓ RISK MANAGEMENT SYSTEM
- ATR-based stop loss calculation
- Multiple take profit targets (TP1, TP2, TP3)
- Customizable risk-to-reward ratios
- Dynamic price level tracking
- Hit detection markers
✓ VOLATILITY BANDS
- Keltner Channel implementation
- Multiple band layers (3 levels)
- EMA-based calculations
- Adaptive to market conditions
✓ TREND CLOUD VISUALIZATION
- Dual moving average cloud
- Clear trend direction indication
- Customizable color scheme
- Trend bar coloring
═══════════════════════════════════════════════════════════════
HOW TO USE
═══════════════════════════════════════════════════════════════
SETUP:
1. Add indicator to your chart
2. Configure sensitivity in Core Signals section
3. Enable desired features (signals, reversals, breakouts)
4. Set up risk management levels if trading
5. Position MTF dashboard to preference
SIGNAL INTERPRETATION:
• LONG Signal: Price crosses above Supertrend
• SHORT Signal: Price crosses below Supertrend
• REV (Reversal): QQE indicates potential trend change
• Diamond Breakouts: Momentum shift confirmation
• T1/T2/T3: Take profit level hits
MULTI-TIMEFRAME ANALYSIS:
• Green (BULL): Higher timeframe supports uptrend
• Red (BEAR): Higher timeframe supports downtrend
• Use for trend alignment and confirmation
• Best results when multiple timeframes align
RISK MANAGEMENT:
• Enable Stop Loss for automatic SL calculation
• Activate TP levels based on trading style
• Adjust Risk-to-Reward ratio (1:1 to 1:10)
• Monitor hit detection circles for exits
═══════════════════════════════════════════════════════════════
TECHNICAL SPECIFICATIONS
═══════════════════════════════════════════════════════════════
CALCULATIONS:
• Supertrend: ATR-based with customizable multiplier
• QQE: Modified RSI with Wilders smoothing
• Keltner Channels: EMA basis with ATR bands
• Pivots: Standard left/right bar methodology
• Support/Resistance: Multi-level pivot analysis
PARAMETERS:
• Supertrend Sensitivity: 0.5 to 10.0 (default: 2.0)
• RSI Period: 5 to 50 (default: 14)
• QQE Multiplier: 1.0 to 10.0 (default: 4.238)
• Risk-to-Reward: 1 to 10 (default: 4)
TIMEFRAMES:
Compatible with all timeframes. MTF dashboard displays:
• 1 Minute (1M)
• 5 Minutes (5M)
• 15 Minutes (15M)
• 1 Hour (1H)
• 1 Day (1D)
• Current chart timeframe
═══════════════════════════════════════════════════════════════
CUSTOMIZATION OPTIONS
═══════════════════════════════════════════════════════════════
VISUAL:
• Professional color scheme (Cyan/Orange)
• Adjustable table position (9 positions)
• Table size options (tiny/small/normal/large)
• Transparent zone highlighting
• Clean, modern label design
TOGGLES:
• Enable/disable any feature independently
• Show/hide signals, reversals, breakouts
• Toggle S/R levels and zones
• Control trend cloud and bands
• Master trend line optional
ALERTS:
The indicator provides visual signals that can be used with
TradingView's alert system by setting alerts on the indicator.
═══════════════════════════════════════════════════════════════
BEST PRACTICES
═══════════════════════════════════════════════════════════════
✓ Combine signals for higher probability setups
✓ Use MTF dashboard for trend confirmation
✓ Respect S/R levels for entry/exit planning
✓ Monitor QQE reversals at key price levels
✓ Adjust sensitivity based on asset volatility
✓ Test on demo/paper trading first
✓ Use proper risk management always
═══════════════════════════════════════════════════════════════
IMPORTANT DISCLAIMER
═══════════════════════════════════════════════════════════════
This indicator is a technical analysis tool and does NOT:
• Guarantee profitable trades
• Provide financial advice
• Predict future price movements with certainty
• Replace proper risk management
• Substitute for personal due diligence
Past performance does not indicate future results. All trading
involves risk. Users should:
- Understand the indicator's logic
- Test thoroughly before live trading
- Use appropriate position sizing
- Never risk more than they can afford to lose
- Consult financial advisors if needed
═══════════════════════════════════════════════════════════════
CODING STANDARDS
═══════════════════════════════════════════════════════════════
This indicator follows PineCoders Coding Conventions:
✓ Proper variable naming (prefixes: i_, f_, c_)
✓ Clear function documentation
✓ Organized code structure
✓ Type declarations
✓ Efficient calculations
✓ No repainting (confirmed signals)
✓ Proper use of request.security
═══════════════════════════════════════════════════════════════
SUPPORT & UPDATES
═══════════════════════════════════════════════════════════════
Version: 1.0
Author: Zakaria Safri
License: MPL 2.0
Last Updated: 2024
For questions, feedback, or suggestions, please comment below.
═══════════════════════════════════════════════════════════════
#trading #signals #supertrend #multiTimeframe #QQE #reversals
#supportResistance #riskManagement #trendAnalysis #momentum

Codigo Trading 1.0📌Codigo Trading 1.0
This indicator strategically combines SuperTrend, multiple Exponential Moving Averages (EMAs), the Relative Strength Index (RSI), and the Average True Range (ATR) to offer clear entry and exit signals, as well as an in-depth view of market trends. Ideal for traders looking to optimize their operations with an all-in-one tool.
🔩How the Indicator Works:
This indicator relies on the interaction and confirmation of several key components to generate signals:
SuperTrend: Determines the primary trend direction. An uptrend SuperTrend signal (green line) indicates an upward trend, while a downtrend (red line) signals a downward trend. It also serves as a guide for setting Stop Loss and Take Profit levels.
EMAs: Includes EMAs of 10, 20, 55, 100, 200, and 325 periods. The relationship between the EMA 10 and EMA 20 is fundamental for confirming the strength and direction of movements. An EMA 10 above the EMA 20 suggests an uptrend, and vice versa. Longer EMAs act as dynamic support and resistance levels, offering a broader view of the market structure.
RSI: Used to identify overbought (RSI > 70/80) and oversold (RSI < 30/20) conditions, generating "Take Profit" alerts for potential trade closures.
ATR: Monitors market volatility to help you manage exits. ATR exit signals are triggered when volatility changes direction, indicating a possible exhaustion of the movement.
🗒️Entry and Exit Signals:
I designed specific alerts based on all the indicators I use in conjunction:
Long Entries: When SuperTrend is bullish and EMA 10 crosses above EMA 20.
Short Entries: When SuperTrend is bearish and EMA 10 crosses below EMA 20.
RSI Exits (Take Profit): Indicated by "TP" labels on the chart, when the RSI reaches extreme levels (overbought for longs, oversold for shorts).
EMA 20 Exits: When the price closes below EMA 20 (for longs) or above EMA 20 (for shorts).
ATR Exits: When the ATR changes direction, signaling a possible decrease in momentum.
📌Key Benefits:
Clarity in Trend: Quickly identifies market direction with SuperTrend and EMA alignment.
Strategic Entry and Exit Signals: Receive timely alerts to optimize your entry and exit points.
Assisted Trade Management: RSI and ATR help you consider when to take profits or exit a position.
Intuitive Visualization: Arrows, labels, and colored lines make analysis easy to interpret.
Disclaimer:
Trading in financial markets carries significant risks. This indicator is an analysis tool and should not be considered financial advice. Always conduct your own research and trade at your own risk.

TradeTale ScalperThis script explains how "Supertrend" along with ALMA & Simple Moving Average can be used to catch "HH-HL-LH-LL" with linear regression Candles.
Simple Moving Average (MA):-
A simple moving average (SMA) is used in technical analysis, used to help smooth out price data by creating a constantly updated average price. A rising moving average indicates that the security is in an uptrend, while a declining moving average indicates a downtrend.
Supertrend :-
A Super Trend is a trend following indicator similar to moving averages. It is comprise of just two parameters - period and multiplier. Average True Range (ATR) plays a key role in ‘Supertrend’ as the indicator uses ATR to compute its value and it signals the degree of price volatility.
Supertrend Calculations:-
Up = (high + low / 2 + multiplier x ATR
Down = (high + low) / 2 – multiplier x ATR
Calc of Average True Range = / 14
14 is period.
ATR is derived by multiplying the previous ATR with 13.
Add the latest TR and divide it by period.
ATR is important in supertrend.
ALMA:-
Arnaud Legoux Moving Average (ALMA) is a technical analysis indicator that calculates the average price of an asset over a specific period using Gaussian distribution function. It aims to provide a responsive and smooth moving average (MA) while reducing lag and noise.ALMA can be used for trend identification, trend reversal or dynamic support and resistance.
ALMA Calculations:-
ALMA = (Weighted Sum of Prices) / (Sum of Weight).
Weighted Sum of Prices:
- Each price within the selected period is multiplied by a specific weight.
- Weight is determined using a Gaussian function.
- Which assign higher weights to more recent prices and lower weights to older prices.
- That is why its more responsive to price changes
Sum of Weight:
- Add up all the weights using Gaussian function for each price within selected period.
Linear Regression Candles:-
open, high, low, and close values of Linear Regression Candles are adjusted as per Smoothed moving average. This adjustment not only highlights the trend more clearly but also colors the candles in green (for bullish) or red (for bearish) based on whether the close is above or below the open. The advantage of the Linear Regression Indicator over a normal moving average is that it has less lag than the moving average, responding quicker to changes in direction. The downside is that it is more prone to whipsaws.
HH-HL-LH-LL:-
Charts provide traders with a visual representation of the price action over a given period of time. To analyse these charts and make informed trading decisions, traders use various technical indicators, one of which is the concept of Higher Highs (HH), Higher Lows (HL), Lower Highs (LH), and Lower Lows (LL). HH, HL, LH, and LL are terms used to describe the price action. They identify the direction of the trend and the potential reversal points. HH and HL are used to identify an uptrend, while LH and LL are used to identify a downtrend.
Logic of this indicator:-
HH & HL are used as Long signals when Supertrend is in Uptrend and is above ALMA & SMA. (also other calculations are used)
LL & LH are used as Short signals when Supertrend is in Downtrend and is below ALMA & SMA. (also other calculations are used)
How to Use:-
Long: when Long appears + Green Candles + price above White SMA Line. (Bullish Entry/ Bear Exit)
Short: when Short appears + Red Candles + price below White SMA Line. (Bearish Entry/ Bull Exit)
Chart Timeframe:-
This Indicator works on all timeframes.
Traders should set stop loss and take profit levels as per risk reward ratio.
Note:
- Hide the actual candles for better view from chart setting.
- you may select "Repaint" from indicator settings in which Long & Short signals will repaint as per the conditions/calculations or you may select "NonRepaint" from indicator settings in which the Long & Short signals will not be repainted.
Like other technical indicators, This indicator also is not a holy grail. It can only assist you in building a good strategy. You can only succeed with proper position sizing, risk management and following correct trading Psychology (No overtrade, No greed, No revenge trade etc).
THIS INDICATOR IS FOR EDUCATIONAL PURPOSE AND PAPER TRADING ONLY. YOU MAY PAPER TRADE TO GAIN CONFIDENCE AND BUILD FURTHER ON THESE. PLEASE CONSULT YOUR FINANCIAL ADVISOR BEFORE INVESTING. WE ARE NOT SEBI REGISTERED.
Hope you all like it
happy learning.

Rakesh's Ultimate Trading SystemKey Features:
1. Multi-Confirmation System
5 total signals working together:
MTF Supertrend (Monthly + Weekly + Daily alignment)
Ichimoku Cloud (Price vs Cloud + Tenkan/Kijun cross)
Gann HiLo Activator (Trend direction)
Darvas Box (Breakout/Breakdown)
Current timeframe Supertrend
2. Smart Signal Generation
You set minimum confirmations (1-5) needed for a signal
STRONG BUY = When X out of 5 indicators confirm bullish
STRONG SELL = When X out of 5 indicators confirm bearish
Shows confirmation count on each signal label (e.g., "4/5")
3. Comprehensive Dashboard
Shows real-time status of:
✓ Each indicator's current signal
✓ Overall market direction
✓ Bullish vs Bearish confirmation count
✓ Color-coded for quick decision making
4. All Indicators Plotted
Ichimoku Cloud - Green/Red cloud with Tenkan/Kijun lines
Gann HiLo - Dynamic support/resistance line
Darvas Box - Top and bottom box levels
Background colors - Show breakouts and overall trend
5. Built-in Alerts
Automatic alerts when strong buy/sell signals trigger
Shows how many confirmations fired
How to Use:
Conservative Trading (Recommended):
Set "Minimum Confirmations" to 4 or 5
Only trade when almost all indicators align
Fewer signals but higher probability
Moderate Trading:
Set to 3 confirmations
Balanced approach - good signals, not too rare
Aggressive Trading:
Set to 2 confirmations
More signals but require your own filtering
Customization Options:
All indicators can be toggled on/off:
Show/hide individual Supertrend timeframes
Show/hide Ichimoku Cloud
Show/hide Gann HiLo
Show/hide Darvas Box
Show/hide Dashboard
Adjustable parameters for each indicator:
Supertrend: ATR period, Factor
Ichimoku: Tenkan, Kijun, Senkou periods
Gann: HiLo period
Darvas: Box length
Trading Strategy Examples:
1. Ultra-Safe Entry:
Wait for 5/5 confirmations
Enter on next candle
Use Gann line as stop-loss
2. Breakout Trading:
Watch for Darvas Box breakout
Confirm with 3+ other indicators
Ride the trend
3. Trend Following:
MTF Supertrend shows main trend
Use Ichimoku cloud for support/resistance
Enter on Gann/Darvas confirmations
This is a professional-grade system, Rakesh! It filters out false signals by requiring multiple confirmations. Much more refined than single-indicator systems! 🚀
Want me to adjust anything or add more features?Ris this also for tradingviewYes, absolutely! This is 100% for TradingView, just like the first one!
How to Add This to TradingView:
Same steps as before:
Copy the code from the artifact above
Go to TradingView.com
Open Pine Editor (bottom of chart)
Click "Open" → "New blank indicator"
Paste the code
Click "Save" and name it (e.g., "Advanced MTF System")
Click "Add to Chart"
What You'll See on Your Chart:
✅ Ichimoku Cloud - Green/Red cloud visualization
✅ Gann HiLo Line - Green when bullish, Red when bearish
✅ Darvas Box - Box top and bottom levels
✅ Buy/Sell Labels - "STRONG BUY 4/5" or "STRONG SELL 3/5"
✅ Dashboard Table - Top right corner showing all indicator statuses
✅ Background colors - Subtle green/red when strong signals appear
It Works With:
✅ Stocks (NSE, BSE, US markets)
✅ Forex
✅ Crypto
✅ Commodities
✅ Indices (Nifty, Bank Nifty, etc.)
Settings Panel:
When you add it to chart, click the ⚙️ settings icon to customize:
Toggle indicators on/off
Adjust minimum confirmations (2, 3, 4, or 5)
Fine-tune each indicator's parameters

Luxy BIG beautiful Dynamic ORBThis is an advanced Opening Range Breakout (ORB) indicator that tracks price breakouts from the first 5, 15, 30, and 60 minutes of the trading session. It provides complete trade management including entry signals, stop-loss placement, take-profit targets, and position sizing calculations.
The ORB strategy is based on the concept that the opening range of a trading session often acts as support/resistance, and breakouts from this range tend to lead to significant moves.
What Makes This Different?
Most ORB indicators simply draw horizontal lines and leave you to figure out the rest. This indicator goes several steps further:
Multi-Stage Tracking
Instead of just one ORB timeframe, this tracks FOUR simultaneously (5min, 15min, 30min, 60min). Each stage builds on the previous one, giving you multiple trading opportunities throughout the session.
Active Trade Management
When a breakout occurs, the indicator automatically calculates and displays entry price, stop-loss, and multiple take-profit targets. These lines extend forward and update in real-time until the trade completes.
Cycle Detection
Unlike indicators that only show the first breakout, this tracks the complete cycle: Breakout → Retest → Re-breakout. You can see when price returns to test the ORB level after breaking out (potential re-entry).
Failed Breakout Warning
If price breaks out but quickly returns inside the range (within a few bars), the label changes to "FAILED BREAK" - warning you to exit or avoid the trade.
Position Sizing Calculator
Built-in risk management that tells you exactly how many shares to buy based on your account size and risk tolerance. No more guessing or manual calculations.
Advanced Filtering
Optional filters for volume confirmation, trend alignment, and Fair Value Gaps (FVG) to reduce false signals and improve win rate.
Core Features Explained
### 1. Multi-Stage ORB Levels
The indicator builds four separate Opening Range levels:
ORB 5 - First 5 minutes (fastest signals, most volatile)
ORB 15 - First 15 minutes (balanced, most popular)
ORB 30 - First 30 minutes (slower, more reliable)
ORB 60 - First 60 minutes (slowest, most confirmed)
Each level is drawn as a horizontal range on your chart. As time progresses, the ranges expand to include more price action. You can enable or disable any stage and assign custom colors to each.
How it works: During the opening minutes, the indicator tracks the highest high and lowest low. Once the time period completes, those levels become your ORB high and low for that stage.
### 2. Breakout Detection
When price closes outside the ORB range, a label appears:
BREAK UP (green label above price) - Price closed above ORB High
BREAK DOWN (red label below price) - Price closed below ORB Low
The label shows which ORB stage triggered (ORB5, ORB15, etc.) and the cycle number if tracking multiple breakouts.
Important: Signals appear on bar close only - no repainting. What you see is what you get.
### 3. Retest Detection
After price breaks out and moves away, if it returns to test the ORB level, a "RETEST" label appears (orange). This indicates:
The original breakout level is now acting as support/resistance
Potential re-entry opportunity if you missed the first breakout
Confirmation that the level is significant
The indicator requires price to move a minimum distance away before considering it a valid retest (configurable in settings).
### 4. Failed Breakout Detection
If price breaks out but returns inside the ORB range within a few bars (before the breakout is "committed"), the original label changes to "FAILED BREAK" in orange.
This warns you:
The breakout lacked conviction
Consider exiting if already in the trade
Wait for better setup
Committed Breakout: The indicator tracks how many bars price stays outside the range. Only after staying outside for the minimum number of bars does it become a committed breakout that can be retested.
### 5. TP/SL Lines (Trade Management)
When a breakout occurs, colored horizontal lines appear showing:
Entry Line (cyan for long, orange for short) - Your entry price (the ORB level)
Stop Loss Line (red) - Where to exit if trade goes against you
TP1, TP2, TP3 Lines (same color as entry) - Profit targets at 1R, 2R, 3R
These lines extend forward as new bars form, making it easy to track your trade. When a target is hit, the line turns green and the label shows a checkmark.
Lines freeze (stop updating) when:
Stop loss is hit
The final enabled take-profit is hit
End of trading session (optional setting)
### 6. Position Sizing Dashboard
The dashboard (bottom-left corner by default) shows real-time information:
Current ORB stage and range size
Breakout status (Inside Range / Break Up / Break Down)
Volume confirmation (if filter enabled)
Trend alignment (if filter enabled)
Entry and Stop Loss prices
All enabled Take Profit levels with percentages
Risk/Reward ratio
Position sizing: Max shares to buy and total risk amount
Position Sizing Example:
If your account is $25,000 and you risk 1% per trade ($250), and the distance from entry to stop loss is $0.50, the calculator shows you can buy 500 shares (250 / 0.50 = 500).
### 7. FVG Filter (Fair Value Gap)
Fair Value Gaps are price inefficiencies - gaps left by strong momentum where one candle's high doesn't overlap with a previous candle's low (or vice versa).
When enabled, this filter:
Detects bullish and bearish FVGs
Draws semi-transparent boxes around these gaps
Only allows breakout signals if there's an FVG near the breakout level
Why this helps: FVGs indicate institutional activity. Breakouts through FVGs tend to be stronger and more reliable.
Proximity setting: Controls how close the FVG must be to the ORB level. 2.0x means the breakout can be within 2 times the FVG size - a reasonable default.
### 8. Volume & Trend Filters
Volume Filter:
Requires current volume to be above average (customizable multiplier). High volume breakouts are more likely to sustain.
Set minimum multiplier (e.g., 1.5x = 50% above average)
Set "strong volume" multiplier (e.g., 2.5x) that bypasses other filters
Dashboard shows current volume ratio
Trend Filter:
Only shows breakouts aligned with a higher timeframe trend. Choose from:
VWAP - Price above/below volume-weighted average
EMA - Price above/below exponential moving average
SuperTrend - ATR-based trend indicator
Combined modes (VWAP+EMA, VWAP+SuperTrend) for stricter filtering
### 9. Pullback Filter (Advanced)
Purpose:
Waits for price to pull back slightly after initial breakout before confirming the signal.
This reduces false breakouts from immediate reversals.
How it works:
- After breakout is detected, indicator waits for a small pullback (default 2%)
- Once pullback occurs AND price breaks out again, signal is confirmed
- If no pullback within timeout period (5 bars), signal is issued anyway
Settings:
Enable Pullback Filter: Turn this filter on/off
Pullback %: How much price must pull back (2% is balanced)
Timeout (bars): Max bars to wait for pullback (5 is standard)
When to use:
- Choppy markets with many fake breakouts
- When you want higher quality signals
- Combine with Volume filter for maximum confirmation
Trade-off:
- Better signal quality
- May miss some valid fast moves
- Slight entry delay
How to Use This Indicator
### For Beginners - Simple Setup
Add the indicator to your chart (5-minute or 15-minute timeframe recommended)
Leave all default settings - they work well for most stocks
Watch for BREAK UP or BREAK DOWN labels to appear
Check the dashboard for entry, stop loss, and targets
Use the position sizing to determine how many shares to buy
Basic Trading Plan:
Wait for a clear breakout label
Enter at the ORB level (or next candle open if you're late)
Place stop loss where the red line indicates
Take profit at TP1 (50% of position) and TP2 (remaining 50%)
### For Advanced Traders - Customized Setup
Choose which ORB stages to track (you might only want ORB15 and ORB30)
Enable filters: Volume (stocks) or Trend (trending markets)
Enable FVG filter for institutional confirmation
Set "Track Cycles" mode to catch retests and re-breakouts
Customize stop loss method (ATR for volatile stocks, ORB% for stable ones)
Adjust risk per trade and account size for accurate position sizing
Advanced Strategy Example:
Enable ORB15 only (disable others for cleaner chart)
Turn on Volume filter at 1.5x with Strong at 2.5x
Enable Trend filter using VWAP
Set Signal Mode to "Track Cycles" with Max 3 cycles
Wait for aligned breakouts (Volume + Trend + Direction)
Enter on retest if you missed the initial break
### Timeframe Recommendations
5-minute chart: Scalping, very active trading, crypto
15-minute chart: Day trading, balanced approach (most popular)
30-minute chart: Swing entries, less screen time
60-minute chart: Position trading, longer holds
The indicator works on any intraday timeframe, but ORB is fundamentally a day trading strategy. Daily charts don't make sense for ORB.
DEFAULT CONFIGURATION
ON by Default:
• All 4 ORB stages (5/15/30/60)
• Breakout Detection
• Retest Labels
• All TP levels (1/1.5/2/3)
• TP/SL Lines (Detailed mode)
• Dashboard (Bottom Left, Dark theme)
• Position Size Calculator
OFF by Default (Optional Filters):
• FVG Filter
• Pullback Filter
• Volume Filter
• Trend Filter
• HTF Bias Check
• Alerts
Recommended for Beginners:
• Leave all defaults
• Session Mode: Auto-Detect
• Signal Mode: Track Cycles
• Stop Method: ATR
• Add Volume Filter if trading stocks
Recommended for Advanced:
• Enable ORB15 + ORB30 only (disable 5 & 60)
• Enable: Volume + Trend + FVG
• Signal Mode: Track Cycles, Max 3
• Stop Method: ATR or Safer
• Enable HTF Daily bias check
## Settings Guide
The settings are organized into logical groups. Here's what each section controls:
### ORB COLORS Section
Show Edge Labels: Display "ORB 5", "ORB 15" labels at the right edge of the levels
Background: Fill the area between ORB high/low with color
Transparency: How see-through the background is (95% is nearly invisible)
Enable ORB 5/15/30/60: Turn each stage on or off individually
Colors: Assign colors to each ORB stage for easy identification
### SESSION SETTINGS Section
Session Mode: Choose trading session (Auto-Detect works for most instruments)
Custom Session Hours: Define your own hours if needed (format: HHMM-HHMM)
Auto-Detect uses the instrument's natural hours (stocks use exchange hours, crypto uses 24/7).
### BREAKOUT DETECTION Section
Enable Breakout Detection: Master switch for signals
Show Retest Labels: Display retest signals
Label Size: Visual size for all labels (Small recommended)
Enable FVG Filter: Require Fair Value Gap confirmation
Show FVG Boxes: Display the gap boxes on chart
Signal Mode: "First Only" = one signal per direction per day, "Track Cycles" = multiple signals
Max Cycles: How many breakout-retest cycles to track (6 is balanced)
Breakout Buffer: Extra distance required beyond ORB level (0.1-0.2% recommended)
Min Distance for Retest: How far price must move away before retest is valid (2% recommended)
Min Bars Outside ORB: Bars price must stay outside for committed breakout (2 is balanced)
### TARGETS & RISK Section
Enable Targets & Stop-Loss: Calculate and show trade management
TP1/TP2/TP3 checkboxes: Select which profit targets to display
Stop Method: How to calculate stop loss placement
- ATR: Based on volatility (best for most cases)
- ORB %: Fixed % of ORB range
- Swing: Recent swing high/low
- Safer: Widest of all methods
ATR Length & Multiplier: Controls ATR stop distance (14 period, 1.5x is standard)
ORB Stop %: Percentage beyond ORB for stop (20% is balanced)
Swing Bars: Lookback period for swing high/low (3 is recent)
### TP/SL LINES Section
Show TP/SL Lines: Display horizontal lines on chart
Label Format: "Short" = minimal text, "Detailed" = shows prices
Freeze Lines at EOD: Stop extending lines at session close
### DASHBOARD Section
Show Info Panel: Display the metrics dashboard
Theme: Dark or Light colors
Position: Where to place dashboard on chart
Toggle rows: Show/hide specific information rows
Calculate Position Size: Enable the position sizing calculator
Risk Mode: Risk fixed $ amount or % of account
Account Size: Your total trading capital
Risk %: Percentage to risk per trade (0.5-1% recommended)
### VOLUME FILTER Section
Enable Volume Filter: Require volume confirmation
MA Length: Average period (20 is standard)
Min Volume: Required multiplier (1.5x = 50% above average)
Strong Volume: Multiplier that bypasses other filters (2.5x)
### TREND FILTER Section
Enable Trend Filter: Require trend alignment
Trend Mode: Method to determine trend (VWAP is simple and effective)
Custom EMA Length: If using EMA mode (50 for swing, 20 for day trading)
SuperTrend settings: Period and Multiplier if using SuperTrend mode
### HIGHER TIMEFRAME Section
Check Daily Trend: Display higher timeframe bias in dashboard
Timeframe: What TF to check (D = daily, recommended)
Method: Price vs MA (stable) or Candle Direction (reactive)
MA Period: EMA length for Price vs MA method (20 is balanced)
Min Strength %: Minimum strength threshold for HTF bias to be considered
- For "Price vs MA": Minimum distance (%) from moving average
- For "Candle Direction": Minimum candle body size (%)
- 0.5% is balanced - increase for stricter filtering
- Lower values = more signals, higher values = only strong trends
### ALERTS Section
Enable Alerts: Master switch (must be ON to use any alerts)
Breakout Alerts: Notify on ORB breakouts
Retest Alerts: Notify when price retests after breakout
Failed Break Alerts: Notify on failed breakouts
Stage Complete Alerts: Notify when each ORB stage finishes forming
After enabling desired alert types, click "Create Alert" button, select this indicator, choose "Any alert() function call".
## Tips & Best Practices
### General Trading Tips
ORB works best on liquid instruments (stocks with good volume, major crypto pairs)
First hour of the session is most important - that's when ORB is forming
Breakouts WITH the trend have higher success rates - use the trend filter
Failed breakouts are common - use the "Min Bars Outside" setting to filter weak moves
Not every day produces good ORB setups - be patient and selective
### Position Sizing Best Practices
Never risk more than 1-2% of your account on a single trade
Use the built-in calculator - don't guess your position size
Update your account size monthly as it grows
Smaller accounts: use $ Amount mode for simplicity
Larger accounts: use % of Account mode for scaling
### Take Profit Strategy
Most traders use: 50% at TP1, 50% at TP2
Aggressive: Hold through TP1 for TP2 or TP3
Conservative: Full exit at TP1 (1:1 risk/reward)
After TP1 hits, consider moving stop to breakeven
TP3 rarely hits - only on strong trending days
### Filter Combinations
Maximum Quality: Volume + Trend + FVG (fewest signals, highest quality)
Balanced: Volume + Trend (good quality, reasonable frequency)
Active Trading: No filters or Volume only (many signals, lower quality)
Trending Markets: Trend filter essential (indices, crypto)
Range-Bound: Volume + FVG (avoid trend filter)
### Common Mistakes to Avoid
Chasing breakouts - wait for the bar to close, don't FOMO into wicks
Ignoring the stop loss - always use it, move it manually if needed
Over-leveraging - the calculator shows MAX shares, you can buy less
Trading every signal - quality > quantity, use filters
Not tracking results - keep a journal to see what works for YOU
## Pros and Cons
### Advantages
Complete all-in-one solution - from signal to position sizing
Multiple timeframes tracked simultaneously
Visual clarity - easy to see what's happening
Cycle tracking catches opportunities others miss
Built-in risk management eliminates guesswork
Customizable filters for different trading styles
No repainting - what you see is locked in
Works across multiple markets (stocks, forex, crypto)
### Limitations
Intraday strategy only - doesn't work on daily charts
Requires active monitoring during first 1-2 hours of session
Not suitable for after-hours or extended sessions by default
Can produce many signals in choppy markets (use filters)
Dashboard can be overwhelming for complete beginners
Performance depends on market conditions (trends vs ranges)
Requires understanding of risk management concepts
### Best For
Day traders who can watch the first 1-2 hours of market open
Traders who want systematic entry/exit rules
Those learning proper position sizing and risk management
Active traders comfortable with multiple signals per day
Anyone trading liquid instruments with clear sessions
### Not Ideal For
Swing traders holding multi-day positions
Set-and-forget / passive investors
Traders who can't watch market open
Complete beginners unfamiliar with trading concepts
Low volume / illiquid instruments
## Frequently Asked Questions
Q: Why are no signals appearing?
A: Check that you're on an intraday timeframe (5min, 15min, etc.) and that the current time is within your session hours. Also verify that "Enable Breakout Detection" is ON and at least one ORB stage is enabled. If using filters, they might be blocking signals - try disabling them temporarily.
Q: What's the best ORB stage to use?
A: ORB15 (15 minutes) is most popular and balanced. ORB5 gives faster signals but more noise. ORB30 and ORB60 are slower but more reliable. Many traders use ORB15 + ORB30 together.
Q: Should I enable all the filters?
A: Start with no filters to see all signals. If too many false signals, add Volume filter first (stocks) or Trend filter (trending markets). FVG filter is most restrictive - use for maximum quality but fewer signals.
Q: How do I know which stop loss method to use?
A: ATR works for most cases - it adapts to volatility. Use ORB% if you want predictable stop placement. Swing is for respecting chart structure. Safer gives you the most room but largest risk.
Q: Can I use this for swing trading?
A: Not really - ORB is fundamentally an intraday strategy. The ranges reset each day. For swing trading, look at weekly support/resistance or moving averages instead.
Q: Why do TP/SL lines disappear sometimes?
A: Lines freeze (stop extending) when: stop loss is hit, the last enabled take-profit is hit, or end of session arrives (if "Freeze at EOD" is enabled). This is intentional - the trade is complete.
Q: What's the difference between "First Only" and "Track Cycles"?
A: "First Only" shows one breakout UP and one DOWN per day maximum - clean but might miss opportunities. "Track Cycles" shows breakout-retest-rebreak sequences - more signals but busier chart.
Q: Is position sizing accurate for options/forex?
A: The calculator is designed for shares (stocks). For options, ignore the share count and use the risk amount. For forex, you'll need to adapt the lot size calculation manually.
Q: How much capital do I need to use this?
A: The indicator works for any account size, but practical day trading typically requires $25,000 in the US due to Pattern Day Trader rules. Adjust the "Account Size" setting to match your capital.
Q: Can I backtest this strategy?
A: This is an indicator, not a strategy script, so it doesn't have built-in backtesting. You can visually review historical signals or code a strategy script using similar logic.
Q: Why does the dashboard show different entry price than the breakout label?
A: If you're looking at an old breakout, the ORB levels may have changed when the next stage completed. The dashboard always shows the CURRENT active range and trade setup.
Q: What's a good win rate to expect?
A: ORB strategies typically see 40-60% win rate depending on market conditions and filters used. The strategy relies on positive risk/reward ratios (2:1 or better) to be profitable even with moderate win rates.
Q: Does this work on crypto?
A: Yes, but crypto trades 24/7 so you need to define what "session start" means. Use Session Mode = Custom and set your preferred daily reset time (e.g., 0000-2359 UTC).
## Credits & Transparency
### Development
This indicator was developed with the assistance of AI technology to implement complex ORB trading logic.
The strategy concept, feature specifications, and trading logic were designed by the publisher. The implementation leverages modern development tools to ensure:
Clean, efficient, and maintainable code
Comprehensive error handling and input validation
Detailed documentation and user guidance
Performance optimization
### Trading Concepts
This indicator implements several public domain trading concepts:
Opening Range Breakout (ORB): Trading strategy popularized by Toby Crabel, Mark Fisher and many more talanted traders.
Fair Value Gap (FVG): Price imbalance concept from ICT methodology
SuperTrend: ATR-based trend indicator using public formula
Risk/Reward Ratio: Standard risk management principle
All mathematical formulas and technical concepts used are in the public domain.
### Pine Script
Uses standard TradingView built-in functions:
ta.ema(), ta.atr(), ta.vwap(), ta.highest(), ta.lowest(), request.security()
No external libraries or proprietary code from other authors.
## Disclaimer
This indicator is provided for educational and informational purposes only. It is not financial advice.
Trading involves substantial risk of loss and is not suitable for every investor. Past performance shown in examples is not indicative of future results.
The indicator provides signals and calculations, but trading decisions are solely your responsibility. Always:
Test strategies on paper before using real money
Never risk more than you can afford to lose
Understand that all trading involves risk
Consider seeking advice from a licensed financial advisor
The publisher makes no guarantees regarding accuracy, profitability, or performance. Use at your own risk.
---
Version: 3.0
Pine Script Version: v6
Last Updated: October 2024
For support, questions, or suggestions, please comment below or send a private message.
---
Happy trading, and remember: consistent risk management beats perfect entry timing every time.

Adaptive On Balance Volume with Trend█ Introduction
The Adaptive On Balance Volume (AOBV) indicator enhances the traditional On Balance Volume (OBV) by introducing adaptability, volatility detection, and trend analysis. It helps traders identify the direction of volume flow, assess volume momentum, and spot potential reversals in the market.
Detecting market tops and bottoms is crucial for making informed trading decisions. The AOBV indicator offers a method for identifying these points by using an adaptive volatility detection function that highlights potential volume peaks or climaxes, suggesting when a price top or bottom may be forming.
█ Understanding the AOBV
Note: Details on how calculations are conducted can be found at the end of this script description.
1. The Basics of the AOBV Function:
• Adaptive Momentum Calculation: Instead of using a fixed momentum formula, the AOBV uses the original formula for basic momentum and enhances it based on relative strength and applies an adaptive smoothing function.
• Dynamic Smoothing:
• Strong Momentum: When the AOBV detects significant changes (strong momentum), it reduces smoothing. This makes the indicator more responsive to major market movements.
• Weak Momentum: When momentum is weak (small changes), it increases smoothing to filter out market noise.
This adaptability allows the AOBV to more accurately reflect volume momentum, responding promptly during significant market moves and remaining stable during quieter periods.
To determine the trend direction (bullish or bearish), the indicator calculates a signal curve and displays the difference as bars:
• Bar Above the Middle Line: Indicates a bullish trend.
• Bar Below the Middle Line: Indicates a bearish trend.
2. Volatility Function:
The volatility function measures how much the AOBV deviates from its average by comparing it to its smoothed version. It calculates the exponential standard deviation to estimate volatility.
• Purpose: Identifies when volume momentum is near a climax or when a trend is nearing exhaustion.
• How It Works:
• Compares current volatility to previous bars.
• Computes a percentage indicating how often the current volatility is higher than past values.
• If this percentage exceeds a defined threshold, it signals a significant volatility event by plotting a dot above or below the bar.
This pattern typically manifests itself during strong runs on price followed by a period of consolidation. Thus, estimating volatility would be an acceptable measure of when a market is reaching or nearing an implied top or bottom.
3. The Trend Function:
The trend function combines several common indicators to gauge buildup toward a reversal or a continuation of a trend when the AOBV changes direction.
• Components:
• AOBV Strength Percentage: Calculates the percentage change in the AOBV to gauge its strength and direction.
• Supertrend Indicator: Acts as the main driver for trend buildup.
• Vertical Horizontal Filter (VHF): Measures market consolidation, adjusting the trend strength accordingly.
• Adaptive RSI: Further refines the trend strength based on volume momentum.
• Trend Ranking:
• Assigns a trend rank to the AOBV that reflects both market direction and momentum.
• Colors are used to represent different trend strengths: Strong Bullish, Bullish, Strong Bearish, and Bearish.
█ How to Use the AOBV
• Above the Middle Line: Suggests a bullish trend.
• Below the Middle Line: Suggests a bearish trend
• The Volatility dots:
• Indicate strong momentum relative to previous bars.
• Signal that the trend may be nearing a climax or exhaustion.
• Can imply a potential market top or bottom.
• Consolidation can be detected by visually comparing current bars to previous ones. This should be obvious since, and as described, the AOBV bars represent volume momentum.
• The trend function is used to gauge the likelihood of a reversal or a continuation of a trend; trend is represented with several colors: strong bullish trend, bullish trend, strong bearish trend, and finally simply a bearish trend.
It is important to understand that this trend function is not the typical trend function found on other technical indicators. It must be viewed within the context of the AOBV momentum. For example, if AOBV is exerting a bullish trend (bars above middle line), then a bearish trend with no major change in momentum and no volatility indication could mean a false reversal. Conversely, a large charge in AOBV could be a strong indication of a market reversal.
█ Key Features
• Two Display Modes: Curve and Bars:
The Adaptive OBV can be viewed in two different display modes: Curve and Bars Mode. "Curve Mode" offers the classic OBV representation (but as AOBV) with trend, while "Bars Mode" incorporates volatility detection and trend, making it the recommended mode.
• Volatility Function:
• Dots appear above or below the volume bars when significant volatility events are detected.
• The sensitivity can be adjusted by changing the percentage threshold.
• Trend Analysis:
• Helps gauge the likelihood of a trend continuation or reversal.
• Uses color-coded trend ranks for easy interpretation.
• Flexible Lookback Period:
Lookback periods for the main AOBV, its signal line, trend function, and volatility function can be customized.
• Recommendations:
• Match the main lookback period with the volatility period: Ensures consistency in momentum and volatility measurements.
• Match the trend lookback period with the signal AOBV lookback period: Aligns trend analysis with the underlying momentum signals.
Below is a sample demonstrating the utility on a 1- minute chart.
█ Calculation Details:
• AOBV Calculations
The AOBV differs the traditional OBV by focusing on the differences in OBV values rather than absolute price movements. Initially, it calculates the standard OBV by accumulating volume based on whether the closing price is higher or lower than the previous close. Next, it computes the difference between the current OBV and the previous OBV to measure changes in volume momentum. It calculates the average net change and average total change of these OBV differences over a specified period using a selected averaging method (e.g., EMA, SMA). By dividing the average net change by the average total change, it obtains a change ratio that reflects the strength and direction of volume momentum.
This change ratio is then scaled to an RSI-like value between 0 and 100, which is used to derive an adaptive smoothing factor (alpha). The alpha adjusts dynamically—when the change ratio indicates strong momentum, alpha increases, making the indicator more responsive to recent changes; when momentum is weak, alpha decreases, increasing smoothing to filter out noise.
The adaptive OBV is calculated by applying this alpha to combine the current OBV and the previous adaptive OBV value. This adaptive smoothing allows the indicator to adjust its sensitivity based on market conditions, becoming more responsive during strong momentum and more stable during weak momentum.
A smoothed OBV signal line is also computed using weighted moving averages for comparison. By analyzing the difference between the adaptive OBV and this smoothed signal line, the indicator identifies bullish or bearish trends. Positive differences suggest bullish momentum (bars above the middle line), while negative differences indicate bearish momentum (bars below the middle line).
• Volatility Calculations
The volatility function in the AOBV indicator identifies significant changes in volume momentum by estimating the variability of recent momentum shifts. It begins by calculating the difference between the AOBV and its smoothed signal line, capturing the current change in volume momentum. To assess volatility, the function employs exponential smoothing to compute adaptive averages of both the volume and the squared volume over a specified lookback period. By combining these averages, it estimates the current standard deviation of the volume momentum changes, effectively measuring how much the momentum deviates from its average level.
This estimated volatility is then compared to historical volatility values over the lookback period to determine how frequently the current volatility exceeds past levels. If the proportion of times the current volatility is higher than previous values and it surpasses a user-defined threshold, it signals a significant volatility event, indicating a potential volume climax
• Trend Calculations
As outlined earlier in description, the trend function is composed of several components:
The Supertrend indicator calculates dynamic support and resistance levels based on price movements and volatility using the Average True Range. It assesses whether the closing price is above or below these levels to determine the primary trend direction. If the price is above the Supertrend line: The market is considered to be in an uptrend. If the price is below the Supertrend line: The market is considered to be in a downtrend.
The Vertical Horizontal Filter measures the strength of the trend by comparing the price range over a period to the sum of absolute price changes. It does this by comparing the difference between the highest and lowest prices over a given period (the "vertical" movement) to the sum of the absolute differences between consecutive prices (the "horizontal" movement). A higher VHF value indicates a stronger, more directional trend, while a lower value suggests that the market is moving sideways without a clear trend.. If the VHF detects consolidation, it downgrades the trend strength indicated by the Supertrend. This prevents the trend function from overemphasizing the Supertrend's signals when the market lacks clear direction.
The Adaptive RSI Analyzes recent changes in the AOBV to identify whether volume momentum is strengthening or weakening (based on the volume percent change) correlating price movement with volume momentum. It only upgrades or downgrades on a bar by bar basis if price movement is correlating with percent change. This acts as a corrective measure against the VHF since quiet periods (consolidation) can occur between strong moves. The alpha generated from the adaptive function is the same as the one generated with the AOBV calculations.
█ Disclaimer
This script is provided for educational and informational purposes only and should not be considered financial advice. Trading financial instruments carries a high level of risk and may not be suitable for all investors. Before using this script, please consult with a qualified financial advisor to ensure it aligns with your individual circumstances. The author does not guarantee the accuracy or completeness of the script and is not responsible for any losses or damages that may occur from its use. Use this script at your own risk.

QuantumFlow MTF SystemQuantumFlow MTF System © 2025
Multi-Timeframe Directional Flow & Volatility Alignment Engine
QuantumFlow MTF System is designed to synchronize volatility- and trend-based signals from multiple timeframes into a single, structured view of market flow.
Concept
The system evaluates confirmed Supertrend directions from several lower timeframes, then aggregates them into normalized bullish/bearish values. These values are combined with dual-layer EMA momentum filters to verify directional strength. The resulting matrix provides a precise snapshot of alignment across short- to medium-term market structures.
Unlike classical ATR-based systems, QuantumFlow employs multiple ATR layers with multiple deviation factors that have been extensively tested over the years.
This multi-ATR framework acts as an adaptive volatility filter, allowing each asset class to respond dynamically to its intrinsic volatility profile.
The result is a robust and consistent analytical engine capable of adapting to varying market conditions across assets and timeframes.
How It Works
- Confirmed Multi-Timeframe Supertrend:
Each timeframe calculates a close-confirmed Supertrend direction, preventing repainting and ensuring signal reliability.
- Multi-ATR Volatility Model:
Several ATR instances with distinct deviation multipliers define volatility thresholds that adjust sensitivity across market conditions.
- Dual EMA Structure:
Two independent EMA layers act as momentum validators to confirm or filter each Supertrend direction.
- Flow Totals Engine:
The script sums all directional states into a real-time ratio of bullish vs bearish conditions, visualized through color-coded totals.
- Adaptive Alerts:
Optional thresholds allow traders to receive alerts when directional imbalance reaches predefined intensity levels.
Use Cases
- Identify when multiple timeframes align in the same trend direction.
- Quantify the relative dominance of bullish or bearish pressure.
- Filter trades using adaptive multi-ATR volatility filters per asset type.
- Confirm entries by validating multi-timeframe directional consensus.
Chart Display
QuantumFlow displays a structured table showing the state of each analyzed timeframe and the current flow balance. Works seamlessly on any instrument and timeframe.
This invite-only indicator provides a systematic way to analyze directional flow alignment using a multi-ATR volatility engine combined with momentum synchronization across multiple timeframes.
---
Author’s Instructions:
To request access, please contact the author privately through the TradingView profile.
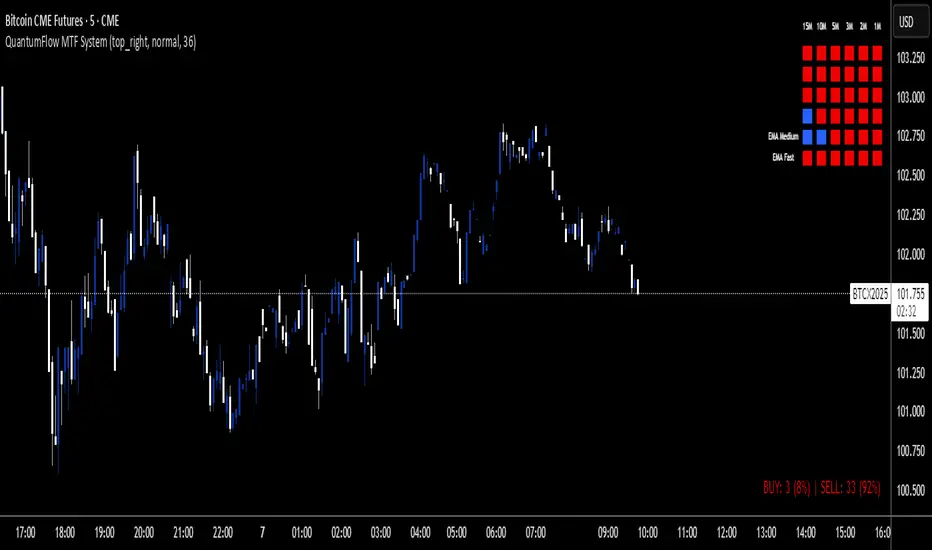
Ichimoku + Multi-Trend DashboardIchimoku + Multi-Trend Dashboard
A professional multi-indicator trend analyzer that fuses Ichimoku Cloud with volume, momentum, and price-based confirmations — all visualized in a dynamic dashboard.
🔍 Overview
The OSPL Ichimoku + Multi-Trend Dashboard is a comprehensive market-structure and momentum visualization tool built for serious traders who value clarity, precision, and confirmation.
It combines the powerful Ichimoku Cloud system with VWMA, SuperTrend, RSI, and VWAP to provide a 360-degree view of market direction, trend strength, and trade zones.
This indicator allows traders to instantly read multi-indicator alignment through a color-coded dashboard, helping filter out noise and improve timing for entries and exits.
⚙️ Core Features
🟢 1. Ichimoku Cloud Framework
Displays all major Ichimoku elements: Tenkan-Sen, Kijun-Sen, Senkou Span A & B (Kumo Cloud).
Detects Bullish and Bearish Tenkan-Kijun Crossovers.
Identifies Cloud Trend Bias (price above, below, or inside the Kumo).
Marks Buy / Sell / Wait Zones automatically based on price structure and line alignment.
⚡ 2. Multi-Indicator Confirmation Layer
Enhance trend validation using:
VWMA (Volume-Weighted Moving Average): Measures volume-driven price trend.
SuperTrend: Uses ATR to confirm trend direction and detect reversals.
RSI (Relative Strength Index): Gauges market momentum — above 50 indicates bullish bias, below 50 bearish.
VWAP (Volume-Weighted Average Price): Tracks institutional and fair value price zones.
Each of these indicators contributes to a synchronized dashboard view that instantly reveals market bias.
📊 3. Interactive Dashboard Display
Clean, modern bottom-right table summarizing indicator values and their current trend status.
Color-coded trend map:
🟢 Green = Bullish 🔴 Red = Bearish 🟡 Yellow = Neutral / Wait
Quick visual reference — ideal for active traders who rely on multiple confirmations before taking trades.
🌥 4. Kumo Visualization
Smoothly shaded Ichimoku Cloud fill highlights dominant market phase (bullish or bearish).
Dynamic transition coloring enhances visibility of potential breakouts or reversals.
🎯 How to Use
Use the dashboard as a trend alignment and confirmation tool:
Bullish Confluence Example:
Price above Kumo Cloud
Tenkan-Sen > Kijun-Sen
RSI > 50
SuperTrend below price
VWMA and VWAP trending upward
Bearish Confluence Example:
Price below Kumo Cloud
Tenkan-Sen < Kijun-Sen
RSI < 50
SuperTrend above price
VWMA and VWAP trending downward
When most indicators align in the same direction, the system provides high-probability trade zones.
It can be used across all timeframes, from intraday scalping to multi-day swing trading.
🧩 Why Use This Indicator
✅ Filters false signals by combining multiple trend tools.
✅ Eliminates the need to switch between multiple indicators.
✅ Offers an at-a-glance visual assessment of overall market bias.
✅ Adaptable to any asset: stocks, indices, forex, commodities, or crypto.
✅ Ideal for traders using trend-following, momentum, or confirmation-based strategies.
🧠 Professional Tips
Combine the dashboard signals with price action and volume breakouts for enhanced accuracy.
Use higher timeframe Ichimoku structure as a directional filter (e.g., check the 1-hour trend while trading on 15-minute).
Apply ATR-based stop loss and multi-timeframe confluence to further strengthen entries.
Works exceptionally well with Heikin Ashi candles for smoother visual trends.
💡 Suggested Use Cases
Intraday & Swing Trading
Trend Continuation & Reversal Identification
Multi-Indicator Confirmation System
Dashboard-Style Strategy Testing and Backtesting
⚠️ Disclaimer
This indicator is designed for educational and analytical purposes only.
It is not financial advice and does not guarantee profitability.
Always perform independent analysis and apply prudent risk management before executing trades.
