CUBE's V17CUBE’s V15.1 — Sparkles ⚡ + Cubes 🟨 + Smart/LC 🟫 + Golden ✨ (multi-signal scalper & trend helper)
CUBE’s V15.1 is a multi-module toolkit for intraday momentum and quick-scalp decision making. It blends a trend engine, VWAP/EMA50 band logic, CRT + Volume pair detection, weighted divergence, OBV-MACD regime flips, and “Sparkles” presets—then fuses them into readable Cube labels and higher-conviction Golden combos.
What it prints (signal taxonomy)
🟨 Cube ++ Incoming — pre-signal when price enters VWAP/EMA50 “yellow” bands with trend alignment.
🟨 Cube’s Buy ++ / Sell ++ — the “plus-plus” confirmations after CRT context; gated to avoid spam.
🟫 Last Chance → 🟫 Last Chance ++ — RSI + divergence-weighted follow-through (waits for a tiny UT flip).
🟪 Smart Cube — post-Cube, waits for KC(1.2) location + OBV presence + divergence stack (more selective).
✨ Golden (Sparkles + Cube) — objective confluence labels that require Sparkles (preset wins) plus a Cube event inside a short window. Comes in Golden-2 (2+ sparkles in 3 bars) and Golden-1 (tight 0–1 bar proximity).
Each label automatically shows “(Quick Scalp)” when price is inside the careful bands, so you know when to downshift risk.
The engines (under the hood)
Trend: Pivot-Point SuperTrend (PPST 2/10/3) drives bullish/bearish context (invertible).
Bands: 5-minute VWAP + EMA50 zones with symbol-aware tolerances (majors/ETFs/crypto/megacaps tuned).
CRT + Volume Spike Pair: detects recent hammer/shooter + volume conditions and uses them to gate higher tiers.
Weighted Divergence: RSI / Stoch (weighted) / CCI / MOM / OBV (weighted) / CMF / MFI (and more) with CRT-recency gates to keep it relevant.
UT micro-flips: tiny ATR trail crosses used to “arm” Last Chance ++ entries.
OBV-MACD regime: structural flips for the Super7 and Smart Cube filters.
Super7 Sparkles: five presets (4/8/15/24/40 bars) that score 9 modules; you can show compact ✨ icons or 9/9 text.
Quick start (60 seconds)
Add to a 1–5m chart of your instrument.
Leave defaults on; optionally toggle “Sparkle Settings” (the presets are already on).
Watch for:
✨ Golden Buy/Sell → higher-quality scalp setups.
🟨 Cube’s Buy/Sell ++ → momentum continuation outside the yellow bands.
🟪 Smart Cube → selective continuation after a Cube with KC/OBV/div confluence.
Use the built-in alerts (see list below) to automate.
Inputs & customization highlights
Invert Trend Logic — flips bull/bear interpretation (useful in range regimes).
Reference TF label anchoring — place labels using a reference timeframe; optional “(tf)” tag.
Careful (Quick-Scalp) palettes — swap label colors when inside bands; hide/show quick-scalp labels per mode.
Duplicate filters — suppress Cube repeats within a window.
Session tools — optional 6:00 PM 5m “reset” box (purple) and 9:30 AM 1m NY Open box (yellow).
Backgrounds — optional ST(10,1) 0.5–0.7 ATR ribbons for context.
Presets — five Sparkle presets with per-side alternation and wipe logic.
Alerts (names as they appear in TradingView)
⬜ Cube’s Buy / Sell (or 🟨 Incoming if trend is inverted)
🟨 CUBE’S BUY ++ / CUBE’S SELL ++ (or “Cube’s … ++” if inverted)
🟫 Buy Last Chance / 🟫 Incoming (Sell Last Chance)
🟫 Cube’s Last Chance Buy ++ / Cube’s Last Chance Sell
🟪 Smart Cube’s Buy / Smart Cube’s Sell
🔔 ALL Cube Alerts (one catch-all)
✨ G✨lden Buy/Sell (Sparkles+Cube) and G✨lden-1/2 variants
Tip: Set close-bar alerts for most signals; if you want early heads-up, allow “once per bar” but expect more noise.
Reading the labels
“(Quick Scalp)” suffix = price inside the VWAP/EMA50 careful bands; tighten targets/size.
Some labels include indicator names + a weighted count (e.g., “Hist RSI MOM 3”) to hint at divergence depth.
Star ⭐ near a label means a CRT+VOL pair was detected within the recent window.
Golden text shows the most recent cube subtype (“Cube ++”, “Smart Cube”, etc.) that satisfied the window rule.
Recommended markets & timeframes
Built-in tuning for: NQ/ES/RTY/YM, GC/CL, XAU/XAG, FX majors, BTC/ETH/SOL, SPY/QQQ/IWM/DIA, and mega-caps (AAPL, MSFT, NVDA, etc.).
Best experience on 1m–5m for intraday. Works on higher TFs but is designed around the 5-minute VWAP/EMA50 backbone.
Best practices
Confluence over single prints: Use ✨ Golden or 🟪 Smart Cube + trend + structure.
Location matters: Prefer signals near session boxes, prior day H/L, and liquidity pools.
Risk first: Size down in (Quick Scalp) zones and during lunch hours/illiquid sessions.
Avoid double-counting: The script already suppresses blatant duplicates—don’t force extra alerts.
Repainting & transparency
Core signals evaluate on confirmed bars; major request.security calls use lookahead_off.
The 1m open/6pm boxes use alignment tricks for placement; they don’t feed signal logic.
As with any multi-TF logic, real-time bars can update intra-bar—use “on close” alerts for strict confirmation.
Disclaimer
This script is for educational purposes. It’s not financial advice and does not guarantee results. Markets carry risk—always test on replay/paper first, know your instrument’s tick/fee structure, and use hard stops.
Cari dalam skrip untuk "supertrend"

Volume Cluster Heatmap [BackQuant]Volume Cluster Heatmap
A visualization tool that maps traded volume across price levels over a chosen lookback period. It highlights where the market builds balance through heavy participation and where it moves efficiently through low-volume zones. By combining a heatmap, volume profile, and high/low volume node detection, this indicator reveals structural areas of support, resistance, and liquidity that drive price behavior.
What Are Volume Clusters?
A volume cluster is a horizontal aggregation of traded volume at specific price levels, showing where market participants concentrated their buying and selling.
High Volume Nodes (HVN) : Price levels with significant trading activity; often act as support or resistance.
Low Volume Nodes (LVN) : Price levels with little trading activity; price moves quickly through these areas, reflecting low liquidity.
Volume clusters help identify key structural zones, reveal potential reversals, and gauge market efficiency by highlighting where the market is balanced versus areas of thin liquidity.
By creating heatmaps, profiles, and highlighting high and low volume nodes (HVNs and LVNs), it allows traders to see where the market builds balance and where it moves efficiently through thin liquidity zones.
Example: Bitcoin breaking away from the high-volume zone near 118k and moving cleanly through the low-volume pocket around 113k–115k, illustrating how markets seek efficiency:
Core Features
Visual Analysis Components:
Heatmap Display : Displays volume intensity as colored boxes, lines, or a combination for a dynamic view of market participation.
Volume Profile Overlay : Shows cumulative volume per price level along the right-hand side of the chart.
HVN & LVN Labels : Marks high and low volume nodes with color-coded lines and labels.
Customizable Colors & Transparency : Adjust high and low volume colors and minimum transparency for clear differentiation.
Session Reset & Timeframe Control : Dynamically resets clusters at the start of new sessions or chosen timeframes (intraday, daily, weekly).
Alerts
HVN / LVN Alerts : Notify when price reaches a significant high or low volume node.
High Volume Zone Alerts : Trigger when price enters the top X% of cumulative volume, signaling key areas of market interest.
How It Works
Each bar’s volume is distributed proportionally across the horizontal price levels it touches. Over the lookback period, this builds a cumulative volume profile, identifying price levels with the most and least trading activity. The highest cumulative volume levels become HVNs, while the lowest are LVNs. A side volume profile shows aggregated volume per level, and a heatmap overlay visually reinforces market structure.
Applications for Traders
Identify strong support and resistance at HVNs.
Detect areas of low liquidity where price may move quickly (LVNs).
Determine market balance zones where price may consolidate.
Filter noise: because volume clusters aggregate activity into levels, minor fluctuations and irrelevant micro-moves are removed, simplifying analysis and improving strategy development.
Combine with other indicators such as VWAP, Supertrend, or CVD for higher-probability entries and exits.
Use volume clusters to anticipate price reactions to breaking points in thin liquidity zones.
Advanced Display Options
Heatmap Styles : Boxes, lines, or both. Boxes provide a traditional heatmap, lines are better for high granularity data.
Line Mode Example : Simplified line visualization for easier reading at high level counts:
Profile Width & Offset : Adjust spacing and placement of the volume profile for clarity alongside price.
Transparency Control : Lower transparency for more opaque visualization of high-volume zones.
Best Practices for Usage
Reduce the number of levels when using line mode to avoid clutter.
Use HVN and LVN markers in conjunction with volume profiles to plan entries and exits.
Apply session resets to monitor intraday vs. multi-day volume accumulation.
Combine with other technical indicators to confirm high-probability trading signals.
Watch price interactions with LVNs for potential rapid movements and with HVNs for possible support/resistance or reversals.
Technical Notes
Each bar contributes volume proportionally to the price levels it spans, creating a dynamic and accurate representation of traded interest.
Volume profiles are scaled and offset for visual clarity alongside live price.
Alerts are fully integrated for HVN/LVN interaction and high-volume zone entries.
Optimized to handle large lookback windows and numerous price levels efficiently without performance degradation.
This indicator is ideal for understanding market structure, detecting key liquidity areas, and filtering out noise to model price more accurately in high-frequency or algorithmic strategies.

Tweezer & Kangaroo Zones [WavesUnchained]Tweezer & Kangaroo Zones
Pattern Recognition with Supply/Demand Zones
Indicator that detects tweezer and kangaroo tail (pin bar) reversal patterns and creates supply and demand zones. Includes volume validation, trend context, and confluence scoring.
What You See on Your Chart
Pattern Labels:
"T" (Red) - Tweezer Top detected above price → Bearish reversal signal
"T" (Green) - Tweezer Bottom detected below price → Bullish reversal signal
"K" (Red) - Kangaroo Bear (Pin Bar rejection from top) → Bearish signal
"K" (Green) - Kangaroo Bull (Pin Bar rejection from bottom) → Bullish signal
Label Colors Indicate Pattern Strength:
Dark Green/Red - Strong pattern (score ≥8.0)
Medium Green/Red - Good pattern (score ≥6.0)
Light Green/Red - Valid pattern (score <6.0)
Zone Boxes:
Red Boxes - Supply Zones (resistance, potential short areas)
Green Boxes - Demand Zones (support, potential long areas)
White Border - Active zone (fresh, not tested yet)
Gray Border - Inactive zone (expired or invalidated)
Pattern Detection
Tweezer Patterns (Classic Double-Top/Bottom):
Flexible Lookback - Detects patterns up to 3 bars apart (not just consecutive)
Precision Matching - 0.2% level tolerance for high-quality signals
Wick Similarity Check - Both candles must show similar rejection wicks
Volume Validation - Second candle requires elevated volume (0.8x average)
Pattern Strength Score - 0-1 quality rating based on level match + wick similarity
Optional Trend Context - Can require trend alignment (default: OFF for more signals)
Kangaroo Tail / Pin Bar Patterns:
No Pivot Delay - Instant detection without waiting for pivot confirmation
Body Position Check - Body must be at candle extremes (30% tolerance)
Volume Spike - Rejection must occur with volume (0.9x average)
Rejection Strength - Scores based on wick length (0.5-0.9 of range)
Optional Trend Context - Bearish in uptrends, Bullish in downtrends (default: OFF)
Zone Management
Auto-Created Zones - Every valid pattern creates a supply/demand zone
Overlap Prevention - Zones too close together (50% overlap) are not duplicated
Lifetime Control - Zones expire after 400 bars (configurable)
Smart Invalidation - Zones invalidate when price closes through them
Styling Options - Choose between Solid, Dashed, or Dotted borders
Border Width - 2px width for better visibility
Confluence Scoring System
Multi-factor confluence scoring (0-10 scale) with configurable weights:
Regime (EMA+HTF) - Trend alignment across timeframes (Weight: 2.0)
HTF Stack - Multi-timeframe trend confluence (Weight: 3.0)
Structure - Higher lows / Lower highs confirmation (Weight: 1.0)
Relative Volume - Volume surge validation (Weight: 1.0)
Chop Advantage - Favorable market conditions (Weight: 1.0)
Zone Thinness - Tight zones = better R/R (Weight: 1.0)
Supertrend - Trend indicator alignment (Weight: 1.0)
MOST - Moving Stop alignment (Weight: 1.0)
Pattern Strength - Quality of detected pattern (Weight: 1.5)
Zone Retest Signals
Signals generated when zones are retested:
BUY Signal - Price retests demand zone from above (score ≥4.5)
SELL Signal - Price retests supply zone from below (score ≥5.5)
Normalized Score - Displayed as 0-10 for easy interpretation
Optional Trend Gate - Require trend alignment for signals (default: OFF)
Alert Ready - Built-in alertconditions for automation
Additional Features
Auto-Threshold Tuning - Adapts to ATR and Choppiness automatically
Session Profiles - Different settings for RTH vs ETH sessions
Organized Settings - 15+ input groups for easy configuration
Optional Panels - HTF Stack overview and performance metrics (default: OFF)
Data Exports - Hidden plots for strategy/library integration
RTA Health Monitoring - Built-in performance tracking
Setup & Configuration
Quick Start:
1. Apply indicator to any timeframe
2. Patterns and zones appear automatically
3. Adjust pattern detection sensitivity if needed
4. Configure zone styling (Solid/Dashed/Dotted)
5. Set up alerts for zone retests
Key Settings to Adjust:
Pattern Detection:
• Min RelVolume: Lower = more signals (0.8 Tweezer, 0.9 Kangaroo)
• Require trend context: Enable for stricter, higher-quality patterns
• Check wick similarity: Ensures proper rejection structure
Zone Management:
• Zone lifetime: How long zones remain active (default: 400 bars)
• Invalidate on close-through: Remove zones when price breaks through
• Max overlap: Prevent duplicate zones (default: 50%)
Scoring:
• Min Score BUY/SELL: Higher = fewer but better signals (default: 4.5/5.5)
• Component weights: Customize what factors matter most
• Signals require trend gate: OFF = more signals, ON = higher quality
Visual Customization
Zone Colors - Light red/green with 85% transparency (non-intrusive)
Border Styles - Solid, Dashed, or Dotted
Label Intensity - Darker greens for better readability
Clean Charts - All panels OFF by default
Understanding the Zones
Supply Zones (Red):
Created from bearish patterns (Tweezer Tops, Kangaroo Bears). Price made a high attempt to push higher, but was rejected. These become resistance areas where sellers may step in again.
Demand Zones (Green):
Created from bullish patterns (Tweezer Bottoms, Kangaroo Bulls). Price made a low with strong rejection. These become support areas where buyers may step in again.
Zone Quality Indicators:
• White border = Fresh zone, not tested yet
• Gray border = Zone expired or invalidated
• Thin zones (tight range) = Better risk/reward ratio
• Thick zones = Less precise, wider stop required
Trading Applications
Reversal Trading - Enter at pattern detection with tight stops
Zone Retest Trading - Wait for retests of established zones
Trend Confluence - Trade only when patterns align with trend
Risk Management - Use zone boundaries for stop placement
Target Setting - Opposite zones become profit targets
Pro Tips
Best signals occur when pattern + zone retest + trend all align
Lower timeframes = more signals but more noise
Higher timeframes = fewer but more reliable signals
Start with default settings, adjust based on your market
Combine with other analysis (structure, key levels, etc.)
Use alerts to avoid staring at charts all day
Important Notes
Not all patterns will lead to successful trades
Use proper risk management and position sizing
Patterns work best in trending or range-bound markets
Very choppy conditions may produce lower-quality signals
Always confirm with your own analysis before trading
Technical Specifications
• Pine Script v6
• RTA-Core integration
• RTA Core Library integration
• Maximum 200 boxes, 500 labels
• Auto-tuning based on ATR and Choppiness
• Session-aware threshold adjustments
• Memory-optimized zone management
What's Included
Tweezer Top/Bottom detection
Kangaroo Tail / Pin Bar detection
Automatic supply/demand zone creation
Volume validation system
Pattern strength scoring
Zone retest signals
Multi-factor confluence scoring
Optional HTF Stack panel
Optional performance metrics
Session profile support
Auto-threshold tuning
Alert conditions
Data exports for strategies
Author Waves Unchained
Version 1.0
Status Public Indicator
Summary
Reversal pattern detection with zone management, volume validation, and confluence scoring for tweezer and kangaroo tail patterns.
---
Disclaimer: This indicator is for educational and informational purposes only. Trading involves risk. Past performance does not guarantee future results. Always practice proper risk management.

[ZP] Fixed v6 testDISCLAIMER:
This indicator in Pine V6 as my first ever Tradingview indicator, has been developed for my personal trading analysis, consolidating various powerful indicators that I frequently use. A number of the embedded indicators within this tool are the creations of esteemed Pine Script developers from the TradingView community. In recognition of their contributions, the names of these developers will be prominently displayed alongside the respective indicator names. My selection of these indicators is rooted in my own experience and reflects those that have proven most effective for me. Please note that the past performance of any trading system or methodology is not necessarily indicative of future results. Always conduct your own research and due diligence before using any indicator or tool.
===========================================================================
Introducing the ultimate all-in-one DIY strategy builder indicator, With over 30+ famous indicators (some with custom configuration/settings) indicators included, you now have the power to mix and match to create your own custom strategy for shorter time or longer time frames depending on your trading style. Say goodbye to cluttered charts and manual/visual confirmation of multiple indicators and hello to endless possibilities with this indicator.
Available indicators that you can choose to build your strategy, are coded to seamlessly print the BUY and SELL signal upon confirmation of all selected indicators:
EMA Filter
2 EMA Cross
3 EMA Cross
Range Filter (Guikroth)
SuperTrend
Ichimoku Cloud
SuperIchi (LuxAlgo)
B-Xtrender (QuantTherapy)
Bull Bear Power Trend (Dreadblitz)
VWAP
BB Oscillator (Veryfid)
Trend Meter (Lij_MC)
Chandelier Exit (Everget)
CCI
Awesome Oscillator
DMI ( Adx )
Parabolic SAR
Waddah Attar Explosion (Shayankm)
Volatility Oscillator (Veryfid)
Damiani Volatility ( DV ) (RichardoSantos)
Stochastic
RSI
MACD
SSL Channel (ErwinBeckers)
Schaff Trend Cycle ( STC ) (LazyBear)
Chaikin Money Flow
Volume
Wolfpack Id (Darrellfischer1)
QQE Mod (Mihkhel00)
Hull Suite (Insilico)
Vortex Indicator

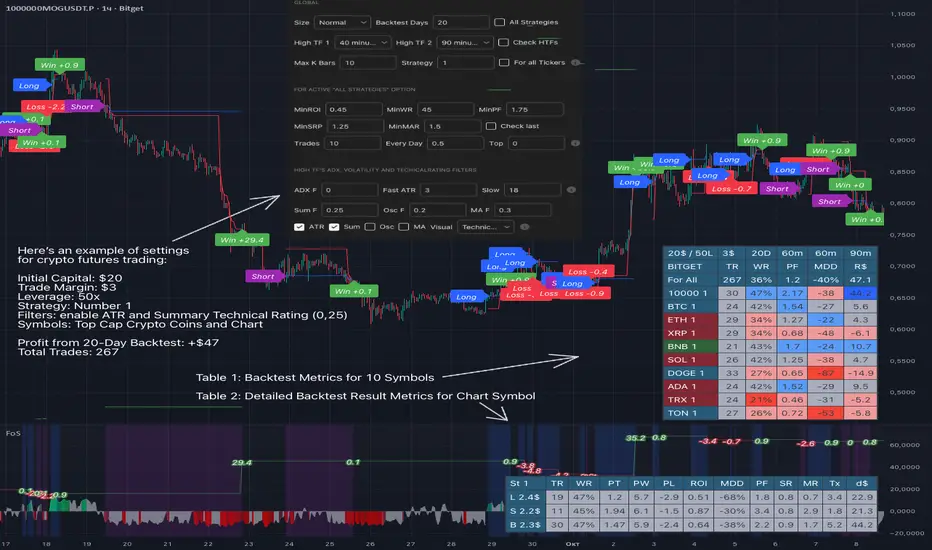
Force of Strategy (FoS, Multi TF/TA, Backtest, Alerts)Introducing the FoS Trading System
A comprehensive and innovative solution designed for both novice and experienced traders to enhance their intraday trading.
The basic idea of creating this script is to stay profitable in any market
Key Features:
There are over 25 no-repaint strategies for generating buy and sell signals to choose from
10 symbols for simultaneous trading
Webhook alerts in TTA format (tradingview to anywhere) pre-configured to send messages for trading cross-margin futures on major Crypto Exchanges: Binance, Bitget, BingX, Bybit, GateIO and OKX
A unique automated "Strategy switcher" feature for backtesting and live trading—not just a specific strategy, but the logic behind choosing a trading one or another strategy based on backtesting data obtained in real time
Advanced risk management options and backtest result metrics
Higher Timeframe filters (Technical Rating, ADX, Volatility) and ability for check backtest results with 9 main higher timeframes
Buy and sell signals are generated using TradingView Technical Ratings, indicators with adaptive length algorithms and various classic indicators with standard settings to avoid overfitting
Next, I will describe in detail what this script does and what settings it operates with:
"All Strategies" off
- In the global settings block, as shown in the main chart screenshot, you select how long the script will perform backtests in days, with a limitation on the number of bars for calculations. This limitation is necessary to maintain an acceptable calculation speed. You also choose which two higher timeframes we will use for signal and filters when confirming the opening of trades
- With "All Strategies" off - as in the example on the main chart screenshot, trading is carried out by strategy #1 on 10 selected tickers simultaneously. By default, I selected the 9 top-capitalized cryptocurrencies on the Bitget exchange and the chart symbol. You can change that choice of 9 non chart opened instruments and # strategy for each them
- The first row in the table 1 shows some of the main choosen script settings, in attached example: initial capital 20$, leverage 50L, 20 backtest days, 3$ is invest in one deal, 60m - is chart timeframe, next 60m is higher timeframe 1 and last 90m is higher timeframe 2. In first column you see shortened to 5 characters ticker names
- The exchange name in the second row determines the alert messages format
I've attached another example of trading with setting "All strategies" off in the image below. In this example, trading 10 standard symbols on an hourly timeframe, 2 coins from 10: 1000SATS and DOGE have generated a profit of over $65 over the past 20 days using strategy #4
Can you browse a wide range of trading instruments and select the 10 best strategies and settings for future trading? Of course, trading is what this script is do!
The parameters in the table 1 mean the following:
TR - count of closed trading deals
WR - Winning Rate, PF - Profit Factor
MDD - Max Draw Down for all calculated time from initial capital
R$ - trading profit result in usd
The parameters in the table 2 is just more metrics for chart symbol:
PT - result in usd Per one Trade
PW - result Per Win, PL - result Per Lose
ROI - Rate of Investments
SR - Sharpe Ratio, MR - CalMAR ration
Tx - Commision Fee in Usd
R$ - trading profit result in usd again
Table 2 separate trade results of backtesting for longs and shorts. In first column you see how many USD were invested in one trade, taking into account possible position splitting (will be discussed in more detail in the risk management section)
Settings:
"All Strategies" on, "Check Last" off
When "All Strategies" is active, trading changed from 10 symbols and one strategy to all strategies and one chart symbol. If option "Check Last" is inactive you will see backtest results for each of strategy in backtest setting days. This is useful, for example, if you want to see backtest results under different settings over a long period of time for calibrating risk management or entry rules
"All Strategies" on, "Check Last" on
- If "All Strategies" and "Check Last" is active trading will occur on the chart symbol only for those strategies that meet the criteria of the settings block for the enabled "All Strategies" option. For example your criteria is: for last 5 trades for all strategies, open next trade only on strategy which reached ROI 25% and WinRate 50%. When strategy with this setting criteria receive Buy or Sell Signal this trade will be opened, and when trade will be close "check last" will repeat. This feature i called "Strategy switcher"
-In Table 1 if strategy meet criteria you will see "Ok" label, if strategy meet criteria and have maximum from other reached ROI they labeled "Best". Chart strategy labeled "Chart", Chart and Ok labels in one time is "Chart+", "Chart" and "Best" is labeled "Best+"
- The color in the first column of table 1 indicates that the strategy is currently in an open position: green means an open long position, red means an open short position.
In picture bellow you will see good example for trading with check results for last 10 trades, and make desicion for trading when criteries 0.25 ROI and WinRate 50% reached for Top 2 by ROI strategies from all list of them. This example of trading logic in last 20 days (include periods when strategy don't arise 10 trades) give a profit $30+. At the bottom of the screen, you can see Labels with the numbers of the strategies that opened the trades. In this example, trades were primarily opened using strategy number 2, and the second most effective strategy after the 20-day backtest was strategy number 9
Who can promise you'll make a profit of $30 in the next 20 days with a drawdown of no more than $8 from the initial $20 with invest in one trade just 2.7$? No one. But this script guarantees that in the future it will repeat the same logic of switching trading strategies that brought profit over the last 20 days
Risk management options
- When a buy or sell trade is opened, you'll see three lines on the chart: a red stop-loss line (SL), a green take-profit line (TP), and a blue line representing the entry price. The trade will be closed if the high price or low price reaches the line TP or SL (no wait for bar close) and alert will be triggered once per bar when script recalculates
- Several options are available to control the behavior of SL/TP lines, such as stop-loss by percentage, ATR, or Highest High (HH) and Lowest Low (LL). Take Profit can be in percent, ATR or in Risk Reward ratio. There some Trailing Stop with start trail trigger options, like ATR, percent or HH / LL
- Additionally, in risk managment settings a function has been implemented for adding a position when the breakeven level expressed in the current ROI is reached for opened trade (splitting position). The position is added within the bar.
- Webhook alerts in TTA format with message contained next info : Buy / Sell or adding Quantity, Leverage, SL price, TP price and close trade
Keep in mind if the stop-loss changed when adding a position, the stop-loss will not be able to be higher than the current bar's low price, regardless of your settings, as backtest trades do not use intra-bar data, in this situation SL will be correct at next bar (but alert message don't be sended twice). And please note that this script does not have an option to simultaneously open trades in different directions. Only 1 trade can be opened for 1 trading instrument at a time
Backtest Engine
Backtest is a very important part of this script. Here describe how its calculate:
- Profit or Loss is USD: close trade price * open trade quantity - open trade price * open trade quantity - open trade quantity * (open trade price + close trade price)/2 * commision fee
Possible slippage or alert sending delay needed to be include in commission % which you will set in risk managment settings block, default settings is 0.15% (0,06% for open, 0,06% for close and 0,03% for possible slippage or additional fees)
- Maximum Draw Down: Drawdown = (peak - current equity) / peak * 100 ;
Drawdown > maxDrawdown ? maxDrawdown = Drawdown
- ROI: profit result in USD / sum of all positions margin
- CalMAR Ratio: ROI / (-MaxDrawDown)
- Sharpe Ratio: ROI / standard deviation for (Sum of all Profits and Loses) / (Sum of all Position Margins)
This description was added because in metrics i don't use parameters like "The risk-free rate of return". Keep in mind how exactly this script calculate profit and perfomance when adjusting key criteria in the strategy switching parameters block of script settings
Strategies itself
For trading, you can enable or disable various Higher Timeframes Filters (ADX, volatility, technical rating).
With filters enabled, trades will only open when the setting parameters are reached
- Strategy number 1, 2 and 3: is Higher Timeframe TradingView Technical Ratings itself, 1 is summary total rating, 2 is oscillators and 3 is moving averages. When TR filter cross filter levels trade will be open at chart bar close. By Default on chart you see Summary Technical Rating oscillator, but here the options for change it to Oscillator TR or Moving Average TR
- Strategy number 4, 5 and 6: is Chart TimeFrame TR. Trades will open when its values (Summary, Oscillators and Moving Averages) reached setting buy sell level
- Strategy number 7, 8 and 9: is Alternative buy sell logic for Chart TimeFrame TR, trades will open when counting rising or falling values will be reached
- Strategies with number from 10 to 18: is chosen by user adaptive moving averages and oscillators indicators. There in settings you will see many different adaptive length algorithms for trading and different types of moving averages and oscillators. In tooltips in settings you will find very more information, and in settings you will see list of all indicators and algorithms (more than 30 variations). All adaptive strategies have their options in settings for calibrating and plotting
- Strategies with number from 19: its can't be chosen or calibarted, this is needed for avoid overfitting, i try to found mostly time worked strategies and use its with standard settings. In future it's possible to changing current or adding additional strategies. At the time of publication this script uses: Dynamic Swing HH LL (19), Composite indicator (20), %R Exhausting with different signals (21,22,23), Pivot Point SuperTrend (24), Ichimoku Cloud (25), TSI (26), Fib Level RSI (27). I don't plot classic strategies in this script
Let me explain, the value of this script is not in the strategies it includes, but in how exactly it collects the results of their work, how it filters the opening of trades, what risk management it applies and what strategy switching logic it performs. The system itself that you are now reading about represents the main value of this script
Finally if you get access for this script
- You will see many other not described options and possibilities like Kelly position or list of settings for adaptive strategies, also i added many usefull tooltips in script settings
Happy trading, and stay tuned for updates!
DISCLAIMER: No sharing, copying, reselling, modifying, or any other forms of use are authorized for this script, and the information published with them. This script is strictly for individual use. No one know future and Investments are always made at your own risk. I am not responsible for any losses you may incur. Please before investment make sure that chosen logic is enaugh profitable on virtual demo account.
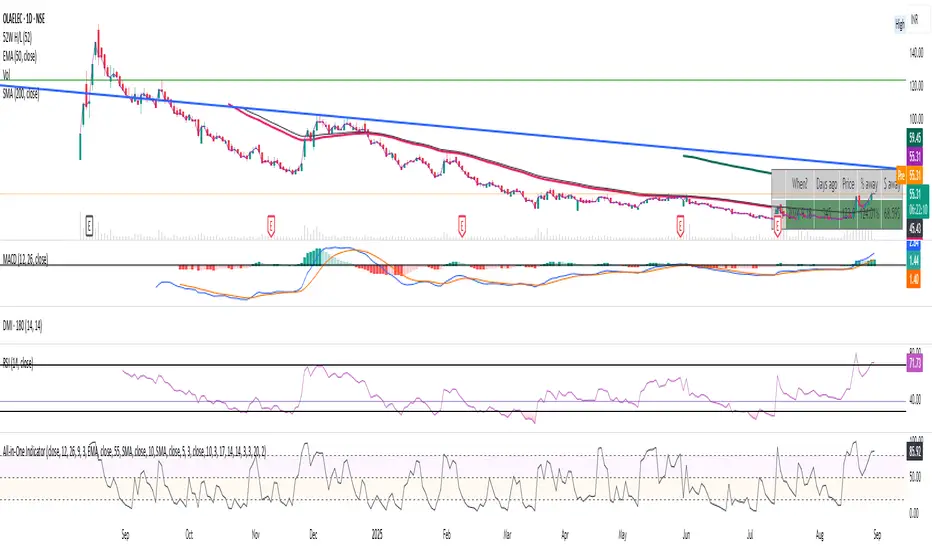
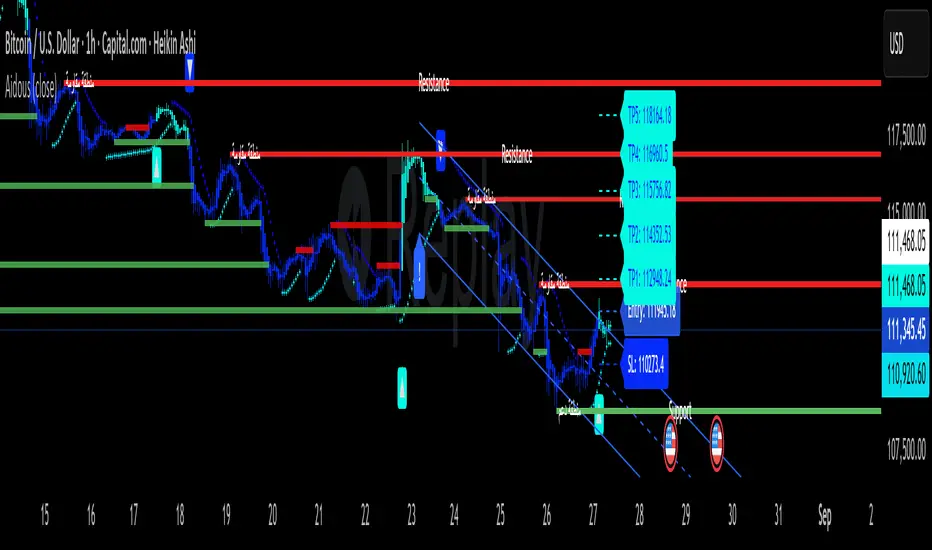
Aidous IndicatorAidous Indicator – Multi-Framework Trend & Liquidity Suite
The Aidous Indicator is a comprehensive, multi-layered technical analysis tool built for traders seeking precision, adaptability, and clarity across all timeframes. It combines several advanced methodologies into a single, cohesive framework that dynamically adjusts to market conditions.
🔧 Key Features
Adaptive Trend Detection
Utilizes a custom momentum-weighted smoothing algorithm enhanced by volatility and strength filters (ATR, ADX) to identify reliable trend shifts.
Trade Management System
Automatically plots entry, stop-loss, and five take-profit levels based on dynamic volatility metrics, with real-time updates and visual cues.
Liquidity Line Extension
Tracks volume at key price levels and extends lines when price interacts with previously identified zones, helping visualize market interest.
Support & Resistance Zones
Detects swing highs/lows and plots non-overlapping zones with optional bilingual labeling for broader accessibility.
Fibonacci Projection Tool
Integrates ZigZag pivots to project Fibonacci levels with customizable display options, including value and percentage formats.
Linear Regression Channel
Automatically adjusts lookback periods based on timeframe and plots trend channels with breakout detection and directional labeling.
Parabolic SAR Overlay
Optional PSAR component for additional trend confirmation, plotted with intuitive color coding.
Secondary Buy/Sell Signal Engine
A custom supertrend logic enhanced by EMA crossover validation to highlight high-probability trade entries.
🧠 How It Works
The indicator is built using modular logic and timeframe-aware parameters. It leverages:
Custom smoothing and momentum calculations
Volatility and volume filters
Dynamic plotting of trade zones and trend signals
Visual enhancements for clarity and usability
Real-time alerts for actionable signals
This tool is suitable for scalping, intraday, swing, and long-term strategies, offering traders a versatile and visually rich experience.
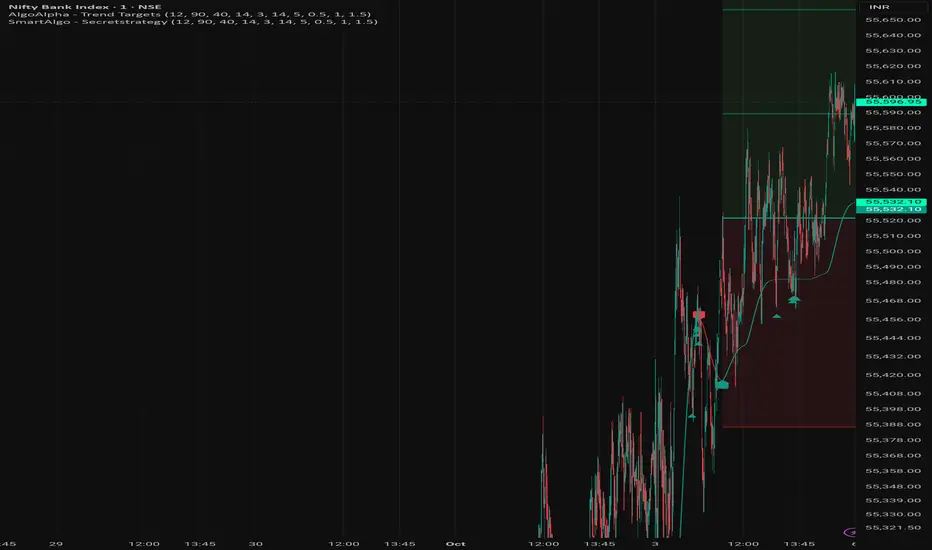
Secret strategy[Smartalgo]We are revealing our secret trading strategy through Tradingview indicator
FEATURES
Trend Detection: Automatically identifies trend direction using a smoothed Supertrend (WMA + EMA), with shape markers on trend shifts and color-coded bars for clarity.
snapshot
Rejection Signals: Detects price rejections at the trend line after a user-defined number of consolidation bars; plots ▲/▼ icons to highlight strong continuation setups.
snapshot
Target Projection: On trend confirmation, plots entry, stop-loss (ATR-based), and three dynamic take-profit levels based on customizable
snapshot
multiples.
Dynamic Updates: All levels (entry, SL, TP1–TP3) auto-adjust based on volatility and are labeled in real time on the chart.
Customization: Users can tweak trend parameters, rejection confirmation count, SL/TP ratios, smoothing lengths, and appearance settings.
Alerts: Built-in alerts for trend changes, rejection events, and when TP1, TP2, or TP3 are reached.
Chart Overlay: Plots directly on price chart with minimal clutter and clearly labeled levels for easy trading.
Syed Shams - PSX Dashboard v2.0A compact dashboard that summarizes trend/strength context for Pakistan stocks and indices. It normalizes signals from widely-used tools into a single table so you can triage symbols quickly—no alerts, no buy/sell calls.
What’s inside (columns):
------------------------------
- Scrip / Price / Δ%: Symbol, last price, and percent change vs the previous bar close on the active timeframe (e.g., on 1D it’s vs prior daily close).
- LMH / LML / LWH / LWL: Last Month/Week High & Low. Optional setting to use closed prior M/W bars.
- EMAs 5/9/21/44/100/200: Six mini-squares. Green = price ≥ that EMA, Red = below.
- RS5 / RS21 (vs KSE100): Arrows show out/under-performance over two user-set return windows.
- RSI: Text = RSI value with slope arrow; Blue fill when RSI > its EMA (bullish bias), Red fill when below.
- OBV: Blue/Red fill for OBV vs its EMA; slope arrow uses the global Slope Lookback.
- MACD (M A C D): 4 tiny histogram bars colored by quadrant/acceleration for quick trend read.
- ADX / DMI: ADX value (color-coded: >50 red, 25–50 green, 20–25 orange, <20 red) + slope arrow. +DI / −DI arrows with neutral/green/red fill when +DI dominates/equals/−DI dominates.
- ST 5,1 / ST 8,2: Green/Red dots for SuperTrend state.
- Ichimoku: Cell fill for price vs cloud (above/inside/below). “Laser” dash appears on fresh HH/LL checks.
- BB Zone: Uses BB(20,1/2/3).
• price ≥ U2 → “BB3” (Dark Blue text, Light Blue fill)
• U1 < price < U2 → “BB2” (Dark Blue / Light Blue)
• L1 ≤ price ≤ U1 → “BB1” (Dark Green / Light Green)
• L2 < price < L1 → “BB2” (Dark Red / Light Red)
• price ≤ L2 → “BB3” (Dark Red / Light Red)
Also shows BB3 upper-band slope using the global lookback: “+” widening, “−” contracting, “=” flat.
- Grade (A/B/C/D): Optional composite score; rows sort by score when enabled.
Grade scoring:
------------------
Price ≥ each EMA +1 (max +6) · RS5>idx +2, RS21>idx +1 · OBV>EMA +2, OBV-EMA↑ +1 · RSI>50 +2, RSI>EMA +1, RSI slope↑ +2 / ↓ −2 · MACD hist: ≥0&rising +2, ≥0&falling +1, <0&falling −2, <0&rising −1 · +DI>−DI +1, +DI slope↑ +1 · ADX: >50 −2, 25–50 +2, 20–25 +1, ADX slope↑ +1 · ST(5,1) +1, ST(8,2) +1 · Ichimoku: above cloud +1, below −1, HH “laser” +2 / LL −2 · BB zone: inside BB1 +1; above BB1 +2; BB3 widening +2; shrinking −2; flat 0.
Controls & workflow:
-------------------------
- Universe selector (incl. sector lists and Custom Watchlist).
- Show KSE index rows (off by default).
- Slope Lookback (arrows): one control for RSI/ADX/DMI/OBV/BB3 slope checks.
- Closed bars for LM/LW H/L (off by default).
- Dark Mode (off by default): optimized table contrast for black charts.
- Show Grades toggle.
How to use:
---------------
1) Pick your universe and timeframe.
2) Adjust Slope Lookback (default 1) if you want a stricter/looser slope test.
3) Sort by Grade (on) to find leaders/laggards, then open charts for entries/exits using your own process.
Notes:
--------
- Timeframe-aware: all calculations—including Δ% and RS windows—use the active chart TF.
- Educational research tool. Not investment advice. No alerts.

BTC Pro – Modular v6 (Final Version with Clean Labels)A complete Bitcoin charting toolkit built for clarity and decision-making.
✅ EMA levels (21, 50, 200, 800)
✅ Daily EMA 50 (constant across timeframes)
✅ SuperTrend for directional bias
✅ Liquidity zones based on ±2×ATR around SMA50
✅ On-Balance Volume (manual calculation)
✅ ADX trend strength with threshold labeling
✅ RSI divergence detection (bullish/bearish)
✅ Market structure: HH/LL breaks
✅ Entry zones with auto-generated SL/TP boxes
✅ Clean right-side labels (stacked)
✅ Modular toggles for full control via settings
Created by WhyPhy – modular, readable, and ready for live use.

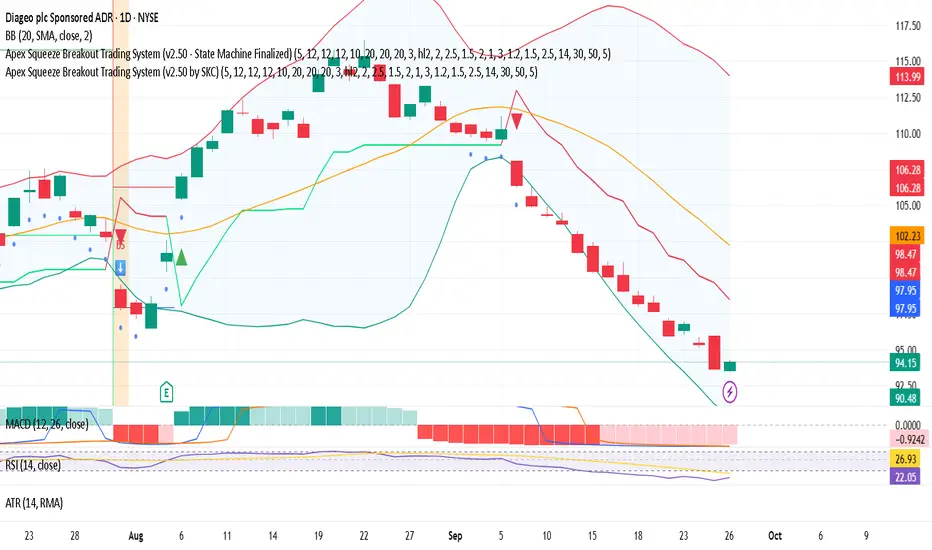
Apex Squeeze Breakout Trading System (by SKC)Apex Squeeze Breakout Trading System (by SKC)
This system is designed to detect high-probability squeeze breakout opportunities using a hybrid scoring model of momentum, volume, volatility, and trend confirmation. It includes:
SuperTrend-based trend shifts
Breakout detection using Bollinger/Keltner channel compression
Volume spike filters
RSI-based recovery signals
Dynamic ATR-based SL and TP levels (T1 & T2)
Trade state management with label journaling
Configurable for Day Trading or Swing setups
Visuals: Buy/Sell markers, Entry/SL/TP levels, Squeeze dots, PS/SS markers
Perfect for traders seeking clear, structured entries with defined risk and multiple profit targets.
Developed & finalized by SKC.
Let me know if you want a more technical, shorter, or fun version.
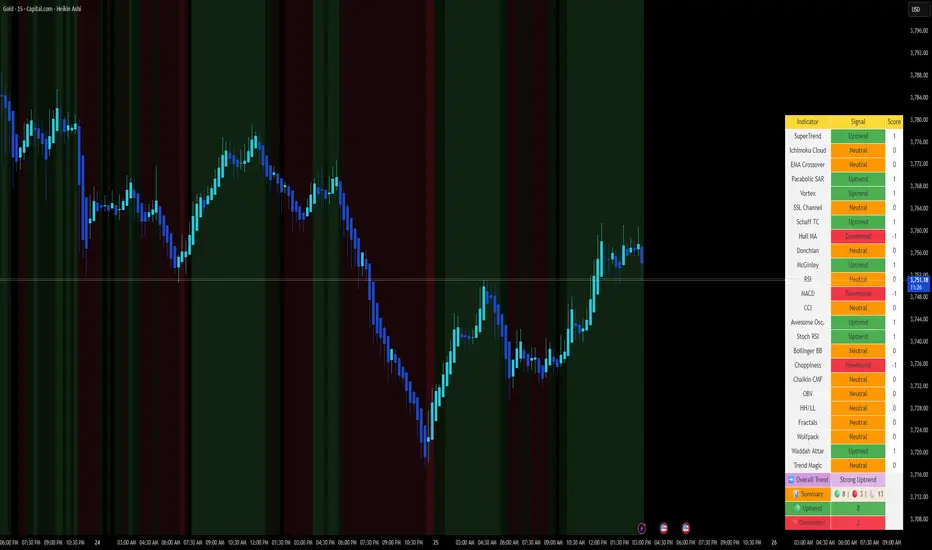
📈 Aidous-Comprehensive Trend Signal Matrix📈 Aidous-Comprehensive Trend Signal Matrix
A powerful, multi-dimensional trend analysis tool that aggregates signals from 24+ technical indicators across 6 key categories:
Pure Trend Indicators (SuperTrend, Ichimoku, EMA Crossover, Parabolic SAR, etc.)
Momentum Oscillators (RSI, MACD, CCI, Stochastic RSI, Awesome Oscillator)
Volatility-Based Tools (Bollinger Bands, Choppiness Index)
Volume & Flow Indicators (Chaikin Money Flow, OBV)
Price Action Filters (Higher Highs/Lower Lows, Fractals)
Custom & Proprietary Logic (Wolfpack ID, Waddah Attar Explosion, Trend Magic)
This indicator doesn’t just show one signal—it synthesizes 24 independent trend signals into a unified matrix, giving you a holistic view of market direction. The Overall Trend is dynamically classified as:
Strong Uptrend (≥ +5 net bullish signals)
Uptrend (+1 to +4)
Neutral (balanced or conflicting signals)
Downtrend (–1 to –4)
Strong Downtrend (≤ –5 net bearish signals)
📊 Interactive Table Display
Choose between Full Table (detailed per-indicator breakdown) or Compact Summary mode. Customize position and size to fit your chart layout.
🎨 Visual Feedback
Background color changes based on overall trend strength
Color-coded signal cells (green = bullish, red = bearish, orange = neutral)
Real-time signal counts for quick sentiment assessment
💡 How to Use:
Use the Overall Trend for high-level market bias
Drill into the table to identify which indicators are driving the signal
Combine with your own strategy for confluence-based entries/exits
⚠️ Disclaimer:
This script is provided "as is" without warranty of any kind. Past performance is not indicative of future results. Always conduct your own analysis and risk management.
Staolin Trade maxx V1This script is a custom TradingView indicator named "Staolin Trade maxx V1". It overlays on price charts and includes features for visualizing support and resistance zones, trendlines, EMA-based trend fills, higher high/lower low labels, range boxes, Supertrend buy/sell signals, risk management lines with SL/TP levels, and customizable moving averages. Inputs allow toggling elements like trendlines, EMA trends, labels, ranges, and levels, as well as adjusting lengths, colors, sensitivities, signal strengths, and risk-reward ratios. Zones appear as gradient-filled bands (red for upper, green for lower), trendlines as extending lines (teal up, red down), EMA fills as translucent ribbons (green up, red down), labels as triangles (green HH, red LL), ranges as colored boxes (blue unbroken, green/red broken), signals as labels (green buy, red sell), SL/TP as extending lines with emoji-labeled tags (blue entry, red SL, green TPs), and MAs as lines (blue 5, red 13, green 20).

Ameebha D Equities Buy IndicatorShows Buy Decision and key metrics (RS, EMA, Supertrend, Close Price)

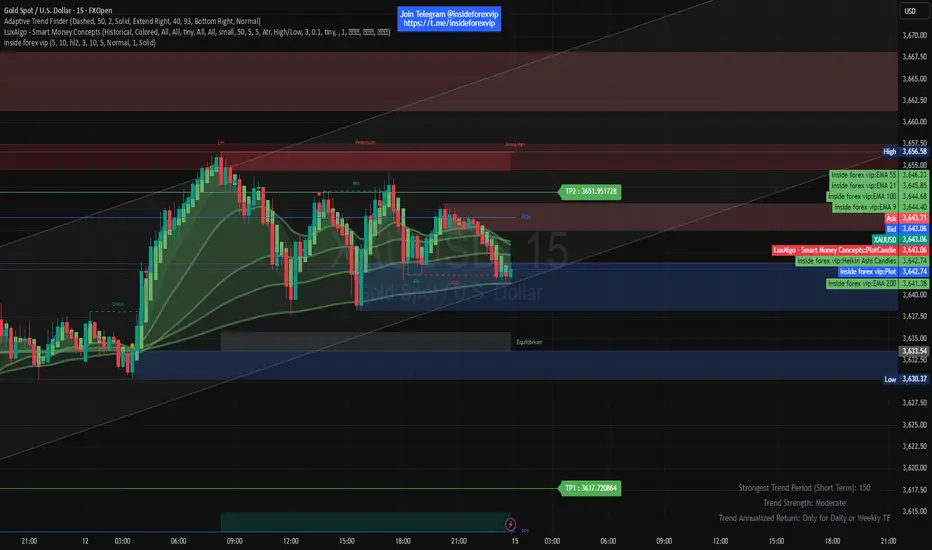
inside forex vip📌 SuperTrend
Based on:
ATR Period (default 10).
Multiplier ATR (default 3).
Calculates the trend direction (upward/downward).
Generates buy/sell signals:
Buy: Positive crossover with EMA color matching (bullish).
Sell: Negative crossover with EMA color matching (bearish).
[DEM] Other Asset Predicting Indicator Other Asset Predicting Indicator is a cross-asset signal generator that uses technical signals from one market to predict price movements in the current chart's asset, based on the correlation between the two instruments. The indicator allows users to select from a comprehensive list of assets including major indices, sector ETFs, cryptocurrencies, forex pairs, country ETFs, and commodities, then applies one of four technical signal methods (Supertrend, Parabolic SAR, EMA Cross, or MACD Crossover) to generate buy and sell signals from the selected reference asset. A key feature is the built-in correlation analysis that calculates a rolling correlation coefficient between the current asset and the reference asset, displayed in a color-coded table where green indicates positive correlation (above 0.5) and red shows negative correlation (below 0.5). The indicator includes an option to invert signals for negatively correlated assets, making it particularly useful for identifying intermarket relationships and leveraging leading indicators from related markets to anticipate price movements in the current instrument.
Multi-Strategy Trading Screener SummaryI only combined famous scripts, all thanks to wonderful scripts and community out there .
ThankYou !
------
Core Architecture
Multi-Symbol Analysis: Tracks up to 5 configurable tickers simultaneously
Multi-Timeframe Support: Each symbol can use different timeframes
Real-Time Dashboard: Color-coded table displaying all signals and analysis
Trend Validation: All signals include trend alignment confirmation
Integrated Trading Strategies
1. Breaker Blocks (Order Blocks)
Detects institutional order blocks using swing analysis
Tracks when blocks are broken and become "breaker blocks"
Monitors retests of broken levels
Shows trend alignment (✓ aligned, ⚠️ misaligned)
2. Chandelier Exit
ATR-based trend-following exit system
Provides BUY/SELL signals based on dynamic stop levels
Uses configurable ATR multiplier and lookback period
3. Smart Money Breakout
Channel breakout detection with volatility normalization
Identifies accumulation/distribution phases
Generates persistent BUY/SELL signals on breakouts
4. Trendline Breakout
Dynamic trendline detection using pivot highs/lows
Calculates trendline slopes and breakout points
Provides BUY signals on upward breaks, SELL on downward breaks
Dashboard Columns Explained
Symbol: Ticker being analyzed
Trend: Overall SuperTrend direction (🟢 UP / 🔴 DOWN / ⚪ FLAT)
Timeframe: Analysis timeframe with clock icon
Breaker Block: Type (Bullish/Bearish) with trend alignment indicator
Status: Price position relative to breaker block (Inside/Approaching/Far)
Retests: Number of times the broken level was retested (indicates level strength)
Volume: Volume associated with the order block formation
Chandelier: BUY/SELL signals from Chandelier Exit strategy
Smart Money: BUY/SELL signals from breakout detection
Trendline: BUY/SELL signals from trendline breakouts
Key Features
No HOLD States: All signals show definitive BUY (🟢) or SELL (🔴) only
Persistent Signals: Signals remain active until opposite conditions trigger
Color Coding: Visual distinction between bullish (green) and bearish (red) signals
Trend Alignment: Enhanced accuracy through trend confirmation logic
This screener provides a comprehensive view of market conditions across multiple strategies, helping identify high-probability trading opportunities when signals align.

APO Channel // SuperTrend Optimized📌 Complete Long Description (Final Version)
APO Channel – Adaptive Breakout Detection
🔹 How it works
The originality of this script lies in the combination of two complementary approaches:
An adaptive channel, whose responsiveness is based on fractal dimension and volatility.
A breakout & candle confirmation system, providing clear visual trade signals.
Unlike standard channels (e.g., Bollinger Bands), which use a fixed deviation or multiplier, the APO Channel dynamically adjusts its baseline (Filt) and bands (Filt1, Filt2) in real time. This ensures that signals are not only adaptive to market conditions but also reinforced when both indicators align simultaneously, filtering out false moves and highlighting stronger trade opportunities.
🔹 Why this combination matters
By merging an adaptive volatility channel with a breakout confirmation system, the script provides traders with a more reliable view of momentum shifts.
The channel identifies when markets are consolidating versus expanding.
The breakout signals confirm actual momentum surges.
When both conditions trigger together, the likelihood of a meaningful move increases, making signals clearer and more robust than using either tool alone.
🔹 Visual signals
The script offers optional candle coloring and breakout labels:
Bullish signals are shown when price breaks above the adaptive upper band.
Bearish signals appear when price breaks below the adaptive lower band.
For clearer visualization, traders can activate the blue, green, and gray candles by clicking on the channel bands.
👉 This makes simultaneous signals and the prevailing trend much more visible, helping traders quickly spot alignment between the adaptive channel and breakout confirmation.
🔹 Optimized Default Settings
Channel Length: 26
Bands Distance: 1
ATR Period: 1
Source: (High + Low)/2
ATR Multiplier: 2
These parameters have been optimized for balanced responsiveness across assets.
👉 Signals are particularly relevant for scalping entries on the 3-minute timeframe, where quick detection of breakouts provides a trading edge.
The indicator works seamlessly on futures, crypto, forex, stocks, and most other instruments, making it a versatile tool for traders across markets.
🔹 How to use
Use breakouts above the channel as a potential entry signal for bullish momentum trades.
Use breakouts below the channel as a potential entry signal for bearish momentum trades.
When both the breakout signal and candle confirmation occur simultaneously, consider it a stronger trading signal.
Activate candle coloring on the channel bands to make signals and trend more visible.
Combine with other tools (volume, higher timeframe bias) for additional confirmation.
✅ Why this script adds value
Most breakout tools rely on static measures (fixed standard deviation, moving average envelopes, etc.). The APO Channel introduces an adaptive filter based on fractal dimension analysis, while also reinforcing signals through dual confirmation (channel breakouts + candle regime).
This makes it a versatile tool for traders seeking adaptive, visually clear, and reliable breakout detection across multiple markets and timeframes.

Volume Profile AnalysisThe Volume Profile Dashboard is a professional-grade analysis tool built for TradingView. It focuses on displaying a comprehensive volume profile breakdown within a dashboard format directly on the chart. The purpose of this tool is to help traders quickly assess buy versus sell volume dynamics, momentum, and sentiment in order to support informed trading decisions.
Instead of plotting simple bars, this indicator uses a detailed table and visual progress bar to summarize live and historical market activity. By condensing key metrics into a structured format, traders can analyse market behaviour without manually calculating or switching between multiple indicators.
________________________________________
How the Script Works
1. Data Gathering
The script uses lower-timeframe price and volume data to calculate buy volume, sell volume, and total traded volume for the current and previous candles.
2. Volume Allocation
Buy and sell volumes are estimated by looking at the candle’s range (high to low) and how the closing price aligns within that range. The closer the close is to the high, the stronger the buying pressure. The closer the close is to the low, the stronger the selling pressure.
3. Delta and Momentum
o Delta measures the difference between buy and sell volume.
o Volume momentum compares the current candle’s activity to the previous one, showing if interest is rising or fading.
4. Point of Control (POC)
An average of high, low, and close is calculated to give an approximate “point of control” level—an area of balance where buyers and sellers previously agreed on price.
5. Dashboard Visualization
All these calculations are displayed inside a clean dashboard table with separate rows for the current candle, previous candle, and a summary row. Icons, colors, and progress bars make it visually intuitive.
6. On-Chart Progress Indicator
A dynamic horizontal progress bar is plotted on the chart above price, showing the balance between buy and sell volume for the latest activity.
7. Alerts
Built-in alerts trigger when strong buying or selling pressure is detected or when there is a significant spike in total traded volume.
________________________________________
How This Tool Can Be Used
• Intraday Trading: Quickly gauge whether buyers or sellers are in control of the market at any moment.
• Swing Trading: Compare momentum shifts between candles to identify early trend reversals.
• Risk Management: Use delta and sentiment signals to confirm whether to hold or reduce exposure.
• Confirmation: Align the volume profile dashboard with other indicators (such as RSI, MACD, or trendlines) for stronger trading conviction.
________________________________________
Using Mixed Indicators for Decisions
This dashboard alone provides volume insights, but better decisions come when it is combined with other tools:
• Pairing it with an RSI can show whether heavy buying is happening in overbought conditions.
• Combining with a SuperTrend or moving averages can confirm if volume momentum aligns with the price trend.
• Overlaying support/resistance levels can identify whether strong buy/sell signals occur at critical levels.
Mixed indicators prevent relying on one signal alone, reducing false trades.
________________________________________
Importance of This Tool
• Clarity: Condenses complex volume data into a simple, visual format.
• Speed: Traders can react faster with pre-calculated buy/sell percentages.
• Precision: Highlights hidden imbalances that are not obvious from candles alone.
• Professional-grade dashboard: Offers an institutional-style view of market behavior directly within TradingView.
________________________________________
Parameters in the Dashboard Table
• Period: Shows whether the row is for the current or previous candle, along with trend arrows.
• Price Range: The high–low range of the candle.
• Total Volume: The sum of buy and sell activity.
• Buy Volume / Sell Volume: Separated distribution of transactions leaning bullish or bearish.
• Delta: The net difference between buy and sell volumes, highlighting pressure imbalance.
• Buy % / Sell %: The percentage contribution of each side to total volume.
• POC: An average reference level where market consensus was strongest.
• Progress: A graphical bar showing buy vs sell dominance.
• Signal: Simplified output like Strong Buy, Buy, Strong Sell, Sell, Neutral.
• Summary Row: Compares changes between the current and previous candles and gives overall market sentiment.
________________________________________
Stock Market Disclaimer
This tool is for educational and informational purposes only. It does not constitute financial advice, investment advice, or trading recommendations. The stock market and cryptocurrency markets involve high risk. Traders and investors should do their own research and consult licensed financial advisors before making investment decisions. Past performance is not indicative of future results.
________________________________________
Misuse Disclaimer
This script has been developed as per TradingView’s rules and is intended for responsible trading analysis only. Any misuse, redistribution, or modification outside of TradingView’s policies is discouraged. The author and platform are not responsible for financial losses, misinterpretation of signals, or misuse of the code.
________________________________________
Disclaimer
Training & Educational Only — This material and the indicator are provided for educational purposes only. Nothing here is investment advice or a solicitation to buy or sell financial instruments. Past simulated or historical performance does not predict future results. Always perform full back testing and risk management, and consider seeking advice from a qualified financial professional before trading with real capital.
________________________________________

Double Median ATR Bands | MisinkoMasterThe Double Median ATR Bands is a version of the SuperTrend that is designed to be smoother, more accurate while maintaining a good speed by combining the HMA smoothing technique and the median source.
How does it work?
Very simple!
1. Get user defined inputs:
=> Set them up however you want, for the result you want!
2. Calculate the Median of the source and the ATR
=> Very simple
3. Smooth the median with √length (for example if median length = 9, it would be smoothed over the length of 3 since 3x3 = 9)
4. Add ATR bands like so:
Upper = median + (atr*multiplier)
Lower = median - (atr*multiplier)
Trend Logic:
Source crossing over the upper band = uptrend
Source crossing below the lower band = downtrend
Enjoy G´s!

Sri - Pivot + Vital Moving Averages Sri – Pivot + Vital Moving Averages
Sri – Pivot + Vital Moving Averages is an advanced all-in-one indicator that blends trend-following moving averages with multi-timeframe pivot levels (Daily, Weekly, Monthly). It is designed to give traders a complete view of both trend direction and key support/resistance zones, all in a single package.
By combining pivots and moving averages, this tool helps traders quickly identify whether the market is trending or ranging, while also highlighting critical price reaction points that can be used for intraday, swing, or positional trading.
🔹 Moving Averages
50 EMA → medium-term trend filter
200 EMA → long-term trend bias
800 HMA → ultra-smooth trend direction, great for capturing cycles
Daily EMA 200 → higher timeframe trend guide for precision entries
Each moving average is dynamically color-coded to reflect the market bias, making trend changes visually clear and easy to follow.
🔹 Pivot Levels (Daily, Weekly, Monthly)
Auto-calculated pivot, support (S1–S4), and resistance (R1–R4) levels
Balance Zone (BC & TC) highlighted with background shading
Custom colors, visibility toggles, and line thickness options
Dynamic horizontal levels that update with each new session
Ideal for spotting intraday reversals, swing levels, and institutional confluence zones
🔹 Customization & Flexibility
Toggle EMAs, HMA, and each pivot timeframe (Daily/Weekly/Monthly) individually
Full control over colors, transparency, and line styles
Background shading between pivot balance zones for clearer structure
✅ Key Benefits (Pros)
All-in-One Tool → Combines pivots and MAs into one clean package, saving chart space
Multi-Timeframe Edge → View daily, weekly, and monthly pivot levels together for better confluence
Clear Trend Guidance → EMA & HMA color shifts reflect trend changes instantly
Professional Visualization → Background balance zones and structured layouts make levels easy to read
Highly Customizable → Designed to adapt to intraday scalpers, swing traders, and long-term investors alike
⚠️ Things to Keep in Mind (Cons)
Charts may feel visually crowded if all pivots and moving averages are enabled at once
Best used as a confirmation & confluence tool, not as a stand-alone trading strategy
🔥 Recommended Enhancements (For Even Higher Success Rate)
This script already provides a strong edge, but adding the following tools can make it even more powerful:
Volume Confirmation (OBV or VWAP) → Validate pivot/EMA breakouts with volume strength
Momentum Filter (RSI or MACD Histogram) → Confirm directional momentum before acting on pivot touches
Trend Strength (ADX or Supertrend) → Distinguish strong trending phases from weak ranges
Reversal Candlestick Highlight → Automatically mark engulfing candles or pin bars occurring at pivots
These lightweight add-ons integrate well with the existing framework and can improve decision-making without cluttering the chart.
📊 Best Use Cases
Intraday Traders → Use daily pivots with 50/200 EMA for quick scalps and reversals
Swing Traders → Rely on weekly and monthly pivots for confluence with 200 EMA trend bias
Institutional/Positional Traders → Track 800 HMA and higher timeframe EMA 200 for structural guidance
Confluence Hunters → Combine pivot levels with trend bias for high-probability setups

Market Spiralyst [Hapharmonic]Hello, traders and creators! 👋
Market Spiralyst: Let's change the way we look at analysis, shall we? I've got to admit, I scratched my head on this for weeks, Haha :). What you're seeing is an exploration of what's possible when code meets art on financial charts. I wanted to try blending art with trading, to do something new and break away from the same old boring perspectives. The goal was to create a visual experience that's not just analytical, but also relaxing and aesthetically pleasing.
This work is intended as a guide and a design example for all developers, born from the spirit of learning and a deep love for understanding the Pine Script™ language. I hope it inspires you as much as it challenged me!
🧐 Core Concept: How It Works
Spiralyst is built on two distinct but interconnected engines:
The Generative Art Engine: At its core, this indicator uses a wide range of mathematical formulas—from simple polygons to exotic curves like Torus Knots and Spirographs—to draw beautiful, intricate shapes directly onto your chart. This provides a unique and dynamic visual backdrop for your analysis.
The Market Pulse Engine: This is where analysis meets art. The engine takes real-time data from standard technical indicators (RSI and MACD in this version) and translates their states into a simple, powerful "Pulse Score." This score directly influences the appearance of the "Scatter Points" orbiting the main shape, turning the entire artwork into a living, breathing representation of market momentum.
🎨 Unleash Your Creativity! This Is Your Playground
We've included 25 preset shapes for you... but that's just the starting point !
The real magic happens when you start tweaking the settings yourself. A tiny adjustment can make a familiar shape come alive and transform in ways you never expected.
I'm genuinely excited to see what your imagination can conjure up! If you create a shape you're particularly proud of or one that looks completely unique, I would love to see it. Please feel free to share a screenshot in the comments below. I can't wait to see what you discover! :)
Here's the default shape to get you started:
The Dynamic Scatter Points: Reading the Pulse
This is where the magic happens! The small points scattered around the main shape are not just decorative; they are the visual representation of the Market Pulse Score.
The points have two forms:
A small asterisk (`*`): Represents a low or neutral market pulse.
A larger, more prominent circle (`o`): Represents a high, strong market pulse.
Here’s how to read them:
The indicator calculates the Pulse Strength as a percentage (from 0% to 100%) based on the total score from the active indicators (RSI and MACD). This percentage determines the ratio of circles to asterisks.
High Pulse Strength (e.g., 80-100%): Most of the scatter points will transform into large circles (`o`). This indicates that the underlying momentum is strong and It could be an uptrend. It's a visual cue that the market is gaining strength and might be worth paying closer attention to.
Low Pulse Strength (e.g., 0-20%): Most or all of the scatter points will remain as small asterisks (`*`). This suggests weak, neutral, or bearish momentum.
The key takeaway: The more circles you see, the stronger the bullish momentum is according to the active indicators. Watch the artwork "breathe" as the circles appear and disappear with the market's rhythm!
And don't worry about the shape you choose; the scatter points will intelligently adapt and always follow the outer boundary of whatever beautiful form you've selected.
How to Use
Getting started with Spiralyst is simple:
Choose Your Canvas: Start by going into the settings and picking a `Shape` and `Palette` from the "Shape Selection & Palette" group that you find visually appealing. This is your canvas.
Tune Your Engine: Go to the "Market Pulse Engine" settings. Here, you can enable or disable the RSI and MACD scoring engines. Want to see the pulse based only on RSI? Just uncheck the MACD box. You can also fine-tune the parameters for each indicator to match your trading style.
Read the Vibe: Observe the scatter points. Are they mostly small asterisks or are they transforming into large, vibrant circles? Use this visual feedback as a high-level gauge of market momentum.
Check the Dashboard: For a precise breakdown, look at the "Market Pulse Analysis" table on the top-right. It gives you the exact values, scores, and total strength percentage.
Explore & Experiment: Play with the different shapes and color palettes! The core analysis remains the same, but the visual experience can be completely different.
⚙️ Settings & Customization
Spiralyst is designed to be highly customizable.
Shape Selection & Palette: This is your main control panel. Choose from over 25 unique shapes, select a color palette, and adjust the line extension style ( `extend` ) or horizontal position ( `offsetXInput` ).
scatterLabelsInput: This setting controls the total number of points (both asterisks and circles) that orbit the main shape. Think of it as adjusting the density or visual granularity of the market pulse feedback.
The Market Pulse engine will always calculate its strength as a percentage (e.g., 75%). This percentage is then applied to the `scatterLabelsInput` number you've set to determine how many points transform into large circles.
Example: If the Pulse Strength is 75% and you set this to `100` , approximately 75 points will become circles. If you increase it to `200` , approximately 150 points will transform.
A higher number provides a more detailed, high-resolution view of the market pulse, while a lower number offers a cleaner, more minimalist look. Feel free to adjust this to your personal visual preference; the underlying analytical percentage remains the same.
Market Pulse Engine:
`⚙️ RSI Settings` & `⚙️ MACD Settings`: Each indicator has its own group.
Enable Scoring: Use the checkbox at the top of each group to include or exclude that indicator from the Pulse Score calculation. If you only want to use RSI, simply uncheck "Enable MACD Scoring."
Parameters: All standard parameters (Length, Source, Fast/Slow/Signal) are fully adjustable.
Individual Shape Parameters (01-25): Each of the 25+ shapes has its own dedicated group of settings, allowing you to fine-tune every aspect of its geometry, from the number of petals on a flower to the windings of a knot. Feel free to experiment!
For Developers & Pine Script™ Enthusiasts
If you are a developer and wish to add more indicators (e.g., Stochastic, CCI, ADX), you can easily do so by following the modular structure of the code. You would primarily need to:
Add a new `PulseIndicator` object for your new indicator in the `f_getMarketPulse()` function.
Add the logic for its scoring inside the `calculateScore()` method.
The `calculateTotals()` method and the dashboard table are designed to be dynamic and will automatically adapt to include your new indicator!
One of the core design philosophies behind Spiralyst is modularity and scalability . The Market Pulse engine was intentionally built using User-Defined Types (UDTs) and an array-based structure so that adding new indicators is incredibly simple and doesn't require rewriting the main logic.
If you want to add a new indicator to the scoring engine—let's use the Stochastic Oscillator as a detailed example—you only need to modify three small sections of the code. The rest of the script, including the adaptive dashboard, will update automatically.
Here’s your step-by-step guide:
#### Step 1: Add the User Inputs
First, you need to give users control over your new indicator. Find the `USER INTERFACE: INPUTS` section and add a new group for the Stochastic settings, right after the MACD group.
Create a new group name: `string GRP_STOCH = "⚙️ Stochastic Settings"`
Add the inputs: Create a boolean to enable/disable it, and then add the necessary parameters (`%K`, `%D`, `Smooth`). Use the `active` parameter to link them to the enable/disable checkbox.
// Add this code block right after the GRP_MACD and MACD inputs
string GRP_STOCH = "⚙️ Stochastic Settings"
bool stochEnabledInput = input.bool(true, "Enable Stochastic Scoring", group = GRP_STOCH)
int stochKInput = input.int(14, "%K Length", minval=1, group = GRP_STOCH, active = stochEnabledInput)
int stochDInput = input.int(3, "%D Smoothing", minval=1, group = GRP_STOCH, active = stochEnabledInput)
int stochSmoothInput = input.int(3, "Smooth", minval=1, group = GRP_STOCH, active = stochEnabledInput)
#### Step 2: Integrate into the Pulse Engine (The "Factory")
Next, go to the `f_getMarketPulse()` function. This function acts as a "factory" that builds and configures the entire market pulse object. You need to teach it how to build your new Stochastic indicator.
Update the function signature: Add the new `stochEnabledInput` boolean as a parameter.
Calculate the indicator: Add the `ta.stoch()` calculation.
Create a `PulseIndicator` object: Create a new object for the Stochastic, populating it with its name, parameters, calculated value, and whether it's enabled.
Add it to the array: Simply add your new `stochPulse` object to the `array.from()` list.
Here is the complete, updated `f_getMarketPulse()` function :
// Factory function to create and calculate the entire MarketPulse object.
f_getMarketPulse(bool rsiEnabled, bool macdEnabled, bool stochEnabled) =>
// 1. Calculate indicator values
float rsiVal = ta.rsi(rsiSourceInput, rsiLengthInput)
= ta.macd(close, macdFastInput, macdSlowInput, macdSignalInput)
float stochVal = ta.sma(ta.stoch(close, high, low, stochKInput), stochDInput) // We'll use the main line for scoring
// 2. Create individual PulseIndicator objects
PulseIndicator rsiPulse = PulseIndicator.new("RSI", str.tostring(rsiLengthInput), rsiVal, na, 0, rsiEnabled)
PulseIndicator macdPulse = PulseIndicator.new("MACD", str.format("{0},{1},{2}", macdFastInput, macdSlowInput, macdSignalInput), macdVal, signalVal, 0, macdEnabled)
PulseIndicator stochPulse = PulseIndicator.new("Stoch", str.format("{0},{1},{2}", stochKInput, stochDInput, stochSmoothInput), stochVal, na, 0, stochEnabled)
// 3. Calculate score for each
rsiPulse.calculateScore()
macdPulse.calculateScore()
stochPulse.calculateScore()
// 4. Add the new indicator to the array
array indicatorArray = array.from(rsiPulse, macdPulse, stochPulse)
MarketPulse pulse = MarketPulse.new(indicatorArray, 0, 0.0)
// 5. Calculate final totals
pulse.calculateTotals()
pulse
// Finally, update the function call in the main orchestration section:
MarketPulse marketPulse = f_getMarketPulse(rsiEnabledInput, macdEnabledInput, stochEnabledInput)
#### Step 3: Define the Scoring Logic
Now, you need to define how the Stochastic contributes to the score. Go to the `calculateScore()` method and add a new case to the `switch` statement for your indicator.
Here's a sample scoring logic for the Stochastic, which gives a strong bullish score in oversold conditions and a strong bearish score in overbought conditions.
Here is the complete, updated `calculateScore()` method :
// Method to calculate the score for this specific indicator.
method calculateScore(PulseIndicator this) =>
if not this.isEnabled
this.score := 0
else
this.score := switch this.name
"RSI" => this.value > 65 ? 2 : this.value > 50 ? 1 : this.value < 35 ? -2 : this.value < 50 ? -1 : 0
"MACD" => this.value > this.signalValue and this.value > 0 ? 2 : this.value > this.signalValue ? 1 : this.value < this.signalValue and this.value < 0 ? -2 : this.value < this.signalValue ? -1 : 0
"Stoch" => this.value > 80 ? -2 : this.value > 50 ? 1 : this.value < 20 ? 2 : this.value < 50 ? -1 : 0
=> 0
this
#### That's It!
You're done. You do not need to modify the dashboard table or the total score calculation.
Because the `MarketPulse` object holds its indicators in an array , the rest of the script is designed to be adaptive:
The `calculateTotals()` method automatically loops through every indicator in the array to sum the scores and calculate the final percentage.
The dashboard code loops through the `enabledIndicators` array to draw the table. Since your new Stochastic indicator is now part of that array, it will appear automatically when enabled!
---
Remember, this is your playground! I'm genuinely excited to see the unique shapes you discover. If you create something you're proud of, feel free to share it in the comments below.
Happy analyzing, and may your charts be both insightful and beautiful! 💛

QuickScalp ProQuickScalp Pro – Scalping with Precision
QuickScalp Pro is designed for intraday traders who want fast, accurate scalping signals with very small stop-loss levels.
It combines Supertrend, VWMA zones, Kalman smoothing, and reversal detection to filter out noise and highlight only high-probability entries.
✅ Optimized for Nifty & BankNifty options (5-min chart recommended)
✅ Small SL + Quick Targets (50–100 points possible)
✅ No repainting when “Confirm on Close” is enabled
✅ Clean chart with minimal clutter – only clear Buy/Sell/TP/Reversal labels
✅ Alerts supported for Buy, Sell, Reversals, and Take Profit hits
This tool is best suited for scalpers and option traders who want quick entries, fast exits, and controlled risk.

All-in-One Indicator**All-in-One Trading Indicator** 🛠️
This powerful and versatile TradingView indicator combines multiple popular technical tools into a single, easy-to-use script. Designed for traders who want a comprehensive view of the market, it includes:
* **MACD** – with optional lines and histogram for momentum analysis
* **Multiple Moving Averages (MA1/MA2/MA3)** – SMA or EMA, fully customizable
* **RSI** – short or long-term momentum indicator
* **VWAP** – volume-weighted average price for intraday trend spotting
* **Supertrend** – clear trend direction signals
* **ADX & DMI** – trend strength and directional movement
* **Stochastic** – %K and %D lines with overbought/oversold zones
* **Bollinger Bands** – upper and lower bands for volatility analysis
✅ All components are optional and fully configurable
✅ Designed to give a complete market overview in one pane or overlay
✅ Perfect for intraday, swing, and position traders
**Make smarter trading decisions by combining trend, momentum, and volatility insights in one place!**
---