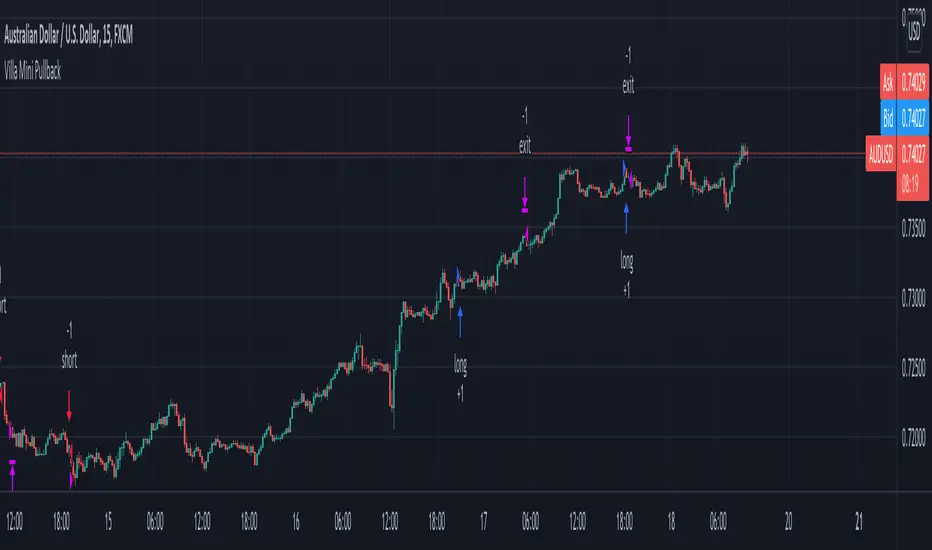
Mini-Pullbacks SupertrendThis WOP script is trying to check the pullbacks in a trend and open a position when the pullback is finishingStrategi Pine Script®oleh VILIO_TradingTelah dikemas kini 65
Co-relation and St-deviation Strategy - BNB/USDT 15minThis indicator based on statistical analysis. it uses standard deviation and its co-relation to price action to generate signals. and following indicators has been used to calculate standard deviation and its co-relation values. finally it is capable to identify market changes in bottoms to pic most suitable points. 1. Parabolic SAR (parabolic stop and reverse) 2. Supertrend 3. Relative strength index (RSI) 4. Money flow index (MFI) 5. Balance of Power 6. Chande Momentum Oscillator 7. Center of Gravity (COG) 8. Directional Movement Index (DMI) 9. Stochastic 10. Symmetrically weighted moving average with fixed length 11. True strength index (TSI) 12. Williams %R 13. Accumulation/distribution index 14. Intraday Intensity Index 15. Negative Volume Index 16. Positive Volume Index 17. On Balance Volume 18. Price-Volume Trend 19. True range 20. Volume-weighted average price 21. Williams Accumulation/Distribution 22. Williams Variable Accumulation/Distribution 23. Simple Moving Average 24. Exponential Moving Average 25. CCI (commodity channel index) 26. Chop Zone 27. Ease of Movement 28. Detrended Price Oscillator 29. Advance Decline Line 30. Bull Bear Power Strategi Pine Script®oleh pcoomaTelah dikemas kini 1616431
MTF MACD (PPO) [TANHEF]Mult-Timeframe Moving Average Convergence Divergence (MACD) and Percentage Price Oscillator (PPO) indicator that allows for viewing of 1 to 5 different Timeframes. Brief Summary The primary benefit of multi-timeframe indicators is getting better entries and confirmation from viewing multiple time frames at once, which can often get overlooked. MACD shouldn't be only used by itself, it is a lot more consistent when applied in the same direction as the trend as well as multiple other things including support, resistance, and volume improve the outcomes of the MACD results. Personally, I look for good entries on higher and lower time frames (multiple timeframes must agree with the buying or selling). For example, if a higher timeframe looks like a good long entry (MACD line is crossing up and below the zero line), then the lower timeframes should be checked to ensure they are not oversold or overextended (the MACD line must be low or below the zero), once the lower and higher timeframes are in agreeance an entry can be made. What is Moving Average Convergence Divergence (MACD)? Moving average convergence divergence (MACD) is a trend-following momentum indicator that shows the relationship between two moving averages of the price. The MACD is calculated by subtracting the 26-period exponential moving average (EMA) from the 12-period EMA. What is the Percentage Price Oscillator (PPO)? The PPO is identical to the MACD indicator, except the PPO measures percentage difference between two EMAs, while the MACD measures absolute (or dollar) difference. The PPO has the advantage of being comparable to other assets with different prices, whereas MACD readings are not comparable. For example, regardless of the asset's price, a PPO result of 10 means the short-term average is 10% above the long-term average. A signal line can be displayed on Timeframe, including: - MACD & Signal Line crosses (Green when MACD above Signal Line and Red when MACD below Signal Line) - Histogram Direction (fast and slow EMA gap) - SuperTrend for identifying trend direction (green for uptrend, red for downtrend) - EMA Trend for identifying trend direction (above EMA = up trend and green, below EMA = down trend and red) Cross Dots and Potential cross dots - Green Dot, is displayed when the MACD crosses the Signal Line - Red Dot, is displayed when the MACD crosses the Signal Line - Yellow Dot. Potential cross up (green dot) on next bar. Displayed when if the same distance a MACD moves on a bar is applied to the next bar will cause a MACD and Signal Line Cross. This is calculated by checking if the value change of one bar is added to the current MACD value would lead to a cross on the next bar, the it is a potential up dot. - Purple Dot. Potential cross down (red dot) on next bar. Displayed when if the same distance a MACD moves on a bar is applied to the next bar will cause a MACD and Signal Line Cross. This is calculated by checking if the value change of one bar is added to the current MACD value would lead to a cross on the next bar, the it is a potential down dot. Best Fit Settings - Can be applied to the MACD, Signal Line, and Histogram to re-scale (stretch) to fit them within the space of the +2 and -2 range that each timeframe is provided on this indicator. - The lookback distance value is used to lookback a certain distance to ensure everything scaled to fit well. Labels are displayed on the right of the indicators, including: - a label identifying 'line indicator' is currently being displayed - the Timeframe corresponding to each MACD or PPO indicator - the MACD or PPO of each TimeframePenunjuk Pine Script®oleh TanHefTelah dikemas kini 355
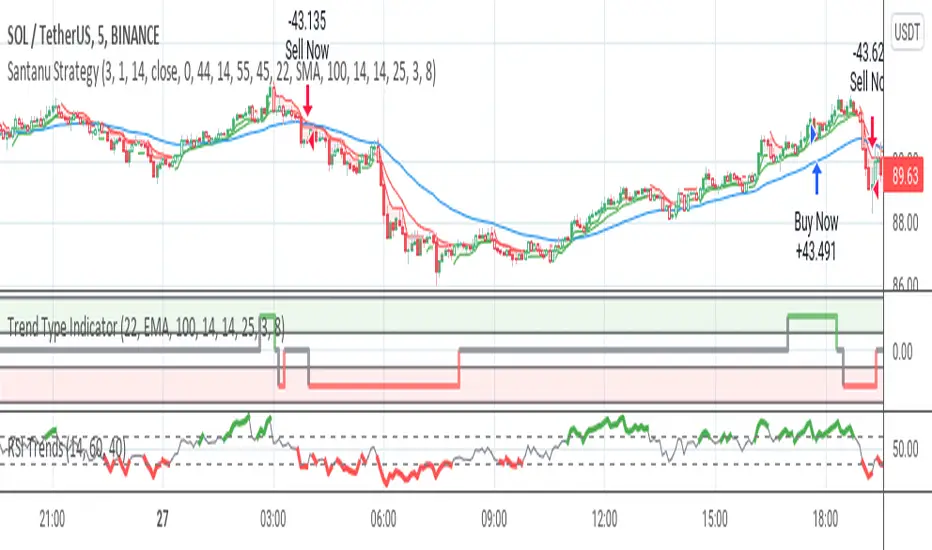
Santanu StrategyThis script use for crypto market, its use ema and supertrend to find the current trend in the marketStrategi Pine Script®oleh pontume11Telah dikemas kini 2248
Intraday JXMODI CrossCombination of two strategy. MA Cross strategy + RSI strategy to decide whether the stock/crypto is currently overbought/oversold. RSI alert when change from bull to bear, and vice verse. Useful for quick entry and exit trade. Whenever RSI Black color line Cross Red color MA line , Trend Changes. For Bull side Trade on High of that candle & Stoploss Low of that candle in which Cross Occurs.(Green Shadow) For Bear side Trade on Low of that candle & Stoploss High of that candle in which Cross occurs.(Red Shadow) For more confirmation use SuperTrend etc indicators.Penunjuk Pine Script®oleh jxmodi33313
Compound Indicator Strategy - BTC/USDT 3hThis is an Strategy finds and utilise end points of short term market trends and this is a combination of many indicators such as 1. Volume change oscillator 2. Money flow index ( MFI ) 3. Momentum Oscillator (MOM) 4. Stochastic Indicator 6. Relative Strength Indicator ( RSI ) 7. Relative volatility index (RVI) 8. Balance of power (BOP) 9. Small moving average ( SMA ) 10. Exponential moving average ( EMA ) 11. Parabolic SAR 12. Super trend indicator this script forms a compound indicator after analysing movements of those indicators through different time frames and measure its co-relation and variance with the price action. buy doing that, indicator in a position to identify short term market reversals and presented. after generating a common indicator, it evaluates standard deviation and standard variance with currant market price action and generates a buy and sell signals. you can determine your own trading method based on available options. Strategi Pine Script®oleh pcooma44314
Compound IndicatorThis is an indicator finds end points of short term market trends. this is a combination of many indicators such as 1. Volume change oscillator 2. Money flow index (MFI) 3. Momentum Oscillator (MOM) 4. Stochastic Indicator 6. Relative Strength Indicator (RSI) 7. Relative volatility index (RVI) 8. Balance of power (BOP) 9. Small moving average (SMA) 10. Exponential moving average (EMA) 11. Parabolic SAR 12. Super trend indicator this script forms a compound indicator after analysing movements of those indicators through different time frames and measure its co-relation and variance with the price action. buy doing that, indicator in a position to identify short term market reversals and presented.Penunjuk Pine Script®oleh pcooma6655
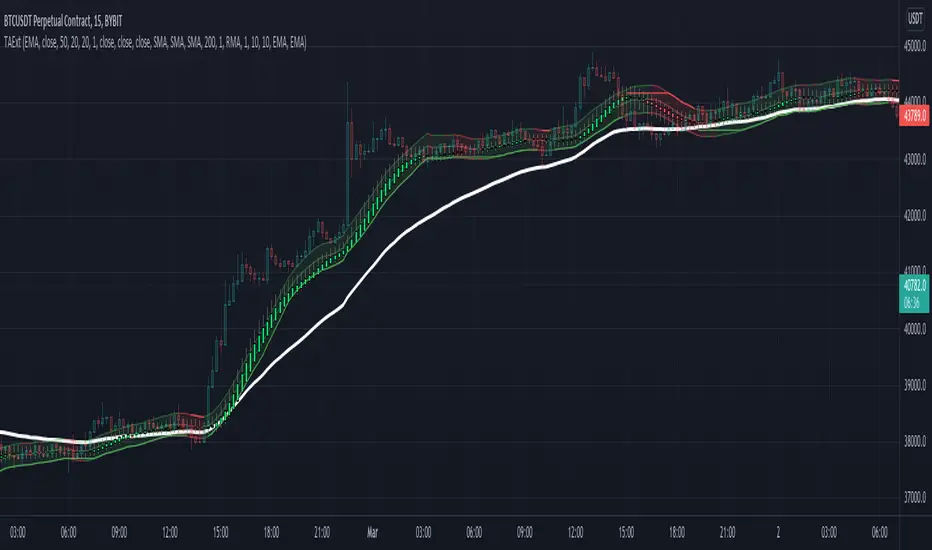
TAExtLibrary "TAExt" Indicator functions can be used in other indicators and strategies. This will be extended by time with indicators I use in my strategies and studies. atrwo(length, stdev_length, stdev_mult) ATR without outliers Parameters: length : The length of the ATR stdev_length : The length of the standard deviation, used for detecting outliers stdev_mult : The multiplier of the standard deviation, used for detecting outliers Returns: The ATR value atrwma(src, period, type, atr_length, stdev_length, stdev_mult) ATR without outlier weighted moving average Parameters: src : The source of the moving average period : The period of the moving average type : The type of the moving average, possible values: SMA, EMA, RMA atr_length : The length of the ATR stdev_length : The length of the standard deviation, used for detecting outliers stdev_mult : The multiplier of the standard deviation, used for detecting outliers Returns: The moving average value jma(src, period, phase, power) Jurik Moving Average Parameters: src : The source of the moving average period : The period of the moving average calculation phase : The phase of jurik MA calculation (-100..100) power : The power of jurik MA calculation Returns: The Jurik MA series anyma(src, period, type, offset, sigma, phase, power) Moving Average by type Parameters: src : The source of the moving average period : The period of the moving average calculation type : The type of the moving average offset : Used only by ALMA, it is the ALMA offset sigma : Used only by ALMA, it is the ALMA sigma phase : The phase of jurik MA calculation (-100..100) power : The power of jurik MA calculation Returns: The moving average series wae(macd_src, macd_fast_length, macd_slow_length, macd_sensitivity, bb_base_src, bb_upper_src, bb_lower_src, bb_length, bb_mult, dead_zone_length, dead_zone_mult) Waddah Attar Explosion (WAE) Parameters: macd_src : The source series used by MACD macd_fast_length : The fast MA length of the MACD macd_slow_length : The slow MA length of the MACD macd_sensitivity : The MACD diff multiplier bb_base_src : The source used by stdev bb_upper_src : The source used by the upper Bollinger Band bb_lower_src : The source used by the lower Bollinger Band bb_length : The lenth for Bollinger Bands bb_mult : The multiplier for Bollinger Bands dead_zone_length : The ATR length for dead zone calculation dead_zone_mult : The ATR multiplier for dead zone Returns: ssl(length, high_src, low_src) Semaphore Signal Level channel (SSL) Parameters: length : The length of the moving average high_src : Source of the high moving average low_src : Source of the low moving average Returns: adx(atr_length, di_length, adx_length, high_src, low_src, atr_ma_type, di_ma_type, adx_ma_type) Average Directional Index + Direction Movement Index (ADX + DMI) Parameters: atr_length : The length of ATR di_length : DI plus and minus smoothing length adx_length : ADX smoothing length high_src : Source of the high moving average low_src : Source of the low moving average atr_ma_type : MA type of the ATR calculation di_ma_type : MA type of the DI calculation adx_ma_type : MA type of the ADX calculation Returns: Perpustakaan Pine Script®oleh TheBacktestGuyTelah dikemas kini 99150
NazhoThis is a simple scalping strategy that works for all time frames... I have only tested it on FOREX It works by checking if the price is currently in an uptrend and if it crosses the 20 EMA . If it crosses the 20 EMA and its in and uptrend it will post a BUY SIGNAL. If it crosses the 20 EMA and its in and down it will post a SELL SIGNAL. The red line is the highest close of the previous 8 bars --- This is resistance The green line is the lowest close of the previous 8 bars -- This is support +SuperTrendPenunjuk Pine Script®oleh NazhoSoft33570
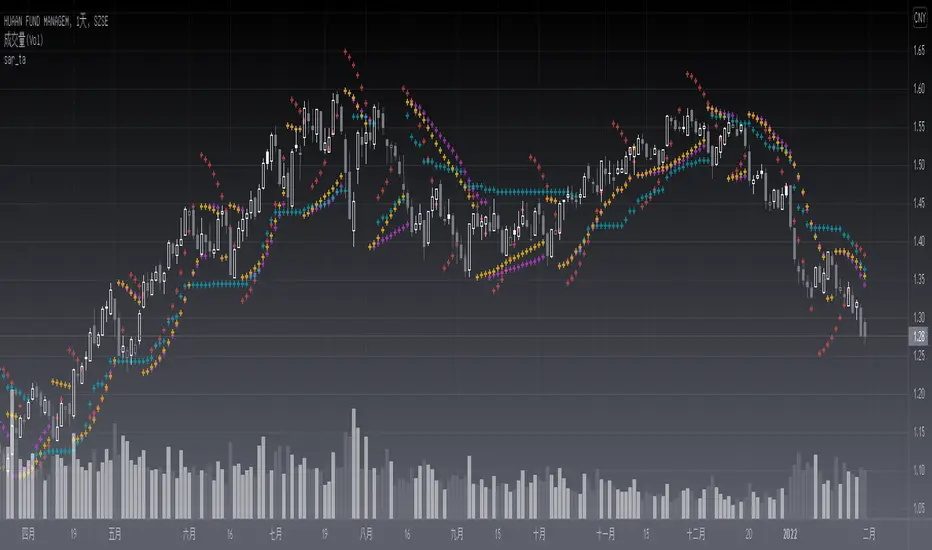
sar_taLevel: 3 Background The Parabolic SAR is a technical indicator developed by J. Welles Wilder to determine the direction that an asset is moving. The indicator is also referred to as a stop and reverse system, which is abbreviated as SAR. It aims to identify potential reversals in the price movement of traded assets. PINE v5 Version of SAR Library, which includes latest the Supertrend, Parabolic SAR, Gann Hilo activator, Chex indicators etc. Function This lib provides functions similar to SAR which can serve as a similar element for composite strategy. Parameters need to be tuned for the best performance and I will further inrish this collections. Bonus, If you can propose me a novel SAR source link, I would like to grant you one L4/L5 indicator with 2-month subscription for free. Library "sar_ta" tv_sar() lucid_sar() gl_activator() ltb_sar() chanex() bjorgum_sar() Perpustakaan Pine Script®oleh blackcat1402Telah dikemas kini 4431
Super Auto Breakout Day Trade Volatile stocksThis strategy is looking at MA and distance from MA to determine entry and exit for highly volatile day trade stocks. This trading strategy is not good for big-cap stocks as the movement there is not much in terms of %. The target for open trade is to close at a 10% gain or at 2.8% loss which is a good risk to reward ratio. Strategi Pine Script®oleh beststockalertTelah dikemas kini 1212548
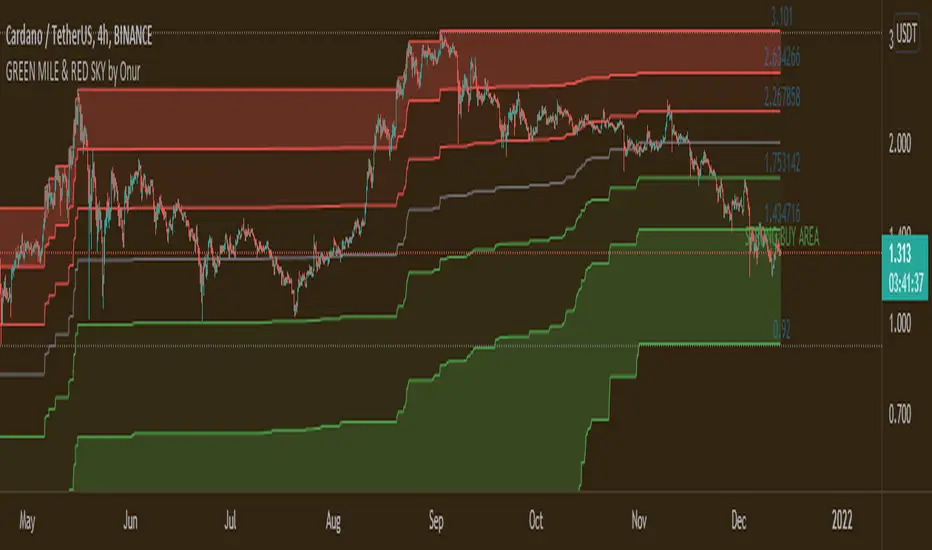
GREEN MILE & RED SKY by OnurThis indicator is the upgrated version of "GREEN MILE by Onur". Indicator shows fibonacci buying + selling levels due to the past 3500 (adjustable and 1500 by default) candles. Prices in the dark green area is a strong buying signal. Prices in the dark red areas is strong selling signal Decreasing period value makes indicator effective from long term to short term. Works harmoniously with MACD & RSI indicators. Penunjuk Pine Script®oleh SenatorVonShaft55242
MTF DPO-RSI IndicatorThis indicator uses the principle of taking the RSI of DPO readings across multiple time frames in order to provide trade signals and an overarching view of market conditions to the trader. My hope with creating this indicator was to present more divergence based signals than your typical indicator, while still keeping those signals at a high quality. In the settings menu, you may specify: Indicator Timeframe - the chart resolution that is used to calculate values. Source DPO Length - the number of bars used to calculate the Detrended Price Oscillator value. The DPO value is the source for the RSI calculations. DPO Hull Smoothing - how much smoothing is applied to the DPO . Smoothing is accomplished by taking a Hull Moving Average of the closing price, and using this to calculate the DPO value. RSI Length - the number of bars used to calculate the RSI of the DPO value. Time Multipliers 1 through 6 - use this to define what resolution each plot will represent. A value of 1 will represent the current Indicator Timeframe. A value of 3 will represent 3 times the current Indicator Timeframe, etc. Show Plot 1 through 6 - toggles the display of plots. How I trade with this indicator: A value of under 30 represents an over sold state for that particular plot. A value of over 70 represents an overbought state for that plot. Identify divergences on a lower timeframe plot which are apparent in overbought or oversold conditions, and confirm the signal with an overbought or oversold condition, or a divergence on a higher timeframe plot. Divergences which begin in oversold or overbought territory and end inside the 30-70 range tend to be more reliable signals, in my experience. Like all indicators, this is best when used in conjunction with other indicators. Trend indicators, such as double EMA's and Supertrend are my favorite pairing, and a stochastic RSI is a good tool to have as well. This is my first published indicator! If you find unique ways to use it, drop me a message. I'd love to know what you find. :)Penunjuk Pine Script®oleh ethereal_motion11116
Divergence-Support/ResistenceAnother script based on zigzag, divergence, and to yield support and resistence levels. This idea started with below two concepts: ▶ Support and resistence are simply levels where price has rejected to go further down or up. Usually, we can derive this based on pivots. But, if we start looking at every pivot, there will be many of them and may be confusing to understand which one to consider. ▶ Lot of people asked about one of my previous script on divergence detector on how to use it. I believe divergence should be considered as area of support and resistence because, they only amount to temporary weakness in momentum and nothing more. As per my understanding Trend > Hidden Divergence > Divergence > Oscillator Levels of Overbought and Oversold ⬜ Process ▶ Now combining the above two concepts - what we are trying to do here is draw support resistence lines only on pivots which has observed either divergence or hidden divergence. Continuation and indecision pivots are ignored. ▶ Input requires only few parameters. Zigzag lengths and oscillator to be used. Oscillator periods are automatically calculated based on zigzag length. Hence no other information required. You can also chose custom oscillator via external source. ▶ Display include horizontal lines of support/resistence which are drawn from the candle from where divergence or hidden divergence is detected. ▶ Support resistence lines are colored based on divergence. Green shades for bullish divergence and bullish hidden divergence whereas red shades for bearish divervence and bearish hidden divergence. Please note, red and green lines does not mean they only provide resistence or support. Any lines which are below the price should be treated as support and any line which are above the price should be treated as resistence. ▶ Divergence symbols are also printed on the bar from where divergence/hidden divergence is detected. ↗ - Bullish Hidden Divergence ↘ - Bearish Hidden Divergence ⤴ - Bullish Divergence ⤵ - Bearish Divergence ▶ Script also demonstrates usage of libraries effectively. I have used following libraries in this code. import HeWhoMustNotBeNamed/ zigzag /2 as zg import HeWhoMustNotBeNamed/enhanced_ta/8 as eta import HeWhoMustNotBeNamed/ supertrend /4 as st Can be good combination to use it with harmonic patterns. Penunjuk Pine Script®oleh TrendoscopeTelah dikemas kini 3939 3.9 K
True BarcolorHeikin Ashi can be useful for understanding trend based on price action but it doesn't take volume in context. Here I have tried to use volume for understanding true bar color and ultimately true trend analysis. It can also help you in not getting trapped in sudden shakeouts. Also, you can use it for averaging of your existing position. Conditions used: Relative closing price Relative volume against previous bar and overall moving average of volume Volume analysis Trend analysis Penunjuk Pine Script®oleh iitiantradingsageTelah dikemas kini 4343579
CHAMELEON TRAILA filter combining the built in supertrend function and two SMA's in order to act as a filter for trade ideas put forward by CHAMELEON which can be placed in a separate panel. This is not accurate enough to use on its own as a signal, but helps filter out more complex ideas. To be most effective it is recommended to set the LENGTH correctly. Includes ALERT CONDITION's for when the TRAIL is UP, DOWN or MIXED.Penunjuk Pine Script®oleh ChartChameleonTelah dikemas kini 3326