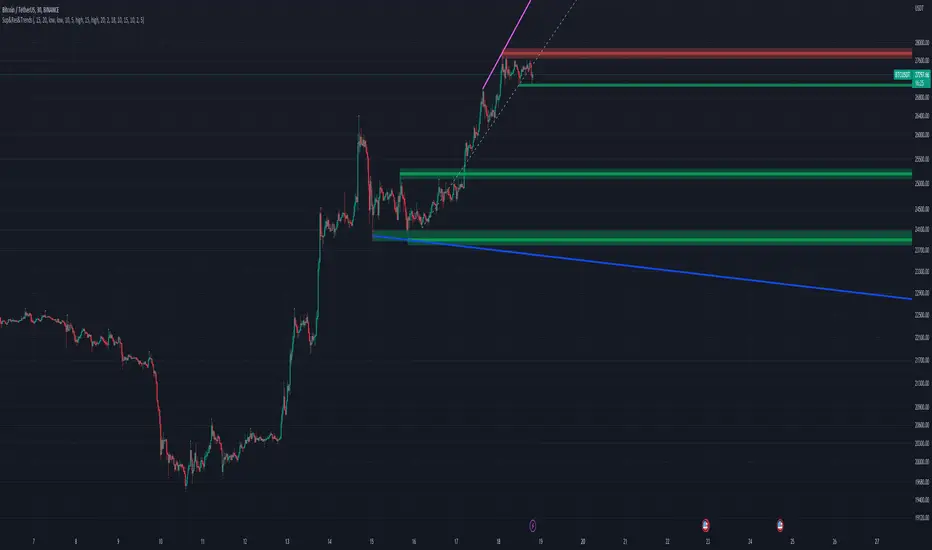
Support & Resistance AriesSupport & Resistance Aries
This indicator automatically identifies support and resistance levels based on the highest and lowest closing prices within a configurable period.
How it works:
The user sets a calculation period (default is 20 candles).
The indicator plots:
Green line = Support: lowest closing price within the period.
Red line = Resistance: highest closing price within the period.
Adjustable parameter:
Calculation Period (1 to 200): defines how many candles are used to find the price extremes.
Purpose:
Helps users quickly visualize dynamic support and resistance zones that adjust as price evolves, making it easier to identify areas for potential entries, exits, and stop placements.
Important:
This indicator should not be used as a standalone buy or sell signal, nor as a trend confirmation tool on its own.
It is recommended to use it in combination with other technical analysis tools such as MACD, RSI, Volume, Moving Averages, among others, for a more complete market view.
Disclaimer:
Investing involves financial risk. Be cautious with both profits and losses. Always define a stop loss to avoid larger losses if the trend reverses.
One of the golden rules in trading is: a trader should not lose more than 3% to 5% of their capital per trade. Protecting your capital should always be the priority.
Cari dalam skrip untuk "support"

Support and Resistance Lookback basedSupport & Resistance based on the highest and lowest values of a lookback period

Support Resistance ZonesSupport and resistance zones are used across all markets by traders and bots alike to identify liquidity and possible bounce areas. This script automates the drawing of those zones based on a number of variables, such as lookback period, channel width, number of touch confirmations and more.
This script also implements a some useful alerts so you can rest easy until the market hits a point of interest:
Enter SR Zone
Exit SR Zone
Break Upper Resistance
Break Lower Resistance

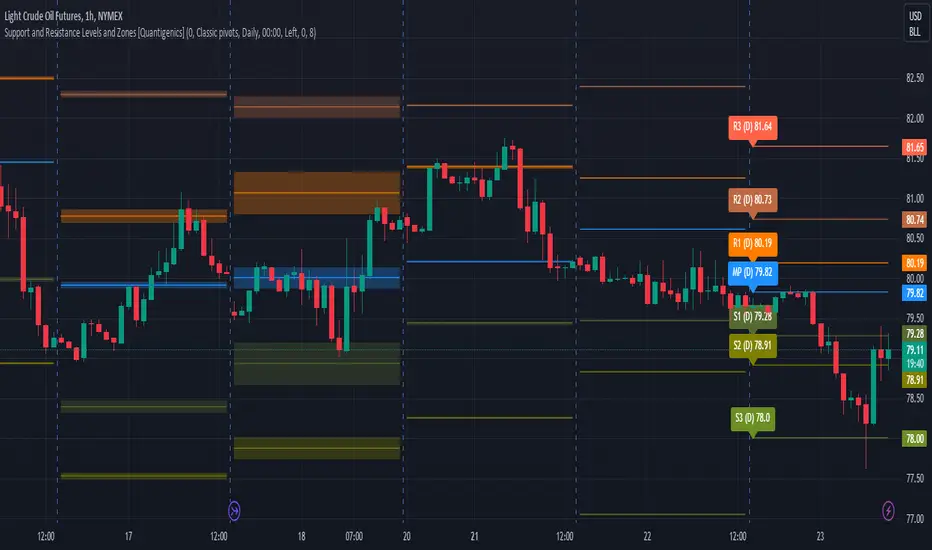
Support and Resistance Levels and Zones [Quantigenics]Support and Resistance Levels and Zones Indicator is an enhanced support and resistance indicator in that typical support and resistance levels are crucial concepts in technical analysis representing price levels where selling or buying momentum tends to halt, typically leading to a price reversal.
The Support and Resistance Levels and Zones Indicator goes beyond static levels by identifying dynamic 'zones'. These zones, depicted as shaded areas, offer more nuanced insights, acknowledging that markets are not rigid but fluctuating entities. Traders can leverage these zones, alongside the standard levels that the indicator plots, to better time their entries and exits, maximizing potential profitability and minimizing risk.
This is a "must-see on your charts" indicator and while scrolling back looking at historical data shows the amazing power of this indicator, it's even better in realtime LIVE price action and the price can tend to hit the Support and Resistance Levels and Zones multiple times intrabar.
TVC:GOLD 1HR
NYMEX:CL1! 15MIN
Enjoy!
Support Resistance with Order BlocksIndicator Description
Professional Price Level Detection for Smart Trading. Master the Markets with Precision Support/Resistance and Order Block Analysis . It provides traders with clear visual cues for potential reversal and breakout areas, combining both retail and institutional trading concepts into one powerful tool.
The Support & Resistance with Order Blocks indicator is a versatile Pine Script tool designed to empower traders with clear, actionable insights into key market levels. By combining advanced pivot-based support and resistance (S/R) detection with order block (OB) filtering, this indicator delivers clean, high-probability zones for entries, exits, and reversals. With customizable display options (boxes or lines) and intuitive settings, it’s perfect for traders of all styles—whether you’re scalping, swing trading, or investing long-term. Overlay it on your TradingView chart and elevate your trading strategy today!
________________________________________
Key Features
✅ Dynamic Support/Resistance - Auto-adjusting levels based on price action
✅ Smart Order Block Detection - Identifies institutional buying/selling zones
✅ Dual Display Modes - Choose between Boxes or Clean Lines for different chart styles
✅ Customizable Sensitivity - Adjust detection parameters for different markets
✅ Broken Level Markers - Clearly shows when key levels are breached
✅ Timeframe-Adaptive - Automatically adjusts for daily/weekly charts
1. Dynamic Support & Resistance Detection
Identifies critical S/R zones using pivot high/low calculations with adjustable look back periods.
Visualizes active S/R zones with distinct colors and labels ("Support" or "Resistance" for boxes, lines for cleaner charts).
Marks broken S/R levels as "Br S" (broken support) or "Br R" (broken resistance) when historical display is enabled, aiding in breakout and reversal analysis.
2. Smart Order Block Identification
Detects bullish and bearish order blocks based on significant price movements (default: ±0.3% over 5 candles).
Highlights institutional buying/selling zones with customizable colors, displayed as boxes or lines.
Filters out overlapping OB zones to keep your chart clutter-free.
3. Dual Display Options
Boxes or Lines: Choose to display S/R and OB as boxes for detailed zones or lines for a minimalist view.
Line Width Customization: Adjust line widths for S/R and OB (1–5 pixels) for optimal visibility.
Color Customization: Tailor colors for active/broken S/R and bullish/bearish OB zones.
4. Advanced Overlap Filtering
Ensures S/R zones don’t overlap with OB zones or other S/R levels, providing only the most relevant levels.
Limits the number of active zones (default: 10) to maintain chart clarity.
5. Historical S/R Visualization
Optionally display broken S/R levels with distinct colors and labels ("Br S" or "Br R") to track historical price reactions.
Broken levels are dynamically updated and removed (or retained) based on user settings.
6. Timeframe Adaptability
Automatically adjusts pivot detection for daily/weekly timeframes (40-candle look back) versus shorter timeframes (20-candle look back).
Works seamlessly across all asset classes (stocks, forex, crypto, etc.) and timeframes.
________________________________________
How It Works
• Support & Resistance:
Uses ta.pivothigh and ta.pivotlow to detect significant price pivots, with a user-defined look back (default: 5 candles post-pivot).
Plots S/R as boxes (with labels "Support" or "Resistance") or lines, extending to the current bar for real-time relevance.
Broken S/R levels are marked with adjusted colors and labels ("S" or "R" for boxes, "Br S" or "Br R" for lines when historical display is enabled).
• Order Blocks:
Identifies OB based on strong price movements over 4 candles, plotted as boxes or lines at the candle’s midpoint.
Validates OB to prevent overlap, ensuring only significant zones are displayed.
Removes OB zones when price breaks through, keeping the chart focused on active levels.
• Customization:
Toggle S/R and OB visibility, adjust detection sensitivity, and set maximum active zones (4–50).
Fine-tune line widths and colors for a personalized chart experience.
________________________________________
Why Use This Indicator?
• Precision Trading: Pinpoint high-probability entry/exit zones with filtered S/R and OB levels.
• Clean Charts: Overlap filtering and zone limits reduce clutter, focusing on key levels.
• Versatile Display: Switch between boxes for detailed zones or lines for simplicity, with adjustable line widths.
• Institutional Edge: Leverage OB detection to align with institutional activity for smarter trades.
• User-Friendly: Intuitive settings and clear visuals make it accessible for beginners and pros alike.
________________________________________
Settings Overview________________________________________
⚙ Input Parameters
Settings Overview
Display Options:
Display Type: Choose "Boxes" or "Lines" for S/R and OB visualization.
S/R Line Width: Set line thickness for S/R lines (1–5 pixels, default: 2).
OB Line Width: Set line thickness for OB lines (1–5 pixels, default: 2).
Order Block Options:
Show Order Block: Enable/disable OB display.
Bull/Bear OB Colors: Customise border and fill colors for bullish and bearish OB zones.
Support/Resistance Options:
Show S/R: Toggle active S/R zones.
Show Historical S/R: Display broken S/R levels, marked as "Br S" or "Br R" for lines.
Detection Period: Set candle lookback for pivot detection (4–50, default: 5).
Max Active Zones: Limit active S/R and OB zones (4–50, default: 10).
Colors: Customise active and broken S/R colors for clear differentiation.
________________________________________
How to Use
1. Add to Chart: Apply the indicator to your TradingView chart.
2. Customize Settings:
o Select "Boxes" or "Lines" for your preferred display style.
o Adjust line widths, colors, and detection parameters to suit your trading style.
o Enable "Show Historical S/R" to track broken levels with "Br S" and "Br R" labels.
3. Analyze Levels:
o Use support zones (green) for buy entries and resistance zones (red) for sell entries.
o Monitor OB zones for institutional activity, signaling potential reversals or continuations.
o Watch for "Br S" or "Br R" labels to identify breakout opportunities.
4. Combine with Other Tools: Pair with trend indicators, volume analysis, or price action for a robust strategy.
5. Monitor Breakouts: Trade breakouts when price breaches S/R or OB zones, with historical labels providing context.
________________________________________
Example Use Cases
• Swing Trading: Use S/R and OB zones to identify entry/exit points, with historical broken levels for context.
• Breakout Trading: Trade price breaks through S/R or OB, using "Br S" and "Br R" labels to confirm reversals.
• Scalping: Adjust detection period for faster S/R and OB identification on lower timeframes.
________________________________________
• Performance: Optimized for all timeframes, with best results on 5M, 15M, 30M, 1H, 4H, or daily charts for swing trading.
• Compatibility: Works with any asset class and TradingView chart.
________________________________________
Get Started
Transform your trading with Support & Resistance with Order Blocks! Add it to your chart, customize it to your style, and trade with confidence. For questions or feedback, drop a comment on TradingView or message the author. Happy trading! 🚀
________________________________________
Disclaimer: This indicator is for educational and informational purposes only. Always conduct your own analysis and practice proper risk management before trading.

Support, Resistance & Liquidity Pool ZonesSupport, Resistance & Liquidity Pool Zones
This indicator automatically detects and plots support and resistance levels based on pivot points and highlights liquidity pool zones, areas where the trading volume exceeds the average over a set number of bars. It is designed to help traders identify key price levels and liquidity traps that can trigger significant market reactions.
Key Features:
Support & Resistance Levels:
The indicator identifies pivot highs and pivot lows as potential resistance and support levels, respectively.
You can customize the number of levels shown on the chart, making it easier to focus on the most recent and relevant price levels.
Liquidity Pool Zones:
The script detects liquidity pool zones, which are areas with above-average trading volume. These zones often act as regions of interest where price accumulation or distribution occurs, potentially leading to significant price moves.
Liquidity zones are shaded to help traders visually identify areas of high interest in the market.
Customizable Settings:
You can adjust the pivot period to fine-tune how the indicator calculates support and resistance.
Control the number of support/resistance levels displayed on the chart and the period used to detect liquidity pools.
Customize the colors for support, resistance, and liquidity zones to match your charting preferences.
Alerts:
The script includes built-in alerts for when the price breaks above resistance or falls below support, helping traders catch key breakout opportunities.
How It Works:
The script calculates support and resistance levels using pivot highs and lows based on the user-defined pivot period.
It monitors liquidity pool zones by comparing the current trading volume with the average volume over a customizable period. When the volume exceeds the set threshold, a liquidity pool zone is highlighted, providing insight into where the market may accumulate or distribute.
Alerts are triggered when the price breaks above the first resistance level or falls below the first support level, giving traders immediate notification of key market events.
How to Use:
Tune the Pivot Period: Adjust the pivot period to your preferred time horizon (default: 10 bars).
Set Liquidity Pool Parameters: Customize the number of bars considered for liquidity pool detection and the volume multiplier to detect high-volume zones.
Monitor Breakouts: Use the built-in alerts to catch potential breakout or breakdown opportunities near support and resistance levels.
This script is ideal for traders looking for an easy-to-use tool to visualize support and resistance levels and liquidity pools, aiding in decision-making and trade management.

Support/Resistance by Oddbeaker LLCThis is a port of an indicator I wrote for MT4 several years ago. At the time it was the only thing available that could accurately plot support/resistance lines in an automated way. Now there are many that do similar things, but I still think this is one of the cleanest and most straightforward ones to use.
Parameters :
Signal Bars - Number of candles to look back for the high and low.
Peak Bar - Which of the candles must be the high or low to be used as the support or resistance level.
Notes :
Setting Peak Bar to 3 gives the most accurate results. Lower values will give false signals and higher values might be late in generating a useful signal.
Adjust your Signal Bars according to the timeframe you use. For example, 20 days worth of candles on 1-hour or higher charts will produce strong entry signals.
Example Chart Settings:
Weekly - 52 / 3
Daily - 20 / 3
4-hour - 120 / 3
1-hour - 480 / 3
5-minute - 72 /3
1-minute - 240 / 3
(c) by Oddbeaker LLC. All Rights Reserved.

Support & Ressistance by @kaleboraciy [REUPLOAD]█ OVERVIEW
Support & Resistance levels are important in trading as we all know.
█ WARNING
This version is beta, maybe sometimes it will plot wrong levels, but i will try to to eliminate these issues. And please note, that you should find your own ideal settings for every ticker you use.
█ FEATURES
This is the first script in Pine Community which plots levels using the last two points/ pivots /fractals.
It also stops plotting levels when there is a breakout on the particular level.
█ SETTINGS
1. Pivot Points Length - defines pivot points length. Using to find points where market is reversed. If you set lower value, there will be more points but less useful. As I said you should find your optimal parameters.
2. Inaccuracy in % - defines maximal possible inaccuracy between 2 pivot points .
3. Linewidth - width of line(level)
4. Start Calculations from - if you use low timeframe (1m - 30m) there are a lot of calculations, and PineScript can't process it. This parameter defines start date of calculations and now there are less data and Pine can process it better.
█ HOW IT WORKS
When a new pivot appears, it draws invisible line starting in this pivot . when the second pivots gets created, it checks all lines in array. When inaccuracy is smaller than defined, the line becomes visible.
If price breaks trough the pivots , the lines stop and a new cycle begins.
I hope that this script will be helpful in your trading🙂

Support/Resistance LinesThis script displays support and resistance lines at the levels you enter in the Input Settings. It does not perform the S/R calculations.
It allows you to:
Enter up to 6 support and 6 resistance lines each; any with value of 0 will be hidden
Specify one ticker that it applies to, so the lines will be hidden if you switch charts
Set the text size, color, horizontal offset, and whether to display the price values for each line
Set the color, transparency and line type for the S/R lines

Support & Resistance LinesAutomatically plots support and resistance lines.
The default time frames seemed functional for a lot of the charts after testing. Depending on the type of chart, adjust for best results.

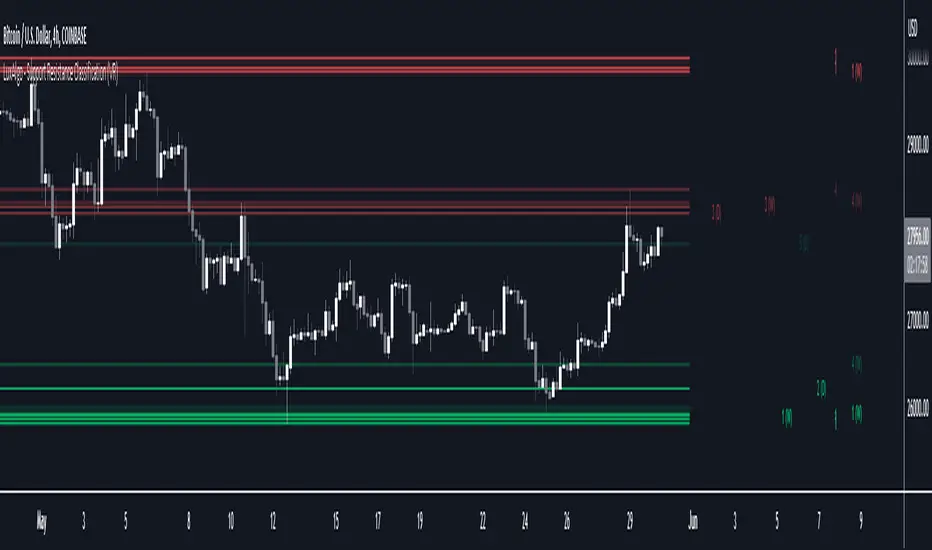
Support and Resistance Breakout Signals [MarkitTick]💡 This indicator provides a comprehensive, automated system for identifying, tracking, and trading Support and Resistance (S/R) breakouts. By synthesizing classic Swing High and Swing Low pivot analysis with Multi-Timeframe (HTF) capabilities and Volume confirmation, it transforms raw price action into actionable structural data. It is designed to declutter charts by automatically managing active levels and highlighting significant market structure shifts (Higher Highs, Lower Lows) alongside verified breakout signals.
✨ Originality and Utility
While many indicators draw static pivot points, this tool distinguishes itself through "State Management." It treats Support and Resistance not just as historical markers, but as active zones that evolve.
Dynamic Level Management: Instead of flooding the chart with infinite lines, the script uses arrays to store a specific number of recent levels. As price action progresses, invalid or broken levels are removed or updated, keeping the analysis focused on current relevance.
Multi-Timeframe Confluence: Uniquely, it allows you to overlay higher timeframe support and resistance levels (e.g., Daily levels on a 4-hours chart) without changing your chart view, enabling top-down analysis instantly.
Market Structure Labeling: It automatically tags pivot points with Dow Theory labels (HH, LH, LL, HL), aiding traders in instantly recognizing trend direction without manual charting.
🔬 Methodology and Concepts
The script operates on three core technical pillars:
● Swing Pivot Detection
The foundation is the detection of local extrema using a "Left/Right" bar lookback mechanism. A Swing High is identified when a high is greater than the L bars preceding it and the R bars following it. This confirms a fractal peak or valley.
Note on Confirmation: Because the script waits for R bars to close to confirm a pivot, the lines appear retroactively. However, the extension of these lines and subsequent breakout signals occur in real-time.
● Breakout Logic with Volume Integration
A breakout is triggered when the Close price crosses an active S/R line.
Resistance Break: Current Close > Resistance Level (and Previous Close ≤ Level).
Support Break: Current Close < Support Level (and Previous Close ≥ Level).
Volume Confirmation: An optional filter requires the breakout bar's volume to exceed a Moving Average of volume, ensuring momentum backs the move.
● Time Decay
To mimic the reduced relevance of stale levels, the script includes a "Time Decay" feature. If a level is not interacted with for a user-defined number of bars, it is automatically purged from the system, ensuring the chart reflects only fresh interest levels.
🎨 Visual Guide
The indicator uses a specific color-coding and labeling system to convey information quickly:
● Support & Resistance Lines
Red Lines (Thin): Represent active Resistance levels on the current timeframe.
Green Lines (Thin): Represent active Support levels on the current timeframe.
Fuchsia Lines (Thick): Represent Higher Timeframe (HTF) Resistance levels.
Aqua Lines (Thick): Represent Higher Timeframe (HTF) Support levels.
● Market Structure Labels
Located at the pivot points, these text labels define the trend structure:
HH / LH: Higher High / Lower High (Red Text).
LL / HL: Lower Low / Higher Low (Green/Aqua Text).
HTF-R / HTF-S: Indicates major structural pivots from the higher timeframe.
● Breakout Signals
When a valid break occurs, a label appears above or below the bar:
Blue Triangle Up (▲): Bullish breakout through resistance.
Blue Triangle Down (▼): Bearish breakout through support.
Number in Label: Indicates the cumulative count of breaks for that specific trend sequence (e.g., "1" is the first break, "2" is the second).
The breakout count represents the intensity of the move. A reading greater than 1 signals exceptional market strength, indicating the penetration of multiple Key Levels (Support or Resistance) within a single candle.
📖 How to Use
Trend Continuation: In an uptrend (sequence of HH/HL), wait for a Blue Triangle Up (▲) occurring at a Red Resistance line. This signals the continuation of the trend.
Trend Reversal: Watch for a "Structure Break." If price is making Higher Highs, but then breaks a Green Support line (generating a ▼ signal) and forms a Lower Low (LL), the trend may be reversing.
HTF "Bounce" Plays: Use the thick Fuchsia/Aqua lines as major zones. If price approaches a thick Aqua line (HTF Support) and fails to break it, look for LTF bullish structure (HH/HL) to form for an entry.
Volume Filtering: Enable the "Volume Confirmation" setting to filter out "fakeouts" (breaks on low volume).
⚙️ Inputs and Settings
● Swing Settings
Left/Right Bars: Determines the sensitivity of the pivot detection. Higher numbers = fewer, more significant pivots.
Max Stored Levels: How many S/R lines to keep in memory at once.
Max Break Labels: Limits visual clutter by capping the number of signal labels.
● Usability & HTF
Enable Time Decay: If true, deletes lines that are older than "Decay Period" bars.
Enable HTF Levels: Toggles the display of higher timeframe pivots.
HTF Timeframe: Select the specific timeframe for the macro view (e.g., "D" for Daily).
● Analysis
Volume Confirmation: Toggles the requirement for volume to be above its average for a signal to fire.
Show Market Structure: Toggles the HH/LL text labels.
🔍 Deconstruction of the Underlying Scientific and Academic Framework
The script's logic is rooted in Fractal Geometry and Auction Market Theory .
● Mandelbrot's Fractals: The use of `leftBars` and `rightBars` is a direct application of identifying market fractals. Markets are self-similar across timeframes; a pivot on a 5-minute chart is structurally identical to one on a Weekly chart. This script exploits this property by allowing nested timeframe analysis (LTF inside HTF).
● Memory of Price (Behavioral Finance): Support and resistance lines represent zones where market participants have previously established value (Price Memory). The "Breakout" signal is mathematically significant because it represents a shift in the supply/demand equilibrium. When price closes beyond a stored array value (the pivot price), it signifies that the aggressive limit orders that created the pivot have been exhausted or withdrawn, validating a new search for value.
⚠️ Disclaimer
All provided scripts and indicators are strictly for educational exploration and must not be interpreted as financial advice or a recommendation to execute trades. I expressly disclaim all liability for any financial losses or damages that may result, directly or indirectly, from the reliance on or application of these tools. Market participation carries inherent risk where past performance never guarantees future returns, leaving all investment decisions and due diligence solely at your own discretion.

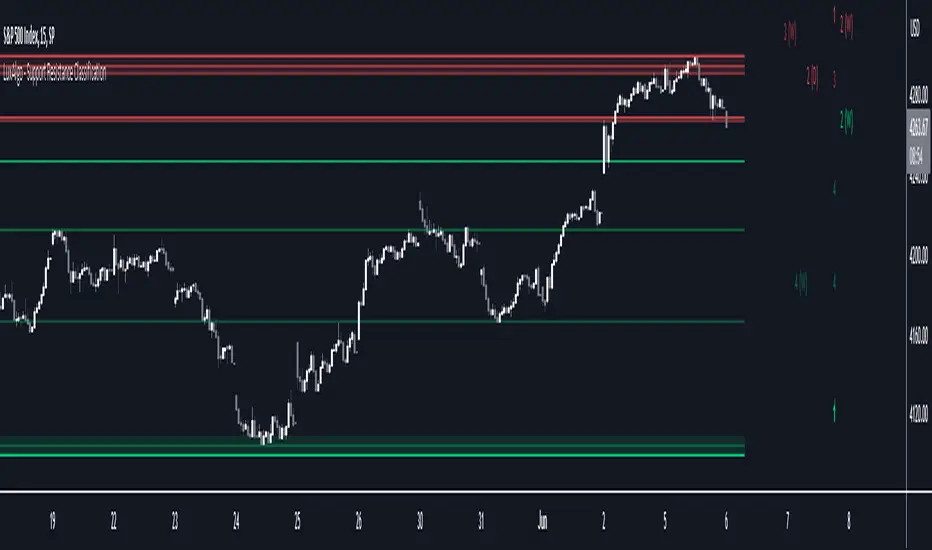
Support Resistance Classification [LuxAlgo]The Support Resistance Classification indicator shows SR levels from a user-defined range using higher time-frame data (HTF). Levels are classified 1 through 10 based on their strength, with lower values indicating stronger support/resistance levels.
This indicator doesn't use visible range functionality, in contrast to our Support Resistance Classification (VR) indicator, it uses a set lookback period to find support/resistance levels.
Since both techniques cannot be used together in 1 script, we developed a separate, NON-VR version.
🔶 USAGE
Certain indicators on higher timeframes can provide longer-term support/resistance levels on lower timeframes. Users can use the provided levels and use them as references for future support/resistance levels.
The classification algorithm measures the strength of a support/resistance level using the set range and is in a range of 1 to 10, with higher values indicating a weaker support/resistance.
Supports/resistances highlighted by the indicator can be used for future applications by marking them on the chart (quickly done with alt + h).
🔶 DETAILS
All calculations are based on what is seen in the last amount of bars, which is the period between the blue vertical line and the last candle:
Since only Swings which are not broken are included, every break would exclude that swing. Therefore, even when 'value' is chosen at Settings ('Value'), breaks are always calculated on the entire line.
🔶 SETTINGS
Lookback: Amount of bars from current bar to x bars back , this is the period where support/resistance levels are calculated.
Fade: After x breaks the line becomes invisible
Value:
value:
• SMA, upper/lower: the breaks are triggered on the moving average itself
• Fibonacci Pivot Point levels, Previous High, Previous Low: only last HTF values can be used for breaks
• Swings (see SWING SETTINGS)
line:
• SMA, upper/lower: the breaks are triggered on the entire line, based on its latest value
• Fibonacci Pivot Point Levels, Previous High, Previous Low: breaks are triggered on the entire line, based on its latest value
• Swings (see SWING SETTINGS)
🔹 Swing Settings
Swings are always calculated at the current timeframe, setting an HTF is not applicable to Swings.
Left/Right: for Swing calculation ( pivothigh , pivotlow )
Show: enables you to see the pivot points
🔹 Set
N°: The concerning number
TYPE:
• SMA (Simple Moving Average)
• Previous High/Low
• Upper/Lower ( Bollinger Bands )
• Pivot Point levels : "Fibonacci"
LENGTH: sets the 'Number of bars', needed for calculations (applicable for SMA, upper/lower)
MULT: sets the 'Standard deviation factor' (only applicable for upper/lower - BB)
HTF: sets 'Higher Time Frame' (applicable for SMA, upper/lower, Previous High/Low, Fibonacci)
🔹 Show Values
You can make up to 5 values visible (if you want to check/verify), except for Swings (see SWING SETTINGS)
To do so, enable (A -> E), and choose the N° you want to see.
This also is a useful tool if you're not sure which value you want to set.
The Perfect Support & ResistanceSupport & Resistance drawn based on overbought & oversold RSI . where the overbought acts as resistance and oversold acts as support.
It has 2 levels (for support and resistance - i call them level_n_high or level_n_low) for each lookback period. it checks the highest pivot and the lowest pivot based on the lookback period then we compare if rsi is higher than the highest pivot or the lowest pivot and we also check if rsi is overbought or oversold and if the statement is true, then we assign the high to the variable level_n_high or level_n_low. n being the number of levels. in total there are 5 levels with both high & low for 5 lookback periods. This is basically how the code works.
these levels can be accessed at any timeframe. the defaults are 5m and 30m.
RSI settings: (default)
-------------------
length - 14
source - close
overbought - 70
oversold - 30
lookback settings: (default)
---------------------
lookback_0 - 200
lookback_1 - 100
lookback_2 - 50
lookback_3 - 20
lookback_4 - 10
Timeframe Settings: (default)
-------------------
htf1 - 5m
htf2 - 30m
Enjoy!

Support and Resistancewhat is "Support and Resistance"?
it is a support and resistance indicator.
what it does?
it draw support and resistance zones on the chart.
how it does it?
It determines the zones where the price leaves with a big candle after going horizontal for a while as support or resistance zones according to the price movement direction. while doing this, it compares the size of the candles and the elapsed time.
how to use it?
Red zones represent resistance and green zones represent support. You can buy in the support zone or sell in the resistance zone. my advice is to make your own interpretation by taking into account the price movement with different indicators. they are considered useful if there is a closure beyond the zones. otherwise, they continue to be shifted to the right.
notice: As new zones are created, old ones may disappear. so it might be wise to draw boxes using drawing tools where the old zones are.
Support and resistance are very important concepts for technical analysis. so I am thinking of updating and improving this indicator many times in the long run. but I couldn't wait long to post it.
examples:

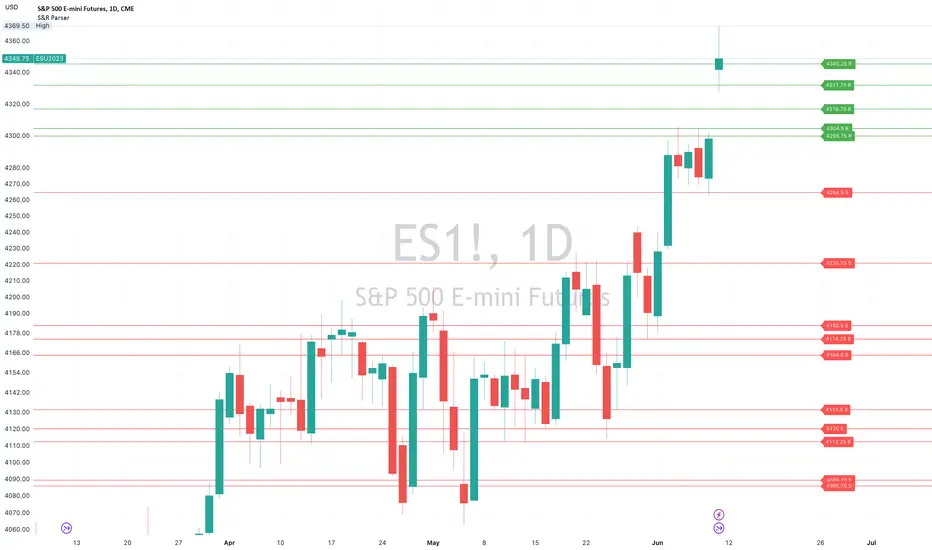
Support & Resistance ParserI've created a user-friendly trading indicator that interprets and visually presents support and resistance levels, transforming raw data into actionable insights.
Here's a glimpse of what you might encounter:
Today's trigger points (ES)
Support: 4264.5,4220.75,4131.5,4164.5,3980.75,4182.5,4174.25,4120,4112.25,4089.25,4085.75
Resistance: 4299.75,4304.5,4316.75,4345.25,4331.75
This is how it works:
1. Copy the series of support and resistance figures, ie just the comma separated numbers
2. Paste each series into their respective setting in the indicator.
3. The indicator parses the data, understanding the sequence and importance of each figure.
4. It then draws the corresponding support and resistance lines on your trading chart.
Chart would appear similar to the following:
This tool distinguishes itself with its user-friendly features. Each line comes with adjustable labels, enabling users to personalize their visualization. This makes the data more intuitive and easier to comprehend, enhancing decision-making during trades.
Note: The indicator includes limited error handling capabilities.
Make the most out of your trading journey with this intuitive and customizable tool, specifically designed to turn raw data into valuable trading insights.
Support Resistance Classification (VR) [LuxAlgo]The Support Resistance Classification (VR) indicator shows SR levels on any chart's visible range using higher time-frame data (HTF). Levels are classified 1 through 10 based on their strength, with lower values indicating stronger support/resistance levels.
This indicator uses visible range functionality, whereas if you adjust your chart to show previous price data, the indicator may show new levels.
🔶 USAGE
Certain indicators on higher timeframes can provide longer term support/resistance levels on lower timeframes. Users can use the provided levels on a chart visible range and use them as reference for future support/resistance levels.
The classification algorithm measures the strength of a support/resistance level using the entire chart visible range and is in a range of 1 to 10, with higher values indicating a weaker support/resistance.
Supports/resistances highlighted by the indicator can be used for future applications by marking them on the chart (quickly done with alt + h).
🔶 DETAILS
All calculations are based on what you see on the Visible Chart, as such changing the chart will recalculate the indicator.
Since only Swings which are not broken are included, every break would exclude that swing. Therefore, even when 'value' is chosen at Settings ('Value'), breaks are always calculated on the entire line.
🔶 SETTINGS
Fade: After x breaks the line becomes invisible
Value:
value:
• SMA, upper/lower: the breaks are triggered on the moving average itself
• Fibonacci Pivot Point levels, Previous High, Previous Low: only last HTF values can be used for breaks
• Swings (see SWING SETTINGS)
line:
• SMA, upper/lower: the breaks are triggered on the entire line, based on its latest value
• Fibonacci Pivot Point Levels, Previous High, Previous Low: breaks are triggered on the entire line, based on its latest value
• Swings (see SWING SETTINGS)
🔹 Swing Settings
Swings are always calculated at current timeframe, setting a HTF is not applicable on Swings.
Left/Right: for Swing calculation ( pivothigh , pivotlow )
Show: enables you to see the pivot points
🔹 Set
N°: The concerning number
TYPE:
• SMA (Simple Moving Average)
• Previous High/Low
• Upper/Lower ( Bollinger Bands )
• Pivot Point levels : "Fibonacci"
LENGTH: sets the 'Number of bars', needed for calculations (applicable for SMA, upper/lower)
MULT: sets the 'Standard deviation factor' (only applicable for upper/lower - BB)
HTF: sets 'Higher Time Frame' (applicable for SMA, upper/lower, Previous High/Low, Fibonacci)
🔹 Show Values
You can make up to 5 values visible (if you want to check/verify), except for Swings (see SWING SETTINGS)
To do so, enable (A -> E), and choose the N° you want to see.
This also is a useful tool if you're not sure which value you want to set.
Support & Resistance Zone Hunter [BOSWaves]Support & Resistance Zone Hunter - Dynamic Structural Zones with Real-Time Breakout Intelligence
Overview
The Support & Resistance Zone Hunter is a professional-grade structural mapping framework designed to automatically detect high-probability support and resistance areas in real time. Unlike traditional static levels or manually drawn zones, this system leverages pivot detection, range thresholds, and optional volume validation to create dynamic zones that reflect the true structural architecture of the market.
Zones evolve as price interacts with their boundaries. The first touch of a zone determines its bias - bullish, bearish, or neutral - and the system tracks the full lifecycle of each zone from formation, testing, and bias establishment to potential breakout events. Diamond-shaped breakout signals highlight structurally significant price expansions while filtering noise using a configurable cooldown period.
By visualizing market structure in this way, traders gain a deeper understanding of price behavior, trend momentum, and areas where liquidity and reactive forces are concentrated.
Theoretical Foundation
The Support & Resistance Zone Hunter is built on the premise that meaningful structural zones arise from two core principles:
Pivot-Based Turning Points : Only significant highs and lows that represent actual swings in price are considered.
Contextual Validation : Zones must pass minimum range criteria and optional volume thresholds to ensure their relevance.
Markets naturally generate numerous micro-pivots that do not carry predictive significance. By filtering out minor swings and validating zones against volume and range, the system isolates levels that are more likely to attract future price interaction or act as catalysts for breakout moves.
This framework captures not only where price is likely to react but also the direction of potential pressure, providing a statistically grounded, visually intuitive representation of market structure.
How It Works
The Support & Resistance Zone Hunter constructs zones through a multi-layered process that blends pivot logic, range validation, and real-time bias determination:
1. Pivot Detection Core
The indicator identifies pivot highs and pivot lows using a configurable lookback period. Zones are only considered valid when both a top and bottom pivot are present.
2. Zone Qualification Engine
Prospective zones must satisfy two conditions:
Range Threshold : The distance between pivot high and low must exceed the minimum percentage set by the user.
Volume Requirement : If enabled, the current volume must exceed the 50-period moving average.
Only zones meeting these criteria are drawn, reducing noise and emphasizing high-probability structural levels.
3. Zone Lifecycle
Once a valid top and bottom pivot exist:
The zone is created starting from the pivot formation bar.
Zones remain active until both boundaries have been touched by price.
The first boundary touched establishes bias: resistance first → bullish bias ,support first → bearish bias, neither → neutral.
Inactive zones stop expanding but remain visible historically to maintain a clear structural context.
4. Visual Rendering
Active zones are displayed as filled boxes with color corresponding to their bias. Top, bottom, and midpoint lines are drawn for reference. Once a zone becomes inactive, its lines are removed while the filled box remains as a historical footprint.
5. Breakout Detection
Breakout signals occur when price closes above the top boundary or below the bottom boundary of an active zone. The system applies a cooldown period and requires price to return to the zone since the previous breakout to prevent signal spam. Bullish and bearish breakouts are visually represented by diamond-shaped markers with configurable colors.
Interpretation
The Support & Resistance Zone Hunter provides a structural view of market balance:
Bullish Zones : Form when resistance is tested first, indicating upward pressure and potential continuation.
Bearish Zones : Form when support is tested first, reflecting downward pressure and continuation risk.
Neutral Zones : Fresh zones that have not yet been interacted with, representing undiscovered liquidity.
Breakout Diamonds : Highlight significant structural price expansions, helping traders identify confirmed continuation moves while filtering noise.
Zones do not simply indicate past levels; they dynamically reflect the evolving battle between buyers and sellers, providing actionable context for both trend continuation and reversion strategies.
Strategy Integration
The Support & Resistance Zone Hunter is versatile and can be applied across multiple trading approaches:
Trend Continuation : Use bullish and bearish zones to confirm directional bias. Breakout diamonds indicate structural continuation opportunities.
Reversion Entries : Neutral zones often act as magnets in ranging markets, allowing for high-probability mean-reversion setups.
Breakout Trading : Diamonds mark true structural expansions, reducing false breakout risk and guiding stop placement or momentum entries.
Liquidity Zone Alignment : Combining the indicator with order block, breaker, or volume-based tools helps validate zones against broader market participation.
Technical Implementation Details
Pivot Engine : Two-sided pivot detection based on configurable lookback.
Zone Qualification : Minimum range requirement and optional volume filter.
Bias Logic : Determined by the first boundary touched.
Zone Lifecycle : Active until both boundaries are touched, historical visibility retained.
Breakout Signals : Diamond markers with cooldown filtering and price-return validation.
Visuals : Transparent filled zones with live top, bottom, and midpoint lines.
Suggested Optimal Parameters
Pivot Lookback : 10 - 30 for intraday, 20 - 50 for swing trading.
Minimum Range % : 0.5 - 2% for crypto or indices, 1 - 3% for metals or forex.
Volume Filter : Enable for assets with inconsistent liquidity; disable for consistently liquid markets.
Breakout Cooldown : 5 - 20 bars depending on volatility.
These suggested parameters should be used as a baseline; their effectiveness depends on the asset and timeframe, so fine-tuning is expected for optimal performance.
Performance Characteristics
High Effectiveness:
Markets with clear pivot structure and reliable volume.
Trending symbols with consistent retests.
Assets where zones attract repeated price interaction.
Reduced Effectiveness:
Random walk markets lacking structural pivots.
Low-volatility periods with minimal price reaction.
Assets with irregular volume distribution or erratic price action.
Integration Guidelines
Use zone color as contextual bias rather than a standalone signal.
Combine with structural tools, order blocks, or volume-based indicators for confluence.
Validate zones on higher timeframes to refine lower timeframe entries.
Treat breakout diamonds as confirmation of continuation rather than independent triggers.
Disclaimer
The Support & Resistance Zone Hunter provides structural zone mapping and breakout analytics. It does not predict price movement or guarantee profitability. Success requires disciplined risk management, proper parameter calibration, and integration into a comprehensive trading strategy.

Support/Resistance Strength [UAlgo]The Support/Resistance Strength indicator is a tool designed for traders seeking a precise understanding of key support and resistance levels in the market. This tool dynamically identifies and visualizes support and resistance zones based on pivot points and strength criteria, providing traders with actionable insights for better decision-making.
By incorporating features such as ATR-based or percentage-based channel calculations, customizable strength thresholds, and intuitive visualization of key levels, the indicator caters to traders of various skill levels and strategies. It also adapts dynamically to market conditions, allowing users to identify frequently tested zones with minimal manual input.
🔶 Key Features
Dynamic Support and Resistance Zones
Automatically detects significant support and resistance levels using pivot high and low calculations.
Offers ATR-based or percentage-based channel customization to cater to diverse trading styles.
Customizable Parameters
Lookback period for pivot calculations, strength threshold, and maximum stored pivots are fully adjustable.
Display options for showing specific numbers of recent support/resistance lines.
Intuitive Visualization
Highlights key support and resistance levels with color-coded lines and labels.
Includes percentage deviation from the current price for quick assessment.
Interactive Updates
Continuously updates support and resistance levels to reflect changing market dynamics.
Displays pivot points visually for enhanced clarity.
Can be used effectively on various timeframes, from intraday to daily and weekly charts.
🔶 Interpreting the Indicator
Identifying Key Levels
Support levels are indicated by green (lime) lines and resistance levels by red lines. The transparency of colors is adjustable for visual preference.
Labels display the exact price level and the percentage difference from the current price.
Strength Threshold
The "Minimum S/R Strength" parameter defines how frequently a level must be tested to be considered significant.
Higher strength values indicate zones that have been tested more frequently, suggesting stronger support or resistance.
Pivot Points
The indicator marks pivot high and low points on the chart to provide a visual representation of the calculated levels.
Dynamic Updates
The indicator adapts to the most recent price action. If the price moves above a resistance level or below a support level, the color of the lines and labels will dynamically change to reflect the current price positioning.
🔶 Disclaimer
Use with Caution: This indicator is provided for educational and informational purposes only and should not be considered as financial advice. Users should exercise caution and perform their own analysis before making trading decisions based on the indicator's signals.
Not Financial Advice: The information provided by this indicator does not constitute financial advice, and the creator (UAlgo) shall not be held responsible for any trading losses incurred as a result of using this indicator.
Backtesting Recommended: Traders are encouraged to backtest the indicator thoroughly on historical data before using it in live trading to assess its performance and suitability for their trading strategies.
Risk Management: Trading involves inherent risks, and users should implement proper risk management strategies, including but not limited to stop-loss orders and position sizing, to mitigate potential losses.
No Guarantees: The accuracy and reliability of the indicator's signals cannot be guaranteed, as they are based on historical price data and past performance may not be indicative of future results.

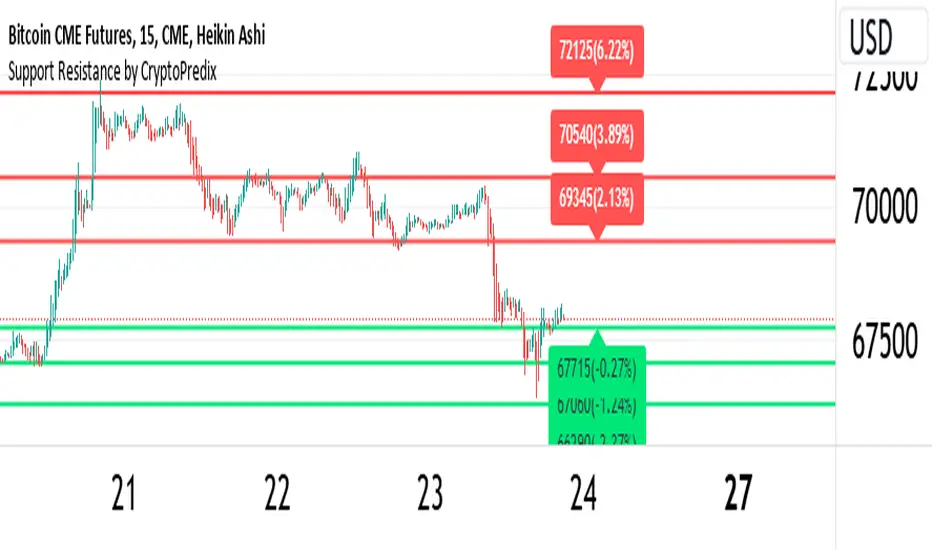
Support Resistance - CryptoPredixHow this indicator works :
1. Setup and Inputs: The script sets up user inputs for various parameters such as pivot period (prd), pivot source (ppsrc), maximum channel width (ChannelW), maximum number of support/resistance levels (maxnumsr), minimum strength (min_strength), label location (labelloc), line style (linestyle), and line width (linewidth).Colors for support and resistance lines are also defined (supportcolor, resistancecolor).
2. Pivot Point Calculation: The script calculates pivot high and pivot low values based on the selected source (either High/Low or Close/Open).It uses the ta.pivothigh and ta.pivotlow functions to identify these pivot points over the specified period (prd).
3. Plotting Pivot Points: If the showpp option is enabled, the script plots pivot high and pivot low points on the chart using plotshape.
4. Managing Pivot Values: The script maintains an array (pivotvals) to store recent pivot values, ensuring the number of stored values does not exceed the maximum specified (maxnumpp).
5. Support and Resistance Zone Calculation: It calculates support and resistance zones by finding ranges of pivot values that fall within a specified channel width (cwidth).The function get_sr_vals returns the highest, lowest values, and the number of pivot points within the channel width.
6. Storing Support and Resistance Levels: The script manages arrays for support and resistance levels (sr_up_level, sr_dn_level) and their strength (sr_strength).It uses the check_sr function to ensure that new support/resistance levels are valid and don't overlap with existing ones unless they have higher strength.
7. Label and Line Management: The script dynamically updates labels and lines for the support and resistance levels, adjusting their positions, colors, and styles based on the latest data.It ensures the labels and lines are in sync with the current bar index and close price.
8. Identifying Crossings: Functions f_crossed_over and f_crossed_under check if the close price has crossed above or below the identified support or resistance levels.These functions iterate through the support/resistance arrays and check the conditions for crossing.
9. Alerts: The script sets up alert conditions to notify when the price crosses above a resistance level or below a support level.Alerts are configured with titles and messages ('Resistance Broken' and 'Support Broken').
10. Visualization: The script provides visual cues on the chart by plotting support and resistance lines with different styles and colors.It also dynamically updates labels to display the level values and their percentage distance from the current close price.
This script helps traders identify key support and resistance levels on a chart, providing both visual cues and alerts for significant price movements relative to these levels.
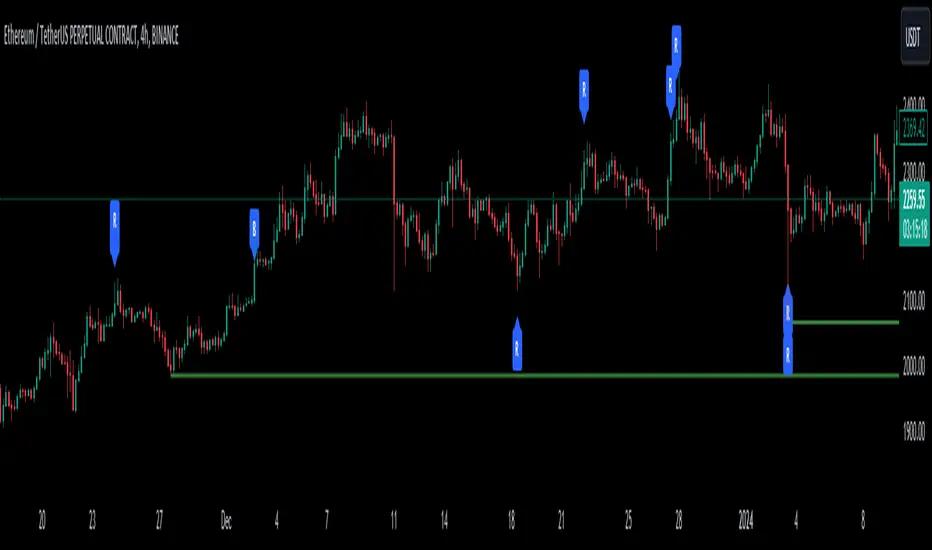
Support and Resistance with Signals [UAlgo]🔶 Description:
"Support and Resistance with Signals ", is designed to identify key support and resistance levels on a trading chart while also signaling potential retests (denoted as "R") and breakouts (denoted as "B"). The indicator dynamically plots support and resistance lines based on pivot points and adjusts them according to price action and sensitivity settings. It aims to assist traders in identifying significant price levels and potential reversal or breakout opportunities.
🔶 Key Features:
Pivot Points: The indicator calculates pivot highs and pivot lows based on a specified period length (Checks Left and Right bars). Adjust the length of the pivot period to control the sensitivity of support and resistance levels according to the your preferences.
Support and Resistance Lines: It plots support and resistance lines at the pivot high and pivot low points, respectively.
Retest and Breakout Signals: Signals are generated based on the sensitivity setting, which adds/subtracts a portion (half) of the Average True Range (ATR) to the pivot points. A retest signal ("R") is generated when the price approaches the support or resistance level within the sensitivity range. A breakout signal ("B") is generated when the price surpasses the support or resistance level.
Sensitivity (ATR Length): Modify the retest-breakout sensitivity length to fine-tune the generation of signals based on price volatility.
Maximum Lines : Limit the number of support and resistance lines displayed on the chart for clarity.
Line Colors and Width: Customize the colors and width of support and resistance lines for better visualization.
More Examples:
Before Retest Signal:
When the price enters the retest range at the specified sensitivity:
Disclaimer:
This indicator is provided for informational purposes only and should not be considered as financial advice. Trading involves risk, and users should conduct their own research and analysis before making any investment decisions. The retest and breakout signals generated by this indicator are based on historical price data and may not guarantee future results. Users should exercise caution and use additional confirmation methods before entering any trades based on the signals provided by this indicator.
Happy Trading !
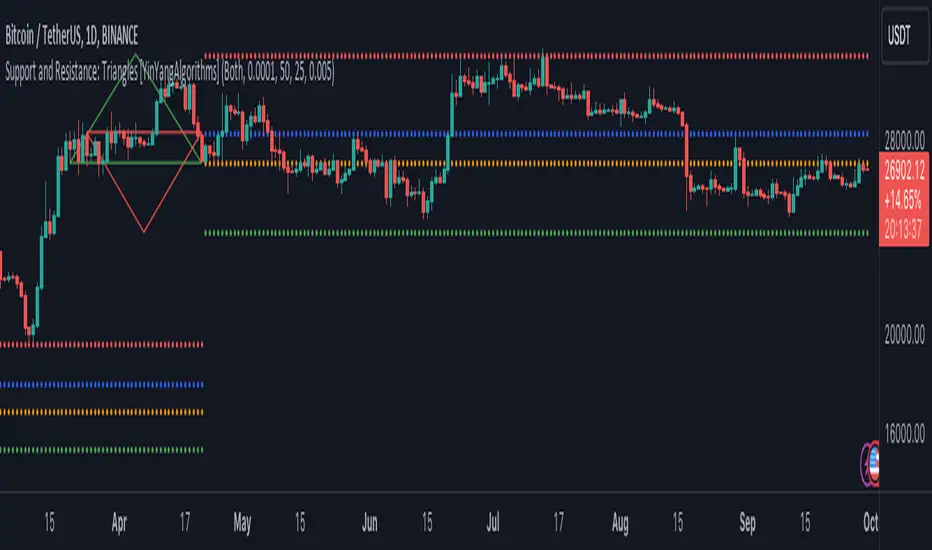
Support and Resistance: Triangles [YinYangAlgorithms]Overview:
Triangles have always been known to be the strongest shape. Well, why wouldn’t that likewise apply to trading? This Indicator will create Upwards and Downwards Triangles which in turn create Support and Resistance locations. For example, we find 2 highs that meet the criteria (within deviation %, Minimum Distance and Lookback Distance). We calculate the distance between these two and create an Equilateral Triangle Downwards (You can adjust the % if you want more of an Isosceles Triangle). The midpoint (tip) of this triangle is the Support and the bottom (base) of it is the Resistance. The exact opposite applies for an Upwards Triangle.
The reason why Triangles may make for good Support and Resistance locations is the % 's used, much like the fibonacci, use ratios relevant in nature and everywhere in the world around us, so why not for trading too?
Tutorial:
If you look at the locations we’ve circled above, all of them exhibit strong rejections are predictive Support and Resistance locations plotted by the triangles created. There can only ever be 1 Upward and 1 Downward Triangle at a time, so when a new one is created, the Support and Resistance locations are moved.
If you scroll back far enough you’ll notice the Triangles disappear but their Support and Resistance locations are still plotted. This has to do with the fact you are allowed only so many Lines plotted and when a new Triangle is created, an old one will be removed. The Support and Resistance locations however will stay.
If we look at the example above, you can see the Support and Resistance locations the Triangles made here may have helped predict where the price would struggle to surpass.
By default the Look Back Distance is set to 50 and the Min Distance is 10 (settings used in all previous examples). However, you can modify these to make Triangles more ‘Rare’ and therefore the Support and Resistance locations change less. In the example above for Instance we left Look Back Distance to 50 but changed Min Distance from 10 to 25. This results in Support and Resistance locations that may hold better in the long term.
If we scroll back a bit, we can see the settings ‘Look Back Distance’ 50 and ‘Minimum Distance’ 25 had done a decent job at predicting the ATH resistance and many Support and Resistance locations around it. Keep in mind, previous results don’t mean future results, but Triangles may create ratios which apply well to trading.
We will conclude our Tutorial here. Hopefully you can see the benefit to the ratio Triangles make when predicting Support and Resistance locations.
Settings:
Show Triangles: If all you want to know is the Support and Resistance locations, there’s no need to draw the Triangles.
Triangle Zones: What types of triangles should we create our zones for? Options are Upward, Downward, Both, None.
Max Deviation Allowed: Maximum Deviation up or down from the last bars High/Low for potential to create a Triangle.
Lookback Distance: How far back we look to see for potential of a High/Low within Deviation range.
Min Distance: This is so triangles are spaced properly and not from 2 bars beside each other. Min distance allocated between 2 points to create a Triangle.
Bar Percent Increase: How much % multiplier do we apply for each bar spacing of the triangle. 0.005 creates a close to Equilateral Triangle, but other values like 0.004 and 0.006 seem to work well too.
If you have any questions, comments, ideas or concerns please don't hesitate to contact us.
HAPPY TRADING!
Support & Resistance PROHi Traders!
The Support & Resistance PRO
A simple and effective indicator that helped me a bunch!
This indicator will chart simple support and resistance zones on 2 time frames of your choice.
It uses a 30 day lookback period and will find the last high and low.
Each zone is built from the highest/lowest closure, and the highest/lowest wick, creating a liquid zone between the 2.
It is perfect for people trading support and resistance, watching key areas, scalping zones and much more!
*You can change the time frames you are looking at and the lookback period.
*The example in the picture is looking at the Daily and Weekly zones on BTC.

support and resistance on multi timeframe [parsimaj] Description:
support and resistance and trendline on two timeframes by your choice
This indicator is capable of showing you the current and higher timeframe support and resistance by your strategy choice (two timeframes alongside each other). It also helps you to monitor the trend direction in short and long term by trend lines . You can change the depth of every levels and trend lines from the panel. Use this indicator in all markets because it follows the basic principles of levels but is unique in changing second timeframe by your choice.
_its smart , if the levels are too close together ,it will choose the deeper ones for you.
How it works:
By default, there is no higher timeframe and you can select your desire higher timeframe from the panel. Higher timelines will be displayed thicker and your current levels would be thin lines. (Levels that are higher than the current price will be red and those that are lower will be green). The number of levels to display is also by your choice, the default is 4 levels for each timeframe.
We have two types of trend lines , long terms as trend 1 (blue below and purple above trend line )- short term as trend 2(dashed ones).
Bouncing on levels and breaking trend line are the best triggers for entry and exit points.
Setting:
First, choose your higher timeframe then the depth of levels for each time (current and higher), The deeper it is, the more precise the lines. After that you can set the depth of trend lines by your choice. Trend 1 is the longer term So put it deeper and then set the short trend line (dashed ones) if you want to change it.
We have put the settings in the best mode, but you can also change it according to your strategy and inform us about the results.
This indicator has been obtained with hours of effort and codding , hope you enjoy