Opening Range FibonaccisThis indicator uses the concept of the "Opening Range" to create a Fibonacci zone from the high and low set during a specific time period after open (Defaults to 9:30 - 10:05 AM, EST)
The Opening Range is a popular tool for intraday technical analysis. Price frequently uses these levels as support/resistance, and a breakout from within the range can be a sign of further movement.
The Fibonacci levels are set such that the opening range high/low fall on the +/-0.5 fib. This creates an "extended range" outside of the opening range that may be useful during breakouts.
Cari dalam skrip untuk "support"

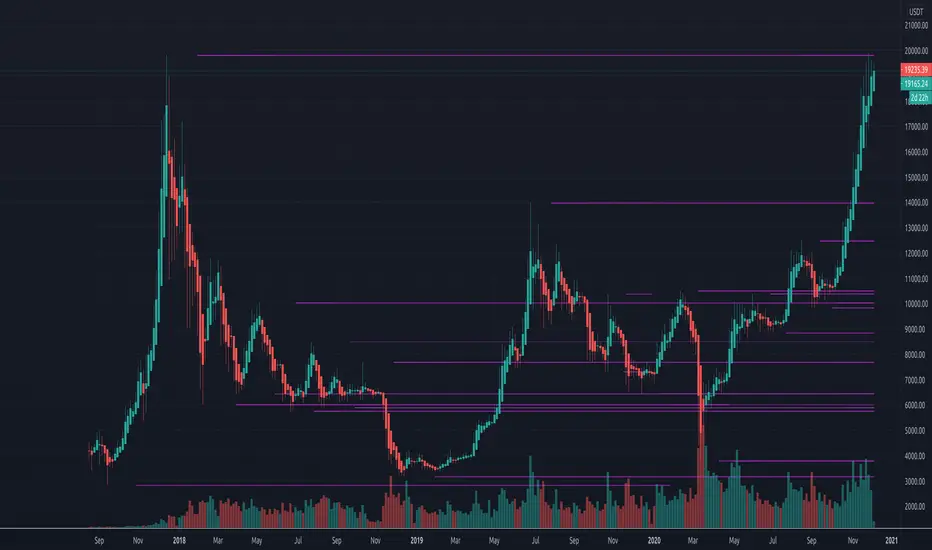
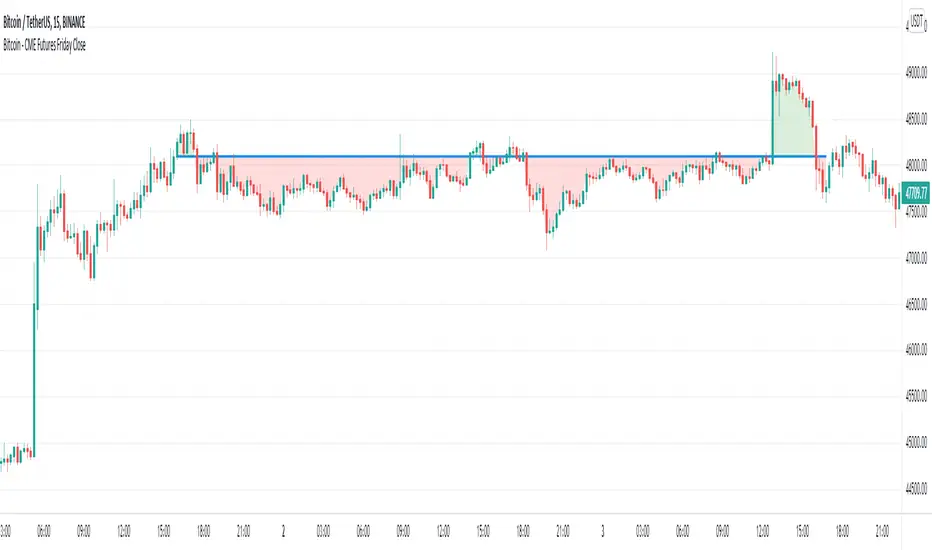
Bitcoin - CME Futures Friday Close
This indicator displays the weekly Friday closing price according to the CME trading hours (Friday 4pm CT).
A horizontal line is displayed until the CME opens again on Sunday 5pm CT.
This indicator is based on the thesis, that during the weekend the Bitcoin price tends to mean reverse to the CME closing price of the prior Friday. The level can also act as support/resistance. This indicator gives a visualization of this key level for the relevant time window.
Furthermore the indicator helps to easily identify, if there is an up or down gap in the CME Bitcoin contract.
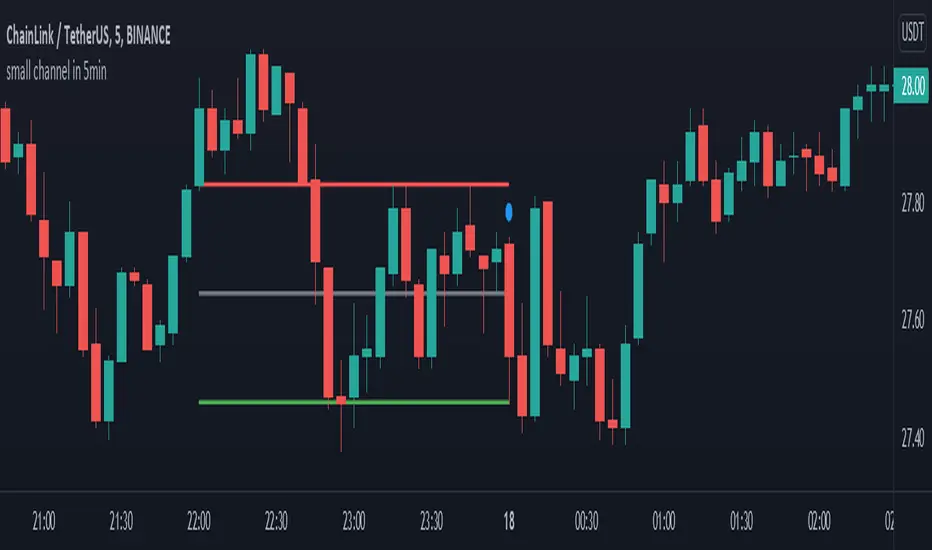
small channel in 5minThis indicator designed for 5min time-frame.
it detects a candlestick pattern in one hour time-frame and draw a channel based on the detected pattern, where two candles and are covered by the third one , in 5 min time-frame.
the bottom, middle and top of the channel are colored by green, gray and red respectively. this channel may help user to use it as a possible support and resistance region.
(the pattern is defined in line 11 to 13.)
enjoy it
Auto Fibonacci and Gann Fan/Retracements ComboIntroduction
This is a combination of Fibonacci and Gann fan/retracements.
The script can automatically draw as many:
Fibonacci Retracements
Fibonacci Fan
Gann Retracements
Gann Fan
as the user requires on the chart. Each level set or fan consists of 7 lines based on the most important ratios of Fibonacci/Gann.
Basics
What are Fibonacci retracements?
Fibonacci retracement levels are horizontal lines that indicate where support and resistance are likely to occur. They stem from Fibonacci’s sequence. Each level is associated with a percentage which is how much of a prior move the price has retraced. The Fibonacci retracement levels are 23.6%, 38.2%, 61.8%, and 78.6%. While not officially a Fibonacci ratio, 50% is also used. The indicator is useful because it can be drawn between any two significant price points, such as a high and a low. The indicator will then create the levels between those two points.
What are Gann retracements?
A developer of technical analysis and trading was W.D. Gann. Gann theory expects a normal retracement of 50 percent. This means that under normal selling pressure, the stock price will decline half the amount of its most recent rise, and vice versa. It also suggests that retracements occur at the halfway point of a move, such as 25 percent (half of 50 percent), 12.5 percent (half of 25 percent), and so on.
What is Fibonacci fan?
Fibonacci fan is a set of sequential trend lines drawn from a trough or peak through a set of points dictated by Fibonacci retracements. The first step to create it is to draw a trend line covering the local lowest and highest prices of a security. To reach retracement levels, the trader divides the difference in price at the low and high end by ratios determined by the Fibonacci series. The lines formed by connecting the starting point for the base trend line and each retracement level create the Fibonacci fan.
What is Gann fan?
A Gann fan consists of a series of lines called Gann angles. These angles are superimposed over a price chart to show potential support and resistance levels. The resulting image is supposed to help technical analysts predict price changes. Gann believed the 45-degree angle to be most important, but the Gann fan also draws angles at degrees like 75, 63.75, 26.25 and 15. The Gann fan originates at a low or high point. The resulting lines show areas of potential future support and resistance. The 45-degree line is known as the 1:1 line because the price will rise or fall at a 45-degree angle when the price moves up/down one unit for each unit of time. All other lines in the Gann fan are drawn above and below the 1:1 line. The other angles are associated with 2:1, 3:1, 4:1, 8:1 and 1:8, 1:4, 1:3, and 1:2 time-to-price moves.
Challenges
The most of the time I dedicated to writing this script has been spent on handling these problems:
1. Finding Local Highest/Lowest Prices
In order to draw Fibonacci and Gann fan/retracements, it's necessary to find local highest and lowest price points (Extrema) on the chart. As this could be so challenging, most traders and coders draw the lines covering the low and high prices over a given period of time or a limited number of bars back instead. I already wrote an indicator using this approach ( Auto Fibonacci Combo ).
In this new script I tried to find the exact highest and lowest prices based on this idea that: if a high point is formed lower than previous high which was after a lowest point, then that previous one was the local highest point, and vice versa if a low point is formed higher than previous low which was after a highest point, then that previous one was the local lowest point. So logically an extremum price on the chart won't be found until the next high/low point is formed.
2. Finding Proper Chart Scale for Gann Fan
Based on the theory, Gann angles are sensitive to the chart price scale and in order to have the right angles, the chart must be made with the proper scale. J.A. Hyerczyk in his book "Pattern, Price & Time - Using Gann Theory in Technical Analysis" suggests that the easiest way to determine the scale of a market is by taking the difference between top-to-top and bottom-to-bottom and dividing it by the time it took the market to move from top to top and bottom to bottom.
Thus on a properly constructed chart, the basic equation for calculating Gann angles is: Price * Time.
3. Drawing Fans and Relocating Fan Labels at Each New Bar in Pine (A Programming-Related Subject)
To do this, I used linear equations and line slopes. Of course it was so complicated and exhausting, but finally I overcame that thanks to my genius cousin.
Settings and Usage
By default, the script shows detected extremum points plus 1 Fibonacci fan, 1 Gann fan, 1 set of Fibonacci retracements and no Gann retracements on the chart. All of these could be changed in the indicator settings beside the color and transparency of each line.
Feel free to use this and send me your thoughts!

Psychological Levels Redefined With LuckyNickVaPsychological Levels. Also described & speculated as Bank Levels by alot. These are Price levels that the masses are speculated to be more likely to trade based on more than anything else. These levels are great for entries & exits & market manipulation. This custom script is made to highlight price action at these Levels with Barcolor to see the price behavior & the candles that are closing above or below these levels to capture a better perspective to analyze based on this concept. These levels can be considered a form of support & resistance for the retail. Traders which can be used as insight to how the big players leave their footprints at these levels .

Market inbalance zone boxes [LM]HI Traders,
I would like to introduce you Market inbalance zone boxes, the idea is to look for big volatile candle and candle before and after. Big candle is result of big money orders and it creates zone where either bulls or bears where dominant. So it's a good place to look for support or resistance
The zone created if it meets volatility (atr) condition and if the candle has some percentage of body over wick. Top and bottom is determined by candles before and after this candle occures
In setting there is an option to shrink the gap as the the price continues advance more into the box. If the price will reach exceeds on it's way the box the gap is completely closed.
I hope you will enjoy it

CFD Ticks LevelsSimple but very effective script that finds areas of support and resistance through ticks exchange. Only works with CFDs
(You must enter in the settings the value corresponding to the CFD, example: US500 = 500, DAX30 = 30, FRANCE40 = 40 etc ...)
As usual, if you have any suggestions or bug reports don't hesitate.
Cheers

QFL single TF with alertsBacktesting compatible QFL pine script w/alerts
This version of QFL was made based on this one:
From author:
www.tradingview.com
I made the following additions according to my requirements:
- I need to use pine script 4
- I needed to avoid repainting issues so I'm not calling directly security, I'm using the wrapper function.
- There might be still repainting issues when you use "max base age" which uses the function "barssince" so be careful, you can disable it by setting its value to zero.
- Alerts so I can use it for automated trading and bots
- In order to make this signal compatible with the backtest script there's an option provided in the settings. If you enable this option this indicator will plot 1 whenever there's a BUY signal. This will allow the backtest to pick the "QFL Buy" from external indicator so it can perform the backtest.
I recommend some of these settings to start playing with the chart in 15 min / QFL in 1, 2 or 4 hours.
The higher the TF the more conservative.
QFL with 3.5% is pretty popular but you can try higher QFL percentage settings for a more conservative approach.

The Strat info boxThis indicator is an all in one indicator for the "The strat" method by Rob Smith. This indicator DOES NOT provide trading advice or trade entry signals!
What is included:
* Candle Type 1 - Inside Candle
* Candle Type 2- Up or Down Candle
* Candle Type 3 - Engulfing Candle
* Strat signal:
- 2-1-2 setup
- 3-2-2 setup
* Full Timeframe Continuity:
- from a 5min timeframe to a yearly timeframe. Green gives you an uptrend, Red a downtrend.
* middle of day and week
- this give you a support and resistance level at the middle of the day or week. This is a good indicator if the stock goes up or down
* extra info like:
- ATR of 14 days
- DTR of current day
- Volume info
- Float info
NASDAQ:FB

Auto Fib Extension and RetracementsThis script is used for plotting the Fibonacci support and resistance levels. Compared to other ones, the changes to this script are that you can choose what color should all the lines be and that it doesn't change the chart's size, meaning that it won't shrink the chart so that all the levels can be seen. If you have any suggestions, I'm open to anything.
Also, if you could give a like/comment or if you could follow me, that would do my day. Thank you all and enjoy!
Quantumvest - Auto LevelsAuthor: Arthur Wayne
Description: This script automatically plots levels according to Primetime Trading Academy guidelines.
Directions:
On the monthly chart, you should select two significant monthly support/resistance levels and input them into the script. It is recommended to mark these levels with the price label tool.
The script will then automatically plot 2 monthly 'wings' or additional monthly support/resistance levels above and below the original monthly high and low that are the same distance apart. Located half way in between the monthly levels, there will be weekly support/resistance levels. None of the values will go below 0. These levels should then be used on lower time-frames for technical analysis.
There is the option to customize the number of monthly wings, the width of the box surrounds the monthly s/r levels, the x-position of the level labels, as well as the colors for everything.
The biggest drawback is that levels will not save in between charts. This is a limitation of Pine Script and how TradingView does not offer the ability to create custom drawing tools, only indicators and strategies. This is why it is recommended to use the price label tool to keep track in between charts for different assets. Regardless, this script should make the process of drawing levels manually far more efficient than it was before.

Auto PitchFan, Fib Extension/Retracement and ZigZag by DGT Aᴜᴛᴏ PɪᴛᴄʜFᴀɴ, Fɪʙ Exᴛᴇɴꜱɪᴏɴ/Rᴇᴛʀᴀᴄᴇᴍᴇɴᴛ ᴀɴᴅ ZɪɢZᴀɢ
This study aim to automate PitchFan drawing tool and combines it with Fibonacci Extentions/Retracements and ZigZag.
Common setting options, applied to all components of the study
Deviation , is a multiplier that affects how much the price should deviate from the previous pivot in order for the bar to become a new pivot. Increasing its value is one way to get higher timeframe Levels
Depth , affects the minimum number of bars that will be taken into account when building
Historical PitchFan / Fibonacci Levels option will allow plotting of PitchFan / Fibonacci Levels on previous Pivot Highs/Lows
█ PɪᴛᴄʜFᴀɴ — is a set of rays spreading out of the point of a trend's beginning. These rays inclined with the coefficients formed by a Fibonacci number sequence. It is recommended to adjust the Pitchfan plottings to fit after the first wave of the trend has passed and the correction has clearly begun.
PitchFan rays corresponding to Fibonacci levels appear on a chart and represent inclined lines of support and resistance. Price areas near these rays are estimated areas from which the price can turn around or make a significant rebound. The whole logic of working with a pitchfan is based on one simple idea - if the price has bounced off the level, then the correction is likely to end, and the trend will continue. If the price has broken the first resistance, you should wait for the next level test
- Automatically plots PitchFan Rays, based on Pivot Lows/Highs.
- Ability to set ALERTs for each PitchFan Ray Level
- PitchFan Labels displays the price of the line at the last bar, the price value will be recalculated in each new bar
Please check the link provided below with the educational post of how to apply pitchfork, application of pitchfan is same keeping in mind the recommendation stated above
█ Fɪʙ Rᴇᴛʀᴀᴄᴇᴍᴇɴᴛs / Exᴛᴇɴꜱɪᴏɴꜱ
Fibonacci retracements is a popular instrument used by technical analysts to determine support and resistance areas. In technical analysis, this tool is created by taking two extreme points (usually a peak and a trough) on the chart and dividing the vertical distance by the key Fibonacci coefficients equal to 23.6%, 38.2%, 50%, 61.8%, and 100%.
Fibonacci extensions are a tool that traders can use to establish profit targets or estimate how far a price may travel AFTER a retracement/pullback is finished. Extension levels are also possible areas where the price may reverse.
IMPORTANT NOTE: Fibonacci extensions option may require to do further adjustment of the study parameters for proper usage. Extensions are aimed to be used when a trend is present and they aim to measure how far a price may travel AFTER a retracement/pullback. I will strongly suggest users of this study to check the education post for further details where to use extensions and where to use retracements
- Automatically plots possible Support and Resistance levels, based on Pivot Lows/Highs.
- Ability to set ALERTs for each Fibonacci Extension/Retracement Level
- Labels displays the level and the level price
█ Zɪɢ Zᴀɢ — The Zig Zag indicator is used to help identify price trends and changes in price trends. The Zig Zag indicator plots points on a chart whenever prices reverse by a percentage greater than a Deviation variable. Straight lines are then drawn, connecting these points. The Zig Zag indicator serves base for PitchFan and Fibonacci Retracements / Extensions
█ OTHER
PitchFan is often used in combination with the other indicators and/or drawing tools such as Fibonacci Retracement, Fibonacci Channels, Fibonacci Time Zone and others. It allows identify the most powerful areas from which price can turn and to get more accurate trading signal
Andrews’ Pitchfork, how to apply pitchfork and automated pitchfork study
Fibonacci Fans, how to apply fibonacci fans and automated fibonacci speed and resistance fans study
Fibonacci Extension / Retracement, where to use extensions and where to use retracements and automated fibonacci extension / retracement / pivot points study
Others
Fibonacci Channels, how to apply fibonacci channels and automated fibonacci channels study
Linear Regression Channels, , what linear regression channels are? and linear regression channel/curve/slope study
Disclaimer :
Trading success is all about following your trading strategy and the indicators should fit within your trading strategy, and not to be traded upon solely
The script is for informational and educational purposes only. Use of the script does not constitute professional and/or financial advice. You alone have the sole responsibility of evaluating the script output and risks associated with the use of the script. In exchange for using the script, you agree not to hold dgtrd TradingView user liable for any possible claim for damages arising from any decision you make based on use of the script

(IK) Grid ScriptThis is my take on a grid trading strategy. From Investopedia:
"Grid trading is most commonly associated with the foreign exchange market. Overall the technique seeks to capitalize on normal price volatility in an asset by placing buy and sell orders at certain regular intervals above and below a predefined base price."
This strategy is best used on sideways markets, without a definitive up or down major trend. Because it doesn't rely on huge vertical movement, this strategy is great for small timeframes. It only goes long. I've set initial_capital to 100 USD. default_qty_value should be your initial capital divided by your amount of grid lines. I'm also assuming a 0.1% commission per trade.
Here's the basic algorithm:
- Create a grid based on an upper-bound (strong resistance) and a lower-bound (strong support)
- Grid lines are spaced evenly between these two bounds. (I recommend anywhere between 5-10 grid lines, but this script lets you use up to 15. More gridlines = more/smaller trades)
- Identify nearest gridline above and below current price (ignoring the very closest grid line)
- If price crosses under a near gridline, buy and recalculate near gridlines
- If price crosses over a near gridline, sell and recalculate near gridlines
- Trades are entered and exited based on a FIFO system. So if price falls 3 grid lines (buy-1, buy-2, buy-3), and subsequently crosses above one grid line, only the first trade will exit (sell-1). If it falls again, it will enter a new trade (buy-4), and if it crosses above again it will sell the original second trade (sell-2). The amount of trades you can be in at once are based on the amount of grid lines you have.
This strategy has no built-in stop loss! This is not a 'set-it-and-forget-it" script. Make sure that price remains within the bounds of your grid. If prices exits above the grid, you're in the money, but you won't be making any more trades. If price exits below the grid, you're 100% staked in whatever you happen to be trading.
This script is more complicated than my last one, but should be more user friendly. Make sure to correctly set your lower-bound and upper-bound based on strong support and resistance (the default values for these are probably going to be meaningless). If you change your "Grid Quantity" (amount of grid lines) make sure to also change your 'Order Size' property under settings for proper test results (or default_qty_value in the strategy() declaration).

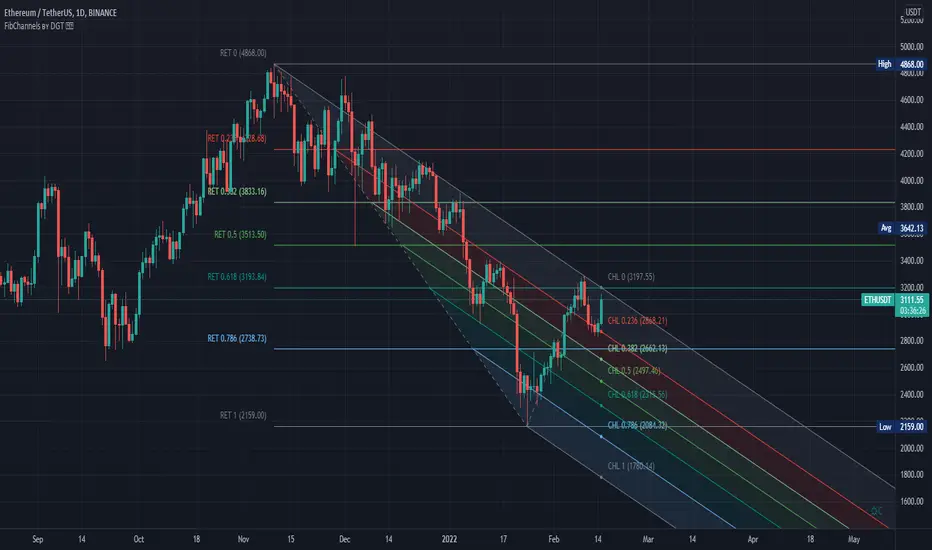
Auto Fib Channels by DGTThe Fibonacci Channel is a technical analysis tool that is used to estimate support and resistance levels based on the Fibonacci numbers. It is a variation of the Fibonacci retracement tool, except with the channel the lines run diagonally rather than horizontally.
This study will automatically place the channels where the levels indicate future areas of support and resistance
For further details please refer to education post
Nobody appears to know whether Fibonacci tools work because markets exhibit some form of natural pattern or because many investors use Fibonacci ratios to predict price movements, making them a self-fulfilling prophecy.
█ Study OPTIONS
Auto Fibonacci Channels , the main aim of the study
- Pivot threshold can be adjusted via “Deviation” and “Depth” input options
- Historical Channels / Retracements option will allow plotting of Channels on previous pivot high/lows
- Ability to set ALERTs for the Channel Levels
- Channel Labels displays the price of the line at the last bar, the price value will be updated in each new bar
Auto Fib Retracement – This is the build-in study of TradingView, customized to be in-line with Fibonacci Channels
- Pivot threshold can be adjusted via “Deviation” and “Depth” input options
- Historical Channels / Retracements option will allow plotting of Retracements on previous pivot high/lows
- Ability to set ALERTs for the Retracement Levels
Zig Zag – Derived from build-in Auto Fib Retracement with some customization options.
Disclaimer :
Trading success is all about following your trading strategy and the indicators should fit within your trading strategy, and not to be traded upon solely
The script is for informational and educational purposes only. Use of the script does not constitute professional and/or financial advice. You alone have the sole responsibility of evaluating the script output and risks associated with the use of the script. In exchange for using the script, you agree not to hold dgtrd TradingView user liable for any possible claim for damages arising from any decision you make based on use of the script
Support and Resistance Levels [racer8]One of the oldest concepts in trading. It's here guys. Drum roll please. Support & resistance baby! 🤣
So many requests from so many people asking me to build this. Finally. It is here guys 😀 Support and Resistance is here by racer8!
Indeed, S&R is used by so many traders. It is often one of the first concepts a trader will learn. I myself, can attest to this.
So what is support and resistance? 🤔
Good question, S&R are certain price levels that are created when a peak or trough has formed. Many traders use these peaks/troughs and extend lines out from them to create support & resistance levels.
Support levels are extended out from troughs. Resistance levels from peaks.
It is often believed that price bounces between these levels due to some unknown mysterious force known as supply and demand. 🙀
If you're a reversal trader, your strategy would likely be trying to short whenever price reaches a resistance level and vice versa for support levels.
If you're a trend trader, your strategy would likely be trying to go long whenever price breaks a resistance level and vice versa for support levels.
This Indicator...
Has one setting that controls which levels are formed. Higher settings equals less levels formed, but more important ones. Don't set it too high or too low. There is an optimal setting. Setting it too high will result in very few levels and thus, too little opportunities to trade. Setting it too low means the indicator will give you insignificant levels..also bad idea. So try to find something optimal like 10 to 20 periods for instance. 👍
Enjoy and have a blast!😀
Peace, I'm out! 🙏 💥
Rectangular ATR LevelsHelpful in forming Support resistance Judgements
Rectangular ATR Levels
is calculated using multipliers of the ATR value at the Previous Day's Close and plotting them on current day price movements as levels
Enjoy!
Beacon - Anthony Crudele's IndicatorBeacon uses the current volatility of the market based on your trading time frame to determine support and resistance levels, whether a trend is intact or ready to revert back in the range. One of the most difficult things I went through as a trader was determining whether we are in a trend day or if we are in grind up or grind down mode. I created Beacon to give me a simple look at the market to determine what type of environment we are in. I use Bollinger Bands (3 standard deviation) to determine the volatility cycle. Once the BB make peaks I took my Fibonacci Retracement tool and did a retracement from the peak high of the BB to the peak low. I use 70%, 50% and 30% for my support and resistance levels. I use those levels because I tested pretty much every percent level and those percentages averaged the highest performance on all tick charts and time charts. You can use Beacon on whatever time frame or tick chart you are trading on and it will determine that specific volatility cycle.

Vc trend analysisCan be used to find the direction of a trend
Determination of support and resistance levels
In combination, it can assess the short and long term
Main functions
Trend Short Perspective - Shows the trend at short distances.
Main Market Trend - Reflects the main market trend, can be used as a signal.
Intermediate Moving Average - Typically the last support line in an uptrend
The buyback zone is a basic and strong support level
Swing - displays the long-term direction. Also used as a deeper retracement level

RK's 13 - Moving Average with Fibonacci Lines█ OVERVIEW
After some chart measures, I noticed that if we took the difference between fast and slow Moving Average lines and apply the Fibonacci ratios, we get a very reliable support and resistance level for each bar.
So, I made this script to help me (and anyone who wants to use it) know where we should close or put stops in our orders.
█ HOW TO USE IT:
Choose your preferred Moving Average type and Lengths;
Select the Fibonacci Ratios and test Reverse Lines option to get better levels.
Other useful input options:
Show Labels: Display every Fibonacci Ratio you are using;
Labels Offset Position: Place where the Fibonacci Ratio will appear and get the price in that position;
Project Moving Average Lines in the Future: Draws project Line in the chart.
Tips:
• If you put your mouse in the ratio label, it will show the price in that position
• This script works better when the lines are well apart.

Savanner Level IndexFinds Price Support Based on last 20 Bar Low, 40 Bar low, and 80 Bar low, and calculated using 1x 80 bar low, 0.5x 40 bar low, and 0.2x of the 20 bar low. Feel free to check out the script!
How to use: Add to your chart, drag the indictor to the main chart, then merge both scales on the right!

gold price levels denominated in usd/gramsPlots the gold price (USD) for the quantities (grams) identified as support or resistance in the indicator settings. Default values are:
75 gold grams
300 gold grams
500 gold grams
1000 gold grams
5000 gold grams
More context: The purchasing power of Bitcoin

Cosmic BB SRThis script is based on Bollinger Bands/Bandwidth data and displays support and resistance levels (thick horizontal lines), the direction/volatility of the levels (thin dynamic lines), and the testing of the levels (cross markers).

Resistances v2[UO] - Uncluttered DisplayThis script shows support-and-resistance levels that span months and weeks.
It also shows the levels in the last 100 bars in higher detail. Details detection is only applied to last 100 bars so that your chart is not cluttered with infinite horizontal lines. 100 can be changed in the settings.
For example, here, you see the levels in small time frames at a different detail level:
This script uses the arrays introduced in pine script v4