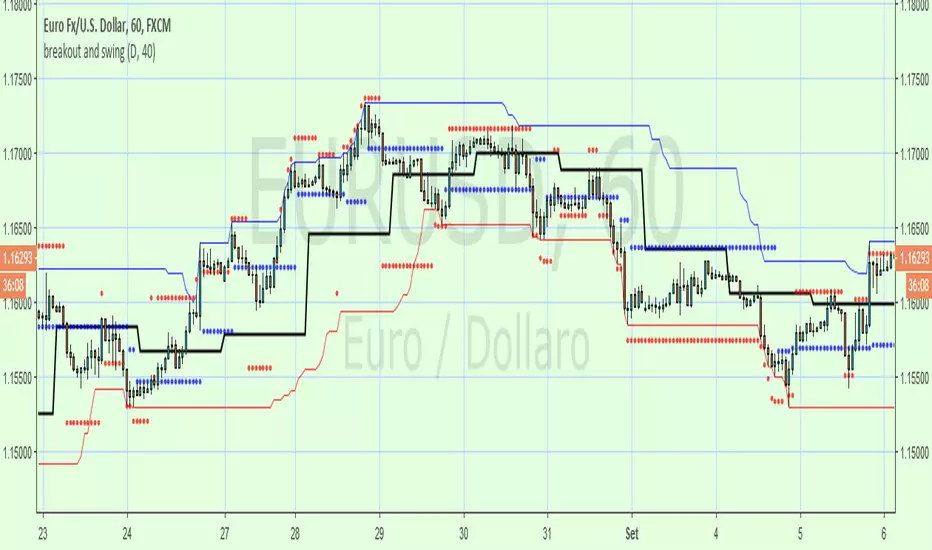
breakout and swingA Price Action system that use swing point and breakout
above the black line (breakout) is long, below short
swing/support/resistance points (blue circles) are displayed after a top or botton, breaking it means an inversion
red circles try to guest a target after a top/bottom or after a swing break.
the main trend is made by the black line that is set on Day period suitable for 1h to 15m time frame , for small TF you can set a smaller period from setting command
By default a set a 40 period channel high/low (the highest and lowest 40 bar back) that is ok for 1 h or smaller tf , but look to long for daily tf, adjust it yourself
Cari dalam skrip untuk "support"
Modified Point of ControlThis script finds the candle with the highest volume per an adjustable lookback. It can be used to help determine support and resistance.

CryptoShadows V1The first Diagonal Support and Resistance indicator. Best for bitcoin and cryptocurrencies

SMMA Analyses - Buy / Sell signals and close position signals This script combines the usage of the SMMA indicator in order to provide signals for opening and closing trades, either buy or sell signals.
It uses two SMMA , a fast and a slow one, both configurable by the users.
The trigger of Buy and Sell Signals are calculated through the SMMA crosses:
Buy Signals : The fast SMMA crosses over the slow SMMA . They are highlighting by a green area and a "B" label.
Sell Signals : The fast SMMA crosses under the slow SMMA . They are highlighting by a red area and a "S" label
The trigger of Close Buy and Close Sell Signals are calculated through the close price crosses with the fast SMMA:
Close Buy Signals : The fast SMMA crosses under the close price and at the same time the trend is bullish , so the fast SMMA is greater than the slow SMMA . They are highlighted by a lighter green area
Close Sell Signals : The fast SMMA crosses over the close price and at the same time the trend is bearish , so the fast SMMA is lower than the slow SMMA . They are highlighted by a lighter red area
Few important points about the indicator and the produced signals :
This is not intended to be a strategy, but an indicator for analyzing the SMMA conditions. It gives you the triggers depending on the real time analysis of the SMMA and prices, but not being a proper strategy, pay attention about "fake signals" and add always a visual analysis to the provided signals
Following this indicator, the trade positions should be opened only when a cross happens. Either in this case, analyse the chart in order to see if the signals are a "weak" ones, due to "waves" around the SMMA . In these cases, you might wait for the next confirmation signals after the waves, when the trend will be better defined
The close trade signals are provided in order to help to understand when you should close the buy or sell trades. Even in this case, always add a visual analysis to the signals, and pay attention to the support/resistance areas. Sometimes, you can have the close signals in correspondence to support/resistance areas: in these cases wait for the definition of the trend and eventually for the next close trade signals if they will be better defined

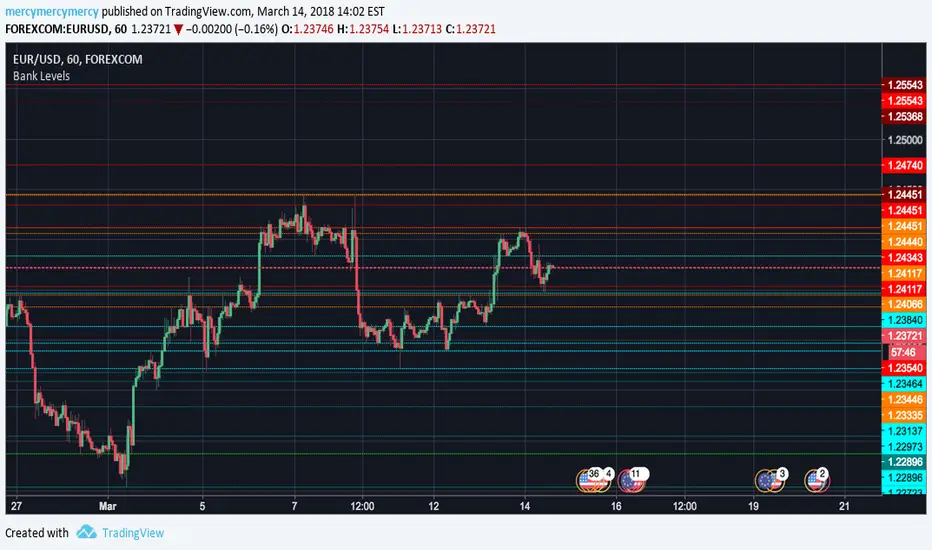
Bank Levels, 6 Previous, D W MIf you trade Forex this is the indicator you need above all. Most recent six highs and lows on the daily, weekly, and monthly (includes current day). Support and resistance isn't quite what it is...until when that's exactly how it often plays out on the lines. They are called bank levels for a reason. *Not every line will support or resist of course*
Bill Williams. Alligator, Fractals & Res/Sup combined (by vlkvr)Bill Williams indicators (each separately) are simple and quite self-sufficient, however, are most often used together. The key ones (Alligator and Fractals) are freely available and everyone can use them, but why use them on the chart separately, when "together more fun", and not conceivable, in my opinion, they are one without the other.
So, I present "split/copypasta" of two key indicators of Bill Williams, plus (as a bonus) visualization of "Support/Resistance" levels (and in fact, lines from extremes or the same fractals).
As a result, before you indicator "three-in-one".

4 Exponential Moving Averages + One Extra for 1D Charts4 Exponential Moving Averages + One Extra for 1D Charts
I use 4 EMAs for my 1 hour and 4 hours Chart.
Additionally for 1D Charts, sometime i need to use 9 EMA. Now is in place. Enjoy it!
I used them only for support my analisys based on Elliot Waves and Fibonacci projections and Retracements, which are my main strategy.

MavilimWThis Indicator plots smoothed weighted moving average combinations of various Fibonacci numbers
a great support and resistance for long term trading and confirmation

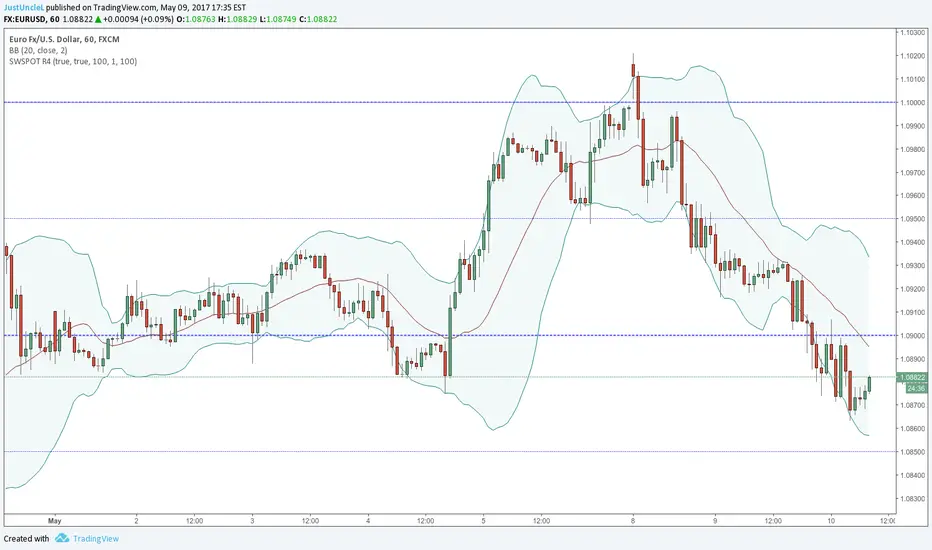
Sweetspot Gold R4-22 - by JustUncleLThis upgrade I have attempted to improve the Automatic levels calculation and better automatic levels selections. It should now work better with exotic currencies, indices, commodities, and stocks.
The indicator plots the so called "round price levels" or "00" levels, which end on 00 and 50: for example, 1.4000, 1.4400, 1.4450. It automatically calculates the levels for based on your charts time frame. Alternatively you can manually select main level size (in pips) and/or the number of sub-levels (0, 1, 2, 3, 9). Generally speaking, the program tries to keep to 3 Digit "00" rounding for currencies and non-stocks, and 2 Digit "00" rounding for Stocks.
Use this indicator as a guidance to a better mapping of Support/Resistance levels on the chart. Next time you draw Support/Resistance lines, if they coincide with round price levels, especially "00", you have got a excellent S/R level to work with!
Scalping PullBack Tool R1 by JustUncleLDescription
This study project is a Scalping Pullback trading Tool that incorporates the majority of the indicators needed to analyse and scalp Trends for Pull Backs and reversals on 1min, 5min or 15min charts. The set up utilies Heikin Ashi candle charts. Incorporated within this tool are the following indicators:
1. Major industry (Banks) recognised important EMAs in an EMA Ribbon:
Green = EMA89
Blue = EMA200
Black = EMA633
2. The 36EMA (default) High/Low+Close Price Action Channel (PAC).
3. Fractals
4. HH, LH, LL, HL finder to help with drawing Trend lines and mini Trend Lines.
5. Coloured coded Bar high lighting based on the PAC:
blue = bar closed above PAC
red = bar closed below PAC
gray = bar closed inside PAC
red line = EMA36 of bar close
Setup and hints:
Set the chart to Heikin Ashi Candles.
Add "Sweetspot Gold10" indicator to the chart as well to help with support and resistance finding and shows where the important "00" and "0" lines are.
When price is above the PAC(blue bars) we are only looking to buy as price comes back to the PAC
When price is below the PAC(red bars), we are only looking to sell when price comes back to the PAC
What we’re looking for when price comes back into the PAC we draw mini Trendlines utilising the Fractals and HH/LL points to guide your TL drawing.
Now look for the trend to pull back and break the drawn TL. That's is when we place the scalp trade.
So we are looking for continuation signals in terms of a strong, momentum driven pullbacks (normally short term 10-20 pips) of the EMA36.
The other EMAs are there to check for other Pullbacks when EMA36 is broken.
Other than the SweetSpot Gold10 indicator, you should not need any other indicator to scalp the pullbacks.
References:
Fractals V8 by RicardoSantos
Price Action Trading System v0.3 by JustUncleL
SweetSpot Gold10 R1 by JustUncleL
www.swing-trade-stocks.com
www.forexstrategiesresources.com

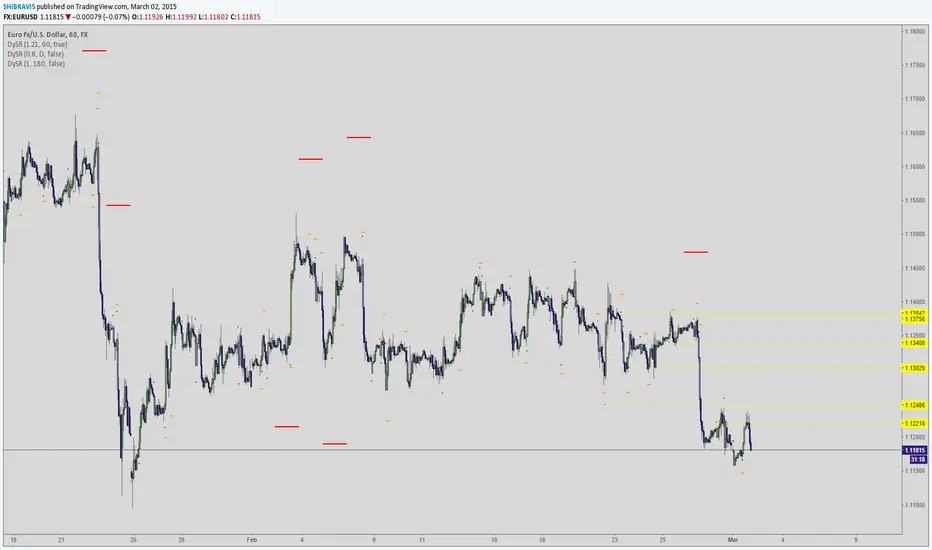
Auto-Support v 0.2Same script as the previous version with a slight twist
Have added (lines) "Transparency" to the settings to avoid having to edit every line individually ...
Cheers
CD_Average Daily Range Zones- highs and lows of the dayUses daily average ranges of 5 and 10 (most used) as buy (support) and highs (resistance) areas - half ranges used in calculations for a more accurate "forecast" of the H and L . Uses open but not close, so it does not repaint - experimental

ET-ATR-Price-OverlayOverlays the Average True Range high/low over Price. Shifts between support and resistance levels (based on ATR-21) according to price trend and breaks.
Average true range: en.wikipedia.org
@EmpoweredTrader

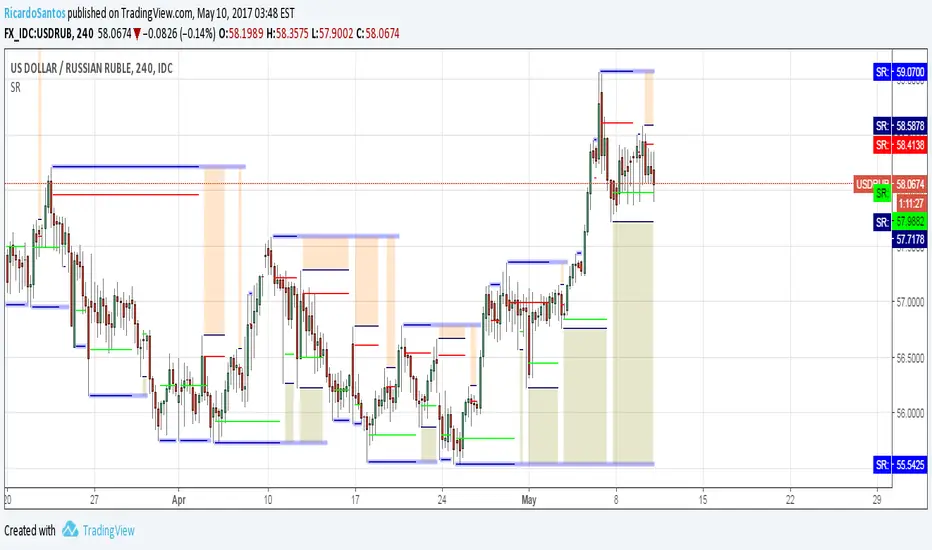
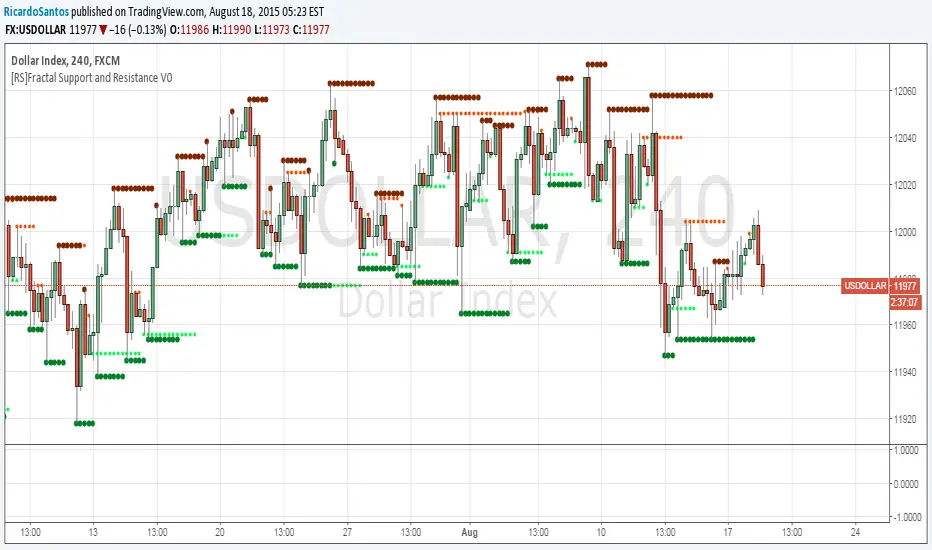
[RS]Fractal Support and Resistance V0Fractal based SR levels:
lime and red are hidden levels based on "/\" lows and "\/" highs.
green and maroon are based on regular fracals "\/" lows and "/\" highs.
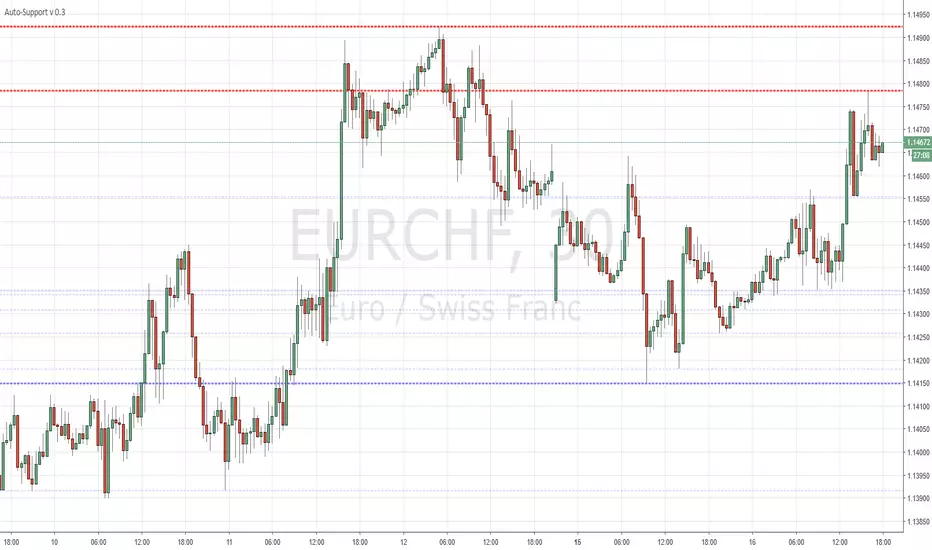
Dynamic SUPRES Multi Timeframe UpdateDynamic SUPRES can be interpreted in different ways. Each square marks an area of congestion that could serve as support and resistance.
FLASH UPDATE: Now is possible to choose the timeframe and the bars color on/off.
Dynamic SUPRESDynamic SUPRES can be interpreted in different ways. Each square marks an area of congestion that could serve as support and resistance.

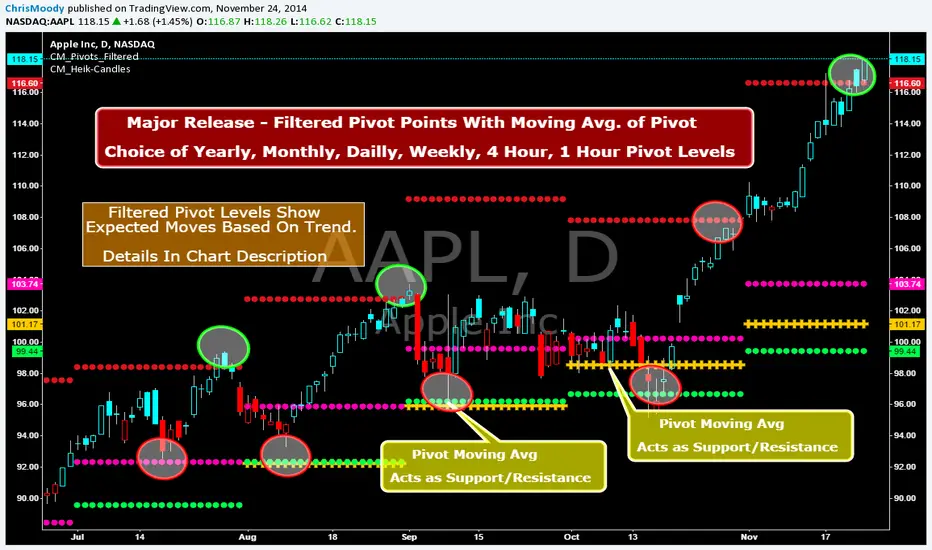
CM_Pivot Points_M-W-D-4H-1H_FilteredFamous Filtered Pivots Indicator -Many TimeFrames Available
CM_Pivot Points_M-W-D-4H-1H_Filtered
***Special Thanks to TheLark...AKA...The Coding Genius For Providing His Expertise...
***New Feature - Ability to turn On/Off Pivot Moving Average
***New Feature - Ability to turn On/Off Filtered Pivots (Explained Below)
Available Timeframes (Change In Inputs Tab):
1 Hour
4 Hour
Daily
Weekly
Monthly
Yearly
***All Features Available in Inputs Tab
-Ability to Plot just 1, or all Pivot Timeframes
-Defaults to Monthly Pivots
-Ability to turn On/Off Pivot Moving Average
-Ability to turn On/Off Filtered Pivots
-Ability to Plot S3 and R3 on 1 Hour and 4 Hour Pivots
***FILTERED PIVOTS!!!
-THIS IS A WAY TO FIND THE HIGHEST PROBABILITY MOVES
-IF CURRENT PIVOT IS GREATER THAN PREVIOUS PIVOT (INCLUDING MARKET THRESHOLD CALCULATION) THEN PIVOT, S1, & R2 PLOT
-IF CURRENT PIVOT IS LESS THAN PREVIOUS PIVOT (INCLUDING MARKET THRESHOLD CALCULATION) THEN PIVOT, S2, & R1 PLOT
-***THIS IS A WAY TO FILTER OUT PIVOTS AND ONLY PLOT THE LEVELS THAT ARE EXPECTED TO BE MAJOR SUPPORT AND RESISTANCE
***VIDEO COMING SOON WHERE i WILL GO OVER IN DETAIL THE THOUGHT PROCESS AND METHODOLOGY
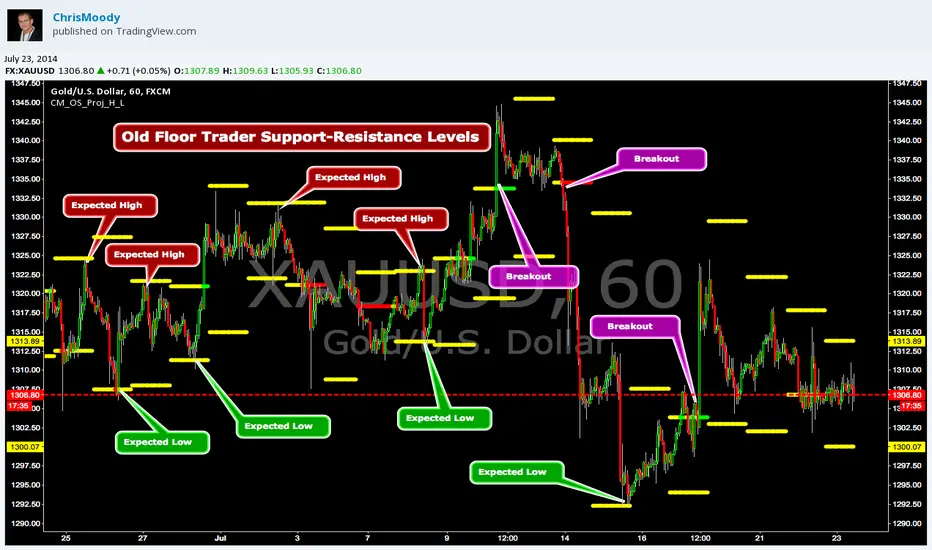
CM_OldSchool_Projected_high_LowHeard this story from Larry Williams…the trader who holds the record for winning the U.S. Trading Championship by turning $10K in to 2 Million.
A trader named Owen Taylor developed this formula as a Floor Trader before to calculate the Projected High and Low of the next day.
The formula worked so well…Owen charged other Traders 1K to get it.
I was pretty impressed with the results…so I coded it for the Weekly, Monthly, Quarterly, and Yearly Projected High Low.
While Owen considered these levels to be major support and resistance, Larry has developed many strategies based on the Breakout of the Projected High Low.
Therefore I coded it so the Levels would plot Yellow, and change to Green if the Projected High was taken out, and Red if the Projected Low was taken out.
***I’ve noticed on many instruments, Stocks, Index’s, Forex etc., depending on the instrument it works great as Support/Resistance or Breakouts.
***On a Daily Chart put the Quarterly and Yearly levels on SPY and EURUSD and go back about 10 years. Levels are pretty accurate.
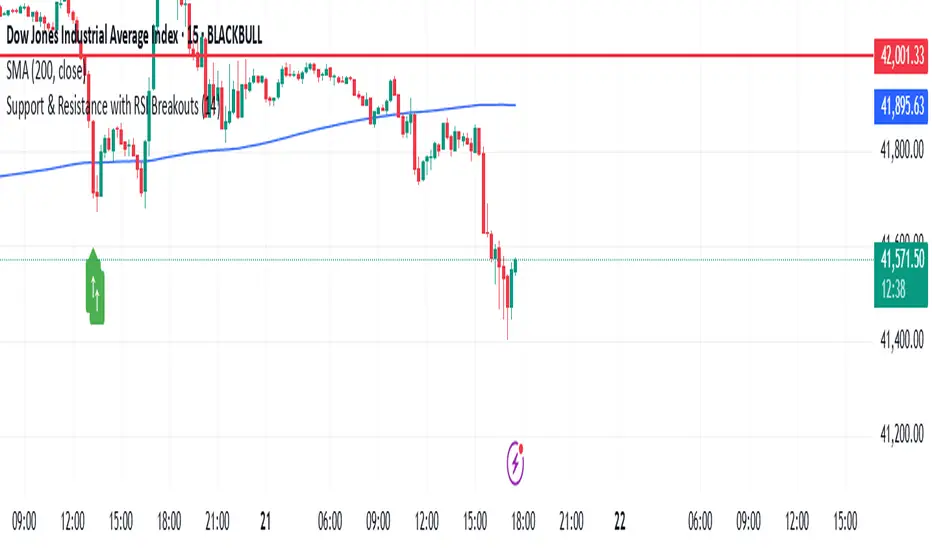
Support & Resistance with RSI BreakoutsThe script is a TradingView Pine Script (v5) indicator that identifies support and resistance levels using RSI (Relative Strength Index) breakouts. Here’s a breakdown of what it does:
Features:
RSI Calculation:
The script calculates the 14-period RSI (default) using the closing price.
The user can modify the RSI period through an input setting.
Buy and Sell Signals:
A buy signal is triggered when RSI drops below 20 (indicating oversold conditions).
A sell signal is triggered when RSI rises above 80 (indicating overbought conditions).
Visual Representation:
Buy signals are marked with a green upward arrow (↑) below the price bars.
Sell signals are marked with a red downward arrow (↓) above the price bars.
The arrows help traders easily spot potential trade opportunities.
Usage:
This script is useful for traders looking to buy at oversold conditions and sell at overbought conditions based on RSI.
It works best when combined with other indicators or price action strategies to confirm signals.
Support/Resistance
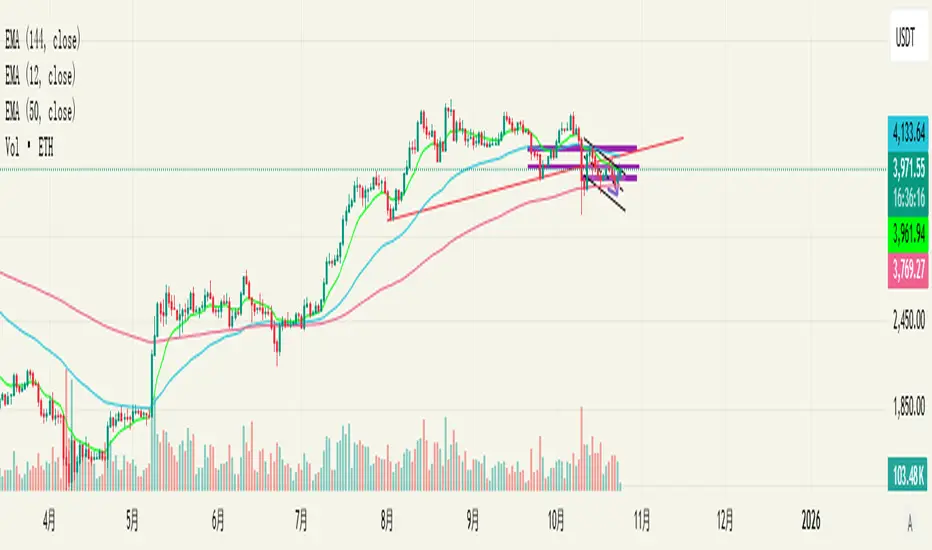
Custom Moving Average Indicator with MACD, RSI, and Support/Resistance
This indicator is designed to help traders make informed trading decisions by integrating several technical indicators, including moving averages, the Relative Strength Index (RSI), and the Moving Average Convergence Divergence (MACD).
Key Features:
Moving Averages:
This indicator uses simple moving averages (SMAs) for several periods (4, 18, 66, 89, 632, 1000, 1500, 2000, and 3000 bars). This helps to identify the overall trend of the price and potential support and resistance levels.
The color of each moving average line is dynamically changed based on the closing price's position relative to the average; it turns red if the price is above the average and green if the price is below.
Relative Strength Index (RSI):
The RSI is calculated for a 14-bar period, which is a measure of overbought or oversold conditions.
An RSI value above 70 indicates an overbought condition, while a value below 30 indicates an oversold condition.
MACD:
The MACD is calculated using a fast length of 12, a slow length of 26, and a signal length of 9. Crossovers between the MACD line and the signal line indicate momentum shifts.
A crossover of the MACD line above the signal line suggests a potential buy signal, while a crossover below indicates a potential sell signal.
Buy and Sell Signals:
Buy Signal: Triggered when the MACD line crosses above the signal line, the RSI is below 30, the MACD is above 0, and there is high volume.
Sell Signal: Triggered when the MACD line crosses below the signal line, the RSI is above 70, the MACD is below 0, and there is high volume.
Alerts:
The indicator includes alerts that are triggered when buy and sell signals occur, helping traders respond quickly to market opportunities.
How to Trade Using the Indicator (continued):
Trading on Buy Signals:
Look for buy signals when the MACD line crosses above the signal line. Ensure that the RSI is below 30, indicating there is a potential for price recovery from an oversold condition.
Confirm that the volume is above the average, which indicates strong market participation and adds validity to the trade.
Trading on Sell Signals:
Search for sell signals when the MACD line crosses below the signal line. Check that the RSI is above 70 to confirm an overbought condition, implying the price may decline.
As with buy signals, ensure that volume is high to validate the strength of the sell signal.
Risk Management:
Use stop-loss orders to protect your capital. Establish an initial loss threshold based on your risk management strategy.
Continuously monitor the market and new signals and adjust your approach according to your market analysis.
Conclusion:
This combined indicator helps traders make informed decisions by relying on a set of technical tools. To achieve the best results, ensure you integrate the analysis from these indicators with your trading strategies and other techniques.
Feel free to use this explanation as an introduction or guide to inform traders on how to effectively use the indicator. If you have any more questions or need further details, don't hesitate to ask!

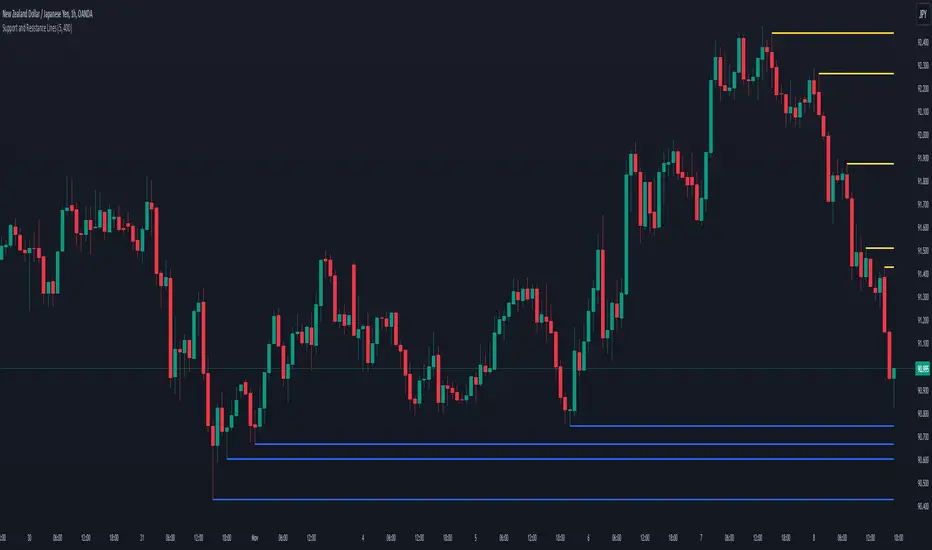
Support and Resistance LinesDraw the last 5 support and resistance lines. It works on the current timeframe. You can adjust the sensibility by changing the diff variable.