Periodic Linear Regressions [LuxAlgo]The Periodic Linear Regressions (PLR) indicator calculates linear regressions periodically (similar to the VWAP indicator) based on a user-set period (anchor).
This allows for estimating underlying trends in the price, as well as providing potential supports/resistances.
🔶 USAGE
The Periodic Linear Regressions indicator calculates a linear regression over a user-selected interval determined from the selected "Anchor Period".
The PLR can be visualized as a regular linear regression (Static), with a fit readjusting for new data points until the end of the selected period, or as a moving average (Rolling), with new values obtained from the last point of a linear regression fitted over the calculation interval. While the static method line is prone to repainting, it has value since it can further emphasize the linearity of an underlying trend, as well as suggest future trend directions by extrapolating the fit.
Extremities are included in the indicator, these are obtained from the root mean squared error (RMSE) between the price and calculated linear regression. The Multiple setting allows the users to control how far each extremity is from the other.
Periodic Linear Regressions can be helpful in finding support/resistance areas or even opportunities when ranging in a channel.
The anchor - where a new period starts - can be shown (in this case in the top right corner).
The shown bands can be visualized by enabling Show Extremities in settings ( Rolling or Static method).
The script includes a background gradient color option for the bands, which only applies when using the Rolling method.
The indicator colors can be suggestive of the detected trend and are determined as follows:
Method Rolling: a gradient color between red and green indicates the trend; more green if the output is rising, suggesting an uptrend, and more red if it is decreasing, suggesting a downtrend.
Method Static: green if the slope of the line is positive, suggesting an uptrend, red if negative, suggesting a downtrend.
🔶 DETAILS
🔹 Anchor Type
When the Anchor Type is set to Periodic , the indicator will be reset when the "Anchor Period" changes, after which calculations will start again.
An anchored rolling line set at First Bar won't reset at a new session; it will continue calculating the linear regression from the first bar to the last; in other words, every bar is included in the calculation. This can be useful to detect potential long-term tops/bottoms.
Note that a linear regression needs at least two values for its calculation, which explains why you won't see a static line at the first bar of the session. The rolling linear regression will only show from the 3rd bar of the session since it also needs a previous value.
🔹 Rolling/Static
When Anchor Type is set at Periodic , a linear regression is calculated between the first bar of the chosen session and the current bar, aiming to find the line that best fits the dataset.
The example above shows the lines drawn during the session. The offered script, though, shows the last calculated point connected to the previous point when the Rolling method is chosen, while the Static method shows the latest line.
Note that linear regression needs at least two values, which explains why you won't see a static line at the first bar of the session. The rolling line will only show from the 3rd bar of the session since it also needs a previous value.
🔶 SETTINGS
Method: Indicator method used, with options: "Static" (straight line) / "Rolling" (rolling linear regression).
Anchor Type: "Periodic / First Bar" (the latter works only when "Method" is set to "Rolling").
Anchor Period: Only applicable when "Anchor Type" is set at "Periodic".
Source: open, high, low, close, ...
Multiple: Alters the width of the bands when "Show Extremities" is enabled.
Show Extremities: Display one upper and one lower extremity.
🔹 Color Settings
Mono Color: color when "Bicolor" is disabled
Bicolor: Toggle on/off + Colors
Gradient: Background color when "Show extremities" is enabled + level of gradient
🔹 Dashboard
Show Dashboard
Location of dashboard
Text size
Cari dalam skrip untuk "support"

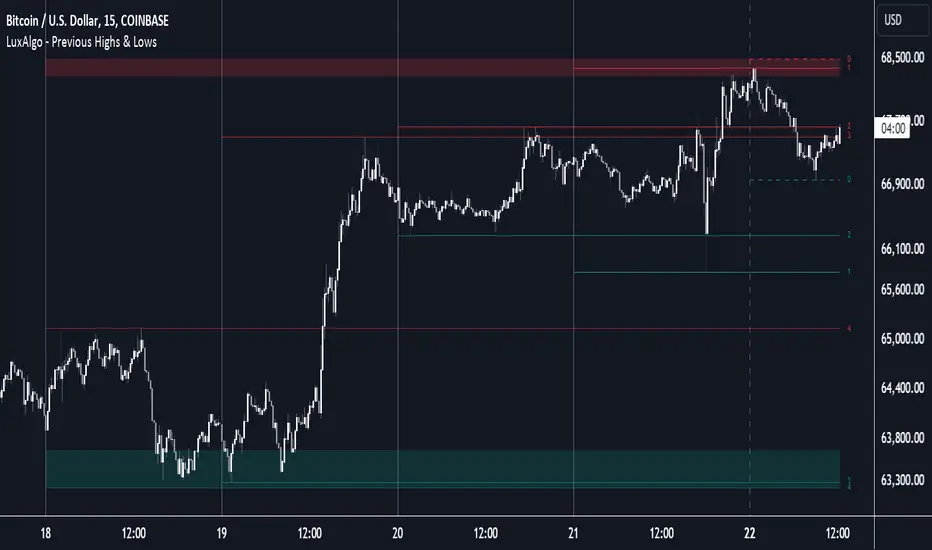
Previous Highs & Lows [LuxAlgo]The Previous Highs & Lows indicator highlights a user-set amount of previous maximum/minimum prices made within specific intervals, these are displayed as levels customizable levels.
Additionally, one upper and lower zone constructed from the previously displayed highs/lows is included, providing support/resistance areas.
🔶 USAGE
Previous highs/lows are often perceived as key trading levels with the potential of generating multiple reactions upon being reached.
While the daily interval is more commonly used, users can use different intervals, with the indicator supporting hourly, daily, weekly, monthly, and yearly intervals. Using higher intervals on low timeframes can return more distant levels relative to the most recent price, which might not be relevant.
Each level is numbered, with more recent previous highs/lows having a lower number associated with them, users can also highlight more recent levels through a transparency gradient.
Users can control the amount of previous highs/lows displayed using the "Show Last" settings, with a higher value providing more potential support/resistance. Returned previous highs/lows can eventually be filtered out based on their position by enabling the "Filter Based On Position" setting, only keeping previous highs above the current closing price and previous lows below the current closing price, giving more relevant levels as a result.
🔹 Previous High/Low Areas
The indicator includes two areas constructed from the respective percentiles of the returned previous highs/lows. These can be useful as more general support/resistance areas.
Wider areas are often indicative of a group of previous highs or lows being more dispersed, resulting in areas that are easier to reach. Wider areas can also be obtained by increasing the "Areas Width" setting.
Note: Areas will only be displayed if "Show Last" is greater than 1
🔶 SETTINGS
Show Last: Determines the amount of more recent previous highs and previous low levels displayed by the indicator.
Interval: Interval used to capture maximum/minimum price values,
Areas Width: Width of the displayed top/bottom areas, with higher values returning wider areas.
Filter Based On Position: When enabled only display previous highs above the current closing price and previous lows below the current closing price.
🔹 Style
Minimum Gradient Transparency: Minimum transparency value applied to the colors of the oldest displayed previous highs/lows levels.
Pivot Point Profile [LuxAlgo]The Pivot Point Profile indicator groups and displays data accumulated from previous pivot points, providing a comprehensive method for prioritizing and displaying areas of interest directly given by swing highs and lows.
Users have access to common settings present in other profile-type indicators.
🔶 USAGE
The Pivot Point Profile is particularly helpful in identifying highly active reversal zones that have been visited multiple times by price. Because of this, we could generally expect these areas to serve as future points of interest, often acting as support or resistance when re-visited.
The profile displays data associated with both Pivot Highs and Pivot Lows. Each row consists of pivot high and pivot low counts side-by-side, forming the total width of the row.
By analyzing the row as a whole, we can gain a better understanding of WHERE to look for interactions.
By analyzing the pivot counts independently, we can gain a better understanding of WHAT to expect when returning to these areas.
For example:
If a row in the profile contains entirely Pivot Lows, this could be seen as an indication to look for buyers to hold that level for a continuation upwards. A break of this level could be interpreted as a lack of interest from previous buyers at this level, indicating a further move down.
🔹 Concentrated Areas
Each row in the profile displays the current count of high pivots and low pivots within the selected lookback. The largest count for each pivot direction is identified as a "Concentrated Area (CA)", these CAs are highlighted over the chart with a line displaying the average of all pivots within that CA. The CA Average is the average of all pivot points (in the majority direction) within the given row.
These can hold more importance as potential support/resistance areas.
Note: The CA Threshold can be manually adjusted to highlight all rows based on a user-selected value.
🔶 DETAILS
🔹 Calculation
The idea behind the Pivot Point Profile is a new analysis method for pivot points, taking the idea of a volume profile and adapting it to display pivot points instead of volume. By using this data, in theory, we should be able to better prioritize zones to anticipate reversals, as well as identify key levels to watch for buyer & seller interactions to use as confirmations in direction.
The (vertical) width of each row is the product of the script's "Row Size", this is the number of rows that the profile will consist of. With a max of 250, the profile can be decently granular. That being said, A more granular profile will have fewer overlapping pivot points. By decreasing the row size (Using fewer rows in the profile) you will increase the tolerance for grouping pivot points. Potentially leading to a more comprehensive Profile. Inversely, By reducing the tolerance for grouping, you will better visualize only similar highs and lows but may have noisier data to sift through.
The Profile is calculated based on a "Lookback" parameter, using only the lookback amount of previous high and low pivots to calculate the profile. Configuring this parameter alongside "Pivot Length", will allow for great control over the frame of reference of the profile.
Note: This indicator is capable of utilizing the full chart history of pivot points, this can be done by enabling the "Use Full Chart History" setting, this will cause the script will calculate from everything it has access to on your current chart.
🔹 Display
The Pivot Point Profile display can be customized to fit a various range of chart styles and visual needs. The specific settings to adjust these can be located in the "Profile Display" Section of the User Inputs.
Profile Width: Sets the Left to Right Width of the Profile. This is the maximum width that the profile will occupy and will scale to fit within this width.
Profile Offset: Sets the distance of the Profile's Axis from the current chart candle. This moves the entire profile left and right to enable to user to set the distance between the profile and the current candle.
Direction: Changes the display direction of the profile, allowing for "Left", "Right", or "Center" display styles.
🔶 SETTINGS
🔹 Pivot Point Parameters
Pivot Type: Choose between "Fractal Pivots" or "SMC Structure" to use as the basis for pivots.
Length: Sets the length for the pivot calculations.
🔹 Profile Calculations Parameters
Lookback: Sets the number of pivots to calculate within, in increments of high and low pairs. (Setting this to 1 = 1 Pivot High & 1 Pivot Low)
Use Full Chart History: Disregards the set lookback and instead uses all available chart data to calculate from.
Row Size: Sets the total number of rows to calculate the profile with.
🔹 Profile Display
Profile Width: Sets the max left & right width (in bars) that the profile will occupy.
Profile Offset: Sets the distance of the profile axis from the last chart bar.
Direction: Sets the display direction
🔹 Concentrated Areas
Highlight CAs: Extends the rows left from concentrated areas.
CA Threshold: Manually set the threshold for determining concentrated areas, when disabled, only the largest rows will be displayed.
CA Averages: Toggles the concentrated area averages for each pivot direction.
Note: CA Averages can be displayed independently without CA Highlights being displayed, and vice versa.

Moving Average Bands with Signals [UAlgo]The "Moving Average Bands with Signals combines various moving average types with ATR-based bands to help traders identify potential support and resistance levels.
It plots moving average bands with upper and lower support/resistance levels based on the Average True Range (ATR) and user-defined settings.Additionally, the script generates buy/sell signals based on price crossing above or below the bands.
🔶 Key Features
Multiple Moving Average Types:
Supports various moving average calculations including Arnaud Legoux Moving Average (ALMA), Exponential Moving Average (EMA), Double Exponential Moving Average (DEMA), Triple Exponential Moving Average (TEMA), Kaufman Adaptive Moving Average (KAMA), Hull Moving Average (HMA), Least Squares Moving Average (LSMA), Simple Moving Average (SMA), Triangular Moving Average (TMA), Volume-Weighted Moving Average (VWMA), Weighted Moving Average (WMA), and Zero-Lag Moving Average (ZLMA).
Customizable ATR Bands:
Integrates the Average True Range (ATR) to calculate dynamic support and resistance bands around the moving average. The multiplier for the bands is user-adjustable, allowing for finer control over the sensitivity and width of the bands.
Signal Generation:
Provides visual signals on the chart when the price interacts with the support or resistance bands. Users can choose between using the wick or the close price to generate these signals, adding an extra layer of customization based on their trading style.
Flexible Input Parameters:
Allows users to input parameters for moving average length, ATR length, band multiplier, and signal type. Additional settings are available for specific moving average types, such as ALMA's offset and sigma, KAMA's fast and slow periods, and LSMA's offset.
🔶 Disclaimer
This script is provided for educational purposes only and should not be considered financial advice.
Trading financial instruments involves substantial risk and can result in significant financial losses.
The script’s performance in the past is not indicative of future results, and no guarantees are made regarding its accuracy, reliability, or performance.

Dynamic Order Blocks [LuxAlgo]The Dynamic Order Blocks indicator displays the most recent unmitigated bullish and bearish order blocks on the chart, providing dynamic support/resistance areas.
When price sweeps an order block, this is highlighted by the script indicating a potential reversal.
The average between the displayed order blocks is also displayed.
🔶 USAGE
Order blocks are a popular method of price action analysis, representing price areas where more significant market participants accumulate their orders.
Displaying order blocks dynamically allows obtaining relevant areas of support/resistance. Users can obtain longer-term order blocks using a higher "Swing Lookback" setting.
Users can also use mitigation events to assess the current trend direction, with price mitigating a bearish order block (breaking above the upper extremity) indicating an uptrend, and price mitigating a bullish order block (breaking below the lower extremity) indicating a downtrend.
🔹 Average Level
An average level obtained from the displayed bullish and bearish order blocks is included in the indicator and offers an additional polyvalent dynamic support/resistance level.
The change of direction of the average line can also be indicative of the current trend direction.
🔹 Dynamic Sweeps
Price sweeping the mitigation level of an order block is highlighted on the chart using bordered rectangles. These highlight a breakout failure and can be indicative of a potential reversal.
🔶 SETTINGS
Swing Lookback: Period of the swing detection used to construct order blocks. Higher values will return longer-term order blocks.
Use Candle Body: Use the candle body as the order block area instead of the candle full range.

Inversion Fair Value Gaps (IFVG) [LuxAlgo]The Inversion Fair Value Gaps (IFVG) indicator is based on the inversion FVG concept by ICT and provides support and resistance zones based on mitigated Fair Value Gaps (FVGs).
🔶 USAGE
Once mitigation of an FVG occurs, we detect the zone as an "Inverted FVG". This would now be looked upon for potential support or resistance.
Mitigation occurs when the price closes above or below the FVG area in the opposite direction of its bias.
Inverted Bullish FVGs Turn into Potential Zones of Resistance.
Inverted Bearish FVGs Turn into Potential Zones of Support.
After the FVG has been mitigated, returning an inversion FVG, a signal is displayed each time the price retests an IFVG zone and breaks below or above (depending on the direction of the FVG).
Keep in mind how IFVGs are calculated and displayed. Once price mitigates an IFVG, all associated graphical elements such as areas, lines, and signals will be deleted.
This indicator is not meant to be just a 'signal indicator'. Backtesting historical signals is incorrect as it does not consider the mitigation of IFVGs, which is a standard method for trading IFVGs & various concepts by ICT.
The signals displayed are meant for real-time analysis of current bars for discretionary analysis. Current confirmed retests of unmitigated IFVGs are still displayed to show which IFVGS have had significant reactions.
🔶 SETTINGS
Show Last: Specifies the number of most recent FVG Inversions to display in Bullish/Bearish pairs, starting at the current and looking back. Max 100 Pairs.
Signal Preference: Allows the user to choose to send signals based on the (Wicks) or (Close) Prices. This can be changed based on user preference.
ATR Multiplier: Filters FVGs based on ATR Width, The script will only detect Inversions that are greater than the ATR * ATR Width.
🔶 ALERTS
This script includes alert options for all signals.
🔹 Bearish Signal
A bearish signal occurs when the price returns to a bearish inversion zone and rejects to the downside.
🔹 Bullish Signal
A bullish signal occurs when the price returns to a bullish inversion zone and bounces out of the top.

Range Detector [LuxAlgo]The Range Detector indicator aims to detect and highlight intervals where prices are ranging. The extremities of the ranges are highlighted in real-time, with breakouts being indicated by the color changes of the extremities.
🔶 USAGE
Ranging prices are defined by a period of stationarity, that is where prices move within a specific range.
Detecting ranging markets is a common task performed manually by traders. Price breaking one of the extremities of a range can be indicative of a new trend, with an uptrend if price breaks the upper range extremity, and a downtrend if price breaks the lower range extremity.
Ranges are highlighted as zones and are set retrospectively, that is the starting point of a range is offset in the past. The exact moment a range is detected is highlighted by a gray background color. The average between the maximum/minimum of a zone is also highlighted as a dotted line and is also set retrospectively.
The range extremities are set in real-time, blue extremities indicate the range extremities were not broken, green extremities indicate that price broke the upper range extremity, while red extremities indicate price broke the lower range extremity.
Extremities are extended until a new range is detected, allowing past ranges extremities can be used as future support/resistances.
🔶 DETAILS
The detection algorithm used to detect ranges tests if all the prices within a user-set window are all within two extremities. These extremities are determined by the mean of the detection window plus/minus an ATR value.
When a new range is detected, the script checks if this new range overlaps with a previously detected range, if this is the case, both ranges are merged into one; updating the extremities of the previous range.
This can be observed with the real-time extremities changing within a highlighted zone.
🔶 SETTINGS
Minimum Range Length: Minimum amount of bars needed to detect a range.
Range Width: Multiplicative factor for the ATR used to detect new ranges. Lower values detect ranges with a lower width. Using higher values might return false positives.
ATR Length: ATR length used to determine the range width.

Histogram-based price zonesThis indicator provides a new approach to creating price zones that can be used as support and resistance. The approach does not use pivot points or Fibonacci levels. Instead, it uses the frequency of occurence of local maxima and minima to determine zones of interest where price often changed direction.
The algorithm is as follows:
- Gather price data from the last Lookback trading periods
- Calculate rolling minima and rolling maxima along the price points with window size Window size
- Build a histogram from the rolling extrema which are binned into different zones. The number of bins and therefore the width of a zone can be adjusted with the parameter Zone width factor
- Select only the top fullest bins. The number of bins selected for plotting can be controlled with Zone multiplier
The result are a number of boxes that appear on the chart which mark levels of interest to watch for. You can combine multiple instances of this indicator on different settings to find zones that are very relevant.
Shown as an example is the Nasdaq 100 futures ( NQ1! ) on the D timeframe with levels built from the last 100 periods with default settings. The boxes are the only output of the indicator, no signals are created.

Volumetric Toolkit [LuxAlgo]The Volumetric Toolkit is a complete and comprehensive set of tools that display price action-related analysis methods from volume data.
A total of 4 features are included within the toolkit. Symbols that do not include volume data will not be supported by the script.
🔶 USAGE
The volumetric toolkit puts a heavy focus on price action, returning support/resistance levels, ranges, volume divergences...etc.
The main premise between each feature is that volume has a direct relationship with market participants level of interest over a specific symbol, and that this interest is not constant over time.
Each individual feature is detailed below.
🔹 Ranges Of Interest
The Ranges Of Interest construct a range from a surge of high liquidity in the market. This range is constructed from the price high and price low of the candle with the associated significant liquidity.
The returned extremities can be used as support and resistance, with breakouts often being accompanied by significant liquidity as well, suggesting potential trend continuations.
The length setting associated with this feature determines how sensitive the range detection algorithm is to volume, with higher values requiring more significant volume in order to display a new range.
🔹 Impulses
Impulses highlight times when volume makes a new higher high while the price makes a new higher high or lower low, suggesting increased market participation.
When this occurs when the price makes a new higher high the impulse is considered bullish (green), if the price makes a new lower low the impulse is bearish (red).
Impulses occurring within an established trend opposite to it (e.g a bearish impulse on an uptrend) might be indicative of reversals.
The length setting works similarly to the previously described ranges of interest, with higher values requiring longer-term volume higher high and price higher high/lower low, highlighting more significant impulse and potentially longer-term reversals.
🔹 Levels Of Interest
Levels of interest display price levels of significant trading activity, contrary to the range of interest only the closing price is taken into account, also volume peaks are used to detect significant trading activity.
Note that this feature is subject to backpainting, that is lines are set retrospectively.
Users can determine the amount of most recent levels to display on the chart. These can be used as classical support/resistances.
🔹 Volume Divergence
We define volume divergence as a decreased market participation while a trend is still developing.
More precisely volume divergences are highlighted if volume makes a lower high while price is making a new higher high/lower low.
This can be indicative of a lack of further participation in the current trend, indicating a potential reversal.
Using higher length values will return longer-term divergences.
Note that this feature is subject to backpainting, that is lines are set retrospectively.
🔶 SETTINGS
🔹 Ranges Of Interest
Show Ranges Of Interest: Display Ranges Of Interest.
Length: Ranges Of Interest sensitivity to volume.
🔹 Impulses
Show Impulses: Display Ranges Of Interest.
Length: Impulses sensitivity to volume.
🔹 Levels Of Interest
Show: Determine if Levels Of Interest are displayed, and how many from the most recent.
Length: Level detection sensitivity to volume.
🔹 Volume Divergences
Show Divergences: Determine if Volume Divergences are displayed.
Length: Period for the detection of price tops/bottoms and volume peaks.

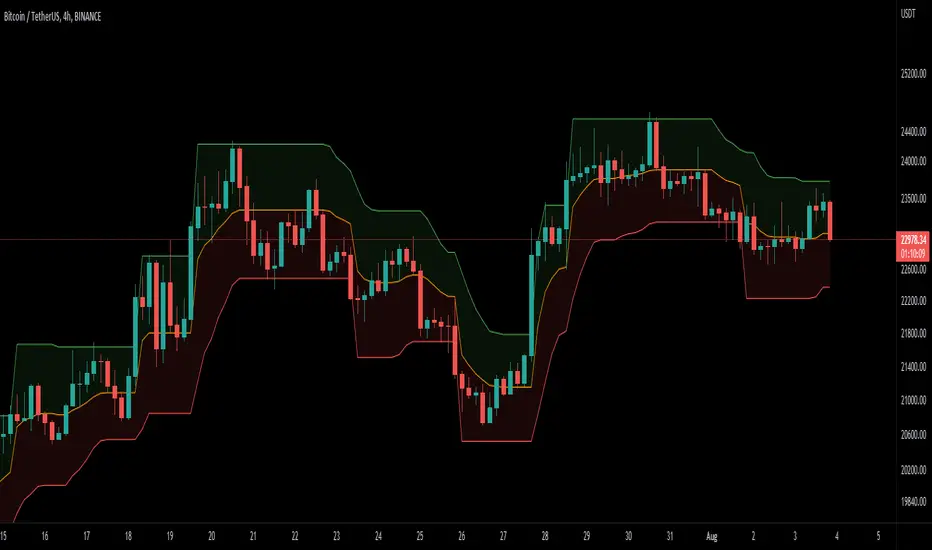
DEMA Supertrend Bands [Misu]█ Indicator based on DEMA (Double Exponential Moving Average) & Supertrend to show Bands .
DEMA attempts to remove the inherent lag associated with Moving Averages by placing more weight on recent values.
Supertrend aims to detect price trends, it's also used to set protective stops.
█ Usages:
Combining Dema to calculate Supertrend results in nice lower and upper bands.
This can be used to identify potential supports and resistances and set protective stops.
█ Parameters:
Length DEMA: Double Ema lenght used to calculate DEMA. Dema is used by Supertrend indicator.
Length Atr: Atr lenght used to calculate Atr. Atr is used by Supertrend indicator.
Band Mult: Used to calculate Supertrend Bands width.
█ Other Applications:
The mid band can be used to filter bad signals in the manner of a more classical Moving Average.
Multi Oscillators Price LevelsThis script draws price levels corresponding to the highest price reached in overbought situations, and the lowest price reached in oversold situations, depending on the oscillator and the timeframe the user has configured.
These levels correspond, most of time, to good supports and resistances prices.
Price levels drawings can be based on the following indicators:
Stochastic RSI (default)
Stochastic CCI
RSI
CCI
You can customize this indicator with the following options:
Source: The candle source to use in indicators calculation
Source Indicator: The indicator on which you cant to base your levels
Timeframe: The timeframe on which you want to apply the selected indicator, and calculate levels
Show supports/resistances: enable/disable price levels, depending on there status (overbought - resistances) / (oversold - supports)
Lines width: width of price levels. (set to 10 by default in order to draw "zones")
Supports/Resistances source: Select the candle data you cant to use to draw supports and resistances levels
Extend levels: Select the line extension for price levels
Levels color: Select the desired color for price levels
And of course , all parameters corresponding to the supported indicators (Stoch, RSI, CCI)
Here are a few examples of different configurations:
This script will probably be modified in the future, don't hesitate to suggest any improvement.

donchain support&resistance levels [LM]Hello Traders,
I would like to introduce you donchain support&resistance levels. The idea is to look for important levels that are identified by donchain line, where donchain usualy spents a lot of time without any move usualy turns out to be good level for bounces.
Also note that when there is a big spread between first line and second line it usually leads to some pullback.
Here you have an example of big spread:
You are also able to show donchain lines and not only horizontals this you can find in settings:
Enjoy!

Blockcircle FTR - Follow Through ReversalWHAT THIS INDICATOR DOES
Blockcircle FTR identifies failed directional moves followed by quality reversals. The indicator tracks structural pivot levels, monitors price interactions with those levels, and validates reversal sequences against a configurable threshold.
A trend filter provides macro context so you can evaluate whether signals align with or oppose the broader direction.
KEY FEATURES
Reversal quality filtering via delivery threshold requirement
Sweep confirmation when reversals follow liquidity grabs at structural levels
ATR-adaptive origin zones marking reversal starting points
Trend alignment indicator comparing signal bias to moving average direction
Volume validation filter for participation confirmation
Real-time dashboard with signal statistics and alignment status
DETAILED BREAKDOWN
Structural Level Tracking
The indicator identifies pivot highs and lows based on the Structure Lookback parameter. These pivots serve as reference levels where liquidity typically accumulates. Levels remain active until price interacts with them or they exceed the Level Lifespan setting.
When the price reaches a structural level, this interaction is logged. If a reversal then forms in the opposite direction within the Sweep Window, the signal qualifies as sweep-confirmed, indicating that stops were likely triggered before the move reversed.
FTR Detection Logic
The core detection looks for a specific sequence: a directional attempt that fails to follow through, followed by a counter-move that meets the Delivery Threshold ratio. This ratio measures the quality of the reversal relative to the failed move's structure.
Higher threshold values (closer to 1.0) require cleaner, more convincing reversals. Lower values (closer to 0.1) allow weaker setups through. The default of 0.7 provides reasonable filtering without being overly restrictive.
Trend Context Filter
A moving average (EMA or SMA, configurable period) provides simple trend context. The dashboard displays three related metrics:
Trend: Current price position relative to the MA (Bullish/Bearish)
FTR Bias: Direction of the most recent confirmed signal (Long/Short)
Aligned: Whether these two readings match (Yes/No)
This helps identify situations where the FTR bias has become stale or is positioned against the prevailing trend.
Signal Classification
Standard signals appear as small triangles and represent FTR patterns that passed the delivery threshold and any active filters.
Sweep-confirmed signals appear with an "S" label and represent the subset of signals where price swept a structural level shortly before the reversal formed. These carry higher conviction due to the additional liquidity context.
Dashboard Metrics
The information panel provides:
Current trend direction and FTR bias
Alignment status between the two
Bars elapsed since the last signal
Running totals for long and short signals
Sweep-confirmed counts in parentheses
Volume filter status
Configuration Parameters
Structure Lookback: Bars used for pivot detection. Higher values capture more significant swings.
Delivery Threshold: Minimum ratio for valid reversals. Range 0.1 to 1.0.
Level Lifespan: The maximum bars a structural level remains active.
Sweep Window: Lookback period for sweep confirmation.
Trend MA Period: Moving average length for trend context.
Volume Spike Multiple: Required volume ratio when volume filter is active.
Zone Depth: Origin zone width as ATR multiple.
Practical Application
Sweep-confirmed signals with trend alignment represent the highest-conviction setups. These combine a quality reversal pattern, liquidity sweep context, and trend support.
Standard signals without sweep confirmation remain valid FTR patterns but warrant additional discretion.
Counter-trend signals (Aligned showing NO) can still produce valid moves, but historically carry lower probability. Consider position sizing adjustments accordingly.
Origin zones serve as potential support/resistance areas for subsequent price returns.
Important Limitations
The indicator may remain biased in the wrong direction during extended trends if no qualifying reversal pattern forms. The trend filter helps identify these situations, but does not automatically override the FTR bias.
Signal counts are calculated on visible chart history and will vary based on the loaded timeframe and bar count.
As with any technical tool, signals should be evaluated within the broader market context rather than traded mechanically.
Hope you find it useful! If you have any questions, please don't hesitate to ask them!

FVG Finder | NRP | ProjectSyndicate🥇 ProjectSyndicate Fair Value Gap (FVG) Finder — Pine Script v6 • NRP Non-Repainting
📌 SMC Imbalance Zones Built for Clean Entries, Targets & Mitigation Tracking
The ProjectSyndicate FVG Finder is a professional TradingView indicator designed for traders who want clean, high-probability Fair Value Gaps price imbalances mapped instantly on-chart—without manual marking or clutter.
Fair Value Gaps form during aggressive displacement when price delivers inefficiently, leaving a void that price often returns to rebalance. This tool helps you spot those zones fast, track whether they’re still fresh, and plan entries with confidence. ✅
________________________________________
🚀 Why Traders Like It
✅ NRP Logic (Non-Repainting): Signals are built to remain stable once confirmed
✅ Real-Time FVG Detection: Automatically identifies bullish + bearish FVG zones as they form
📦 Clean Zone Visualization: Boxed imbalance areas that are easy to trade from
🧹 Auto-Cleanup (Mitigation): Zones update based on your chosen fill rule (Touch / 50% / Full)
🎛️ Anti-Noise Filtering: Minimum size + optional ATR filter to remove weak gaps
⚡ Pine Script v6: Built on the latest TradingView engine for stability and performance
🔔 Alerts + Markers: Get notified when new FVGs print + optional triangle signals
________________________________________
Gold H1 TF active FVGs
Eur Usd M30 TF active FVGs
NQ H1 TF active FVGs
🧠 Detection Logic — Simple, Effective, Battle-Tested
📈 Bullish Fair Value Gap (Demand Imbalance):
A 3-candle imbalance where the low of Candle 3 is above the high of Candle 1
➡️ Signals strong buy-side displacement / inefficient delivery
📉 Bearish Fair Value Gap (Supply Imbalance):
A 3-candle imbalance where the high of Candle 3 is below the low of Candle 1
➡️ Signals strong sell-side displacement / inefficient delivery
________________________________________
🧹 Mitigation Options — Choose How Filled Works
Your strategy decides what counts as used:
👆 Touch: Zone considered mitigated on first interaction
🎯 50% Fill: Mitigated once price fills half the gap
✅ Full Fill: Mitigated only when the entire zone is filled
Optional: Keep mitigated zones visible or hide them for ultra-clean charts.
________________________________________
🛠 Recommended Settings (ATR Multiplier Presets)
Use these as solid starting points on M30 / H1:
•🥇 XAUUSD (Gold) M30/H1: 0.5
•💻 NQ (Nasdaq) M30/H1: 0.25
•🛢️ USOIL M30/H1: 0.25
•₿ BTCUSD M30/H1: 0.25
•💶 EURUSD / GBPUSD M30/H1: 0.25 – 0.50
✅ Other markets are supported too just adjust the ATR Multiplier based on how many signals you want:
•More signals → lower multiplier
•Higher quality → higher multiplier
________________________________________
✅ Best Use-Cases
🎯 Mark imbalance zones instantly without manual drawing
🧲 Wait for price to return to FVG for cleaner entries
🛡️ Use zone boundaries for clear invalidation / stop placement
📊 Combine with trend bias + BOS/CHoCH + premium/discount for higher confirmation
🎯 Use FVGs as both entries and profit targets
________________________________________
⭐ How You Can Support ProjectSyndicate (3 Steps)
1. ✅ Click “Add to Favorites” to save this script to your TradingView Favorites
2. 🔎 Check out our other scripts to complete your SMC toolkit
3. 👤 Follow ProjectSyndicate for the latest updates, upgrades, and new releases
Order Block Finder | Gold | ProjectSyndicate
Breaker Blocks Finder | Gold | ProjectSyndicate

Optimus S/R ZonesEnhanced S/R Zones Pro is a sophisticated Support and Resistance indicator designed for traders who need reliable, validated S/R levels with professional-grade visualization. Unlike basic pivot indicators, this tool validates levels based on historical price interaction and provides comprehensive analysis of your current position within the market structure.
✨ Key Features
📊 Extended Lookback Analysis
Lookback Range: 20-500 bars (far beyond standard 80-bar limits)
Pivot Strength: Adjustable 2-10 bars for confirmation
Separate Controls: Independent max levels for support (1-8) and resistance (1-8)
Smart Filtering: Automatic level spacing with customizable minimum distance (0.3-5%)
🎨 Advanced Zone Visualization
Three Zone Styles:
Filled: Solid colored zones
Outlined: Border-only zones
Both: Combined for maximum visibility
Adjustable Transparency: 50-95% opacity control
Dynamic Extension: Zones extend to the right indefinitely
Custom Zone Width: 0.05-1.0% of price
💪 Level Strength System
Touch Validation: Only shows levels tested multiple times
Minimum Touches: Filter for 1-5 minimum confirmations
Color Intensity: Stronger levels (more touches) display darker/brighter
Touch Detection: Customizable sensitivity (0.1-1.0% range)
Independent Display: Show touch counts without color coding
📱 Enhanced Dashboard
Level Count: Active support/resistance zones
Distance Metrics: Percentage to nearest S/R levels
Range Position: Where price sits between S/R (0-100%)
Color Coding: Visual feedback on market position
Four Positions: Top/Bottom, Left/Right placement
🎭 Customizable Visuals
Label Sizes: Tiny, Small, Normal, Large, Huge
Adjustable Line Width: 1-4 pixels
Custom Colors: Full color picker for support/resistance
Optional Touch Count: Toggle touch numbers on/off
Midpoint Line: Shows equilibrium between nearest S/R
🔔 Smart Alerts
Proximity Alerts: Triggers when approaching support zones
Resistance Alerts: Triggers when nearing resistance zones
Customizable Range: Based on touch detection sensitivity
🔧 How It Works
1. Pivot Detection
The indicator scans historical price action using configurable pivot strength to identify significant highs and lows. Extended lookback allows detection of major structural levels that shorter timeframes might miss.
2. Touch Validation
Each potential level is validated by counting how many times price has tested it within the specified touch detection range. Only levels meeting the minimum touch threshold are displayed.
3. Strength Ranking
Levels are ranked by:
Number of touches (primary)
Proximity to current price (secondary)
This ensures the most reliable and relevant levels are always shown.
4. Smart Filtering
The minimum distance filter prevents level clustering, keeping your chart clean and focusing only on distinct, actionable zones.
💡 Use Cases
Swing Trading
Identify major support/resistance for position entries
Set profit targets at strong resistance levels
Place stops below validated support zones
Day Trading
Quick identification of intraday S/R
Monitor range position for mean reversion trades
Use proximity alerts for entry timing
Position Trading
Extended lookback reveals major structural levels
Touch count validation ensures reliability
Range position helps time accumulation/distribution
Risk Management
Distance metrics help size positions appropriately
Strong levels (high touch count) for tight stops
Midpoint line for partial profit taking
⚙️ Settings Guide
Core Settings
Lookback Period: Start with 100 for swing trading, 50 for day trading
Pivot Strength: Higher values = fewer but stronger levels
Max Levels: 2-3 support and 2-3 resistance recommended
Min Distance: 1.0% prevents clustering, increase for volatile assets
Zone Settings
Zone Width: 0.25% default works well for most assets
Zone Style: "Both" for maximum visibility
Extend Zones: Keep enabled to track levels forward
Transparency: 85% provides good visibility without clutter
Level Strength
Show Level Strength: Enable for color-coded importance
Min Touches: 2-3 for validated levels
Touch Detection: 0.3% for precise levels, increase for volatile markets
Visual Settings
Label Size: Small/Normal for most charts
Show Touch Count: Enable to see level validation
Line Width: 2 for standard, 3-4 for presentation charts
📈 Best Practices
Start Conservative: Begin with default settings, adjust based on asset volatility
Combine Timeframes: Use different lookback periods on multiple charts
Respect Strong Levels: Higher touch counts indicate institutional interest
Watch Range Position: <30% = near support, >70% = near resistance
Use Alerts: Set proximity alerts to avoid constant chart watching
Validate Breaks: Zone width shows where true breaks occur vs. fakeouts
🚀 What Makes This Different
Unlike basic pivot indicators that simply mark highs/lows:
✅ Validates levels through touch count analysis
✅ Ranks levels by actual strength, not just recency
✅ Visualizes zones, not just lines
✅ Quantifies your position within market structure
✅ Extends lookback far beyond standard limits
✅ Separates support and resistance controls
🎓 Tips for New Users
First Time Setup:
Add indicator to chart
Enable dashboard in settings (default on)
Observe which levels price respects
Adjust lookback/strength to match your trading style
Set proximity alerts for your key levels
Optimization:
Forex: 0.2-0.3% zone width, 100-200 lookback
Stocks: 0.3-0.5% zone width, 50-150 lookback
Crypto: 0.4-0.6% zone width, 100-200 lookback
Indices: 0.2-0.4% zone width, 100-250 lookback
⚠️ Disclaimer
This indicator is a technical analysis tool and should not be used as the sole basis for trading decisions. Support and resistance levels are not guarantees of price behavior. Always use proper risk management, combine with other analysis methods, and consider fundamental factors. Past performance does not guarantee future results.

Liquidity ZonesLiquidity Zones
Liquidity Zones is a price-action–based indicator designed to identify high-probability support and resistance areas where liquidity has historically accumulated.
Instead of drawing single lines, the script builds dynamic price zones based on repeated pivot reactions validated by volume, helping traders focus on meaningful levels rather than noise.
How It Works
Pivot Detection
The indicator scans historical price data for pivot highs and pivot lows using a fixed pivot strength.
Each pivot represents a potential liquidity interaction point.
Volume Qualification
A pivot is only considered valid if the volume at the pivot bar exceeds:
Volume SMA × Sensitivity
This filters out weak or low-participation levels and keeps zones formed during strong market interest.
Zone Construction
Nearby pivots are grouped into a single zone if their price difference stays within an ATR-based threshold.
Each time price reacts within this threshold, the zone’s touch count increases.
Once the minimum number of touches is reached, a liquidity zone is drawn and extended to the right.
Adaptive Zone Expansion
As new qualifying pivots appear, zones automatically expand to reflect the true liquidity range instead of staying static.
Dynamic Zone Coloring
Zones update their color in real time based on price position:
Green (Support) → Price is above the zone
Red (Resistance) → Price is below the zone
Gray (In-Zone) → Price is trading inside the zone
This allows instant visual feedback on whether a level is acting as support, resistance, or an active liquidity area.
Settings Overview
Bars to Apply
Controls how much historical data is scanned for liquidity zones.
Volume Sensitivity
Higher values require stronger volume spikes to validate pivots, resulting in fewer but higher-quality zones.
Styling Options
Fully customizable colors and transparency for support, resistance, and in-zone states.
Best Use Cases
Identifying high-liquidity support and resistance zones
Planning entries, exits, and stop placement
Combining with trend-following or momentum indicators
Filtering out weak levels in sideways or choppy markets

(QUANTLABS) Fractal God Mode: 25-Timeframe Scanner The indicator aggregates data into three distinct metric columns:
1. STRUCT (Market Structure) This analyzes price action relative to Fractal Pivots (Highs and Lows) to determine market direction.
HH (Breakout): Price has closed above the previous Pivot High. (Bullish Structure)
LL (Breakdown): Price has closed below the previous Pivot Low. (Bearish Structure)
TRAPPED: Price is trading between the last Pivot High and Low. This indicates a ranging market where trend trades should be avoided.
2. VELOCITY (Thrust) This measures the specific strength of the current candle on that timeframe.
The Math: It calculates the ratio of the body (Close - Open) relative to the total candle range (High - Low).
The Signal: High positive numbers (Green) indicate buyers are closing near highs. High negative numbers (Red) indicate sellers are dominating the range.
3. QUALITY (Efficiency Ratio) This acts as a "Noise Filter." It determines if the trend is moving in a straight line or whipping back and forth.
The Math: It divides the Net Price Movement (Distance from 5 bars ago) by the Total Path Traveled (Sum of the ranges of the last 5 bars).
PRISTINE (Values > 0.6): The market is moving efficiently in one direction.
CHOPPY (Values < 0.4): The market is volatile and non-directional (High Noise).
1. The Matrix (Dashboard) Located in the bottom right, this table gives you an instant read on Short-Term (3m-9m), Medium-Term (10m-45m), and Long-Term (1H-Daily) trends.
2. Coherence Flow At the bottom of the table, the script sums up the structural score of all 25 timeframes.
COHERENT BULL: When the Short, Medium, and Long terms align green.
COHERENT BEAR: When the Short, Medium, and Long terms align red.
3. God Mode (Global S/R) The indicator can plot Support and Resistance levels from higher timeframes onto your current chart. For example, while trading the 5m chart, you can see the 4H and Daily pivot levels plotted automatically as dotted lines, ensuring you never trade blindly into a higher-timeframe wall.
Trend Following: Wait for the "Coherent Bull/Bear" signal at the bottom of the dashboard. This confirms that momentum is aligned from the 3m chart up to the Daily.
Scalping: Focus on the Quality column. Only take trades when the Quality is "CLEAN" or "PRISTINE." Avoid entries when the dashboard warns of "High Noise" (Choppy).
Risk Management: If the dashboard shows "TRAPPED" on the Long Term (1H+), reduce position size or wait for a breakout.
Pivot Lookback: Adjusts the sensitivity of the Fractal Structure (Default: 5).
Show Fractal DNA Matrix: Toggles the dashboard table.
Show ALL Timeframe S/R: Enables "God Mode" to see supports/resistances from all 25 timeframes (Heavy visual processing, use carefully).

Previous Day Candle [ApexFX]Previous Day Candle is a precision tool designed for intraday traders who rely on previous daily structures to find support and resistance.
While most indicators simply mark the previous high and low, this tool focuses on Session Continuity. It highlights the full 24-hour range of the previous day and extends those levels into the "Killzone" of the current trading day (up to 2:00 PM EST / 12:00 PM MST).
Why use this? Market reaction often occurs at the previous day's extremes. By extending these lines into the current session, you can easily spot:
Breakouts: Price pushing through yesterday's high.
Failed Auctions: Price sweeping yesterday's low and reversing.
Support/Resistance Flips: Old highs becoming new support.
Main Features:
Asset Class Presets: Don't worry about timezones. Simply select your market:
Forex: Aligns to the standard 5:00 PM EST New York Open.
Indices: Aligns to the 6:00 PM EST Globex Open.
Crypto: Aligns to UTC Midnight.
Custom: Full manual control for specific needs.
Visual "Boxing": Vertical dotted lines clearly demarcate the start and end of the previous trading day.
Dynamic History: Choose to show just yesterday's levels or look back at the last 5+ days.
Smart Color Coding: The indicator automatically cycles colors for each day (Blue = Yesterday, Green = 2 Days Ago, etc.), making it instant to read historical price action.
Best Used On: Intraday timeframes (5m, 15m, 1h).

Smart Margin Zone
SMART MARGIN ZONE - CME-BASED SUPPORT & RESISTANCE INDICATOR
TITLE FOR PUBLICATION:
Smart Margin Zone - CME Margin-Based Support and Resistance
CATEGORY:
Support and Resistance
SHORT DESCRIPTION (for preview):
Automatically plots margin zones based on CME Group requirements. These zones represent critical price levels where leveraged traders face margin calls, creating natural support and resistance through forced liquidations.
═══════════════════════════════════════════════════════════════
FULL DESCRIPTION FOR TRADINGVIEW:
═══════════════════════════════════════════════════════════════
📊 Smart Margin Zone - Professional Trading Zones Based on CME Data
This indicator automatically calculates and displays margin zones derived from official CME Group margin requirements. These zones represent critical price levels where traders using leverage receive margin calls, triggering forced position closures that create natural support and resistance levels.
═══════════════════════════════════════════════════════════════
🎯 CORE CONCEPT
═══════════════════════════════════════════════════════════════
When price reaches calculated margin zones, traders using 2:1 or 4:1 leverage on CME futures receive margin calls. Brokers automatically liquidate these positions, creating waves of buying or selling pressure that form strong support and resistance levels.
This is not theoretical - it's based on actual margin requirements from CME Group, the world's largest derivatives marketplace.
═══════════════════════════════════════════════════════════════
📐 CALCULATION METHODOLOGY
═══════════════════════════════════════════════════════════════
The indicator uses the following formula to calculate zone sizes:
Zone Size = (Margin Requirement / Tick Value) × Tick Size × 1.10
Where:
• Margin Requirement = Official CME initial margin (updated November 2024)
• Tick Value = Dollar value of minimum price movement
• Tick Size = Minimum price increment
• 1.10 = 10% buffer for realistic zone width
SUPPORTED INSTRUMENTS WITH CME DATA:
Currency Pairs:
• EURUSD: $2,100 margin → 0.0168 zone size
• GBPUSD: $1,800 margin → 0.0144 zone size
• AUDUSD: $1,300 margin → 0.0065 zone size
• NZDUSD: $1,100 margin → 0.0055 zone size
• USDJPY: $3,200 margin → custom calculation
• USDCAD: $950 margin → calculated
• USDCHF: $1,650 margin → calculated
Commodities:
• Gold (XAUUSD): $8,000 margin → 80 points zone size
• Silver (XAGUSD): $6,500 margin → calculated
• WTI Crude Oil: $4,500 margin → calculated
═══════════════════════════════════════════════════════════════
🔍 HOW IT WORKS
═══════════════════════════════════════════════════════════════
1. SWING POINT DETECTION
The indicator automatically identifies swing highs and swing lows using a configurable lookback period (default 10 bars). These become anchor points for zone calculations.
2. FIVE ZONE LEVELS
From each swing point, five zone levels are calculated:
• Zone 1/4 (25%) - First correction level
• Zone 1/2 (50%) - KEY ZONE for trend determination
• Zone 3/4 (75%) - Intermediate level
• Zone 1/1 (100%) - Full margin zone (strongest level)
• Zone 5/4 (125%) - Extended zone
3. TREND IDENTIFICATION
• Close above Zone 1/2 resistance = Bullish trend
• Close below Zone 1/2 support = Bearish trend
• Between zones = Range/consolidation
4. HISTORICAL CONTEXT
Current zones are displayed prominently with fills and labels. Historical zones appear as thin, semi-transparent lines for context without cluttering the chart.
═══════════════════════════════════════════════════════════════
⚙️ FEATURES
═══════════════════════════════════════════════════════════════
AUTOMATED CALCULATION:
✅ Auto-detection of swing highs and lows
✅ Real-time zone updates as new swings form
✅ CME margin data built-in for major instruments
✅ Manual override option for custom calculations
VISUAL CLARITY:
✅ Color-coded zones (red=resistance, green=support)
✅ Adjustable transparency for fills and lines
✅ Current zones bold with fills and price labels
✅ Historical zones thin and transparent
✅ Swing point markers show calculation origins
CUSTOMIZATION:
✅ Show/hide individual zone levels (1/4, 1/2, 3/4, 1/1, 5/4)
✅ Toggle historical zones on/off
✅ Adjustable lookback period (5-50 bars)
✅ Customizable colors for all elements
✅ Line width and transparency controls
✅ Zone extension options (none/right/both)
TREND ANALYSIS:
✅ Optional trend background coloring
✅ Customizable trend colors and transparency
✅ Real-time trend identification display
STATISTICS:
✅ Live statistics table showing:
- Current instrument
- Active zone size
- Calculation mode
- Current trend direction
- Number of zones displayed
ALERTS:
✅ Zone 1/2 breakout (up/down)
✅ Full margin zone 1/1 reached
✅ Customizable alert messages
═══════════════════════════════════════════════════════════════
📈 TRADING APPLICATIONS
═══════════════════════════════════════════════════════════════
ENTRY SIGNALS:
• Bounces from zone levels = potential entry points
• Zone 1/2 breakouts = trend continuation entries
• Zone rejections = reversal opportunities
RISK MANAGEMENT:
• Zone levels = logical stop-loss placement
• Zone 1/1 = maximum risk level
• Zone spacing = position sizing guide
PROFIT TARGETS:
• Next zone level = first target
• Zone 1/1 = full profit target
• Zone breakouts = extended targets
TREND CONFIRMATION:
• Price above Zone 1/2 resistance = confirmed uptrend
• Price below Zone 1/2 support = confirmed downtrend
• Consolidation between zones = wait for breakout
═══════════════════════════════════════════════════════════════
📚 USAGE INSTRUCTIONS
═══════════════════════════════════════════════════════════════
GETTING STARTED:
1. Add indicator to chart of any supported instrument
2. Zones automatically calculate and display
3. Adjust swing detection period if needed (default 10 works well)
4. Customize colors and visibility to your preference
OPTIMAL SETTINGS:
• Best timeframes: H1, H4, Daily, Weekly
• Default swing length (10) suitable for most markets
• Show 2-3 historical zones for context
• Enable swing point markers to see calculation origins
INTERPRETATION:
• Watch for price reactions at zone boundaries
• Strong bounces = respect for margin level
• Clean breaks = momentum continuation
• Multiple touches = zone strength confirmation
SET ALERTS:
• Zone 1/2 breakouts for trend entries
• Zone 1/1 reaches for profit-taking
• Custom alerts for your specific strategy
═══════════════════════════════════════════════════════════════
⚠️ IMPORTANT NOTES
═══════════════════════════════════════════════════════════════
DATA ACCURACY:
• CME margin requirements updated November 2024
• Margins change periodically - check CME Group website
• Manual mode available for latest margin data
• Indicator provides analysis tool, not financial advice
STATISTICAL PERFORMANCE:
• Historical data shows >60% probability of continued movement after Zone 1/2 breakout
• Zone effectiveness varies by market conditions
• Best results in trending markets with clear swings
LIMITATIONS:
• Margin requirements change - monitor CME updates
• Works best on liquid instruments with clear swings
• Not a standalone trading system
• Should be combined with additional analysis
═══════════════════════════════════════════════════════════════
🔧 METHODOLOGY CREDIT
═══════════════════════════════════════════════════════════════
This indicator is based on the margin zones concept developed by Alexander Bazylev (BTrade indicator for MetaTrader platforms).
The TradingView implementation has been completely rewritten with original enhancements:
• Multiple zone levels instead of single level
• Automatic swing point detection algorithm
• Direct CME data integration
• Historical zone visualization
• Advanced customization options
• Comprehensive statistics and alerts
All code is original and specifically designed for TradingView's Pine Script v5 environment.
═══════════════════════════════════════════════════════════════
💡 BEST PRACTICES
═══════════════════════════════════════════════════════════════
COMBINE WITH:
• Volume analysis for confirmation
• Trend indicators for direction bias
• Price action patterns at zones
• Higher timeframe analysis
AVOID:
• Trading against strong trends at minor zones
• Over-leveraging based solely on zone placement
• Ignoring broader market context
• Expecting perfect bounces every time
OPTIMIZE:
• Adjust swing length for different timeframes
• Shorter period (5-7) for intraday trading
• Longer period (15-20) for swing trading
• Test historical effectiveness on your instruments
═══════════════════════════════════════════════════════════════
📖 EDUCATIONAL VALUE
═══════════════════════════════════════════════════════════════
This indicator helps traders understand:
• How institutional margin requirements affect price
• Where forced liquidations create pressure
• Natural support and resistance formation
• Relationship between leverage and price levels
• Market structure and key technical levels
═══════════════════════════════════════════════════════════════
🔄 VERSION HISTORY
═══════════════════════════════════════════════════════════════
Version 1.0 (Initial Release):
• CME-based zone calculation for 10 instruments
• Automatic swing high/low detection
• 5 zone levels with customizable display
• Historical zones with transparency control
• Swing point markers
• Trend background indicator
• Live statistics table
• Multiple alert conditions
• Fully customizable colors and styles
• English language interface
═══════════════════════════════════════════════════════════════
📞 SUPPORT & FEEDBACK
═══════════════════════════════════════════════════════════════
Questions or suggestions? Leave a comment below!
If you find this indicator useful:
⭐ Please leave a like
💬 Share your experience in comments
🔔 Follow for updates and new indicators
═══════════════════════════════════════════════════════════════
⚖️ DISCLAIMER
═══════════════════════════════════════════════════════════════
This indicator is provided for educational and analytical purposes only. It is not financial advice and should not be the sole basis for trading decisions.
• Past performance does not guarantee future results
• Trading involves substantial risk of loss
• CME margin requirements subject to change
• Always do your own research and risk management
• Consult a financial advisor for investment advice
The creator is not responsible for any trading losses incurred through use of this indicator.

Higher Timeframe Candle LevelsThis is an indicator that shows higher time frame candle levels from various preset timeframes. These higher time frame candles act as support and resistance levels, so look for reversals and continuations off of these levels. When price exceeds the high or low of these levels, you should look for breakouts in the same direction and trade with the trend.
It includes candle levels for the following timeframes: 1 hour, 4 hour, 1 day, 1 week, 1 month, 1 quarter and 1 year. The indicator also includes a trend candle coloring feature, trend strength scoring table, stop loss feature, line identification labels, alerts for trend changes, alerts for level touches and full customization of all options.
How To Trade With This Indicator
These higher timeframe candle levels will act as support and resistance levels, so look for price to react at any of the levels you have turned on and then look for potential bounce or reversal signs at those levels so you can trade those direction changes. Price outside of the higher timeframe candle highs and low typically signals a breakout as well, so look for price to continue after passing the highs or lows.
You can use the direction of the higher timeframe candles as your trend as well. Try to only trade in the direction of the trend of the higher timeframes to increase the likelihood of your trade going in your favor.
The highs and lows of daily and up levels are excellent levels to find quick reversal off of. Watch for price action to struggle to break through these levels and then trade the reversal. If price breaks through these levels easily, watch for price to retest the level and then continue beyond that level. Trade the retest in the direction of the trend.
The open, close and midline levels are excellent for trading bounces. Watch for price to form wicks beyond these levels and close on the other side and use that as a sign that price may bounce there. Use that with price action to confirm your trade and then take trades off of those level bounces.
Use the alerts for daily and up timeframe level touches across all of your favorite markets so that way you are always notified in real time when price is at a level that could provide a potential trading opportunity.
Higher Time Frame Candle Levels
The indicator shows the current candle open, previous open, previous high, previous low, previous close and previous candle body midline levels of each candle for each time frame. This helps you easily see what is going on with the higher time frame candles and read the price action from your lower time frame charts.
Each candle level will paint red if it was a down candle or green if it was an up candle, except the midlines and current candle open lines, those are a different color for easy differentiation. The line colors can be customized to your preferences in the settings and you can also toggle the candle body coloring on or off, as well as change the color of the candle body background.
Each timeframe can be adjusted to your preferences, allowing you to turn all of the levels on or off. You can also adjust how many previous candles show up on your chart so you can backtest it and see for yourself how accurate these levels are.
When adjusting the number of candles, you will get a notification if you have more than 500 lines turned on, so just turn down the number of levels for whatever timeframe you can’t see on your chart to lower that number below 500. The notification will go away once you are under 500 lines again. Each candle has 6 lines if all levels are turned on for that timeframe: open, current candle open, close, high, low and midline. The default settings keep you under 500 lines total, so just be aware of that limitation when adjusting those numbers and adjust the number of levels down on the timeframes that are not useful on the current chart bar.
You can also extend the levels right on any time frame from the daily levels and above. This is useful when price is breaking above or below all levels and you need to know if there are any other previous candle levels in the way as price moves away from the most recent higher time frame candles.
To understand the intraday trend of each higher time frame, look to see where price is at according to each higher time frame candle. If the price is above the midline of the candle, it is bullish. If the price is above the candle body it is more bullish. If the price is above the high, it is very bullish. If the price is below the midline of the candle, it is bearish. If the price is below the candle body it is more bearish. If the price is below the low, it is very bearish. Make sure you backtest this yourself and go through lots of historical data to get a feel for how price reacts to these levels and establishes the trend. Then use that trend information to your advantage and trade in the direction of the trend.
Since users are limited to a certain amount of historical bars based on which Tradingview plan you have, some longer timeframe levels won’t show up because the start of that candle is too far back in history. You will get a notification at the top of that chart if that happens. It will tell you to lower the display timeframe for that timeframe until that notification goes away, which means it was able to plot the most recent candle for that timeframe on your chart.
Trend Candle Coloring
The indicator includes a feature that paints the candles based on whether the current time frame candles are above or below the most recent midline, candle body or high & low of a higher time frame candle of your choice. This helps you see the overall trend of the higher timeframe so you can trade with the trend.
The candle coloring will have an up color, down color and neutral color which can all be customized to suit your preferences. If the current time frame candle close is above the setting you choose, it will show the up color. If the current time frame candle close is below the setting you choose, it will show the down color. If the current time frame candle close is equal to or in the middle of the setting you chose, it will show the neutral color.
So, for example if you set it to candle body, then it will show the up color if the current candle is above the top of the candle body, down color if it is below the bottom of the candle body and neutral color if it is inside the candle body. This helps you wait for price action to move beyond the inside of the previous higher time frame candle before taking a position when price is breaking out of that previous candle so you can trade the momentum of that move. The candle coloring is fully customizable, but make sure to turn off your candle coloring on other indicators and your chart settings for it to show up properly.
Trend Strength Scoring Table
The trend strength scoring table displays a table at the bottom of the screen(table position is customizable), showing a score for the trend strength of each higher time frame. If the current candle close is above the midline, its strength is 1. If the current candle close is above the midline, but below the top of the candle body, its strength is 2. If the current candle close is above the high, its strength is 3. The same goes for below the midline, bottom of the candle body and below the low, but the scores would be negative 1, 2 or 3 instead.
This trend strength table allows you to quickly identify the trend on each higher time frame so you can wait until the trend is the same across all time frames before placing a trade in the direction of the trend. It also shows a total score on the far right side that adds all of the current trend scores together to give you a total strength score. Try to only trade when that number is very high compared to how many time frames you have turned on. Each time frame can have up to a maximum score of 3 if bullish and -3 if bearish. Each time frame in the table can be turned on or off to suit your preferences.
Stop Loss Feature
There is also a stop loss feature that you can set to whatever time frame you choose and whatever direction you chose, such as long or short. It will follow the most recent higher time frame candle’s trend using one of the following settings: candle body, high & low or midline. Once a new higher time frame candle is created, the stop loss will update to the most recent candle’s levels so you can use these levels as a trailing stop loss to maximize your wins.
If you have it set to use the candle body and it is set to long mode, then the stop loss will use the previous higher time frame candle’s lowest candle body level. So if it was an up candle previously, it will use the open. If it was a down candle previously, it will use the close. The opposite is true for short positions.
The stop loss will start working once you turn it on in the settings and will update automatically as new higher time frame candles are formed. It also shows a line of where the stop loss was previously since it was turned on.
I recommend using the high & low setting, especially when the market starts trending.
Candle Level Identification Labels
There are labels for each level starting with the 4 hour time frame and above so you can easily tell what level of each candle you are looking at, even if the rest of the candle is not showing within the chart pane. You can customize the label coloring for up candles and down candles and midlines as well as adjust the number of bars that the labels are offset from the current bar so they are visible on your chart without overlapping the current price action or other indicator labels. Labels for each time frame can be turned on or off as needed. The 1 hour labels were not included because it clogs up the chart, but it has labels for all time frames from the 4 hour candles and up.
Alerts
The indicator includes alerts for when the trend has changed to the opposite direction. The trend change alert is based on your settings for the Trend Candle Coloring. Whatever settings you have the trend candle coloring set to, will be used to set up your alerts. The Trend Candle Coloring setting must be turned on as well when creating your alerts for it to work properly. Make sure to backtest your settings and then create your alerts.
It also has alerts for when price is touching an open or close, high or low, midline or any of those levels for each timeframe. This allows you to be notified when price touches one of these levels so you can check the chart and look for potential trade opportunities if price wants to bounce off of that level. To make it easy for you to get alerts on many different tickers, just use the alert for any level touch on whatever timeframes you want.
Other Indicators To Pair This With
Use this in combination with our Trend Strength Indicator so you can visually see the historic and current trend for all of these levels. You should also use our Breakout Scanner to find other markets with strong trends so you always know which market is trending the strongest and can trade those. Trend Strength Indicator, Higher Timeframe Candle Levels and the Breakout Scanner all use the same levels and calculate the trend scores the same way so they are designed to work together to help you quickly be able to read a chart and find what direction to trade in.

Luxy BIG beautiful Dynamic ORBThis is an advanced Opening Range Breakout (ORB) indicator that tracks price breakouts from the first 5, 15, 30, and 60 minutes of the trading session. It provides complete trade management including entry signals, stop-loss placement, take-profit targets, and position sizing calculations.
The ORB strategy is based on the concept that the opening range of a trading session often acts as support/resistance, and breakouts from this range tend to lead to significant moves.
What Makes This Different?
Most ORB indicators simply draw horizontal lines and leave you to figure out the rest. This indicator goes several steps further:
Multi-Stage Tracking
Instead of just one ORB timeframe, this tracks FOUR simultaneously (5min, 15min, 30min, 60min). Each stage builds on the previous one, giving you multiple trading opportunities throughout the session.
Active Trade Management
When a breakout occurs, the indicator automatically calculates and displays entry price, stop-loss, and multiple take-profit targets. These lines extend forward and update in real-time until the trade completes.
Cycle Detection
Unlike indicators that only show the first breakout, this tracks the complete cycle: Breakout → Retest → Re-breakout. You can see when price returns to test the ORB level after breaking out (potential re-entry).
Failed Breakout Warning
If price breaks out but quickly returns inside the range (within a few bars), the label changes to "FAILED BREAK" - warning you to exit or avoid the trade.
Position Sizing Calculator
Built-in risk management that tells you exactly how many shares to buy based on your account size and risk tolerance. No more guessing or manual calculations.
Advanced Filtering
Optional filters for volume confirmation, trend alignment, and Fair Value Gaps (FVG) to reduce false signals and improve win rate.
Core Features Explained
### 1. Multi-Stage ORB Levels
The indicator builds four separate Opening Range levels:
ORB 5 - First 5 minutes (fastest signals, most volatile)
ORB 15 - First 15 minutes (balanced, most popular)
ORB 30 - First 30 minutes (slower, more reliable)
ORB 60 - First 60 minutes (slowest, most confirmed)
Each level is drawn as a horizontal range on your chart. As time progresses, the ranges expand to include more price action. You can enable or disable any stage and assign custom colors to each.
How it works: During the opening minutes, the indicator tracks the highest high and lowest low. Once the time period completes, those levels become your ORB high and low for that stage.
### 2. Breakout Detection
When price closes outside the ORB range, a label appears:
BREAK UP (green label above price) - Price closed above ORB High
BREAK DOWN (red label below price) - Price closed below ORB Low
The label shows which ORB stage triggered (ORB5, ORB15, etc.) and the cycle number if tracking multiple breakouts.
Important: Signals appear on bar close only - no repainting. What you see is what you get.
### 3. Retest Detection
After price breaks out and moves away, if it returns to test the ORB level, a "RETEST" label appears (orange). This indicates:
The original breakout level is now acting as support/resistance
Potential re-entry opportunity if you missed the first breakout
Confirmation that the level is significant
The indicator requires price to move a minimum distance away before considering it a valid retest (configurable in settings).
### 4. Failed Breakout Detection
If price breaks out but returns inside the ORB range within a few bars (before the breakout is "committed"), the original label changes to "FAILED BREAK" in orange.
This warns you:
The breakout lacked conviction
Consider exiting if already in the trade
Wait for better setup
Committed Breakout: The indicator tracks how many bars price stays outside the range. Only after staying outside for the minimum number of bars does it become a committed breakout that can be retested.
### 5. TP/SL Lines (Trade Management)
When a breakout occurs, colored horizontal lines appear showing:
Entry Line (cyan for long, orange for short) - Your entry price (the ORB level)
Stop Loss Line (red) - Where to exit if trade goes against you
TP1, TP2, TP3 Lines (same color as entry) - Profit targets at 1R, 2R, 3R
These lines extend forward as new bars form, making it easy to track your trade. When a target is hit, the line turns green and the label shows a checkmark.
Lines freeze (stop updating) when:
Stop loss is hit
The final enabled take-profit is hit
End of trading session (optional setting)
### 6. Position Sizing Dashboard
The dashboard (bottom-left corner by default) shows real-time information:
Current ORB stage and range size
Breakout status (Inside Range / Break Up / Break Down)
Volume confirmation (if filter enabled)
Trend alignment (if filter enabled)
Entry and Stop Loss prices
All enabled Take Profit levels with percentages
Risk/Reward ratio
Position sizing: Max shares to buy and total risk amount
Position Sizing Example:
If your account is $25,000 and you risk 1% per trade ($250), and the distance from entry to stop loss is $0.50, the calculator shows you can buy 500 shares (250 / 0.50 = 500).
### 7. FVG Filter (Fair Value Gap)
Fair Value Gaps are price inefficiencies - gaps left by strong momentum where one candle's high doesn't overlap with a previous candle's low (or vice versa).
When enabled, this filter:
Detects bullish and bearish FVGs
Draws semi-transparent boxes around these gaps
Only allows breakout signals if there's an FVG near the breakout level
Why this helps: FVGs indicate institutional activity. Breakouts through FVGs tend to be stronger and more reliable.
Proximity setting: Controls how close the FVG must be to the ORB level. 2.0x means the breakout can be within 2 times the FVG size - a reasonable default.
### 8. Volume & Trend Filters
Volume Filter:
Requires current volume to be above average (customizable multiplier). High volume breakouts are more likely to sustain.
Set minimum multiplier (e.g., 1.5x = 50% above average)
Set "strong volume" multiplier (e.g., 2.5x) that bypasses other filters
Dashboard shows current volume ratio
Trend Filter:
Only shows breakouts aligned with a higher timeframe trend. Choose from:
VWAP - Price above/below volume-weighted average
EMA - Price above/below exponential moving average
SuperTrend - ATR-based trend indicator
Combined modes (VWAP+EMA, VWAP+SuperTrend) for stricter filtering
### 9. Pullback Filter (Advanced)
Purpose:
Waits for price to pull back slightly after initial breakout before confirming the signal.
This reduces false breakouts from immediate reversals.
How it works:
- After breakout is detected, indicator waits for a small pullback (default 2%)
- Once pullback occurs AND price breaks out again, signal is confirmed
- If no pullback within timeout period (5 bars), signal is issued anyway
Settings:
Enable Pullback Filter: Turn this filter on/off
Pullback %: How much price must pull back (2% is balanced)
Timeout (bars): Max bars to wait for pullback (5 is standard)
When to use:
- Choppy markets with many fake breakouts
- When you want higher quality signals
- Combine with Volume filter for maximum confirmation
Trade-off:
- Better signal quality
- May miss some valid fast moves
- Slight entry delay
How to Use This Indicator
### For Beginners - Simple Setup
Add the indicator to your chart (5-minute or 15-minute timeframe recommended)
Leave all default settings - they work well for most stocks
Watch for BREAK UP or BREAK DOWN labels to appear
Check the dashboard for entry, stop loss, and targets
Use the position sizing to determine how many shares to buy
Basic Trading Plan:
Wait for a clear breakout label
Enter at the ORB level (or next candle open if you're late)
Place stop loss where the red line indicates
Take profit at TP1 (50% of position) and TP2 (remaining 50%)
### For Advanced Traders - Customized Setup
Choose which ORB stages to track (you might only want ORB15 and ORB30)
Enable filters: Volume (stocks) or Trend (trending markets)
Enable FVG filter for institutional confirmation
Set "Track Cycles" mode to catch retests and re-breakouts
Customize stop loss method (ATR for volatile stocks, ORB% for stable ones)
Adjust risk per trade and account size for accurate position sizing
Advanced Strategy Example:
Enable ORB15 only (disable others for cleaner chart)
Turn on Volume filter at 1.5x with Strong at 2.5x
Enable Trend filter using VWAP
Set Signal Mode to "Track Cycles" with Max 3 cycles
Wait for aligned breakouts (Volume + Trend + Direction)
Enter on retest if you missed the initial break
### Timeframe Recommendations
5-minute chart: Scalping, very active trading, crypto
15-minute chart: Day trading, balanced approach (most popular)
30-minute chart: Swing entries, less screen time
60-minute chart: Position trading, longer holds
The indicator works on any intraday timeframe, but ORB is fundamentally a day trading strategy. Daily charts don't make sense for ORB.
DEFAULT CONFIGURATION
ON by Default:
• All 4 ORB stages (5/15/30/60)
• Breakout Detection
• Retest Labels
• All TP levels (1/1.5/2/3)
• TP/SL Lines (Detailed mode)
• Dashboard (Bottom Left, Dark theme)
• Position Size Calculator
OFF by Default (Optional Filters):
• FVG Filter
• Pullback Filter
• Volume Filter
• Trend Filter
• HTF Bias Check
• Alerts
Recommended for Beginners:
• Leave all defaults
• Session Mode: Auto-Detect
• Signal Mode: Track Cycles
• Stop Method: ATR
• Add Volume Filter if trading stocks
Recommended for Advanced:
• Enable ORB15 + ORB30 only (disable 5 & 60)
• Enable: Volume + Trend + FVG
• Signal Mode: Track Cycles, Max 3
• Stop Method: ATR or Safer
• Enable HTF Daily bias check
## Settings Guide
The settings are organized into logical groups. Here's what each section controls:
### ORB COLORS Section
Show Edge Labels: Display "ORB 5", "ORB 15" labels at the right edge of the levels
Background: Fill the area between ORB high/low with color
Transparency: How see-through the background is (95% is nearly invisible)
Enable ORB 5/15/30/60: Turn each stage on or off individually
Colors: Assign colors to each ORB stage for easy identification
### SESSION SETTINGS Section
Session Mode: Choose trading session (Auto-Detect works for most instruments)
Custom Session Hours: Define your own hours if needed (format: HHMM-HHMM)
Auto-Detect uses the instrument's natural hours (stocks use exchange hours, crypto uses 24/7).
### BREAKOUT DETECTION Section
Enable Breakout Detection: Master switch for signals
Show Retest Labels: Display retest signals
Label Size: Visual size for all labels (Small recommended)
Enable FVG Filter: Require Fair Value Gap confirmation
Show FVG Boxes: Display the gap boxes on chart
Signal Mode: "First Only" = one signal per direction per day, "Track Cycles" = multiple signals
Max Cycles: How many breakout-retest cycles to track (6 is balanced)
Breakout Buffer: Extra distance required beyond ORB level (0.1-0.2% recommended)
Min Distance for Retest: How far price must move away before retest is valid (2% recommended)
Min Bars Outside ORB: Bars price must stay outside for committed breakout (2 is balanced)
### TARGETS & RISK Section
Enable Targets & Stop-Loss: Calculate and show trade management
TP1/TP2/TP3 checkboxes: Select which profit targets to display
Stop Method: How to calculate stop loss placement
- ATR: Based on volatility (best for most cases)
- ORB %: Fixed % of ORB range
- Swing: Recent swing high/low
- Safer: Widest of all methods
ATR Length & Multiplier: Controls ATR stop distance (14 period, 1.5x is standard)
ORB Stop %: Percentage beyond ORB for stop (20% is balanced)
Swing Bars: Lookback period for swing high/low (3 is recent)
### TP/SL LINES Section
Show TP/SL Lines: Display horizontal lines on chart
Label Format: "Short" = minimal text, "Detailed" = shows prices
Freeze Lines at EOD: Stop extending lines at session close
### DASHBOARD Section
Show Info Panel: Display the metrics dashboard
Theme: Dark or Light colors
Position: Where to place dashboard on chart
Toggle rows: Show/hide specific information rows
Calculate Position Size: Enable the position sizing calculator
Risk Mode: Risk fixed $ amount or % of account
Account Size: Your total trading capital
Risk %: Percentage to risk per trade (0.5-1% recommended)
### VOLUME FILTER Section
Enable Volume Filter: Require volume confirmation
MA Length: Average period (20 is standard)
Min Volume: Required multiplier (1.5x = 50% above average)
Strong Volume: Multiplier that bypasses other filters (2.5x)
### TREND FILTER Section
Enable Trend Filter: Require trend alignment
Trend Mode: Method to determine trend (VWAP is simple and effective)
Custom EMA Length: If using EMA mode (50 for swing, 20 for day trading)
SuperTrend settings: Period and Multiplier if using SuperTrend mode
### HIGHER TIMEFRAME Section
Check Daily Trend: Display higher timeframe bias in dashboard
Timeframe: What TF to check (D = daily, recommended)
Method: Price vs MA (stable) or Candle Direction (reactive)
MA Period: EMA length for Price vs MA method (20 is balanced)
Min Strength %: Minimum strength threshold for HTF bias to be considered
- For "Price vs MA": Minimum distance (%) from moving average
- For "Candle Direction": Minimum candle body size (%)
- 0.5% is balanced - increase for stricter filtering
- Lower values = more signals, higher values = only strong trends
### ALERTS Section
Enable Alerts: Master switch (must be ON to use any alerts)
Breakout Alerts: Notify on ORB breakouts
Retest Alerts: Notify when price retests after breakout
Failed Break Alerts: Notify on failed breakouts
Stage Complete Alerts: Notify when each ORB stage finishes forming
After enabling desired alert types, click "Create Alert" button, select this indicator, choose "Any alert() function call".
## Tips & Best Practices
### General Trading Tips
ORB works best on liquid instruments (stocks with good volume, major crypto pairs)
First hour of the session is most important - that's when ORB is forming
Breakouts WITH the trend have higher success rates - use the trend filter
Failed breakouts are common - use the "Min Bars Outside" setting to filter weak moves
Not every day produces good ORB setups - be patient and selective
### Position Sizing Best Practices
Never risk more than 1-2% of your account on a single trade
Use the built-in calculator - don't guess your position size
Update your account size monthly as it grows
Smaller accounts: use $ Amount mode for simplicity
Larger accounts: use % of Account mode for scaling
### Take Profit Strategy
Most traders use: 50% at TP1, 50% at TP2
Aggressive: Hold through TP1 for TP2 or TP3
Conservative: Full exit at TP1 (1:1 risk/reward)
After TP1 hits, consider moving stop to breakeven
TP3 rarely hits - only on strong trending days
### Filter Combinations
Maximum Quality: Volume + Trend + FVG (fewest signals, highest quality)
Balanced: Volume + Trend (good quality, reasonable frequency)
Active Trading: No filters or Volume only (many signals, lower quality)
Trending Markets: Trend filter essential (indices, crypto)
Range-Bound: Volume + FVG (avoid trend filter)
### Common Mistakes to Avoid
Chasing breakouts - wait for the bar to close, don't FOMO into wicks
Ignoring the stop loss - always use it, move it manually if needed
Over-leveraging - the calculator shows MAX shares, you can buy less
Trading every signal - quality > quantity, use filters
Not tracking results - keep a journal to see what works for YOU
## Pros and Cons
### Advantages
Complete all-in-one solution - from signal to position sizing
Multiple timeframes tracked simultaneously
Visual clarity - easy to see what's happening
Cycle tracking catches opportunities others miss
Built-in risk management eliminates guesswork
Customizable filters for different trading styles
No repainting - what you see is locked in
Works across multiple markets (stocks, forex, crypto)
### Limitations
Intraday strategy only - doesn't work on daily charts
Requires active monitoring during first 1-2 hours of session
Not suitable for after-hours or extended sessions by default
Can produce many signals in choppy markets (use filters)
Dashboard can be overwhelming for complete beginners
Performance depends on market conditions (trends vs ranges)
Requires understanding of risk management concepts
### Best For
Day traders who can watch the first 1-2 hours of market open
Traders who want systematic entry/exit rules
Those learning proper position sizing and risk management
Active traders comfortable with multiple signals per day
Anyone trading liquid instruments with clear sessions
### Not Ideal For
Swing traders holding multi-day positions
Set-and-forget / passive investors
Traders who can't watch market open
Complete beginners unfamiliar with trading concepts
Low volume / illiquid instruments
## Frequently Asked Questions
Q: Why are no signals appearing?
A: Check that you're on an intraday timeframe (5min, 15min, etc.) and that the current time is within your session hours. Also verify that "Enable Breakout Detection" is ON and at least one ORB stage is enabled. If using filters, they might be blocking signals - try disabling them temporarily.
Q: What's the best ORB stage to use?
A: ORB15 (15 minutes) is most popular and balanced. ORB5 gives faster signals but more noise. ORB30 and ORB60 are slower but more reliable. Many traders use ORB15 + ORB30 together.
Q: Should I enable all the filters?
A: Start with no filters to see all signals. If too many false signals, add Volume filter first (stocks) or Trend filter (trending markets). FVG filter is most restrictive - use for maximum quality but fewer signals.
Q: How do I know which stop loss method to use?
A: ATR works for most cases - it adapts to volatility. Use ORB% if you want predictable stop placement. Swing is for respecting chart structure. Safer gives you the most room but largest risk.
Q: Can I use this for swing trading?
A: Not really - ORB is fundamentally an intraday strategy. The ranges reset each day. For swing trading, look at weekly support/resistance or moving averages instead.
Q: Why do TP/SL lines disappear sometimes?
A: Lines freeze (stop extending) when: stop loss is hit, the last enabled take-profit is hit, or end of session arrives (if "Freeze at EOD" is enabled). This is intentional - the trade is complete.
Q: What's the difference between "First Only" and "Track Cycles"?
A: "First Only" shows one breakout UP and one DOWN per day maximum - clean but might miss opportunities. "Track Cycles" shows breakout-retest-rebreak sequences - more signals but busier chart.
Q: Is position sizing accurate for options/forex?
A: The calculator is designed for shares (stocks). For options, ignore the share count and use the risk amount. For forex, you'll need to adapt the lot size calculation manually.
Q: How much capital do I need to use this?
A: The indicator works for any account size, but practical day trading typically requires $25,000 in the US due to Pattern Day Trader rules. Adjust the "Account Size" setting to match your capital.
Q: Can I backtest this strategy?
A: This is an indicator, not a strategy script, so it doesn't have built-in backtesting. You can visually review historical signals or code a strategy script using similar logic.
Q: Why does the dashboard show different entry price than the breakout label?
A: If you're looking at an old breakout, the ORB levels may have changed when the next stage completed. The dashboard always shows the CURRENT active range and trade setup.
Q: What's a good win rate to expect?
A: ORB strategies typically see 40-60% win rate depending on market conditions and filters used. The strategy relies on positive risk/reward ratios (2:1 or better) to be profitable even with moderate win rates.
Q: Does this work on crypto?
A: Yes, but crypto trades 24/7 so you need to define what "session start" means. Use Session Mode = Custom and set your preferred daily reset time (e.g., 0000-2359 UTC).
## Credits & Transparency
### Development
This indicator was developed with the assistance of AI technology to implement complex ORB trading logic.
The strategy concept, feature specifications, and trading logic were designed by the publisher. The implementation leverages modern development tools to ensure:
Clean, efficient, and maintainable code
Comprehensive error handling and input validation
Detailed documentation and user guidance
Performance optimization
### Trading Concepts
This indicator implements several public domain trading concepts:
Opening Range Breakout (ORB): Trading strategy popularized by Toby Crabel, Mark Fisher and many more talanted traders.
Fair Value Gap (FVG): Price imbalance concept from ICT methodology
SuperTrend: ATR-based trend indicator using public formula
Risk/Reward Ratio: Standard risk management principle
All mathematical formulas and technical concepts used are in the public domain.
### Pine Script
Uses standard TradingView built-in functions:
ta.ema(), ta.atr(), ta.vwap(), ta.highest(), ta.lowest(), request.security()
No external libraries or proprietary code from other authors.
## Disclaimer
This indicator is provided for educational and informational purposes only. It is not financial advice.
Trading involves substantial risk of loss and is not suitable for every investor. Past performance shown in examples is not indicative of future results.
The indicator provides signals and calculations, but trading decisions are solely your responsibility. Always:
Test strategies on paper before using real money
Never risk more than you can afford to lose
Understand that all trading involves risk
Consider seeking advice from a licensed financial advisor
The publisher makes no guarantees regarding accuracy, profitability, or performance. Use at your own risk.
---
Version: 3.0
Pine Script Version: v6
Last Updated: October 2024
For support, questions, or suggestions, please comment below or send a private message.
---
Happy trading, and remember: consistent risk management beats perfect entry timing every time.

Intraday Buy/Sell/Average Zones by Chaitu50cIntraday Buy/Sell/Average Zones by chaitu50c
Timeframe:
Tested on the 5-minute chart.
Recommended timeframe: 5-minute
What it does
This indicator marks intraday Buy (green) and Sell (red) zones made by strong close-confirmed breakouts. These zones act as support/resistance. If price later closes through a zone, the zone changes color from that bar forward (support ↔ resistance). It can flip more than once.
How zones form
Single breakout: an opposite-type candle closes beyond the previous candle’s high/low.
Double breakout: a base candle, then two opposite-type candles, and the second one closes beyond the base high/low.
Zone size
Buy zone: from the combo lowest low up to the nearest open/close of the combo.
Sell zone: from the combo highest high down to the nearest open/close of the combo.
Color shift (optional)
If price closes through a zone, it flips color at that bar and behaves as the other side (support ↔ resistance). Flips can happen again later.
Overlap control
When a new zone overlaps an existing same-color zone in the same session, choose:
Merge (combine), or
Suppress (ignore the new one).
Flipped zones use their current color for this.
Right edge & session
All zones extend to the right (your offset). Detection is limited to your chosen session, and you can show only the last N sessions.
---
How to trade (simple)
A) Initial breakout trade
When a new zone forms, that breakout itself can be a trade idea in the breakout direction, The stoploss will be the zone.
B) Zone breakout trade (flip)
If price later closes out of a zone and it changes color, that breakout is another trade opportunity in the new direction.
C) Retrace & average trade
When price retests a zone, wait for a confirmation candle in the zone’s favor
— bullish close for a green zone, bearish close for a red zone — then average entries inside/near the zone.
Place stops just beyond the opposite edge of the zone.
If the zone flips color, stop averaging; bias changed.
---
Key settings
Breakout type: Single and/or Double
Confirm on Close: strict mode (no intrabar preview) or allow intrabar preview that auto-removes if fail
Color Shift on Breaks: on/off
Same-Type Overlap: Merge/Suppress
Session, Sessions to Display, Right Offset, Colors, Max Zones
Reminder: Best results on the 5-minute timeframe (tested and recommended).

Interval Highlighter with High/Low AlertsInterval Highlighter with High/Low Alerts
Overview:
This Pine Script indicator enhances chart analysis by highlighting specific time intervals and marking the highest and lowest prices within those periods. It supports three customizable modes:
Date Range: Highlight a user-defined period with background shading and plot the highest and lowest prices.
Days of the Week: Highlight specific weekdays with background colors and plot the highest and lowest prices for each day.
Intraday Interval: Highlight a specific intraday time range (e.g., 12:30 PM to 4:30 PM) with background shading and plot the highest and lowest prices within that interval.
Alerts are triggered when the price touches any of the highlighted high or low levels, providing real-time notifications for potential trading opportunities.
High and low lines extend to the right and remain visible after the interval ends. This ensures they act as actionable reference points for alerts between intervals, allowing users to monitor critical levels until a new interval of the same category forms.
Features:
Customizable Time Intervals: Define specific date ranges, weekdays, or intraday intervals to highlight on the chart.
High/Low Tracking: Automatically plots the highest and lowest prices within the defined intervals.
Real-Time Alerts: Set up alerts to notify when the price touches any of the highlighted high or low levels.
Actionable Lines: High/low lines remain visible after interval completion to serve as reference points for alerts.
Visual Enhancements: Customize background colors and line styles for each interval type.
Usage:
Apply the indicator to your chart.
Configure the desired modes (Date Range, Days of the Week, Intraday Interval) in the settings.
Customize the appearance settings to match your preferences.
Set up alerts based on the highlighted high/low levels.
Disclaimer:
This indicator is designed to assist in identifying potential areas of interest based on historical high and low levels within specified intervals. It is not intended as a standalone trading signal. Users should employ additional technical analysis tools and conduct thorough research before making trading decisions.
