Trendlines Boll Ichi S1 by GammaprodI. How to use this indicator :
------------------------------
I.1. Set your teadingview theme to dark theme.
I.2. Gammaprod indicator is valid for forex, stock and but more valid for crypto.
I.3. Use three timeframe for more validation (choose between those, that fit to your trading style) :
- Timeframe 1m, 5m, and 15m for Scalping
- Timeframe 30m, 1h and 4h for Intraday
- Timeframe 4h, 1D and 1W for Swing Trading
I.4 Always use THREE INDICATORS FROM GAMMAPROD, those three indicators is back to back each other, by the way, I only made those three indicators only (for now) :
- Trendlines Boll Ichi S1 by Gammaprod
- MACD Volume S2 by Gammaprod
- Stoch RSI Divs Zone S2 by Gammaprod
============================================================================
II. How to setting :
--------------------
II.1. Trendlines Boll Ichi Crypto by Gammaprod
II.1.A. Support and Resistance
- Well if you familiar with this indicator you can add it, but recommended for Timeframe 30m or more
II.1.B. Trendlines Primary or Trendlines Secondary
- Timeframe 1m you DON'T NEED Trendlines Primary or Trendlines Secondary
- Timeframe 5m you DON'T NEED Trendlines Secondary, but you CAN ADD Trendlines Primary if you fell it helpful (for me, it is helpful to find where the candles start or the end trend or a consolidation or where the candles will surpass a resistance or a support).
- Timeframe 15m you DON'T NEED Trendlines Secondary, DEFENITELY add Trendlines Primary it will help to find where the candles stop or a consolidation or where the candles will surpass a resistance or a support).
- Timeframe 30m or more, DEFENITELY NEED BOTH Trendlines Primary and Secondary Trendlines, it will help to find where the candle stop or consolidation or where the candle will surpass a resistance or support).
II.1.C. Bollinger, Ichimoku Cloud and Lagging Span
- Please DON'T CHANGE IT at all, it's really helpful to know when and where to make an entry decesion or a trend or a consolidation, if you don't understand how to read it, you better to learn it first (on "how to read" section and "How to OPEN position" the section below)
II.2. Stoch RSI Divs Zone Crypto by Gammaprod (DON'T CHANGE IT)
II.3. MACD Volume Crypto by Gammaprod (DON'T CHANGE IT)
============================================================================
III. How to read :
------------------
III.1. Sell or Buy Priority :
III.1.A. Sell Priority
- Color background on macd and stoch rsi is pink or purple sell is the priority, (if you're not sure to buy, just wait until the best moment to sell)
III.1.B. Buy Priority
- Color background on macd and stoch rsi Teal or light green buy is the priority, (if you're not sure to sell, just wait until the best moment to buy)
III.1.C. Indecision / Golden Moment
- Color background on stoch rsi yellow is indecision / golden moment of reversal pattern (wait until it formed background only on Stoch RSI), please be careful at this moment.
III.2. Trend / Consolidation :
III.2.A. BULLISH trend
- When Stoch RSI and MACD have teal or light green background that's means BULLISH trend, better to confirm by the candle is above green cloud and lagging span (red line) is also above the candle.
III.2.B. BEARISH trend
- When Stoch RSI and MACD have the Pink or purple background that's means BEARISH trend, better to confirm by the candle is above purple cloud and lagging span (red line) is also below the candle.
III.2.C. CONSOLIDATION
- When Stoch RSI have the mix background that's means CONSOLIDATION, better to confirm by the candle is in or near to green / purple cloud and lagging span (red line) is also on the candle.
III.3. Special Mark
III.3.A. Ideal Bullish :
- Near line 20 and green / teal background = When Stoch RSI have the char R / H on lime color label, that's means divergence or hidden divergence for buy position, if you not see this label that's means just a standard confirmation for buy
III.3.B. Not an Ideal Bullish :
- Near line 80 and green / teal background = if this happens make sure you know what happen, it could be a false signal or bullish continual pattern
III.3.C. Ideal Bearish :
- Near line 80 and pink / purple background = When Stoch RSI have the char R / H on lime color label, that's means divergence or hidden divergence for buy position, if you not see this label that's means just a standard confirmation for sell position.
III.3.D. Not an Ideal Bearish:
- Near line 20 and pink / purple background = if this happens make sure you know what happen, it could be a false signal or bearish continual pattern
III.3.E. The Beginning of Reversal (from BEARISH to BULLISH) :
- When Stoch RSI line shaping GREEN position is near 20.
- MACD lines still PINK, position lines is UNDER the HISTOGRAM, but the HISTOGRAM start to SHAPE FALL PINK (light pink) and the BACKGROUND still PINK / PURPLE.
- Position CANDLES NEAR BLUE line, NEAR PURPLE CLOUD, and lagging span (red line) STILL ON the area candle. (it used to be confirmed with the golden moment).
III.3.F. The Beginning of Reversal (from BULLISH to BEARISH) :
- When Stoch RSI line shaping PINK position is near 80.
- MACD lines still GREEN, position lines is ABOVE the HISTOGRAM, but the HISTOGRAM start to SHAPE FALL GREEN (light green) and the BACKGROUND still TEAL / GREEN.
- Position CANDLES NEAR WHITE line, NEAR TEAL CLOUD, and lagging span (red line) STILL ON the area candle. (it used to be confirmed with the golden moment).
III.3.G. False Signals, or It could be a Golden Moment (better to see it on TF 15 or bigger):
- Near line 20 or 80 and yellow background = When Stoch RSI have the char R / H on color label, that's means divergence or hidden divergence for buy / sell position, if you not see this label that's means just a standard confirmation for buy / sell depends on where the Stoch RSI line if near 20 that's means buy, near 80 means sell
============================================================================
IV. How to OPEN position:
-------------------------
IV.1. Bullish
IV.1.A. Trendlines Boll Ichi S1 by Gammaprod
- The candles above the green cloud.
- Lagging span (red line) above the candles.
- then open buy near yellow line (the first option) / blue line (the second option) (always confirm the position with two other indicators below).
IV.1.B. MACD Volume S2 by Gammaprod
- Teal or Green background.
- The lines is shaped or shaping green.
- Better if at the green histogram.
IV.1.C. Stoch RSI Divs Zone S3 by Gammaprod
- Teal or Green background.
- The lines is shaping green.
- Better if on the bottom (at a range 20).
IV.2. Bearish
IV.2.A. Trendlines Boll Ichi S1 by Gammaprod
- The candles below the purple cloud.
- Lagging span (red line) below the candles.
- then open buy near yellow line (the first option) / white line (the second option) (always confirm the position with two other indicators below).
IV.2.B. MACD Volume S2 by Gammaprod
- Pink or purple background.
- The lines are shaped or shaping green.
- Better if at the pink histogram.
IV.2.C. Stoch RSI Divs Zone S3 by Gammaprod
- Pink or purple background.
- The lines are shaping pink.
- Better if the line on the top (at a range 80).
IV.3. Consolidation
IV.3.A. Trendlines Boll Ichi S1 by Gammaprod
- The candles on the cloud (green or purple).
- Lagging span (red line) on the candles.
- then open buy near the white or blue line (always confirm the position with two other indicators below).
IV.3.B. MACD Volume S2 by Gammaprod
- Changing the background.
- The line is near the middle line.
- Have small Histogram.
IV.3.C. Stoch RSI Divs Zone S3 by Gammaprod
- Mix background specially on a timeframe 15m or more.
- The line move fast up and down.
- Better if on the bottom or the top of the lines (at a range 20 or 80).
============================================================================
>> The secret ingredient is comparing the timeframe :
The example scalping (Timeframe 1m, 5m and 15m)
- TF 1m is for making an open position.
- TF 5m is for making a judgement of the trend market.
- TF 15m is to confirm that judgement from TF 5m, be careful if it not similar then it used to be a consolidation or the beginning of the reversal.
There's a lot a way to open the position than above information that i gave it to you, but consider there are a limit chars on this column, I hope it will help your trading and make a more profit on it.
Cari dalam skrip untuk "support"

LV Support&Resistancegives rough predictions on support and resistance levels by using rma and fibo numbers.
white color is the original rma250 value.
(Note: it is more easy to see them on logarithmic scale)

Breach v3 BetaThis is a script that allows you to toggle multiple indicators related to support and resistance, CCI, and Breaches (Crossovers based on William's Fractals).
How to use:
Custom Timeframe (Minutes) - To compare to current candles
Crossovers on custom - Crossovers and breaches on custom timeframe (Blue Triangle up)
Crossunders on custom - Crossunders and breaches on custom timeframe (Blue Triangle down)
Crossovers on current candles - Crossovers and breaches on current timeframe/Candlestick (Purple Triangle up)
Crossunder on current candles - Crossunders and breaches on current timeframe/Candlestick (Purple Triangle down)
CCI - CCI Trend indicator (red/green dots)
CCI - window - Input CCI window size in candlesticks (Integer)
Resistance on current candles - Resistance on current candles (Green Line)
Support on current candles - Support on current candles (Red Line)
Resistance - Custom - Resistance line based on Custom Timeframe (Blue Line)
Support - Custom - Support line based on Custom Timeframe (Purple Line)
Price on current support/resistance - Label displaying the price of current (candlestick) support/resistance
Price on custom support/resistance - Label displaying the price of custom (Custom Timeframe) support/resistance

Volume-Supported Linear Regression TrendHello Traders,
Linear Regression gives us some abilities to calculate the trend and if we combine it with volume then we may get very good results. Because if there is no volume support at up/downtrends then the trend may have a reversal soon. we also need to check the trend in different periods. With all this info, I developed Volume-Supported Linear Regression Trend script. The script checks linear regression of price and volume and then calculates trend direction and strength.
You have option to set Source, Short-Term Period and Long-Term Period. you can set them as you wish.
By default:
Close is used as "Source"
Short-Term Period is 20
Long-Term Period is 50
in following screenshot I tried to explain short term trend (for uptrend). Volume supports the trend? any volume pressure on trend? possible reversal? same idea while there is downtrend.
in following screenshot I tried to explain long term trend:
You can also check Positive/Negative Divergences to figure out possible reversals (to automate it, you can use Divergence for Many Indicators v4 , it has ability to check divergences on external indicators)
Enjoy!

TM_INTRADAY_LEVELTM_INTRADAY_LEVEL tool shows overall market price structure of market for Intraday Position. It can be used with TM_GANN_LEVELS tool
Terminology Use ==> Price Line, Price Level name and Price level
Timeframe ==> Use proper Signal with swing trend on 15 Min. or lower time frame (Best if Use with 15 Minutes chart or 5 Min. chart).
What to Identify ==> Overall market price structure for the Intraday Period
How to Use ==>
There are Many Line in price level chart
Green/red with Solid for important area of support or resistance
Other dotted lines are for retracement or extension of prices.
Important Structure==> Price behaviors on all lines of possible support and resistance
Use market structure, chart pattern, trend lines for more support..
Entry ==>
Let’s wait the proper area of support or resistance (Area of Value in case of trend pattern use)
Exit ==>
SL of swing high/low out of market structure with proper risk management and target with proper Risk/ Reward Ratio
Use the Below Contacts to Access this Indicator

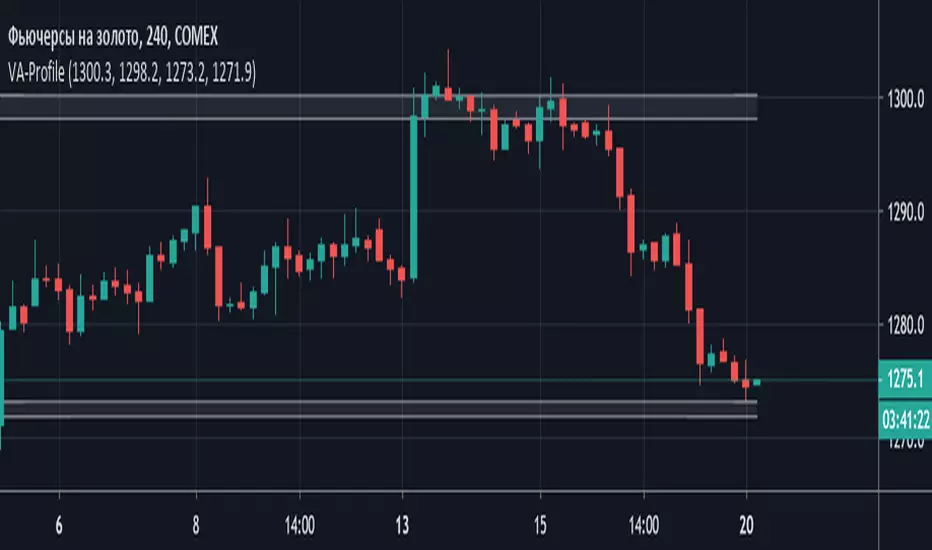
Volume Area Profile (Индикатор горизонтальных объемов)Volume Area Profile (Индикатор горизонтальных объемов)
Данные введены для графика GC!- Futures Gold - Дата: 20 мая 2019
Индикатор интегрирует данные полученные Вами после анализа кластерного графика объемов цены и строит зоны профиля объемных уровней поддержки и сопротивления
Необходимо отредактировать входные параметры:
Resistance_max - верхняя граница зоны сопротивления
Resistance_min - нижняя граница зоны сопротивления
Support_max - верхняя граница зоны поддержки
Support_min - нижняя граница зоны поддержки
Ripster EMA Clouds with MTFCredits & Origins:
This script is a modification of the widely popular EMA Clouds system originally created by @Ripster47. Full credit goes to him for the strategy and original concept. This version simply adds a quality-of-life feature for traders who use multi-timeframe analysis.
What is this Indicator?
The Ripster EMA Clouds system uses overlapping Exponential Moving Averages (EMAs) to visualize trends, momentum, and dynamic support/resistance zones. The "clouds" differ in color to indicate bullish or bearish trends, acting as a visual guide for keeping you on the right side of the trade.
What is New in This Version? (MTF Capability)
The standard version of this indicator calculates EMAs based on your current chart timeframe. If you switch from a 10-minute chart to a 1-minute chart, the clouds change completely.
I have added a "Fixed Timeframe" variable/input that allows you to "lock" the clouds to a specific timeframe, regardless of what chart you are viewing.
Why is this useful? This allows for true Multi-Timeframe (MTF) scalping.
Example: You can set the clouds to look at the 10-minute trend (identifying major support levels) but execute your entries on a 1-minute chart.
The clouds will remain locked to the 10-minute data, giving you the "big picture" view while you trade the micro-movements.
How to Use
Open the indicator settings.
Go to the Inputs tab.
Find the "Fixed Timeframe" option at the top.
Leave Empty (Default): The indicator behaves exactly like the original (adjusts to your chart).
Select a Timeframe (e.g., 10 Minutes): The clouds will lock to the 10-minute EMAs, even if you switch your chart to 1-minute or 5-seconds.
Note on Visuals When viewing Higher Timeframe (HTF) clouds on a Lower Timeframe (LTF) chart, the clouds will appear to have a "stepped" or "ladder-like" appearance. This is normal and accurate. It represents the single EMA value holding constant for that entire higher-timeframe period. This helps you see the true support level rather than a smoothed, repainted line.

VSB: Grandmaster Ecosystem📌 Description — VSB: Grandmaster Ecosystem
VSB: Grandmaster Ecosystem is a context-first market structure and expansion framework, designed to identify high-quality breakout scenarios derived from price compression, liquidity behavior, and controlled volatility release.
This script is not a trading system and does not execute or simulate trades.
It provides structured, probabilistic context to support discretionary decision-making.
🔍 Conceptual Overview
Unlike classic trend or momentum indicators, VSB does not rely on oscillators, moving-average crossovers, or retrospective signals.
Instead, it models how price contracts, stores potential energy, and then expands following a valid structural resolution.
The ecosystem is built around four tightly integrated analytical layers:
1️⃣ Adaptive Compression Channels (Core Engine)
VSB dynamically detects price compression zones using an adaptive statistical range rather than fixed lookback bands.
Channels are constructed only when volatility compression is detected.
Width, persistence, and decay are dynamically adjusted to market conditions.
Channels are invalidated if price behavior no longer supports controlled compression.
This avoids static ranges and prevents repaint-driven “perfect boxes”.
2️⃣ Liquidity Sweep & Expansion Logic
Breakouts are validated only when price demonstrates:
A liquidity probe (wick-based sweep beyond the channel boundary),
Followed by a decisive close back inside or beyond structure,
And a confirmed expansion impulse.
This sequence filters false breakouts and avoids entries triggered by random volatility spikes.
3️⃣ Authority Scoring System (Probabilistic Context)
Each valid expansion is evaluated through an Authority Score, which synthesizes:
Compression quality and duration,
Expansion strength,
Session alignment,
Structural cleanliness (absence of noise and overlap).
Signals are classified into hierarchical tiers:
Weak
Standard
Diamond (highest structural authority)
This is not a win-rate claim, but a relative quality index to compare setups within the same market regime.
4️⃣ Risk & Session Context (Informational)
VSB includes informational risk metrics derived from historical behavior patterns:
Volatility expansion efficiency
Drawdown pressure
Session-based expectancy bias
These values are theoretical estimates, displayed purely for contextual awareness.
They do not calculate position size, entries, exits, or financial risk.
🧩 Why This Is Not a “Mashup”
VSB does not merge unrelated indicators.
Each component exists to support a single analytical thesis:
High-probability price expansion emerges from structured compression and liquidity resolution.
Channels define where energy accumulates.
Sweep logic defines how liquidity is engaged.
Authority scoring defines when expansion quality is meaningful.
Session context defines if conditions are favorable.
Removing any layer breaks the model’s internal coherence.
🧠 How to Use
Recommended use:
Timeframes: intraday (5m–30m) or swing (1H–4H)
Markets: FX, Indices, Crypto (liquid instruments)
Typical workflow:
Identify a valid compression channel.
Wait for a confirmed sweep + expansion.
Use the Authority tier to contextualize signal quality.
Combine with your own execution rules (lower TF, order flow, price action).
VSB is designed to be a decision-support framework, not an entry generator.
⚠️ Important Notes
This script does not repaint historical signals.
It does not provide trade recommendations.
It does not replace risk management or execution logic.
All metrics are contextual and informational only.
🧾 Open-Source & Originality
This script is published as open-source.
All logic is original or significantly re-engineered.
If any open-source concepts are referenced, they are used as minor components within a substantially original architecture and do not constitute the core engine.
✅ Summary
VSB: Grandmaster Ecosystem is a market structure and expansion framework for traders who want:
Fewer but higher-quality signals,
Context over noise,
Structure over indicators.
It is built for clarity, discipline, and probabilistic thinking, not automation.

NVentures Liquidity Radar ProInstitutional Liquidity Radar Pro
OVERVIEW
This indicator combines three institutional trading concepts into a unified confluence scoring system: Liquidity Zones (swing-based), Order Blocks, and Fair Value Gaps. The unique value lies not in these individual concepts, but in HOW they interact through the confluence scoring algorithm to filter high-probability zones.
HOW THE CONFLUENCE SCORING WORKS
The core innovation is the calcConfluence() function that assigns a numerical score to each detected level:
1. Base Score: Every swing pivot starts with score = 1
2. Zone Overlap Detection: The algorithm iterates through all active zones within confDist * ATR proximity. Each overlapping zone adds +1 to the score
3. Order Block Proximity: If an Order Block's midpoint (top + bottom) / 2 falls within the confluence distance, +1 is added
4. HTF Validation: Using request.security(), the indicator fetches higher timeframe swing pivots. If the current zone aligns with an HTF swing within 2 * confDist * ATR_htf, a +2 bonus is awarded
Zones scoring 4+ are highlighted as high confluence - these represent areas where multiple institutional concepts converge.
HOW LIQUIDITY ZONES ARE CALCULATED
Detection: ta.pivothigh() and ta.pivotlow() with configurable lookback (default: 5 bars left/right)
Zone Width - Three modes available:
- ATR Dynamic: ATR(14) * multiplier (default 0.25)
- Fixed %: close * (percentage / 100)
- Wick Based: max(upperWick, lowerWick) * 1.5
Proximity Filter: isTooClose() prevents clustering by enforcing minimum ATR * minATRdist between zones
HOW ORDER BLOCKS ARE DETECTED
The detectBullishOB() / detectBearishOB() functions identify the last opposing candle before an impulse move:
1. Check if candle is opposing direction (bearish before bullish impulse, vice versa)
2. Validate consecutive candles in impulse direction (configurable, default: 3)
3. Volume confirmation: volume >= volMA * volMult (using 50-period SMA)
4. Minimum move validation: abs(close - close ) > ATR
This filters out weak OBs and focuses on those with institutional volume footprints.
HOW FAIR VALUE GAPS ARE DETECTED
FVGs represent price imbalances:
- Bullish FVG: low - high > ATR * fvgMinSize
- Bearish FVG: low - high > ATR * fvgMinSize
The ATR-relative sizing ensures gaps are significant relative to current volatility.
HOW SWEEP DETECTION WORKS
The checkSweep() function identifies false breakouts through wick analysis:
1. Calculate wick percentage: upperWick / totalRange or lowerWick / totalRange
2. Sweep conditions for resistance: high > zone.upper AND close < zone.price AND wickPct >= threshold
3. Sweep conditions for support: low < zone.lower AND close > zone.price AND wickPct >= threshold
A sweep indicates liquidity was grabbed without genuine continuation - often preceding reversals.
HOW FRESHNESS DECAY WORKS
The calcFreshness() function implements linear decay:
freshness = 1.0 - (age / decayBars)
freshness = max(freshness, minFresh)
This ensures old, tested zones fade visually while fresh zones remain prominent.
WHY THESE COMPONENTS WORK TOGETHER
The synergy is based on the principle that institutional activity leaves multiple footprints:
- Swing Pivots = where retail stops cluster
- Order Blocks = where institutions entered
- FVGs = where aggressive institutional orders created imbalances
- HTF Alignment = where higher timeframe participants are active
When these footprints converge at the same price level (high confluence score), the probability of significant price reaction increases.
CONFIGURATION
- Swing Detection Length: 5-8 for intraday, 8-15 for swing trading
- HTF Timeframe: One level above trading TF (e.g., D for H4)
- Min Confluence to Display: 2 for comprehensive view, 3-4 for high-probability only
- FVGs: Disabled by default for cleaner charts
STATISTICS PANEL
Displays: Active resistance/support zones, high confluence count, swept zones, active OBs, active FVGs, current ATR, selected HTF.
ALERTS
- Price approaching high confluence zone
- Liquidity sweep detected
- Bullish/Bearish Order Block formed
- Bullish/Bearish FVG detected
TECHNICAL NOTES
- Uses User-Defined Types (UDTs) for clean data structure management
- Respects Pine Script drawing limits (500 boxes/labels/lines)
- All calculations are ATR-normalized for cross-market compatibility

Previous Periods Highs and Lows + LabelsThis indicator plots the high and low prices from the previous Day, Week, and Month as horizontal lines on any timeframe chart. It provides clear visual reference to key historical support and resistance levels commonly used by traders for: breakout and reversal identification
stop-loss placement
target setting
Features include distinct colors for each period and optional price labels displayed on the right side of the chart for quick reference.Simple, non-repainting, and optimized for both intraday and swing trading setups.

Liquidity Zones | NRP | ProjectSyndicate🏦 ProjectSyndicate Liquidity Zones 1.0 — Complete Documentation
Specifically built for: XAUUSD (Gold) 🥇, NQ 💻, ES 📈 and FX 💱 traders
✅Default settings: tuned to work well across multiple timeframes
Best sweet spot timeframes : M5 / M15 / M30 / H1 → consistently produces high-quality zones
________________________________________
🌍 Overview
ProjectSyndicate Liquidity Zones is a Pine Script v6 indicator built to identify stop-loss hunting zones and liquidity pockets—areas where price frequently sweeps retail stops and then reverses.
It automatically detects and draws zones where institutional flow often triggers liquidity before moving price in the opposite direction.
________________________________________
💧 What Are Liquidity Zones?
Liquidity zones are price levels where stop-loss orders cluster (often around swing highs/lows). Large players may push price into these levels to trigger stops (liquidity sweep) and then reverse.
Also known as:
• 🪤 Stop-loss hunting
• 🌊 Liquidity sweeps
• 🎯 Stop runs
________________________________________
🥇 Why Gold, NQ, ES & FX?
These markets often show repeatable liquidity behavior because of:
• 👥 Heavy participation and predictable stop placement
• 🏛️ Strong institutional activity and order flow
• ⚡ Volatility that enables fast “sweep & reverse” moves
• 📍 Clear technical levels where stops tend to cluster
________________________________________
⚙️ How It Works (3 Detection Engines)
1) 🔺 Pivot-Based Detection
Finds swing highs/lows using fractal pivots—natural stop placement zones.
2) 🕯️ Wick Trap Detection
Flags candles with dominant wicks (long rejection shadows), suggesting stops were hit then price snapped back.
3) 📊 Volume Spike Detection
Marks extremes where volume is elevated (local highs/lows). High volume at extremes often signals liquidity being triggered.
________________________________________
🧩 Zone Types
🟦 Bull Liquidity Zones (Teal/Cyan)
• 📍 Below current price (support area)
• 🧠 Indicates buy-side stops were swept (longs got hunted)
• 📈 Often becomes a potential reversal zone upward
• ✅ Idea: Look for bullish confirmation after a sweep
🟥 Bear Liquidity Zones (Maroon/Red)
• 📍 Above current price (resistance area)
• 🧠 Indicates sell-side stops were swept (shorts got hunted)
• 📉 Often becomes a potential reversal zone downward
• ✅ Idea: Look for bearish confirmation after a sweep
⚪ Historic Zones (Gray)
• 🕰️ Zones that were breached
• 📚 Useful for studying past behavior and sweep patterns
• ❗ Not considered “active”, but great for context
________________________________________
🛠️ Settings Guide
🔎 Detection Settings
🔺 Pivot Detection Length (Default: 10)
• Range: 3 → 50
• Controls swing sensitivity
• Lower (5–8): more zones, faster, noisier ⚡
• Higher (15–20): fewer zones, stronger, cleaner ✅
Recommended (XAUUSD / NQ / ES / FX):
• ⏱️ M5 / M15: 8–10
• ⏱️ M30: 10–12
• ⏱️ H1: 12–15
🕯️ Wick Dominance Ratio (Default: 0.5)
• Range: 0.3 → 0.85
• 0.5 = wick must be ≥ 50% of candle range
• Lower: more traps detected
• Higher: only extreme rejections
✅ Recommended: 0.5–0.6 (balanced)
📊 Volume Spike Multiplier (Default: 1.3)
• Range: 1.0 → 4.0
• 1.3 = volume must be ≥ 130% of 20-period avg
• Lower: more signals
• Higher: only major spikes
✅ Recommended: 1.3–1.5
________________________________________
📦 Zone Settings
📏 Zone ATR Period (Default: 14)
• Range: 10 → 50
• Controls volatility measurement used for zone sizing
• Shorter = more responsive ⚡
• Longer = smoother ✅
✅ Recommended: 14–20
📐 Zone Width (ATR Multiple) (Default: 0.5)
• Range: 0.2 → 1.5
• 0.5 = zone extends 0.5 × ATR around the level
• Smaller (0.3–0.4) = tight & precise 🎯
• Larger (0.6–0.8) = wider coverage 🌊
✅ Recommended: 0.4–0.6
🧱 Max Zones (Default: 8)
• Range: 2 → 20
• Lower = cleaner chart 🧼
• Higher = more context 📚
✅ Recommended: 6–10
↔️ Min Zone Separation (ATR) (Default: 2.0)
• Range: 0.5 → 5.0
• Prevents zone clustering
• Lower = more zones (tighter stacking)
• Higher = fewer zones (cleaner layout)
✅ Recommended: 1.5–2.5
________________________________________
👁️ Display Options
• ✅ Show Current Zones (ON) → active bull/bear zones
• ⛔ Show Historic Zones (OFF) → breached zones in gray
• ✅ Show Zone Labels (ON) → quick identification
• ⛔ Show Pivot Markers (OFF) → optional triangles
• 🌫️ Zone Opacity (80) → suggested 75–85
• 🎨 Bull Color: Teal
• 🎨 Bear Color: Maroon
________________________________________
📈 Trading Strategies
🪤 Strategy 1: Liquidity Sweep Reversal
Steps:
1️⃣ Identify zone
2️⃣ Wait for price to sweep into zone (wick into it)
3️⃣ Confirm with rejection candle
4️⃣ Enter with stop beyond zone
✅ Example (concept): sweep → reclaim → continuation
________________________________________
🔁 Strategy 2: Zone-to-Zone Trading
• Sweep bull zone → target bear zone 🎯
• Sweep bear zone → target bull zone 🎯
Risk plan:
• 🛑 Stop: 1–2 ATR beyond zone
• 🎯 TP: next opposite zone or 2:1 RR
• 📦 Risk: 1–2% per trade
________________________________________
🧲 Strategy 3: Confluence Trading
Look for zones that align with:
• 🧮 Fibonacci (50 / 61.8)
• 🔢 Round numbers (e.g., 2600 / 2650 / 2700)
• 📅 Previous day high/low
• 📉 Trendlines / MAs
More confluence = stronger zone 💪
________________________________________
🕰️ Strategy 4: Historic Zone Analysis
Turn on historic zones and study:
• Did it reverse after breach?
• How far did it extend beyond?
• What did volume do?
Use these patterns to improve expectations on current zones 📚
________________________________________
⏱️ Timeframe Recommendations
M5
• 🏎️ Scalping, fast signals
• More zones, more noise
• Tight risk, quick exits
M15
• ⚖️ Best balance for intraday
• Strong zone quality + quantity
M30
• 🧘 Cleaner zones, stronger signals
• Wider stops, more patience
H1
• 🏗️ Highest-quality zones
• Fewer false signals, bigger targets
________________________________________
✅ Best Practices
Do’s ✅
• Wait for confirmation candles 🕯️
• Use multi-timeframe context (H1 zones + M15 entries) 🧭
• Combine with price action (engulfing / pin bars) 🎯
• Always use stops 🛑
• Study breached zones 📚
• Adapt settings to volatility 🌊
Don’ts ❌
• Don’t trade every zone blindly
• Don’t ignore context (trend/news/sentiment)
• Don’t overtrade
• Don’t treat settings as “one-size forever”
• Don’t fight strong trends without confirmation
________________________________________
🧠 Advanced Tips
🕒 Session-Based Behavior
• 🌙 Asia: zones often hold better (lower volatility)
• 🇬🇧 London: aggressive sweeps
• 🇺🇸 NY: continuations or major reversals
• 🔥 Overlaps: most volatile → strongest reactions
📰 News Awareness
High-impact events (CPI, NFP, FOMC) can:
• create zones rapidly ⚡
• invalidate zones ❗
• extend beyond zones 🎢
Tip: avoid trading zones during major releases
🧩 Multi-Timeframe Confirmation
• Find zone on H1
• Refine entry on M15
• Confirm structure shift / reaction before entry ✅
💪 Zone Strength Clues
Stronger zones often have:
• multiple detection methods (pivot + wick + volume)
• confluence with key levels
• recent formation
• clean first reaction
________________________________________
🧰 Troubleshooting
Too Many Zones
Try:
• Increase separation (2.5–3.0)
• Reduce max zones (5–6)
• Increase pivot length (12–15)
• Increase wick ratio (0.6–0.7)
Too Few Zones
Try:
• Decrease separation (1.0–1.5)
• Increase max zones (10–12)
• Reduce pivot length (7–8)
• Reduce wick ratio (0.4–0.5)
• Reduce volume multiplier (1.2)
🚫 Zones Not Showing
Check:
• “Show Current Zones” is ON ✅
• enough bars loaded
• try defaults first, then adjust
Historic Zones Not Appearing
• Price must breach zones first
• scroll back for older breaches
• increase max zones to store more
________________________________________
🔔 Indicator Alerts
🟥 Bear Liquidity Zone Detected
• Trigger: new resistance zone
• Message: “Bear liquidity hunting zone identified”
• Use: selling opportunities 🧲
🟦 Bull Liquidity Zone Detected
• Trigger: new support zone
• Message: “Bull liquidity hunting zone identified”
• Use: buying opportunities 🧲
Setup:
1️⃣ Right-click chart → Add Alert
2️⃣ Select indicator condition
3️⃣ Choose Bull/Bear alert
4️⃣ Select delivery method (popup/email/webhook)
________________________________________
⚡ Performance Notes
• 🧱 Max boxes: 500
• 🏷️ Max labels: 500
• 🪶 Lightweight / minimal lag
• ✅ No repaint (confirmed on bar close)
• 🔒 Zones stay fixed once created
________________________________________
🧾 Version History v1.0
• Pine Script v6
• 3 detection methods (pivot / wick / volume)
• Current + historic zones
• Custom colors & settings
• Built-in alerts
• Optimized defaults across M5/M15/M30/H1 for XAUUSD, NQ, ES, FX ✅
Can be also combined with Order Block Finder and FVG Finder
for complete / more advanced SMC strategy chart overlay.
✅ Order Block Finder | Gold | ProjectSyndicate
✅ FVG Finder | NRP | ProjectSyndicate

Smart Fixed Volume Profile [MarkitTick]💡 This comprehensive analysis suite integrates Auction Market Theory, structural gap analysis, and statistical liquidity strain modeling into a single, cohesive toolkit. Designed for traders who require a granular view of institutional order flow, this indicator overlays a Fixed Range Volume Profile with intelligent price gap classification and a volatility-adjusted exhaustion detector. By combining these three distinct analytical dimensions, it allows users to identify value consensus, structural breakouts, and potential market turns driven by liquidity shortages.
✨ Originality and Utility
While standard Volume Profiles display where trading occurred, this script advances the concept by contextually analyzing *how* price arrived at those levels. It solves the problem of isolated analysis by fusing three disparate methodologies:
Contextual Integration: It does not merely show support and resistance; it qualifies moves using "Smart Gaps" (classifying gaps based on market structure) and "Liquidity Strain" (identifying unsustainable price velocity).
Institutional Footprint: The inclusion of an "Unusual Volume" highlighter within the profile bars helps traders spot hidden institutional accumulation or distribution blocks that standard profiles miss.
Hybrid Logic: By combining a fixed-time profile (anchored to specific dates) with dynamic, developing gap analysis, it provides both a static roadmap of the past and a dynamic interpretation of current price action.
🔬 Methodology and Concepts
• Fixed Volume Profile Engine
The core of the indicator constructs a volume distribution histogram over a user-defined time window. It utilizes a custom aggregation engine that:
Fetches higher-timeframe volume and price data to ensure accuracy.
Segments the price range into specific "bins" or rows.
Allocates volume to these bins based on price action within the bar, separating Buying Volume (Up bars) from Selling Volume (Down bars).
Calculates the Point of Control (POC) —the price level with the highest traded volume—and the Value Area , which contains 70% (customizable) of the total volume centered around the POC.
• Smart Gap Logic
The script systematically identifies price gaps and classifies them based on their location relative to market pivots (Highs/Lows):
Breakaway Gaps: Occur when price gaps beyond a significant structural pivot (Lookback High/Low), signaling a potential trend initiation.
Runaway Gaps: Occur within an existing trend without breaking structure, indicating trend continuation.
Exhaustion Gaps: Identified when a gap occurs late in a mature trend (measured by bar count since the last pivot) accompanied by a volume spike, suggesting the trend is overextended.
• Liquidity Strain Detector
This module utilizes a statistical approach to measure market stress. It calculates "Illiquidity" by analyzing the ratio of True Range to Volume (Price Impact).
It applies a Logarithmic transformation to normalize the data.
It calculates a Z-Score (Standard Deviation from the mean) of this impact.
If the Z-Score exceeds a threshold (e.g., 2.0 Sigma) while the trend opposes the price move, it triggers an exhaustion signal, indicating that price is moving too easily on too little volume (thin liquidity).
🎨 Visual Guide
• Volume Profile Elements
Histogram Bars: Horizontal bars representing volume at price. Cyan indicates bullish volume; Red indicates bearish volume.
Unusual Volume Highlight: Bars with volume exceeding the average by a set factor (default 2x) are highlighted with brighter, distinct overlays to denote institutional interest.
POC Line: A solid Yellow line marking the price level with the highest volume.
VAH / VAL Lines: Dashed Blue lines marking the Value Area High and Value Area Low.
Background Box: A grey shaded area encapsulating the entire time and price range of the profile.
• Smart Gap Boxes
Blue Box (Breakaway): Marks the start of a new structural move.
Orange Box (Runaway): Marks continuation gaps in the middle of a trend.
Red Box (Exhaustion): Marks potential trend termination points.
Dotted Lines: Extend from the center of gap boxes to serve as future support/resistance levels. These boxes are automatically deleted if price "fills" or violates the gap level.
Note: This tool incorporates core components from [ Smart Gap Concepts ], optimized for this specific strategy.
• Liquidity Signals
Green Label (SE): "Seller Exhaustion" – Appears below bars in a downtrend when selling pressure is statistically overextended.
Red Label (BE): "Buyer Exhaustion" – Appears above bars in an uptrend when buying pressure is statistically overextended.
Note: This tool incorporates core components from [ Liquidity Strain Detector ], optimized for this specific strategy.
📖 How to Use
• Interactive Range Selection: This indicator features a flexible, interactive input system. Upon adding the script to your chart, execution is paused until the analysis range is defined. You will be prompted to click on the chart twice: first to establish the Start Date and second to establish the End Date. Once these anchor points are confirmed, the indicator will automatically load the data and generate the profile for the selected specific period.
● Strategies for Optimal Anchoring
the optimal starting and ending points for high-probability setups:
Swing Highs and Lows (Trend Analysis):
Anchor the Start Date at a major structural swing high or low and the End Date at the current price using the Extend to Present feature. This identifies the "Fair Value" for the entire price move .
Consolidation/Range Anchoring:
Set the Start Date at the first bar of a sideways range and the End Date at the breakout candle. This reveals the high-node volume clusters that will act as future support or resistance.
Session-Based Anchoring (Intraday):
Align the Start Date with the session open (e.g., London or New York open) to track institutional flow for that specific day .
Event-Driven Anchoring:
Place the Start Date on a significant news event or a Breakaway Gap identified by the script's Gap Engine. This helps determine if the new volume supports the direction of the gap.
Correction Cycles:
During a pullback, anchor the Start Date at the start of the correction to find the Value Area Low (VAL), which often serves as a tactical entry point for a trend continuation.
• Identifying Value:
Use the Value Area to gauge market consensus. Acceptance of price within the VA indicates balance. A breakout above VAH or below VAL suggests the market is searching for new value. The POC often acts as a magnet for price correction.
• Trading Breakouts:
Watch for Breakaway Gaps (Blue) that align with a move out of the Volume Profile's Value Area. This confluence increases the probability of a sustained trend.
• Spotting Reversals:
Combine Exhaustion Gaps (Red) with Liquidity Strain Signals (SE/BE) . If price gaps up into a low-volume node on the profile and prints a "Buyer Exhaustion" signal, it suggests the move is unsupported by liquidity and liable to reverse.
• Support and Resistance:
The extended dotted lines from the Smart Gap boxes act as dynamic support/resistance. A retest of a "Runaway Gap" is often a viable entry point for trend continuation.
⚙️ Inputs and Settings
• Global Profile:
Start/End Date: Define the exact window for the volume profile calculation.
Extend to Present: If checked, the profile updates with live data beyond the end date.
• Profile Settings:
Number of Rows: Determines the vertical resolution (granularity) of the histogram.
Value Area %: Default is 70%, representing one standard deviation of volume distribution.
Placement: Position the profile on the Left or Right of the defined range.
• Liquidity & Gaps:
Unusual Threshold: Multiplier of average volume to highlight institutional bars (default 2.0x).
Structure Lookback: Adjusts the sensitivity of pivot detection for gap classification.
Stress Threshold (Sigma): The Z-Score limit for triggering Liquidity Strain signals (default 2.0).
🔍 Deconstruction of the Underlying Scientific and Academic Framework
• Auction Market Theory (AMT):
The script is grounded in AMT, which posits that the market's primary function is to facilitate trade. The Volume Profile visualizes this by displaying a bell curve of price distribution. The Value Area (typically 70%) corresponds to the First Standard Deviation in a normal Gaussian distribution, representing the area of "Fair Value" where buyers and sellers agree.
• Market Microstructure & Kyle’s Lambda:
The Liquidity Strain module draws conceptually from Kyle’s Lambda, a metric in market microstructure that measures market depth and price impact (Illiquidity). By calculating the ratio of price change (True Range) to Volume, the script approximates the "cost" of moving the market.
• Statistical Z-Score Normalization:
To make the liquidity data actionable, the script applies Z-Score normalization: Z = (X - μ) / σ . This converts raw illiquidity values into standard deviations from the mean. A Z-Score above +2.0 signifies a statistically significant anomaly—an outlier event where price moved excessively relative to the volume traded, often preceding a mean-reversion event.
⚠️ Disclaimer
All provided scripts and indicators are strictly for educational exploration and must not be interpreted as financial advice or a recommendation to execute trades. I expressly disclaim all liability for any financial losses or damages that may result, directly or indirectly, from the reliance on or application of these tools. Market participation carries inherent risk where past performance never guarantees future returns, leaving all investment decisions and due diligence solely at your own discretion.

Professional Grid & Reversal Bot v10 (Binance Style)Professional Grid & Reversal Bot v10 (Binance Style) – Open Source & Educational
About this Script:
This script is an advanced Grid Trading & Smart Reversal strategy, inspired by professional Binance-style execution. It is designed as an educational, open-source tool for traders who want to understand market dynamics, grid logic, and risk management.
How it Works:
1️⃣ Grid Execution:
• Divides the price range between the high and low into multiple levels (Grids).
• Opens Buy orders in the lower half and Sell orders in the upper half.
• Levels are calculated dynamically based on the highest and lowest prices over a selected lookback period.
2️⃣ Smart Reversal System:
• Detects price touches on the high or low range boundaries to identify potential reversal points.
• Opens Buy orders at the lows and Sell orders at the highs using a configurable confirmation percentage (revPct).
• Helps traders capture short-term price swings effectively.
3️⃣ Risk & Size Management:
• Position sizing based on USD amount and leverage.
• Automatic Take Profit (TP) and Stop Loss (SL) for every trade.
• Controls overtrading via the "pyramiding" parameter (max open trades).
4️⃣ Advanced Visualization:
• Plots the grid range with high/low levels and fills the background for clear context.
• Highlights potential Supply and Demand Zones.
• Displays a dynamic "Binance-style" Order Book table showing Side, Price, Quantity, and PnL.
5️⃣ Key Counters & Indicators:
• levelsArr → Stores all grid levels for execution and plotting.
• touchedHigh / touchedLow → Monitors range touches to trigger reversals.
• strategy.openprofit → Displays live open trade PnL directly on the chart.
Additional Features:
• Supports both English and Arabic languages.
• Dark Theme optimized for readability.
• Dynamic control panel updates on every bar.
• Flexible settings for Auto or Manual grid range updates.
User Guidance:
• This script is for educational purposes only; it does not guarantee profits.
• We recommend adjusting Grid Levels, Reversal Percentage, and Trade Size to experiment with different strategies.
Community Engagement:
• Suggestions and improvements are welcome! 💡
• If you have ideas for new features, let's develop them together to enhance learning.
• Please support the script with a Like & Boost if you find it useful.
• Encourages knowledge sharing to improve collective performance.
License:
Creative Commons Attribution-NonCommercial 4.0 International (CC BY-NC 4.0)
Free for educational use only. Please give credit to the author when sharing or modifying the script.

All-in-one trend clarityTrendLens is a multi-layer, all-in-one overlay indicator designed to visually detect and filter market direction — not a buy/sell strategy.
It highlights early trend shifts based on candle behavior, then supports that view using Pivot High/Low structure, three customizable EMAs, and a visible daily session window to focus on active market hours.
What’s included (All inside one indicator)
Structural Trend Candles
If price closes above the highest high of the previous N bars → candle turns white (bullish structural breakout).
If price closes below the lowest low of the previous N bars → candle turns black (bearish structural breakdown).
Pivot High / Pivot Low Markers
Detects swing highs/lows using adjustable left/right bars (default 7) and plots small gray triangle markers on the chart.
Active Session Window
Highlights a fixed daily time window (default 06:00–18:00 UTC) with a transparent green background to visually mark the active trading session.
3 Customizable EMAs
EMA Fast (default 10)
EMA Mid (default 20)
EMA Long (default 100)
Each EMA supports custom length, source, color, and thickness.
How to use it
Use white/black candles as a quick trend filter and early structure shift cue.
Use EMA100 as the main trend bias reference; use EMA10/EMA20 positioning to gauge momentum.
Use Pivot High/Low to spot structure levels for potential support/resistance and risk management.
Enable the session highlight to focus analysis on high-activity hours.
Disclaimer
This indicator is a technical analysis helper, not a trading strategy.
It does not provide buy/sell recommendations. You are responsible for your own trade decisions and risk management.

Rolling Volume Structure: HVN & SentimentTitle:
Rolling Volume Structure: HVN & Sentiment
Description:
This indicator visualizes the distribution of volume over price levels for a user-defined rolling period. It is designed to identify structural market nodes (HVN/LVN) and correlate them with Pivot Points to filter out market noise.
NOTE: This script utilizes a mathematical array binning algorithm to calculate the profile efficiently on the chart timeframe, avoiding the runtime timeouts often associated with standard iterative volume profiles.
How it works (Technical Methodology)
Binning Algorithm: The script calculates the price range (Highest High - Lowest Low) of the lookback period and divides it into a fixed number of vertical bins defined by the Resolution input.
Volume Allocation: It iterates through historical bars once. The volume of each bar is assigned to the corresponding price bin based on the bar's closing price.
Sentiment Approximation: Since tick-level Bid/Ask data is not available for historical bars in standard Pine Script strategies, this indicator estimates directional volume based on candle polarity:
If Close > Open: Volume is categorized as "Up Volume" (Buying Sentiment).
If Close < Open: Volume is categorized as "Down Volume" (Selling Sentiment).
Disclaimer: This is a standard approximation for structural analysis and does not represent true tick-data delta.
Why this Combination? (Originality & Synergy)
This script addresses the problem of validating structural levels. Traders often use Pivots and Volume Profiles separately. This script combines them programmatically to provide context:
Pivot Confluence: A Pivot Point is only plotted if it aligns with significant volume structure.
HVN Validation: A pivot occurring within a High Volume Node (HVN) suggests a high-liquidity reversal zone, whereas a pivot in a Low Volume Node (LVN) may indicate a liquidity void or a "weak" high/low.
The Dashboard summarizes these metrics (Position relative to Value Area, Net Sentiment, and Trend), removing the need for multiple separate indicators.
Educational Use for Beginners
If you are new to Volume Profile, think of the market structure in these simple terms:
Value Area (VA): This is the "Fair Price" zone where 70% of trading happened. If price is inside here, the market is balanced. If price breaks out, it may be starting a trend.
HVN (High Volume Nodes - Colored Boxes): Think of these as "Traffic Jams". Price often slows down, bounces, or gets stuck here because there are many orders. They act as Support or Resistance.
LVN (Low Volume Nodes - Gray Strips): Think of these as "Empty Highways". Because there is little volume here, price tends to move through these zones very quickly to get to the next HVN.
Features
HVN (High Volume Nodes): Colored boxes highlighting areas of high accumulation.
LVN (Low Volume Nodes): Gray strips highlighting gaps or acceleration zones.
Value Area (VA): Displays the VAH, VAL, and PoC (Point of Control).
Volume-Filtered Pivots: Plots pivots only when supported by the profile structure.
Sentiment Coloring: The profile bins are colored based on the net bullish/bearish candle volume.
Settings
Rolling Period: The lookback window size (default 150 bars).
Resolution: Precision of the profile bins (higher = more detail, lower = smoother).
HVN Thresholds: Percentage of PoC volume required to identify a node.
Global Text Size: Adjusts labels and dashboard for 4K or standard screens.
Credits: The core binning logic is adapted from generic open-source array management concepts for custom volume profiles.

Cody Order Block FinderCody Order Block Finder
Free Telegram Trading Community t.me
Overview
A professional order block detection indicator that identifies institutional supply and demand zones on any timeframe. This tool helps traders spot key reversal areas where institutional orders are likely placed, providing strategic levels for limit order entries.
Key Features
🔍 Smart Order Block Detection
Bullish Order Blocks: Identifies the last bearish candle before consecutive bullish candles
Bearish Order Blocks: Identifies the last bullish candle before consecutive bearish candles
Configurable Sensitivity: Adjust the number of consecutive candles required (1-50 periods)
Minimum Move Filter: Set percentage threshold to filter only significant moves
🎨 Visual Customization
Multiple Color Schemes: Choose from DARK, BRIGHT, or NEON themes
Customizable Display: Show/hide bullish/bearish channels
Line Extension: Extend OB lines to current bar for better visibility
Historical View: Toggle between showing all historical OBs or only the latest ones
📊 Advanced Filtering
OB Size Filter: Set minimum and maximum order block size as percentage of price
ATR Filter: Filter OBs based on Average True Range multiples
OB Strength Indicator: Color-coded OBs based on subsequent price move strength
Wick/Body Selection: Choose to mark OBs using whole candle range or body only
🔔 Alert System
Real-time Alerts: Get notified immediately when new order blocks form
Customizable Messages: Set your own alert messages
Once-per-OB Option: Prevent alert spam with single alert per OB
📈 Display Features
Three-Line Channels: Shows high, low, and average levels for each OB
Visual Shapes: Clear triangle markers above/below candles
Info Panel: Displays latest OB statistics in a clean table format
Data Window Info: View OB levels in TradingView's data window
How to Use
Setup
Add indicator to your chart
Configure periods (default: 5) - higher values = fewer but stronger OBs
Set minimum % move (default: 0%) to filter significant moves
Choose color scheme for your preference
Trading Applications
Limit Order Placement: Place buy limits at bullish OB lows, sell limits at bearish OB highs
Stop Loss Reference: Set stops beyond OB extremes
Reversal Confirmation: Use OBs as confluence with other indicators
Support/Resistance: OB levels often act as future support/resistance
Advanced Tips
Combine with volume profile for higher probability zones
Use on higher timeframes (4H, Daily) for more significant levels
Look for OBs at key Fibonacci levels for added confluence
Monitor price reactions when revisiting OBs
Technical Details
Programming Language: Pine Script v6
Overlay: Yes (draws directly on price chart)
Max Lines: 500 (prevents chart clutter)
Timeframe Compatibility: All timeframes (1min to Monthly)
Market Compatibility: Forex, Stocks, Crypto, Futures
Input Parameters
Basic Settings
Relevant Periods: Number of consecutive candles required (1-50)
Min. Percent move: Minimum % move to validate OB (0.0-100.0)
Color Scheme: DARK, BRIGHT, or NEON color themes
Display Options
Show latest Bullish/Bearish Channel: Toggle channel display
Extend OB lines to right: Extend lines to current bar
Show all historical OBs: Display all OBs or only latest
Use whole range: Use High/Low or Open/Close for OB marking
Advanced Filters
Min/Max OB size (%): Filter by order block size
Use ATR filter: Filter based on volatility
Show OB Strength: Color code by subsequent move strength
Alert Configuration
Create alerts directly from the indicator by clicking "Create Alert" button on chart:
Bullish OB alerts when green triangle appears
Bearish OB alerts when red triangle appears
Includes price and OB level information
Best Practices
Higher Timeframes First: Start on daily/4H to identify major levels
Multiple Confluence: Combine with trend lines, Fibonacci, or moving averages
Patience: Wait for price to return to OB levels for entries
Risk Management: Always use appropriate position sizing and stops
Support & Updates
For updates and support, visit the script page. The indicator is regularly maintained for optimal performance across all markets and timeframes.
Perfect for: Swing traders, position traders, institutional traders, and anyone looking to trade with the "smart money" flow using order flow concepts.
Trading Styles: Works with all styles - scalping, day trading, swing trading, and investing.
Experience Level: Suitable for beginners to advanced traders with clear visual cues and customizable settings.

The Institutional Anchor (Daily OC Zone)The Institutional Anchor (Daily OC)
This indicator is a high-performance tool for traders who rely on "Institutional Candles" or "Opening Candles" (OC) to define their daily bias. Built on the latest Pine Script® v6 engine, it provides a stable, non-repainting foundation for identifying key institutional support and resistance levels.
Core Features & Technical Edge
1. Dual-Mode Zone Definition
Traders have different ways of defining institutional strength. This script supports both methods to suit your specific strategy:
Body-Only Mode: Focuses on the "Real Move" by using the Open and Close of the anchor candle.
Full Range Mode (Wicks): Accounts for total liquidity grabs and volatility by including the High and Low.
2. Precision Equilibrium (Mean Threshold)
In institutional trading, the 50% level of a candle is the "Fair Value" or Mean Threshold.
Includes a customizable Midline with independent styling (Solid, Dashed, Dotted).
Automatically calculates the exact mathematical center, helping you spot high-probability rejections at the "Equilibrium" of the move.
3. Professional Visualization Suite
Global Timezone Alignment: A built-in UTC Offset ensures you can align with New York (UTC-5), London (UTC+0), or your specific exchange time without manual calculations.
Auto-Naming System: Automatically labels zones with the Day of the Week (e.g., "Monday OC") to help you track weekly cycles and "Power of 3" (Accumulation/Manipulation/Distribution).
Historical Memory: Choose to show only the current day's active zone for a clean workspace, or display historical zones to find "nested" levels from previous days.
4. Dynamic Price Action Alerts
Stay notified without being glued to the screen. The script includes pre-configured, logically consistent alert conditions:
Equilibrium Touch: Triggers the moment price interacts with the 50% Mean Threshold.
Boundary Breach: Notifies you when price exits or taps the upper or lower edges of the zone.
5. Universal Market Compatibility
BTC & Crypto Optimized: Handles 24/7 data streams flawlessly without logic gaps.
Forex Precision: Perfect for London Open or Midnight Open strategies on pairs like EUR/USD.
Non-Repainting: Once the anchor hour closes, the zone is locked, providing a reliable reference point for the rest of the trading day.
How to Use
Market Open Hour: Enter the hour (24h format) of your chosen anchor candle (e.g., 2 for 2:00 AM).
UTC Offset: Match the offset to your preferred trading session time.
Customize Style: Adjust colors, transparency, and line styles to match your chart theme.

Smart Money Concept, Modern ViewSmart Money Concept, Modern View (SMCMV)
Institutional Volume Flow Analysis with VWMA Matrix
━━━━━━━━━━━━━━━━━━━━━━━━━━━━━━━━━━━━━━━━━━━━━━━━━━
📌 OVERVIEW
SMCMV is an advanced institutional-grade indicator that combines Volume-Weighted Moving Average (VWMA) matrix analysis with sophisticated volume decomposition to detect buyer and seller entry points. The indicator provides a comprehensive real-time dashboard displaying market structure, volume dynamics, and validated trading signals.
Key Features:
• Dual Volume Model: Geometry-based (candle range split) and Intrabar (precise LTF data)
• 10-Period VWMA Spectrum: Multi-timeframe support/resistance matrix (7, 13, 19, 23, 31, 41, 47, 67, 83, 97)
• 5-Layer Scoring System: 100-point institutional-grade signal quality assessment
• State Machine Signal Engine: Validated entry/exit signals with timer and range confirmation
• Real-time Prediction Engine: Candle-by-candle buyer/seller probability estimation
• High Volume Node Detection: Automatic identification of significant volume zones
━━━━━━━━━━━━━━━━━━━━━━━━━━━━━━━━━━━━━━━━━━━━━━━━━━
📊 DASHBOARD REFERENCE
1) NOW VECTOR (Current Market State)
This section captures the immediate market conditions:
• FLOW ANGLE: Directional angle of price movement in degrees (from VWMA-5). Positive = bullish, Negative = bearish.
• LTP: Last Traded Price - current close price.
• NET FLOW (Δ): Volume Delta - net difference between buying and selling volume. Shows ⚡+ or ⚡-.
• LIQUIDITY: Total volume on the current bar (K/M format).
• BUY VOL: Estimated buying volume based on selected model.
• SELL VOL: Estimated selling volume.
• BID PRES.: Buying volume as percentage of total volume.
• ASK PRES.: Selling volume as percentage of total volume.
• DIRECTION: Current state with hysteresis: BULL (🐂), BEAR (🐻), or NEUT (⚪).
2) DATA QUALITY / CONFIG
Configuration status and data integrity monitoring:
• VOL MODEL: INTRABAR (uses LTF data) or GEOMETRY (estimates from candle structure).
• IB LTF: Intrabar Lower Timeframe for precise volume decomposition.
• MODE: Micro (7 periods: 7-47) or Macro (10 periods: 7-97).
• IB OK: Intrabar data validity - OK or NO.
• IB STREAK: Consecutive bars with valid intrabar data.
• LATENCY: Data freshness indicator. ✓ = current, ↺ = using historical reference.
3) STRUCTURE RADAR
Market structure analysis showing price position relative to VWMA matrix:
• WIRES ▲/▼: Count of VWMAs above (resistance) and below (support).
• RES: Nearest Resistance - shows MA period, "ZN RES", or "BLUE SKY".
• SUPP: Nearest Support - shows MA period, "ZN SUPP", or "FREE FALL".
4) ACTIVE INTERACTION
Real-time analysis of price interaction with key levels:
• Header Status: "⚠ TESTING SUPPLY (ASK SIDE)" / "⚠ TESTING DEMAND (BID SIDE)" / "--- NO KEY INTERACTION ---"
• TARGET: Active level being tested (MA period or zone type).
• TEST LEVEL: Exact price level being tested.
• SCORE: Total score (0-100%) with letter grade .
• VOLUME POWER: Volume ratio vs historical average (e.g., "2.5x").
• BREAKOUT: "CONFIRMED" if attacking volume exceeds defending, "REJECTED" otherwise.
• DELTA DIR: "ALIGNED" if delta matches accumulation trend, "CONFLICT" if opposing.
━━━━━━━━━━━━━━━━━━━━━━━━━━━━━━━━━━━━━━━━━━━━━━━━━━
🎯 5-LAYER SCORING SYSTEM (100 Points Total)
Layer 1: Volume Quality (Max 25 pts)
• Mass (0-10): Volume ratio vs average. 0.5x=0, 1.0x=5, 2.0x=8, 3.0x+=10
• Spike (0-8): Volume Z-Score intensity
• Trend (0-7): Volume trend alignment with price direction
Layer 2: Battle Structure (Max 25 pts)
• Break (0-10): Breakout intensity ratio (attacker vs defender)
• Dom (0-8): Internal dominance ratio
• Pres (0-7): Pressure imbalance percentage
Layer 3: Flow & Energy (Max 20 pts)
• Delta (0-8): Delta alignment with accumulation trend
• Accel (0-6): Delta acceleration
• Mom (0-6): Flow momentum
Layer 4: Geometry (Max 15 pts)
• Impact (0-7): Impact angle directness
• Vec (0-5): Vector alignment
• PriceZ (0-3): Price Z-Score position
Layer 5: Army Structure (Max 15 pts)
• Stack (0-5): MA stack depth
• Conf (0-5): Confluence percentage
• Trend (0-5): Trend alignment count (7>13, 13>23, 23>97)
Grade Scale:
• A+ = 90-100 pts (Exceptional)
• A = 80-89 pts (Strong)
• B+ = 70-79 pts (Good)
• B = 60-69 pts (Moderate)
• C+ = 50-59 pts (Below average)
• C/D/F = Below 50 pts (Weak)
━━━━━━━━━━━━━━━━━━━━━━━━━━━━━━━━━━━━━━━━━━━━━━━━━━
5) SIGNAL STATUS PANEL
Real-time signal state machine status:
• Header: "🐂 BUYERS ACTIVE" / "🐻 SELLERS ACTIVE" / "⏳ VALIDATING..." / "⏸ RANGE / FLAT"
• LOCK PRICE: Price at which signal was locked/confirmed.
• RANGE ±: Validation range percentage.
• POSITION: Price vs lock: "▲ ABOVE" / "▼ BELOW" / "● AT LOCK"
• DISTANCE: Percentage distance from lock price.
• vs RANGE: Position vs validation range: "IN_RANGE" / "ABOVE" / "BELOW"
• VAL TICKS: Validation progress (current/required ticks).
6) REALTIME PREDICTION PANEL
Candle prediction engine:
• WINNER: Predicted dominant side: "BUYERS" / "SELLERS" / "NEUTRAL"
• CONFIDENCE: Prediction confidence percentage.
• ACCURACY: Historical prediction accuracy (session-specific).
• BUY/SELL PROB: Individual probabilities for each side.
━━━━━━━━━━━━━━━━━━━━━━━━━━━━━━━━━━━━━━━━━━━━━━━━━━
🏷️ SIGNAL LABELS REFERENCE
• 🐂 BUYER ENTRY (Green): Confirmed buyer entry signal. Validation complete.
• 🐻 SELLER ENTRY (Red): Confirmed seller entry signal. Validation complete.
• 🔻 REVERSAL BUY→SELL (Magenta): Reversal from buyer to seller position.
• 🔺 REVERSAL SELL→BUY (Cyan): Reversal from seller to buyer position.
• ⏹ EXIT → FLAT (Gray): Position exit to flat/neutral state.
• ⬆ BUYER STRONGER (Small Green): Lock price updated higher during buyer state.
• ⬇ SELLER STRONGER (Small Red): Lock price updated lower during seller state.
Display Modes:
• Minimal: Icon only (hover for tooltip details)
• Normal: Icon + Price level
• Detailed: Full information (price, score, grade)
━━━━━━━━━━━━━━━━━━━━━━━━━━━━━━━━━━━━━━━━━━━━━━━━━━
📈 CHART ELEMENTS
VWMA Spectrum Lines
Colored gradient lines representing the 10-period VWMA matrix. Color progresses from light blue (fast: 7-period) through purple to orange (slow: 97-period). These act as dynamic support/resistance levels weighted by volume.
High Volume Node Lines
• Blue Lines: High Buy Volume zones - potential demand areas
• Red Lines: High Sell Volume zones - potential supply areas
• Yellow Lines: Overlapping zones (buy + sell extremes) - high conflict areas
Lock Price Line & Range Band
• Dashed Line: Locked price level (green for buyers, red for sellers)
• Dotted Lines: Upper/lower bounds of validation range
━━━━━━━━━━━━━━━━━━━━━━━━━━━━━━━━━━━━━━━━━━━━━━━━━━
⚙️ INPUT SETTINGS GUIDE
Volume Model
• Calculation Method: "Geometry (Candle-Range Split)" for universal compatibility or "Intrabar (Precise)" for accurate buy/sell separation.
• Intrabar LTF: Lower timeframe for Intrabar mode (e.g., "1" for 1-minute).
Direction Filter
• Direction Trigger Angle: Threshold for directional state change (default: 1.5°)
• Neutral Reset Angle: Threshold for returning to neutral (default: 0.7°)
Testing Filter
• Level Proximity (%): How close price must be to "test" a level (default: 0.25%)
• Require Wick Touch: If enabled, requires high/low to touch proximity band.
Signal Validation
• Lock Range (%): Price range for validation (default: 0.5%)
• Validation Ticks: Consecutive bars required (default: 3)
• Validation Time: Minimum seconds for real-time confirmation (default: 5)
• Minimum Hold Bars: Stay in position for at least this many bars (default: 5)
• Exit Mode: "Reversal Only" / "Signal Loss" / "Price Stop"
• Stop Loss (%): Exit threshold (default: 1.0%)
Signal Score Filter
• Score Range Minimum: Minimum score for signal generation (default: 10%)
• Score Range Maximum: Maximum score threshold (default: 100%)
━━━━━━━━━━━━━━━━━━━━━━━━━━━━━━━━━━━━━━━━━━━━━━━━━━
💡 USAGE RECOMMENDATIONS
1. Start with Macro mode to see the complete VWMA spectrum, then switch to Micro for cleaner charts.
2. Use Intrabar mode when your broker provides lower timeframe data.
3. Focus on high-grade signals (B+ or better) for higher probability setups.
4. Wait for validation to complete before acting on signals.
5. Use the Lock Price line as your reference for position management.
━━━━━━━━━━━━━━━━━━━━━━━━━━━━━━━━━━━━━━━━━━━━━━━━━━
⚠️ IMPORTANT NOTES
• This indicator is designed for educational and analytical purposes.
• Always combine with proper risk management and additional confirmation.
• Past performance and signal quality do not guarantee future results.
• The prediction accuracy is session-specific and resets on chart reload.
━━━━━━━━━━━━━━━━━━━━━━━━━━━━━━━━━━━━━━━━━━━━━━━━━━
Volume-Based Indicator — Data Granularity & Table Guide
1) Critical warning about data granularity (read first)
Important: This indicator is built entirely on volume-derived calculations (volume, volume delta, and related flow metrics). Because of that, its precision is only as good as the granularity and history of the data you feed it.
The most granular view is a tick-based interval (e.g., 1T = one trade/tick). If tick-based intervals are not available for your symbol or your plan, the closest time-based approximation is a 1-second chart (1S).
If you enable any "high-precision / intrabar" options (anything that relies on the smallest updates), make sure you understand which TradingView plan you are using, because intrabar historical depth (how many bars you can load) varies by plan. More history generally means more stable baselines for volume statistics, regime detection, and long lookback features.
Plan-related notes (TradingView)
TradingView limits how many intrabar historical bars can be loaded, depending on your plan. The exact limits are defined by TradingView and can change over time, but as of the current documentation, the intrabar limits are:
• Basic: 5,000 bars
• Essential: 10,000 bars
• Plus: 10,000 bars
• Premium: 20,000 bars
• Expert: 25,000 bars
• Ultimate: 40,000 bars
Tick charts / tick-based intervals are currently positioned as a feature of professional-tier plans (e.g., Expert/Elite/Ultimate). Availability may also vary by symbol and data feed.

BE-Synergistic RSI Fusion Strategy█ Overview of the Script:
The Synergistic RSI Fusion Strategy is a sophisticated technical analysis tool designed to detect market turning points (reversals) and high-momentum breakouts. Unlike standard indicators that simply tell you to "Buy" or "Sell" based on a crossed line or overbought/oversold levels, this script builds a structural trade setup using zones. It waits for price action to confirm the signal before acting.
█ Why "Synergistic RSI Fusion"?:
The core engine of the indicator makes it all:
Fusion : Standard RSI only looks at the closing price relative to the previous closing price. This script calculates a comprehensive RSI that incorporates the candle's Highs and Lows.
Why is this more powerful? Imagine a "Hammer" candle where price drops significantly during the session but recovers to close near the open. A standard RSI sees almost no change because the Close is near the Open. However, Fusion RSI captures the full volatility of that dip and recovery, recognizing the massive "effort" and hidden battle between buyers and sellers that standard RSI completely misses.
Synergy : It combines this advanced momentum reading with ATR (Average True Range) to define volatility-based entry and exit zones. It blends momentum (RSI) with market structure (Price Action Zones).
█ How it Stands Unique:
The Core engine: Capturing the true efforts of the movement in price.
Multi-Peak Divergence: Instead of simple A-to-B divergence, this script uses a state machine to track local peaks by filtering out weak signals and waits for a significant disagreement between price and momentum.
The Zone System: It doesn't plot signals blindly. When divergence is found, it draws two "waiting rooms" (Green and Red zones). The trade is only taken if the candle closes inside one of these zones.
█ Divergence Trades: The Two-Way Setup:
A unique feature of this script is that when a Divergence signal appears, it generates two potential entry zones: a Bullish zone and a Bearish zone.
The Rational Behind the Two-Way Approach:
New traders often assume a Divergence means "Reversal." However, experienced traders know that Divergence simply means "Tension is building."
Scenario A (The Reversal): The RSI is screaming that momentum is dying, but price is pushing higher. If price respects the divergence, it will drop into the reversal zone. This is the standard divergence trade.
Scenario B (The Failure/Trap): sometimes, momentum is so strong that it blows through the divergence. If price ignores the RSI warning and breaks into the continuation zone, it signals that the trend is incredibly powerful.
Why Trade Both Ways?
By placing zones on both sides, the script essentially says: " I know a big move is coming because of the tension (Divergence), but I will let the market prove direction first. " This prevents you from " catching a falling knife " by trying to pick the exact top or bottom.
The Counter-Trading Logic (The Trap):
The script includes advanced logic for failed trades. If you enter a trade and the Stop Loss is hit immediately (a "fake-out"), the script adjusts the opposing zone by considering the liquidity of that particular candle.
Why? If the market traps Long traders and hits their stops, that selling pressure often fuels a massive move downwards. This logic allows the script to flip bias instantly and join the real move.
█ Continuation Trends: Why Price Runs After TP:
You may notice that often, after the Take Profit (TP) is hit, the price continues to run in that direction for a long time.
The "Breakout" Effect:
The Take Profit levels in this script are calculated using ATR (Average True Range). This is a conservative target based on recent average volatility.
Structural Breaks: The entry zones are usually positioned at key structural pivots. When price has enough energy to enter the zone and hit 100% of the ATR target, it effectively confirms a Break of Structure.
Momentum Release: The Divergence phase acts like a coiled spring. When that spring finally snaps (the trade entry), the release of energy is often far greater than just one ATR unit.
Psychology: When the TP is hit, it confirms the analysis was correct. This draws in other traders and algorithms who missed the initial entry, adding fuel to the fire and extending the trend.
█ Major Support & Resistance Zone:
The untested zones are typically the safe haven to place your SLs, which definitely act as Support & Resistance once the price approaches these zones.

Golden Zone Structure [Kodexius]Golden Zone Structure is a ZigZag based market structure and Fibonacci tool designed to make swing context easier to read directly on the price chart. It detects meaningful pivot highs and lows, labels the evolving structure (HH, HL, LH, LL, including equal highs and lows), and automatically projects a Fibonacci map across the most recent completed swing.
Instead of forcing you to manually anchor Fib tools after every new leg, the script rebuilds levels each time a fresh pivot is confirmed. This makes it well suited for traders who focus on swing continuation, pullback depth, and reaction zones where liquidity and orderflow often concentrate.
A key emphasis is the Golden Zone highlight. The indicator shades the zone that is most relevant to the current swing context so you can quickly spot where a retracement is approaching a higher probability reaction area, without cluttering the chart with too many permanent objects.
The tool is intentionally visual and configurable. You can choose pivot source (High/Low or Close), adjust swing sensitivity via ZigZag period, switch color themes, and decide how much detail you want on screen (levels, zigzag lines, labels).
Optional trading markers can be enabled for users who want a lightweight “zone interaction” prompt. These markers are not intended as a standalone trading system. They are meant to complement your own confirmation rules (structure alignment, volume, higher timeframe bias, or price action triggers).
🔹Features
🔸 ZigZag Swing Engine
- Uses a configurable ZigZag period to filter noise and confirm swing points only when the lookback logic validates the move.
Supports different pivot sources (High/Low or Close) so you can choose between cleaner structure or more reactive behavior depending on the instrument.
Optional ZigZag leg drawing to visualize swing flow without clutter.
🔸 Market Structure Labels (HH, HL, LH, LL + Equals)
- Automatically labels each confirmed pivot based on how it compares to the prior pivot of the same type.
High side classification: H, HH, LH, EH.
Low side classification: L, HL, LL, EL.
Equal highs and lows help reveal potential liquidity pools and “magnet” areas where price often reacts or breaks with intent.
🔸 Auto Fibonacci Map on the Active Swing
- Rebuilds Fibonacci levels every time a new pivot is confirmed, keeping the projection aligned with the most recent completed leg.
Core retracement levels: 0.236, 0.382, 0.500, 0.618, 0.786.
Extension levels: 1.272 and 1.618 for expansion targeting and continuation mapping.
Optional price labels on each level, formatted to tick size so levels remain readable across markets.
🔸 Golden Zone Highlighting (Context Aware)
- Highlights the most relevant retracement band with a soft fill so you can spot “zone approach” moments at a glance.
The zone selection adapts to swing context, focusing on a different retracement region depending on whether the last confirmed pivot is a peak or a trough.
Adjustable transparency keeps the chart clean while preserving the key reaction area.
🔸 Visual Customization + Themes
- Multiple color themes (Neon, Ocean, Sunset, Monochrome) so the tool fits different chart styles and backgrounds.
Independent toggles for Fib levels, Golden Zone shading, ZigZag lines, and price labels.
Line width controls for better scaling across timeframes.
🔸 Optional Trading Markers + Alerts
- Optional BUY and SELL labels based on zone interaction logic with candle confirmation filters.
ATR based placement offset scaled by sensitivity so labels stay visually separated during volatility.
Built in alert conditions for new pivot highs and new pivot lows so you can monitor structure changes without watching every bar.
▶ Practical Usage Tip
• Use structure labels to define bias (HH + HL for bullish structure, LH + LL for bearish structure).
• Use the Golden Zone as a location filter, then wait for your own trigger (break of minor structure, rejection candle, volume shift, etc.).
• Treat extensions as “map points” not guaranteed targets. They work best when structure supports continuation.

Liquidity Levels Pro Tool - thewallranka
Liquidity Levels Pro Tool is a market-structure and liquidity-mapping indicator designed to help discretionary futures and index traders identify statistically relevant price levels where reactions, continuations, or liquidity sweeps are more likely to occur.
This script is a decision-support tool, not a signal generator. It does not issue buy/sell alerts or predict future price movement. Instead, it organizes and scores liquidity information so traders can make their own contextual decisions.
What this indicator does
The script continuously detects and maintains liquidity zones derived from price pivots, then evaluates those zones using multiple structural and contextual factors:
Repeated price interaction (touches)
Freshness (time since last interaction)
Confluence with key reference levels
Reaction behavior after contact
Session relevance (RTH vs overnight)
Market regime (trend vs mean reversion)
Time-of-day effects (open, midday, power hour)
Only the most relevant zones—based on a dynamic scoring system—are displayed to reduce chart clutter and focus attention on levels that have historically mattered.
Core components
1. Liquidity Zones
Zones are built from pivot highs and lows and expanded into areas using a configurable tick-based padding. Nearby zones are merged to avoid redundancy.
Each zone is continuously evaluated and assigned a score (0–100) reflecting its relative importance.
2. Zone Scoring (No Lookahead)
Zone scores are based on:
Number of confirmed interactions
Recency of the last touch
Confluence with prior day/week levels, VWAP, and Opening Range
Reaction quality after touches (speed and follow-through)
Session alignment (zones that “work” in the current session are favored)
Penalties after liquidity sweeps
Zones are not forward-looking and do not rely on future data.
3. Context Engine
The script classifies the current environment using VWAP slope and distance:
Trend (up or down)
Mean reversion
Mixed/transition
Time-of-day context (Open, Midday, Power Hour) is also tracked internally and influences zone scoring.
This context is displayed in the HUD to support situational awareness, not automated decisions.
4. Liquidity Sweeps
Optional sweep detection highlights situations where price trades beyond a zone and closes back inside, indicating potential stop runs or failed breakouts.
Sweeps are rate-limited and applied conservatively to avoid visual noise.
5. Trade Planning Levels (Optional)
When enabled, the script highlights the nearest high-quality liquidity level above and below price based on score thresholds.
These are intended as reference targets, not trade entries or exits.
HUD (Heads-Up Display)
The on-chart HUD summarizes:
Key reference levels (prior day/week, Opening Range)
Nearest strong liquidity above/below price
Market regime and time-of-day context
Distance to levels (ticks or points)
The HUD is fully optional, positionable, and includes resizable modes (Small / Medium / Large) to fit different chart layouts.
How to use this tool
This indicator is best used as part of a discretionary trading process, for example:
Identifying areas where price is more likely to react or pause
Framing trades around higher-quality structure instead of arbitrary levels
Filtering setups based on session and regime context
Managing expectations near known liquidity rather than chasing price
It is intentionally designed not to provide trade signals.
Limitations and important notes
This script does not predict outcomes or guarantee reactions
High-scoring zones can still fail
Liquidity behavior is context-dependent and probabilistic
No performance claims or backtested results are provided
The indicator should not be used in isolation
Past behavior does not imply future results.
Chart and usage notes
The script is intended for standard time-based charts
Recommended for liquid futures and index products
Use a clean chart for clarity when publishing or sharing
No external indicators are required
Final note
Liquidity Levels Pro (Tool) — v6 is designed to organize complex market structure into a clear, readable framework, allowing traders to focus on execution and risk management rather than raw level detection.
This script reflects an analytical approach to intraday liquidity and structure, not an automated trading system.

Miela Labs | John Dee's Watchtower [257-463]Bridging the gap between 16th-century esoteric mathematics and modern algorithmic trading.
The Enochian Watchtower is not merely a trend indicator; it is a computational artifact developed by Miela Labs LLC. This script translates Dr. John Dee’s "Great Table of the Watchtowers" and the "Sigil Dei Aemeth" into actionable financial data points.
Using our proprietary Occultator V2.0 Engine, we have derived specific mathematical constants that resonate with the current market structure.
🏛️ The Algorithmic Logic
This indicator utilizes three sacred numbers to construct a "Future Vision" of the market:
1. The Axis Mundi (Vector 257): derived from Fermat Primes and John Dee’s Grid coordinates. This Weighted Moving Average (WMA) acts as the spinal cord of the trend.
2. The Gates (Cipher 463): A prime number derived from the "Galethog" cipher stride. These bands define the absolute volatility limits (Heaven & Earth Gates).
3. Future Vision (Offset 21): Utilizing Fibonacci time sequences, the indicator projects Support and Resistance levels 21 bars into the future, allowing traders to anticipate market movements before they occur.
⚡ How to Use
• The Trend: If price is above the Purple Axis (257), the market is in a bullish phase.
• The Entry: Look for "L" (Long) and "S" (Short) signals. These are confirmed when the signal path crosses the Axis.
• The Future: Watch the projected lines on the right side of the chart to identify upcoming resistance zones.
About Miela Labs
Miela Labs is a Technomancy Research Institute based in McKinney, Texas. We specialize in building open-source esoteric trading tools and the Magic Programming Language (MPL).
🌐 Official Hub: Visit Miela Labs
💻 Source Code & Research: GitHub Repository
Disclaimer: This tool is for educational and research purposes only. It demonstrates the application of esoteric mathematics in financial analysis. Trade responsibly.

Box TheoryBox Theory – Description
This indicator is based on the popular “Box Theory” concept, where the previous session’s High–Low range acts as the most important structure for the next session.
Traders use this because the market often reacts to the same areas where liquidity, orders, and imbalances were created in the prior session.
At every new session open, the indicator automatically records:
Previous High
Previous Low
Middle (50% level)
These three levels form a box, which becomes your roadmap for the new session.
This method is widely used because it highlights where most reversals, sweeps, and reactions occur—without needing any extra indicators.
How the Zones Are Calculated
Previous High
The highest price of the last session.
This forms the top edge, which acts as resistance and the basis for the Sell Zone.
Previous Low
The lowest price of the last session.
This forms the bottom edge, acting as support and the basis for the Buy Zone.
Middle Line (50% Level)
The exact midpoint between High and Low.
This is the fair-value zone, where price often consolidates and becomes directionless.
No signals are triggered near the middle, because trades taken here historically have low accuracy.
Buy Zone (Green Area)
The lower part of the box.
Price often reacts here because this area held buyers in the previous session.
When price enters this green zone inside the box, the indicator can show a Buy Zone label.
Sell Zone (Red Area)
The upper part of the box.
Price commonly rejects here because this area acted as resistance previously.
When price enters this red zone inside the box, the indicator can show a Sell Zone label.
How Zone Size Is Set (Sensitivity %)
You can adjust how big the Buy/Sell zones are using the Sensitivity (%) input.
Lower % → Smaller zones → More precise signals
Higher % → Larger zones → Signals appear earlier and from farther away
Formula:
Zone Size = (Previous High − Previous Low) × (Sensitivity % ÷ 100)
This lets you customize how tight or how early your signals appear.
Inside-Box Only Logic
The indicator only works inside the previous session’s range.
If price breaks above the previous High → No sell signal
If price breaks below the previous Low → No buy signal
This avoids false signals during breakouts or trending markets.
Alerts
The indicator includes two alerts:
Buy Zone Alert → Triggers when price enters the Buy Zone
Sell Zone Alert → Triggers when price enters the Sell Zone
Just enable them in TradingView’s alert panel.
