Liquidity Trap Detector Pro [PyraTime]The Problem: Why You Get Stopped Out
90% of retail traders place their stop-losses at obvious swing highs and lows. Institutional algorithms ("Smart Money") are programmed to push price through these levels to trigger liquidity, fill their heavy orders, and then immediately reverse the market.
If you have ever had your stop hit right before the market moves exactly where you predicted—you were the victim of a Liquidity Trap.
The Solution: Visualizing the "Stop Hunt"
Liquidity Trap Detector Pro is not just a support/resistance indicator. It is a comprehensive Reversal Scoring Engine.
Unlike standard indicators that spam signals on every wick, this tool uses a proprietary 5-Star Scoring System to analyze the quality of the trap. It validates every signal using Wick Symmetry, RSI Divergence, and Volume Analysis to separate a true reversal from a trend continuation.
Key Features (USP)
- 5-Star Scoring Engine: Every signal is rated from 1 to 5 stars. Stop guessing if a signal is valid; let the algorithm check the confluence for you.
- Glassmorphism Visuals: Gone are the messy lines. We use modern, semi-transparent "Liquidity Zones" that keep your chart clean and professional.
- Smart Terminology: Automatically identifies Bull Traps (Buyers trapped at highs) and Bear Traps (Sellers trapped at lows).
- Heads-Up Display (HUD): A professional dashboard monitors the market state, active filters, and recent trap statistics in real-time.
- Strict Non-Repainting: (Technical Note) This script uses strict non-repainting logic. All Higher Timeframe (HTF) data is confirmed and closed before a signal is generated, ensuring historical accuracy.
---
Tutorial: How to Trade This Indicator
1. Understanding the Signals
We use correct institutional terminology to describe the market mechanics:
GREEN Signal (BEAR TRAP):
- What happened: Price swept a Swing Low, enticing sellers (Bears) to enter. The candle then reversed and closed back inside the range, trapping those sellers.
- The Trade: This is a Bullish Reversal setup (Long).
RED Signal (BULL TRAP):
- What happened: Price swept a Swing High, enticing buyers (Bulls) to breakout. The candle reversed and closed lower, trapping the buyers.
- The Trade: This is a Bearish Reversal setup (Short).
2. The 5-Star Scoring System
Not all traps are created equal. The stars tell you how much "Confluence" exists:
- 1 Star: A basic structure sweep. Risky.
- 3 Stars: A solid setup backed by either Volume or Divergence.
- 5 Stars: The "Perfect" Trap. Structure Sweep + RSI Divergence + Volume Spike + Wick Symmetry. High Probability.
3. The Strategy
- Wait for the Zone: Watch price approach a coloured Liquidity Zone.
- Observe the Reaction: Do not trade blindly. Wait for the candle to close.
- Check the Stars: Look for at least 3 Stars before considering an entry.
- Confirm with HUD: Glance at the Dashboard to ensure the "RSI Filter" and "Vol Filter" agree with your analysis.
---
Settings Guide
Structure Settings:
- Pivot Lookback: Adjusts how sensitive the zones are (Default: 10/5).
- HTF Confirmation: Optional filter to only show traps that align with Higher Timeframe structure (e.g., 1H or 4H).
Quality Filters:
- RSI Divergence: Requires momentum to disagree with price (classic reversal sign).
- Volume Spike: Requires volume to be higher than average (Smart Money footprint).
Visuals:
- Clean Mode: A presenter-favorite feature. Hides all historical zones and leaves only the active setup—perfect for taking screenshots or sharing analysis.
Disclaimer
This tool is designed to assist with technical analysis and identifying potential areas of interest. It does not guarantee profits. Trading involves significant risk; always use proper risk management.
Cari dalam skrip untuk "sweep"

Smart Money Concept v1Smart Money Concept Indicator – Visual Interpretation Guide
What Happens When Liquidity Lines Are Broken
🟩 Green Line Broken (Buy-Side Liquidity Pool Swept)
- Indicates price has dipped below a previous swing low where sell stops are likely placed.
- Market Makers may be triggering these stops to accumulate long positions.
- Often followed by a bullish reversal.
- Trader Actions:
• Look for a bullish candle close after the sweep.
• Confirm with nearby Bullish Order Block or Fair Value Gap.
• Consider entering a Buy trade (SLH entry).
- If price continues falling: Indicates trend continuation and invalidation of the buy-side liquidity zone.
🟥 Red Line Broken (Sell-Side Liquidity Pool Swept)
- Indicates price has moved above a previous swing high where buy stops are likely placed.
- Market Makers may be triggering these stops to accumulate short positions.
- Often followed by a bearish reversal.
- Trader Actions:
• Look for a bearish candle close after the sweep.
• Confirm with nearby Bearish Order Block or Fair Value Gap.
• Consider entering a Sell trade (SLH entry).
- If price continues rising: Indicates trend continuation and invalidation of the sell-side liquidity zone.
Chart-Based Interpretation of Green Line Breaks
In the provided DOGE/USD 15-minute chart image:
- Green lines represent buy-side liquidity zones.
- If these lines are broken:
• It may be a stop hunt before a bullish continuation.
• Or a false Break of Structure (BOS) leading to deeper retracement.
- Confirmation is needed from candle structure and nearby OB/FVG zones.
Is the Pink Zone a Valid Bullish Order Block?
To validate the pink zone as a Bullish OB:
- It should be formed by a strong down-close candle followed by a bullish move.
- Price should have rallied from this zone previously.
- If price is now retesting it and showing bullish reaction, it confirms validity.
- If formed during low volume or price never rallied from it, it may not be valid.
Smart Money Concept - Liquidity Line Breaks Explained
This document explains how traders should interpret the breaking of green (buy-side) and red (sell-side) liquidity lines when using the Smart Money Concept indicator. These lines represent key liquidity pools where stop orders are likely placed.
🟩 Green Line Broken (Buy-Side Liquidity Pool Swept)
When the green line is broken, it indicates:
• - Price has dipped below a previous swing low where sell stops were likely placed.
• - Market Makers have triggered those stops to accumulate long positions.
• - This is often followed by a bullish reversal.
Trader Actions:
• - Look for a bullish candle close after the sweep.
• - Confirm with a nearby Bullish Order Block or Fair Value Gap.
• - Consider entering a Buy trade (SLH entry).
🟥 Red Line Broken (Sell-Side Liquidity Pool Swept)
When the red line is broken, it indicates:
• - Price has moved above a previous swing high where buy stops were likely placed.
• - Market Makers have triggered those stops to accumulate short positions.
• - This is often followed by a bearish reversal.
Trader Actions:
• - Look for a bearish candle close after the sweep.
• - Confirm with a nearby Bearish Order Block or Fair Value Gap.
• - Consider entering a Sell trade (SLH entry).
📌 Additional Notes
• - If price continues beyond the liquidity line without reversal, it may indicate a trend continuation rather than a stop hunt.
• - Always confirm with Higher Time Frame bias, Institutional Order Flow, and price reaction at the zone.

Enigma Sniper 369The "Enigma Sniper 369" is a custom-built Pine Script indicator designed for TradingView, tailored specifically for forex traders seeking high-probability entries during high-volatility market sessions.
Unlike generic trend-following or scalping tools, this indicator uniquely combines session-based "kill zones" (London and US sessions), momentum-based candle analysis, and an optional EMA trend filter to pinpoint liquidity grabs and reversal opportunities.
Its originality lies in its focus on liquidity hunting—identifying levels where stop losses are likely clustered (around swing highs/lows and wick midpoints)—and providing visual entry zones that are dynamically removed once price breaches them, reducing clutter and focusing on actionable signals.
The name "369" reflects the structured approach of three key components (session timing, candle logic, and trend filter) working in harmony to snipe precise entries.
What It Does
"Enigma Sniper 369" identifies potential buy and sell opportunities by drawing two types of horizontal lines on the chart during user-defined London and US
session kill zones:
Solid Lines: Mark the swing low (for buys) or swing high (for sells) of a trigger candle, indicating a potential entry point where stop losses might be clustered.
Dotted Lines: Mark the 50% level of the candle’s wick (lower wick for buys, upper wick for sells), serving as a secondary confirmation zone for entries or tighter stop-loss placement.
These lines are plotted only when specific candle conditions are met within the kill zones, and they are automatically deleted once the price crosses them, signaling that the liquidity at that level has likely been grabbed. The indicator also includes an optional EMA filter to ensure trades align with the broader trend, reducing false signals in choppy markets.
How It Works
The indicator’s logic is built on a multi-layered approach:
Kill Zone Timing: Trades are only considered during user-defined London and US session hours (e.g., London from 02:00 to 12:00 UTC, as seen in the screenshots). These sessions are known for high volatility and liquidity, making them ideal for capturing institutional moves.
Candle-Based Momentum Logic:
Buy Signal: A candle must close above its midpoint (indicating bullish momentum) and have a lower low than the previous candle (suggesting a potential liquidity grab below the previous swing low). This is expressed as close > (high + low) / 2 and low < low .
Sell Signal: A candle must close below its midpoint (bearish momentum) and have a higher high than the previous candle (indicating a potential liquidity grab above the previous swing high), expressed as close < (high + low) / 2 and high > high .
These conditions ensure the indicator targets candles that break recent structure to hunt stop losses while showing directional momentum.
Optional EMA Filter: A 50-period EMA (customizable) can be enabled to filter signals based on trend direction.
Buy signals are only generated if the EMA is trending upward (ema_value > ema_value ), and sell signals require a downward EMA trend (ema_value < ema_value ). This reduces noise by aligning entries with the broader market trend.
Liquidity Levels and Deletion Logic:
For a buy signal, a solid green line is drawn at the candle’s low, and a dotted green line at the 50% level of the lower wick (from the candle body’s bottom to the low).
For a sell signal, a solid red line is drawn at the candle’s high, and a dotted red line at the 50% level of the upper wick (from the body’s top to the high).
These lines extend to the right until the price crosses them, at which point they are deleted, indicating the liquidity at that level has been taken (e.g., stop losses triggered).
Alerts: The indicator includes alert conditions for buy and sell signals, notifying traders when a new setup is identified.
Underlying Concepts
The indicator is grounded in the concept of liquidity hunting, a strategy often employed by institutional traders. Markets frequently move to levels where stop losses are clustered—typically just beyond swing highs or lows—before reversing in the opposite direction. The "Enigma Sniper 369" targets these moves by identifying candles that break structure (e.g., a lower low or higher high) during high-volatility sessions, suggesting a potential sweep of stop losses. The 50% wick level acts as a secondary confirmation, as this midpoint often represents a zone where tighter stop losses are placed by retail traders. The optional EMA filter adds a trend-following element, ensuring entries are taken in the direction of the broader market momentum, which is particularly useful on lower timeframes like the 15-minute chart shown in the screenshots.
How to Use It
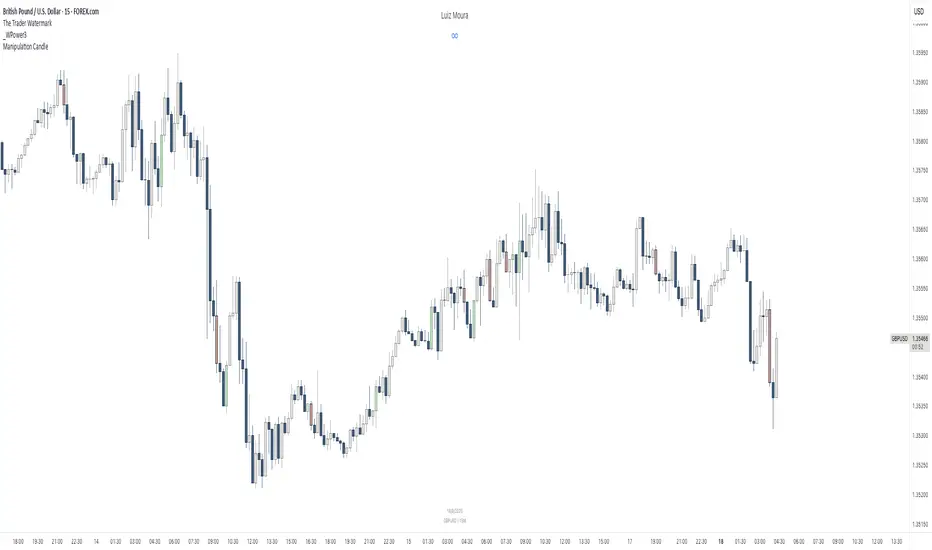
Here’s a step-by-step guide based on the provided usage example on the GBP/USD 15-minute chart:
Setup the Indicator: Add "Enigma Sniper 369" to your TradingView chart. Adjust the London and US session hours to match your timezone (e.g., London from 02:00 to 12:00 UTC, US from 13:00 to 22:00 UTC). Customize the EMA period (default 50) and line styles/colors if desired.
Identify Kill Zones: The indicator highlights the London session in light green and the US session in light purple, as seen in the screenshots. Focus on these periods for signals, as they are the most volatile and likely to produce liquidity grabs.
Wait for a Signal: Look for solid and dotted lines to appear during the kill zones:
Buy Setup: A solid green line at the swing low and a dotted green line at the 50% lower wick level indicate a potential buy. This suggests the market may have grabbed liquidity below the swing low and is now poised to move higher.
Sell Setup: A solid red line at the swing high and a dotted red line at the 50% upper wick level indicate a potential sell, suggesting liquidity was taken above the swing high.
Place Your Trade:
For a buy, set a buy limit order at the dotted green line (50% wick level), as this is a more conservative entry point. Place your stop loss just below the solid green line (swing low) to cover the full swing. For example, in the screenshots, the market retraces to the dotted line at 1.32980 after a liquidity grab below the swing low, triggering a buy limit order.
For a sell, set a sell limit order at the dotted red line, with a stop loss just above the solid red line.
Monitor Price Action: Once the price crosses a line, it is deleted, indicating the liquidity at that level has been taken. In the screenshots, after the buy limit is triggered, the market moves higher, confirming the setup. The caption notes, “The market returns and tags us in long with a buy limit,” highlighting this retracement strategy.
Additional Context: Use the indicator to identify liquidity levels that may be targeted later. For example, the screenshot notes, “If a new session is about to open I will wait for the grab liquidity to go long,” showing how the indicator can be used to anticipate future moves at session opens (e.g., London open at 1.32980).
Risk Management: Always set a stop loss below the swing low (for buys) or above the swing high (for sells) to protect against adverse moves. The 50% wick level helps tighten entries, improving the risk-reward ratio.
Practical Example
On the GBP/USD 15-minute chart, during the London session (02:00 UTC), the indicator identifies a buy setup with a solid green line at 1.32901 (swing low) and a dotted green line at 1.32980 (50% wick level). The market initially dips below the swing low, grabbing liquidity, then retraces to the dotted line, triggering a buy limit order. The price subsequently rises to 1.33404, yielding a profitable trade. The user notes, “The logic is in the last candle it provides new level to go long,” emphasizing the indicator’s ability to identify fresh levels after a liquidity sweep.
Customization Tips
Adjust the EMA period to suit your timeframe (e.g., a shorter period like 20 for faster signals on lower timeframes).
Modify the session hours to align with your broker’s timezone or specific market conditions.
Use the alert feature to get notified of new setups without constantly monitoring the chart.
Why It’s Useful for Traders
The "Enigma Sniper 369" stands out by combining session timing, momentum-based candle analysis, and liquidity hunting into a single tool. It provides clear, actionable levels for entries and stop losses, removes invalid signals dynamically, and aligns trades with high-probability market conditions. Whether you’re a scalper looking for quick moves during London open or a swing trader targeting session-based reversals, this indicator offers a structured, data-driven approach to trading.

Daily Candle Bias Backtesting Stats @MaxMaserati This indicator, is a powerful backtesting and probability tool designed to quantify the "follow-through" of specific candle types across different market sessions.
It identifies specific price action setups and tracks whether price hits a "Target" (continuation) or an "Invalidation" (reversal) first, providing real-time win rates for your favorite sessions.
The Candle Bias Stats indicator automatically categorizes every candle based on the MMM candle bias and tracks their historical success rate. It calculates how often a candle's high/low is broken before its opposite end is touched. By breaking this data down into sessions (Asian, London, NY), it identifies high-probability "time-of-day" windows where specific price action setups are most reliable.
MMM CANDLE LOGIC
Bullish Expansion & Breakout Signatures
Bullish Body Close Plus (BuBC Plus): Represents strong bullish momentum where price closes above the previous high and near its own top, signaling that buyers are in complete control.
Bullish Body Close Minus (BuBC Minus): Indicates weak bullish momentum; while the price closes above the previous high, a long top wick shows sellers pushed back, suggesting a potential retest of the previous high.
Bearish Expansion & Breakout Signatures
Bearish Body Close Plus (BeBC Plus): A very strong bearish signal where price closes below the previous low and near its own bottom, indicating sellers are dominant.
Bearish Body Close Minus (BeBC Minus): Signifies weak bearish momentum; the price breaks the previous low but finishes with a long bottom wick as buyers push back, often leading to a retest of the old ceiling.
Bullish Reversal & Trap Signatures (Affinity)
Bullish Affinity Plus (BuAF Plus): A strong bullish reversal where a new low is made, but sellers hit a wall and get trapped, causing price to finish near its top with a long bottom wick.
Bullish Affinity Minus (BuAF Minus): A weak bullish bounce where a new low is made and price finishes back inside the previous range, but buyers lack the energy for a significant move.
Bearish Reversal & Trap Signatures (Affinity)
Bearish Affinity Plus (BeAF Plus): A strong bearish reversal; buyers are trapped after making a new high, and price finishes near its bottom with a long top wick.
Bearish Affinity Minus (BeAF Minus): A weak bearish drop where sellers stop the rise but lack the energy to push price significantly lower.
Neutral & Volatility Signatures
Close Inside Bullish (CI•BuAF): Bullish neutral state where price stays inside the previous candle’s range but finishes in the top half, indicating buyers are slightly more active.
Close Inside Bearish (CI•BeAF): Bearish neutral state where price remains inside the previous box and finishes in the bottom half.
Seek & Destroy Bullish (S&D•BuAF): Bullish volatility characterized by price moving above and below the previous candle before buyers win the battle and close price near the top.
Seek & Destroy Bearish (S&D•BeAF): Bearish volatility where sellers win a high-chaos battle, closing price near the bottom after sweeping both sides of the previous candle.
H4 CANDLE EXAMPLE
Deep Dive: Analysis of the 4H Statistics
The image presents a comprehensive backtest of 4,999 total candles from September 2022 to December 2025. Here is the breakdown of what the interface is telling us:
1. The Strategy: Target vs. Invalidation
The indicator tracks BuBC (Bullish Body Close) and BeBC (Bearish Body Close).
The Target: For a Bullish candle, the target is the High. For a Bearish candle, it is the Low.
The Invalidation: The opposite end of the candle (the Low for Bullish, the High for Bearish).
The Goal: To see which level is touched first in the subsequent bars.
2. Global Performance (The Top Right Table)
Looking at the BuBC (1402 samples) section:
Target First (67.8%): In nearly 7 out of 10 cases, once a 4H candle closes "bullish" (breaking the previous high), the price continues higher to break its own high before it ever returns to take out its own low.
Both Hit (17.7%): This is a critical metric. It represents "Stop Runs" or "Wicks" where price hits the target but also hits the invalidation within the same tracking period.
Efficiency (1.3 Bars): This tells us the "follow-through" is almost immediate. If the trade doesn't work within 1 or 2 candles, the statistical edge drops off significantly.
3. The Session Breakdown (The Bottom Left Table)
This is where the "Edge" is found. Not all hours of the day are created equal.
Asian Late (02:00-06:00) – The "Star" Performer: With a 72.9% Target rate, this is labeled "BEST." It has the lowest "Both%" (6.5%), meaning moves during these hours are incredibly "clean." If a setup forms here, price usually moves directly to the target without looking back.
London Open & Overlap (06:00-14:00): These sessions maintain a high win rate (approx. 70%). This suggests that the European session provides reliable trend continuation for the S&P 500.
NY Session (14:00-18:00) – The "Trap" Zone: This is labeled "WORST" for a reason. While the win rate is basically a coin flip (49.6%), the Both% spikes to 36.7%. This means that even if you are right about the direction, the market is highly likely to "sweep" your stop loss before going to the target. It is the most volatile and "fake-out" prone time for this specific setup.
Summary of the Data
The statistics show that the S&P 500 4H Candle Bias is a highly reliable trend-following indicator, provided you trade it at the right time.
The data suggests a clear three-step logic:
Directional Edge: Both Bullish and Bearish body closes have a natural ~67% probability of continuation.
Timing is Everything: Trading during the Late Asian and London sessions increases your probability of success to over 70% with very low risk of a "fake-out."
Risk Warning: Avoid "Body Close" breakout strategies during the NY Mid-day (14:00-18:00). The statistics prove that this window is dominated by "Seek and Destroy" price action, where price is mathematically likely to hit both your target and your stop, usually hitting the stop first.

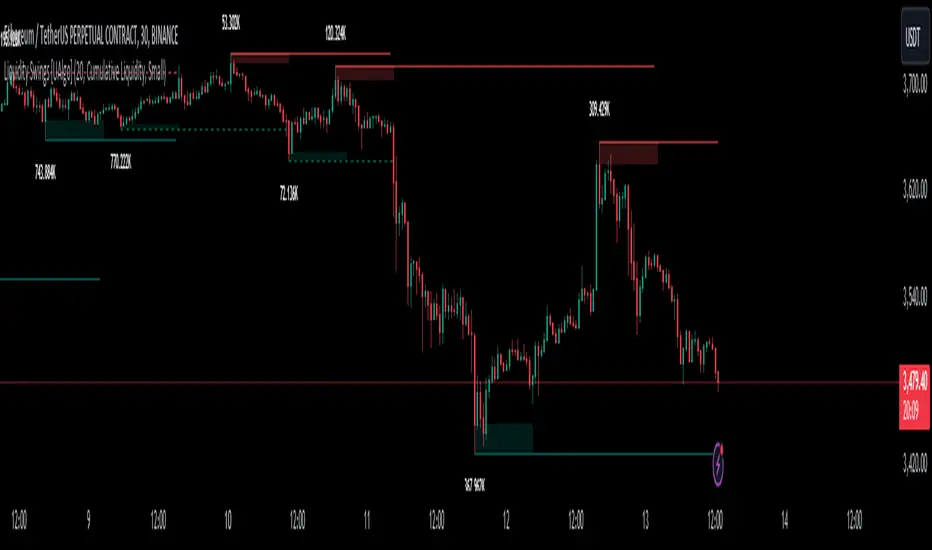
Liquidity Swings [UAlgo]The "Liquidity Swings " indicator is designed to help traders identify liquidity swings within the market. This tool is particularly useful for visualizing areas where liquidity is accumulating and where it is being swept, providing valuable insights for making informed trading decisions. By tracking the pivots in price and associating them with volume, the indicator highlights zones of potential support and resistance, helping traders understand market dynamics more clearly.
🔶 Key Features
Liquidity Swing Sensitivity: Adjustable sensitivity settings to fine-tune the detection of liquidity swings according to market conditions and trader preferences.
Two modes of liquidity calculation:
Cumulative Liquidity: Aggregates unswept liquidity over multiple swings until it is swept, providing a broader view of liquidity accumulation.
Individual Liquidity: Displays the accumulated liquidity for each swing independently, offering a more granular perspective.
Visual Customization: Options to customize the colors and sizes of liquidity lines, areas, and informational text for better visual clarity.
Dynamic Updates: The indicator dynamically updates liquidity zones and labels, adjusting to new market data to keep traders informed in real-time.
🔶 Disclaimer
The "Liquidity Swings " indicator is provided for educational and informational purposes only.
It should not be considered as financial advice or a recommendation to buy or sell any financial instrument.
The use of this indicator involves inherent risks, and users should employ their own judgment and conduct their own research before making any trading decisions. Past performance is not indicative of future results.
🔷 Related Scripts
Liquidity Sweeps
Williams %R Liquidity Sweeps
BB Re-entry HUD1) What this script does
This indicator is an BB Re-entry HUD
Core idea:
Price sweeps outside BB (often liquidity wick sweep)
Re-enters back inside BB within 1–2 bars
Multiple ELITE++ filters reduce fake signals
HUD scores follow-through strength (trend & momentum confirmation)
2) ELITE++ Re-entry Signal Logic
A BUY/SELL signal is triggered when:
One of the previous 1–2 bars moved outside BB (wick or close, selectable)
Current bar re-enters BB (optionally requires close inside)
Optional filters confirm signal quality:
Outside depth minimum (% of BB width)
Candle direction confirmation (Buy=green, Sell=red)
Re-entry close crosses previous candle 50%
Zone filter near BB edges
Touch filter: wick touches the band
Squeeze → Expand regime requirement
Cooldown to avoid rapid repeat signals
3) Trade Power HUD (0–5 Scoring)
After a signal, HUD evaluates either on the next bar (recommended) or the same bar.
Score components (1 point each):
Structure: short-term structure aligns with direction
Impulse Body: body > average body
Volume: volume > volume MA
BB Trend + Expand: price on trend side + BB width expanding
RSI + ATR: RSI threshold + ATR expanding
Interpretation:
4–5/5 = STRONG → Hold / Trail
2–3/5 = MID → Take partial / be cautious
0–1/5 = WEAK → Higher chance of fakeout
4) How to use (practical)
Enable BB plots and arrows
Wait for BUY/SELL signal
Check HUD score:
4–5: higher follow-through probability
2–3: quick TP / reduced size
0–1: skip or wait for better confirmation
Works well on 5m–15m (intraday) and 1H (smoother swings).
5) Notes
This is not a standalone holy grail—best used with support/resistance and market structure context.
Volatile news periods may produce multiple band breaks—use squeeze/cooldown filters accordingly.

CBDR Standard Deviation V2CBDR
Standard Deviation measures how far price statistically deviates from the central bank dealer range before institutional rebalancing occurs. CBDR defines fair value, while standard deviation highlights liquidity expansion zones. Moves into ±2 SD or beyond often signal stop-loss sweeps and inventory imbalance, where institutions favor mean reversion, not breakouts.
CBDR SD Core Checklist
□ Daily IPDA bias defined
□ Clean CBDR formed (Asia / early London)
□ CBDR high & low marked
□ ±1 and ±2 SD levels plotted
□ Liquidity sweep beyond CBDR
□ No high-impact news in session
CBDR SD Reversal Trade Checklist
□ Price taps ±2 SD or ±2.5 SD
□ Clear rejection (wick / displacement)
□ Entry against the expansion, not on breakout
□ Stop placed beyond liquidity extreme
□ TP1: CBDR boundary
□ TP2: CBDR midpoint (mean)
□ TP3 (optional): Opposite CBDR extreme
□ Invalidate if strong trend displacement continues
This reversal model captures institutional fade trades after liquidity is harvested, keeping execution statistical, disciplined, and prop-firm resilient.

[turpsy] Midnight Opening Range-Fractal Midnight Open Range-Fractal Combined Trading System
Overview
This indicator combines Midnight Opening Range (MOR) analysis with HTF candle structure and fractal patterns to provide a comprehensive intraday trading framework. Unlike simple mashups, this system integrates three complementary methodologies that work together to identify high-probability trading zones.
Core Components & Synergy
1. MOR (Midnight Opening Range) Indicator
- Tracks the first 30 minutes of each trading day (00:00-00:30)
- Draws historical and current session boxes with quartile levels (25%, 50%, 75%)
- Custom opening price lines for key market times (NY Open 9:30, London Close, etc.)
- Concept:
Price tends to respect the opening range boundaries; quartiles act as support/resistance
2. HTF (Higher Timeframe) Candles
- Displays up to 6 higher timeframe candles alongside your chart
- Shows Fair Value Gaps (FVG) and Volume Imbalances (VI)
- Presents First Presented FVG (PFVG) - the initial gap after a fractal
- Concept:
HTF structure provides context for LTF entries; FVGs are magnetic price targets
3. Fractal Pattern Detection with CISD
- Identifies swing highs/lows using HTF candle structure
- CISD (Change in State of Delivery) lines mark confirmed fractal breaks
- Chart sweeps show liquidity grabs
- Concept: Fractals mark key market structure; CISD confirms directional bias
4. Killzones & Session Analysis
- Asia, London, NewYork AM/PM, and Lunch sessions
- Session highs/lows with pivot tracking
- Day/Week/Month opens and separators
- Concept: Specific sessions show characteristic volatility and directional behavior
5. ADR/CDR Analysis
- Average Daily Range and Current Daily Range tracking
- Shows percentage of ADR completed
- Concept: Helps gauge if there's room for continuation or if exhaustion is likely
How They Work Together
1. Context: It uses HTF candles and MOR boxes to identify the bigger picture structure
2. Timing: It uses Killzones to show when institutional activity is highest
3. Entry: It uses Fractals with CISD confirm structure breaks; FVGs provide entry zones
4. Risk Management: ADR/CDR helps set realistic profit targets and assess if move is extended
Original Contributions
This script significantly improves upon the base components by:
- Integrating 1-minute data feed for accurate Midnight Open Range calculations on all timeframes
- Adding PFVG detection synchronized with fractal patterns
- Creating logarithmic midpoint calculations between HTF candles
- Implementing chart sweep detection for liquidity analysis
- Adding CISD projection lines at 0.5, 1.0, 1.5, 2.0 extensions
How to Use
1. Enable desired HTF timeframes and MOR settings
2. Watch for PFVG formation after HTF candle closes
3. Look for CISD line breaks during killzone sessions
4. Enter at FVG mitigation zones aligned with MOR quartiles
5. Monitor ADR% to gauge move potential
Credits
- HTF Candles base structure: fadizeidan & tradeforopp
- Midnight opening range: trades-dont-lie
- I made the Significant modifications and integration

Global Sessions Pro NY/London/Tokyo - O/C/H/LGLOBAL SESSIONS PRO — NY / LONDON / TOKYO
Session Opens, Highs, Lows, Midpoints, Closes, Ranges & Killzones
OVERVIEW
Global Sessions Pro is a comprehensive session-mapping indicator designed for traders who rely on market structure, session context, and time-based behavior.
The indicator automatically plots New York, London, and Tokyo sessions, including:
• Session Open, High, Low, Midpoint, and Close
• Prior session levels projected forward
• Session range boxes
• Right-side labeled price levels (clearly identified)
• Stacked session summary labels (no overlap)
• Optional killzones and overlap windows
• Breakout alerts (prior or current session levels)
The script is fully timezone-aware, DST-safe, and works on any chart timeframe.
KEY FEATURES
SESSION MAPPING
For each session (NY / London / Tokyo), the indicator can display:
• Open
• High
• Low
• Midpoint (High + Low) / 2
• Close
Each level is drawn with its own horizontal line and optional right-side label, so there is never confusion about which line represents which level.
SESSION RANGE BOXES
Optional shaded boxes highlight the true session range as it develops in real time.
These are useful for visualizing:
• Compression vs expansion
• Relative session volatility
• Strength or weakness between sessions
Opacity and visibility are fully configurable.
RIGHT-SIDE LEVEL LABELS
Each session level can be labeled on the right edge of the chart, showing:
• Session name (NY / Lon / Tok)
• Level type (O / H / L / M / C)
• Optional price value
Examples:
NY H: 18234.25
Lon L: 18098.50
Tok M: 18142.75
This eliminates ambiguity when multiple session levels overlap or share similar colors.
SESSION SUMMARY LABELS (AUTO-STACKED)
At the top of each session range, an optional summary label displays:
• Session name
• Open / High / Low / Close
• Total range (points)
• Range in ticks
• ATR multiple
Summary labels are automatically stacked vertically using ATR-based or tick-based spacing, preventing overlap even when multiple sessions occur close together.
PRIOR SESSION LEVELS
The indicator can project prior session levels into the next session, including:
• Prior High and Low
• Optional prior Open, Close, and Midpoint
These levels are commonly used for:
• Support and resistance
• Liquidity sweeps
• Mean reversion
• Failed breakouts
Projection length is configurable and safely capped to comply with TradingView drawing limits.
KILLZONES AND SESSION OVERLAPS
Optional background shading highlights key institutional windows:
• London Open
• New York Open
• London / New York overlap
These zones help identify high-probability volatility windows and time-based trade filters.
All killzones respect the selected session timezone basis.
ALERTS
Built-in alerts are available for:
• Break of prior session high
• Break of prior session low
• Break of current session high
• Break of current session low
Alerts can be configured to trigger on wick or close.
Alert logic is written using precomputed crossover detection to ensure historical consistency and avoid missed or false alerts.
TIMEZONE AND SESSION HANDLING (IMPORTANT)
SESSION TIME BASIS OPTIONS
The indicator supports three session-time modes:
Market Local (DST-aware) – Recommended
• New York uses America/New_York
• London uses Europe/London
• Tokyo uses Asia/Tokyo
• Automatically adjusts for daylight saving time
UTC (Fixed)
• Sessions are interpreted strictly in UTC
• Best for crypto or non-DST workflows
• Requires manual adjustment during DST changes
Custom Timezone
• Define a single custom timezone for all sessions
This ensures sessions display correctly regardless of the chart’s timezone.
DEFAULT SESSION TIMES
(Default values assume Market Local (DST-aware) mode)
Tokyo: 09:00 – 15:00
London: 08:00 – 16:30
New York: 09:30 – 16:00
These defaults are optimized for cash and index trading.
FX traders may adjust session windows as needed.
BEST USE CASES
This indicator is particularly effective for:
• Index futures (ES, NQ, RTY, DAX, FTSE)
• Forex session-based strategies
• Time-based breakout systems
• Liquidity sweep and mean-reversion models
• London Open and New York Open trading
• Multi-session market context analysis
PERFORMANCE AND SAFETY NOTES
• All future-drawn objects are capped to comply with TradingView limits
• Crossover logic is evaluated every bar to prevent calculation drift
• Old session drawings are automatically culled to reduce chart clutter
• Works on all intraday and higher timeframes
RECOMMENDED SETTINGS
For most traders:
• Session Time Basis: Market Local (DST-aware)
• Show Open / High / Low / Midpoint: ON
• Prior Session Levels: ON
• Summary Labels: ON
• Killzones: ON
• Alerts: ON (Close-based)
FINAL NOTES
This indicator is designed to provide objective session structure without opinionated trade signals. It works best as a context layer combined with your own execution rules, confirmations, and risk management.
If you trade time, structure, and liquidity, this script provides the framework.

ODTE Layman Signals 📌 Script Name
Layman Options Signals – Structured BUY CALL / BUY PUT with SL & TP
📖 Overview
This indicator is a complete, finished intraday trading system designed to simplify options trading (including 0DTE and weekly options) by converting price action and market structure into clear, actionable signals.
The script performs all analysis in the background and displays only what the trader needs to execute consistently:
BUY CALL or BUY PUT
Predefined Stop Loss (SL)
Two Take Profit levels (TP1 and TP2)
Trade status and levels displayed in a live status box
The focus of this tool is execution discipline, not prediction.
🧠 Core Concepts Used (What Makes This Script Original)
This script combines multiple price-action concepts into a single, rule-based framework:
1️⃣ Opening Range Breakout (ORB)
The script calculates the opening range high and low using the first X minutes of the regular session.
Trades are only allowed above ORB high for CALLs and below ORB low for PUTs.
This filters low-quality trades during early chop.
2️⃣ Market Structure Confirmation
CALL trades require higher highs and higher lows
PUT trades require lower lows and lower highs
This prevents trading against structure.
3️⃣ Retest & Liquidity Sweep Validation
Breakouts are validated using:
ORB retests (price accepts above/below the range)
Liquidity sweeps (false breakouts that trap traders)
This helps reduce fake breakouts.
4️⃣ Volatility-Aware Risk Management
Stop losses are placed using market structure + ATR buffer
This avoids stops being placed at obvious levels.
5️⃣ Multi-Target Trade Management
TP1 = partial profit (risk reduction)
TP2 = runner target (trend continuation)
After TP1, stop loss can move to breakeven (optional)
6️⃣ Discipline Controls
Only one active trade at a time
Cooldown period after a stop loss
Prevents over-trading and revenge trading
📊 What the Indicator Displays
The script plots the following directly on the chart:
Entry level
Stop Loss (SL)
Take Profit 1 (TP1)
Take Profit 2 (TP2)
Opening Range High & Low
It also includes a Status Box that always shows one of the following states:
WAIT
BUY CALL
BUY PUT
IN TRADE
COOLDOWN
This allows traders to understand the current state at a glance without reading code.
▶️ How to Use the Indicator
Recommended Timeframes
1-minute or 2-minute charts
Intraday use only
Entry Rules
When BUY CALL appears → Buy an ATM or slightly ITM call
When BUY PUT appears → Buy an ATM or slightly ITM put
Risk Management
Exit immediately if price hits the SL line
Take partial profits at TP1
Hold remaining position for TP2 if conditions allow
When Status Shows WAIT or COOLDOWN
No trade should be taken
⚙️ Recommended Instruments
SPY / QQQ
Liquid large-cap stocks
Intraday options (0DTE / weeklies)
⚠️ Important Disclaimer
This script is provided for educational purposes only.
It is not financial advice
It does not guarantee profits
It does not place trades automatically
Options trading involves significant risk
Always test using paper trading or small size before live use.
🎯 Who This Script Is For
✔ Traders who want clear rules
✔ Traders who prefer price action over indicators
✔ Options traders who value risk management
✔ Users who want less chart clutter and more discipline
❌ Not intended for swing trading
❌ Not intended for automated trading systems
🧩 Final Notes
This is a complete, finished indicator, not a test or experimental script.
All logic is deterministic, non-repainting, and designed for real-time use.
The philosophy behind this tool is simple:
Good trading comes from structure, discipline, and risk control — not prediction.

NY LONDON LUNCH AUTO**NY London Lunch Auto** is a precision session-anchor indicator designed for traders who focus on institutional timing and liquidity behavior.
This script automatically marks the **high and low of three key 15-minute New York session candles**:
• **3:00 AM NY** — London session expansion
• **8:00 AM NY** — New York open / kill zone
• **2:00 PM NY** — NY lunch / power hour transition
Each time one of these candles prints on the **15-minute chart**, the script captures its exact high and low and extends them forward as horizontal levels.
The levels remain **locked and unchanged** until the next key session candle appears, ensuring clean, non-repainting reference zones.
### Key Features
• Works **exclusively on the 15-minute timeframe**
• Automatically updates at **3AM, 8AM, and 2PM NY time**
• Levels stay fixed — no drifting or recalculation
• Clean, minimal design with customizable colors
• Ideal for liquidity sweeps, displacement, and ICT-style execution models
This indicator is built for traders who want **clarity, patience, and structure**, not clutter. It pairs seamlessly with liquidity sweep, displacement, and fair value gap strategies.

Session Highs and Lows🔑 Key Levels: Session Liquidity & Structure Mapper
The Key Levels indicator is an essential tool for traders as it automatically plots and projects critical Highs and Lows established during key trading sessions. These levels represent major liquidity pools and define the current market structure, serving as high-probability targets, support, or resistance for the remainder of the trading day.
⚙️ Core Functionality
The indicator operates in two distinct modes, tailored for different asset classes:
1. Asset Class Mode (Toggle)
You can switch between two predefined setups depending on the asset you are trading:
Stock Mode (RTH/ETH): Designed for US stocks and futures (e.g., NQ, ES, YM). It tracks and projects levels for Regular Trading Hours (RTH) (09:30-16:00) and Extended Hours (ETH) (16:00-09:30).
Forex/Default Mode (Asia/London/NY): Designed for global markets (e.g., currency pairs). It tracks and projects levels for the three major liquidity sessions: Asia (19:00-03:00), London (03:00-09:30), and New York (09:30-16:00).
🗺️ Key Levels Mapped
The script continuously tracks and plots the most significant structural levels:
Current Session High/Low: The running high and low of the currently active session.
Previous Session High/Low: The confirmed high and low from the most recently completed session. These are often targeted by market makers.
Previous Day High/Low (PDH/PDL): The high and low of the prior 24-hour day, acting as major structural boundaries and a crucial macro market filter.
🎛️ Advanced Liquidity Management
The indicator is built with specific controls for high-level liquidity analysis:
Extend Through Sweeps (Critical Setting):
OFF (Recommended): The projected line is automatically stopped or deleted the moment the price candle wicks or closes past it. This visually confirms that the liquidity at that level has been "swept" or "mitigated."
ON: The line extends indefinitely, treating the level as simple support/resistance, regardless of interaction.
Previous vs. Current View: You can select a checkbox (e.g., Use PREVIOUS London Level) to hide the current session's running levels and only display the static, confirmed high/low from the prior completed session. This helps declutter the chart and focus only on the confirmed structural levels.
Show Older History: Toggle to keep lines from prior days visible, allowing you to track multi-day structural context.
🎯 Trading Application
The lines plotted by the Key Levels indicator provide immediate, actionable information:
Bias Filter: Use the PDH/PDL to determine the overall market context. Trading above the PDH suggests a bullish bias, while trading below the PDL suggests a bearish bias.
Manipulation/Entry: Wait for price to aggressively sweep a Previous Session High/Low (line stops extending). This often signals a liquidity grab or "manipulation" phase. Look for entries in the opposite direction for the main move (Distribution).
Targets: Key levels (especially unmitigated ones) serve as excellent, objective take-profit targets for active trades.

Advanced Triple Strategy ScalperHere are the three scalping strategies presented in the video "3 Scalping Strategies That Work Every Day (Backtested & Proven)" by Asia Forex Mentor – Ezekiel Chew:
### Scalper’s Trend Filter (Triple EMA)
This strategy uses three EMAs (25, 50, 100) on the 5-minute chart to filter high-probability trades aligned with momentum .
- Only trade when all three EMAs are angled in the same direction and clearly separated (no crossing or tangling) .
- Enter when price pulls back toward the 25 or 50 EMA and then bounces back toward the 25 EMA, but do not enter if price closes below the 100 EMA .
- Set stop-loss just below the 50 EMA or swing low and aim for a risk-to-reward ratio of 1:1.5 .
### Flip Zone Trap (Reversal Catching)
This method identifies precise reversal moments where market structure shifts from weakness to strength .
- Use the 15-min chart to locate key support or resistance zones where price previously reacted .
- Wait for price to stop making lower lows and begin making higher highs (or vice versa for shorts); confirm with a trendline break AND follow-through (higher lows & highs within 5-7 candles) .
- Use confirmation candles (bullish engulfing, pin bar rejection) at the zone before entry .
### Liquidity Shift Trigger (Smart Money Trap)
This system leverages institutional stop hunts and liquidity sweeps at key zones for sniper entries .
- Start with a 15-min chart to identify structure breaks and points of interest (order blocks, flip zones, demand zones) .
- Drop to 1-min chart and wait for price to enter the refined zone and sweep liquidity (sharp wick/spike below/above key level) .
- Once liquidity is swept, wait for a clean structure shift (break of most recent internal high or low) within 5–6 candles—if confirmed, refine entry to the candle that caused the break and enter when price returns to that candle with a strong reaction .
***
### Practical Application
- These strategies are systematic, rule-based, and designed to cut out fake moves, avoid early stop-outs, and align entries with momentum and institutional activity .
- Perfect for short timeframes and volatile pairs like XAUUSD, especially if paired with additional confirmation from other technical analysis tools .
All three strategies emphasize filtering noise, waiting for momentum/trend confirmation, and avoiding impulsive entries—key principles for consistent scalping success

Opening Range Breakout with Multi-Timeframe Liquidity]═══════════════════════════════════════
OPENING RANGE BREAKOUT WITH MULTI-TIMEFRAME LIQUIDITY
═══════════════════════════════════════
A professional Opening Range Breakout (ORB) indicator enhanced with multi-timeframe liquidity detection, trading session visualization, volume analysis, and trend confirmation tools. Designed for intraday trading with comprehensive alert system.
───────────────────────────────────────
WHAT THIS INDICATOR DOES
───────────────────────────────────────
This indicator combines multiple trading concepts:
- Opening Range Breakout (ORB) - Customizable time period detection with automatic high/low identification
- Multi-Timeframe Liquidity - HTF (Higher Timeframe) and LTF (Lower Timeframe) key level detection
- Trading Sessions - Tokyo, London, New York, and Sydney session visualization
- Volume Analysis - Volume spike detection and strength measurement
- Multi-Timeframe Confirmation - Trend bias from higher timeframes
- EMA Integration - Trend filter and dynamic support/resistance
- Smart Alerts - Quality-filtered breakout notifications
───────────────────────────────────────
HOW IT WORKS
───────────────────────────────────────
OPENING RANGE BREAKOUT (ORB):
Concept:
The Opening Range is a period at the start of a trading session where price establishes an initial high and low. Breakouts beyond this range often indicate the direction of the day's trend.
Detection Method:
- Default: 15-minute opening range (configurable)
- Custom Range: Set specific session times with timezone support
- Automatically identifies ORH (Opening Range High) and ORL (Opening Range Low)
- Tracks ORB mid-point for reference
Range Establishment:
1. Session starts (or custom time begins)
2. Tracks highest high and lowest low during the period
3. Range confirmed at end of opening period
4. Levels extend throughout the session
Breakout Detection:
- Bullish Breakout: Close above ORH
- Bearish Breakout: Close below ORL
- Mid-point acts as bias indicator
Visual Display:
- Shaded box during range formation
- Horizontal lines for ORH, ORL, and mid-point
- Labels showing level values
- Color-coded fills based on selected method
Fill Color Methods:
1. Session Comparison:
- Green: Current OR mid > Previous OR mid
- Red: Current OR mid < Previous OR mid
- Gray: Equal or first session
- Shows day-over-day momentum
2. Breakout Direction (Recommended):
- Green: Price currently above ORH (bullish breakout)
- Red: Price currently below ORL (bearish breakout)
- Gray: Price inside range (no breakout)
- Real-time breakout status
MULTI-TIMEFRAME LIQUIDITY:
Two-Tier System for comprehensive level identification:
HTF (Higher Timeframe) Key Liquidity:
- Default: 4H timeframe (configurable to Daily, Weekly)
- Identifies major institutional levels
- Uses pivot detection with adjustable parameters
- Suitable for swing highs/lows where large orders rest
LTF (Lower Timeframe) Key Liquidity:
- Default: 1H timeframe (configurable)
- Provides precision entry/exit levels
- Finer granularity for intraday trading
- Captures minor swing points
Calculation Method:
- Pivot high/low detection algorithm
- Configurable left bars (lookback) and right bars (confirmation)
- Timeframe multiplier for accurate multi-timeframe detection
- Automatic level extension
Mitigation System:
- Tracks when levels are swept (broken)
- Configurable mitigation type: Wick or Close-based
- Option to remove or show mitigated levels
- Display limit prevents chart clutter
Asset-Specific Optimization:
The indicator includes quick reference settings for different assets:
- Major Forex (EUR/USD, GBP/USD): Default settings optimal
- Crypto (BTC/ETH): Left=12, Right=4, Display=7
- Gold: HTF=1D, Left=20
TRADING SESSIONS:
Four Major Sessions with Full Customization:
Tokyo Session:
- Default: 04:00-13:00 UTC+4
- Asian trading hours
- Often sets daily range
London Session:
- Default: 11:00-20:00 UTC+4
- Highest liquidity period
- Major institutional activity
New York Session:
- Default: 16:00-01:00 UTC+4
- US market hours
- High-impact news events
Sydney Session:
- Default: 01:00-10:00 UTC+4
- Earliest Asian activity
- Lower volatility
Session Features:
- Shaded background boxes
- Session name labels
- Optional open/close lines
- Session high/low tracking with colored lines
- Each session has independent color settings
- Fully customizable times and timezones
VOLUME ANALYSIS:
Volume-Based Trade Confirmation:
Volume MA:
- Configurable period (default: 20)
- Establishes average volume baseline
- Used for spike detection
Volume Spike Detection:
- Identifies when volume exceeds MA * multiplier
- Default: 1.5x average volume
- Confirms breakout strength
Volume Strength Measurement:
- Calculates current volume as percentage of average
- Shows relative volume intensity
- Used in alert quality filtering
High Volume Bars:
- Identifies bars above 50th percentile
- Additional confirmation layer
- Indicates institutional participation
MULTI-TIMEFRAME CONFIRMATION:
Trend Bias from Higher Timeframes:
HTF 1 (Trend):
- Default: 1H timeframe
- Uses EMA to determine intermediate trend
- Compares current timeframe EMA to HTF EMA
HTF 2 (Bias):
- Default: 4H timeframe
- Uses 50 EMA for longer-term bias
- Confirms overall market direction
Bias Classifications:
- Bullish Bias: HTF close > HTF 50 EMA AND Current EMA > HTF1 EMA
- Bearish Bias: HTF close < HTF 50 EMA AND Current EMA < HTF1 EMA
- Neutral Bias: Mixed signals between timeframes
EMA Stack Analysis:
- Compares EMA alignment across timeframes
- +1: Bullish stack (lower TF EMA > higher TF EMA)
- -1: Bearish stack (lower TF EMA < higher TF EMA)
- 0: Neutral/crossed
Usage:
- Filters false breakouts
- Confirms trend direction
- Improves trade quality
EMA INTEGRATION:
Dynamic EMA for Trend Reference:
Features:
- Configurable period (default: 20)
- Customizable color and width
- Acts as dynamic support/resistance
- Trend filter for ORB trades
Application:
- Above EMA: Favor long breakouts
- Below EMA: Favor short breakouts
- EMA cross: Potential trend change
- Distance from EMA: Momentum gauge
SMART ALERT SYSTEM:
Quality-Filtered Breakout Notifications:
Alert Types:
1. Standard ORB Breakout
2. High Quality ORB Breakout
Quality Criteria:
- Volume Confirmation: Volume > 1.2x average
- MTF Confirmation: Bias aligned with breakout direction
Standard Alert:
- Basic breakout detection
- Price crosses ORH or ORL
- Icon: 🚀 (bullish) or 🔻 (bearish)
High Quality Alert:
- Both volume AND MTF confirmed
- Stronger probability setup
- Icon: 🚀⭐ (bullish) or 🔻⭐ (bearish)
Alert Information Includes:
- Alert quality rating
- Breakout level and current price
- Volume strength percentage (if enabled)
- MTF bias status (if enabled)
- Recommended action
One Alert Per Bar:
- Prevents alert spam
- Uses flag system to track sent alerts
- Resets on new ORB session
───────────────────────────────────────
HOW TO USE
───────────────────────────────────────
OPENING RANGE SETUP:
Basic Configuration:
1. Select time period for opening range (default: 15 minutes)
2. Choose fill color method (Breakout Direction recommended)
3. Enable historical data display if needed
Custom Range (Advanced):
1. Enable Custom Range toggle
2. Set specific session time (e.g., 0930-0945)
3. Select appropriate timezone
4. Useful for specific market opens (NYSE, LSE, etc.)
LIQUIDITY LEVELS SETUP:
Quick Configuration by Asset:
- Forex: Use default settings (Left=15, Right=5)
- Crypto: Set Left=12, Right=4, Display=7
- Gold: Set HTF=1D, Left=20
HTF Liquidity:
- Purpose: Major support/resistance levels
- Recommended: 4H for day trading, 1D for swing trading
- Use as profit targets or reversal zones
LTF Liquidity:
- Purpose: Entry/exit refinement
- Recommended: 1H for day trading, 4H for swing trading
- Use for position management
Mitigation Settings:
- Wick-based: More sensitive (default)
- Close-based: More conservative
- Remove or Show mitigated levels based on preference
TRADING SESSIONS SETUP:
Enable/Disable Sessions:
- Master toggle for all sessions
- Individual session controls
- Show/hide session names
Session High/Low Lines:
- Enable to see session extremes
- Each session has custom colors
- Useful for range trading
Customization:
- Adjust session times for your broker
- Set timezone to match your location
- Customize colors for visibility
VOLUME ANALYSIS SETUP:
Enable Volume Analysis:
1. Toggle on Volume Analysis
2. Set MA length (20 recommended)
3. Adjust spike multiplier (1.5 typical)
Usage:
- Confirm breakouts with volume
- Identify climactic moves
- Filter false signals
MULTI-TIMEFRAME SETUP:
HTF Selection:
- HTF 1 (Trend): 1H for day trading, 4H for swing
- HTF 2 (Bias): 4H for day trading, 1D for swing
Interpretation:
- Trade only with bias alignment
- Neutral bias: Be cautious
- Bias changes: Potential reversals
EMA SETUP:
Configuration:
- Period: 20 for responsive, 50 for smoother
- Color: Choose contrasting color
- Width: 1-2 for visibility
Usage:
- Filter trades: Long above, Short below
- Dynamic support/resistance reference
- Trend confirmation
ALERT SETUP:
TradingView Alert Creation:
1. Enable alerts in indicator settings
2. Enable ORB Breakout Alerts
3. Right-click chart → Add Alert
4. Select this indicator
5. Choose "Any alert() function call"
6. Configure delivery method (mobile, email, webhook)
Alert Filtering:
- All alerts include quality rating
- High Quality alerts = Volume + MTF confirmed
- Standard alerts = Basic breakout only
───────────────────────────────────────
TRADING STRATEGIES
───────────────────────────────────────
CLASSIC ORB STRATEGY:
Setup:
1. Wait for opening range to complete
2. Price breaks and closes above ORH or below ORL
3. Volume > average (if enabled)
4. MTF bias aligned (if enabled)
Entry:
- Bullish: Buy on break above ORH
- Bearish: Sell on break below ORL
- Consider retest entries for better risk/reward
Stop Loss:
- Bullish: Below ORL or range mid-point
- Bearish: Above ORH or range mid-point
- Adjust based on volatility
Targets:
- Initial: Range width extension (ORH + range width)
- Secondary: HTF liquidity levels
- Final: Session high/low or major support/resistance
ORB + LIQUIDITY CONFLUENCE:
Enhanced Setup:
1. Opening range established
2. HTF liquidity level near or beyond ORH/ORL
3. Breakout occurs with volume
4. Price targets the liquidity level
Entry:
- Enter on ORB breakout
- Target the HTF liquidity level
- Use LTF liquidity for position management
Management:
- Partial profits at ORB + range width
- Move stop to breakeven at LTF liquidity
- Final exit at HTF liquidity sweep
ORB REJECTION STRATEGY (Counter-Trend):
Setup:
1. Price breaks above ORH or below ORL
2. Weak volume (below average)
3. MTF bias opposite to breakout
4. Price closes back inside range
Entry:
- Failed bullish break: Short below ORH
- Failed bearish break: Long above ORL
Stop Loss:
- Beyond the failed breakout level
- Or beyond session extreme
Target:
- Opposite end of opening range
- Range mid-point for partial profit
SESSION-BASED ORB TRADING:
Tokyo Session:
- Typically narrower ranges
- Good for range trading
- Wait for London open breakout
London Session:
- Highest volume and volatility
- Strong ORB setups
- Major liquidity sweeps common
New York Session:
- Strong trending moves
- News-driven volatility
- Good for momentum trades
Sydney Session:
- Quieter conditions
- Suitable for range strategies
- Sets up Tokyo session
EMA-FILTERED ORB:
Rules:
- Only take bullish breaks if price > EMA
- Only take bearish breaks if price < EMA
- Ignore counter-trend breaks
Benefits:
- Reduces false signals
- Aligns with larger trend
- Improves win rate
───────────────────────────────────────
CONFIGURATION GUIDE
───────────────────────────────────────
OPENING RANGE SETTINGS:
Time Period:
- 15 min: Standard for most markets
- 30 min: Wider range, fewer breakouts
- 60 min: For slower markets or swing trades
Custom Range:
- Use for specific market opens
- NYSE: 0930-1000 EST
- LSE: 0800-0830 GMT
- Set timezone to match exchange
Historical Display:
- Enable: See all previous session data
- Disable: Cleaner chart, current session only
LIQUIDITY SETTINGS:
Left Bars (5-30):
- Lower: More frequent, sensitive levels
- Higher: Fewer, more significant levels
- Recommended: 15 for most markets
Right Bars (1-25):
- Confirmation period
- Higher: More reliable, less frequent
- Recommended: 5 for balance
Display Limit (1-20):
- Number of active levels shown
- Higher: More context, busier chart
- Recommended: 7 for clarity
Extension Options:
- Short: Levels visible near formation
- Current: Extended to current bar (recommended)
- Max: Extended indefinitely
VOLUME SETTINGS:
MA Length (5-50):
- Shorter: More responsive to spikes
- Longer: Smoother baseline
- Recommended: 20 for balance
Spike Multiplier (1.0-3.0):
- Lower: More sensitive spike detection
- Higher: Only extreme spikes
- Recommended: 1.5 for day trading
MULTI-TIMEFRAME SETTINGS:
HTF 1 (Trend):
- 5m chart: Use 15m or 1H
- 15m chart: Use 1H or 4H
- 1H chart: Use 4H or 1D
HTF 2 (Bias):
- One level higher than HTF 1
- Provides longer-term context
- Don't use same as HTF 1
EMA SETTINGS:
Length:
- 20: Responsive, more signals
- 50: Smoother, stronger filter
- 200: Long-term trend only
Style:
- Choose contrasting color
- Width 1-2 for visibility
- Match your trading style
───────────────────────────────────────
BEST PRACTICES
───────────────────────────────────────
Chart Timeframe Selection:
- ORB Trading: Use 5m or 15m charts
- Session Review: Use 1H or 4H charts
- Swing Trading: Use 1H or 4H charts
Quality Over Quantity:
- Wait for high-quality alerts (volume + MTF)
- Avoid trading every breakout
- Focus on confluence setups
Risk Management:
- Position size based on range width
- Wider ranges = smaller positions
- Use stop losses always
- Take partial profits at targets
Market Conditions:
- Best results in trending markets
- Reduce position size in choppy conditions
- Consider session overlaps for volatility
- Avoid trading near major news if inexperienced
Continuous Improvement:
- Track win rate by session
- Note which confluence factors work best
- Adjust settings based on market volatility
- Review performance weekly
───────────────────────────────────────
PERFORMANCE OPTIMIZATION
───────────────────────────────────────
This indicator is optimized with:
- max_bars_back declarations for efficient processing
- Conditional calculations based on enabled features
- Proper memory management for drawing objects
- Minimal recalculation on each bar
Best Practices:
- Disable unused features (sessions, MTF, volume)
- Limit historical display to reduce rendering
- Use appropriate timeframe for your strategy
- Clear old drawing objects periodically
───────────────────────────────────────
EDUCATIONAL DISCLAIMER
───────────────────────────────────────
This indicator combines established trading concepts:
- Opening Range Breakout theory (price action)
- Liquidity level detection (pivot analysis)
- Session-based trading (time-of-day patterns)
- Volume analysis (confirmation technique)
- Multi-timeframe analysis (trend alignment)
All calculations use standard technical analysis methods:
- Pivot high/low detection algorithms
- Moving averages for trend and volume
- Session time filtering
- Timeframe security functions
The indicator identifies potential trading setups but does not predict future price movements. Success requires proper application within a complete trading strategy including risk management, position sizing, and market context.
───────────────────────────────────────
USAGE DISCLAIMER
───────────────────────────────────────
This tool is for educational and analytical purposes. Opening Range Breakout trading involves substantial risk. The alert system and quality filters are designed to identify potential setups but do not guarantee profitability. Always conduct independent analysis, use proper risk management, and never risk capital you cannot afford to lose. Past performance does not indicate future results. Trading intraday breakouts requires experience and discipline.
───────────────────────────────────────
CREDITS & ATTRIBUTION
───────────────────────────────────────
ORIGINAL SOURCE:
This indicator builds upon concepts from LuxAlgo's-ORB

Timeframe LiquidityTimeframe Liquidity – Multi-Timeframe Highs & Lows by
Timeframe Liquidity automatically plots previous day, week, month, and year highs and lows, key liquidity zones used by smart money and price-action traders. These levels extend into the future and can automatically stop once price wicks through, showing clear liquidity sweeps and tested zones.
Perfect for traders using ICT / SMC concepts, liquidity theory, or market structure analysis. Instantly see where liquidity rests, where it’s been taken, and how price reacts at major support and resistance.
Features:
Auto-plots PDH/PDL, PWH/PWL, PMH/PML, PYH/PYL
Custom line styles, colors, and label sizes
Option to stop line on wick (liquidity sweep)
Smart timeframe visibility (hides same-TF levels)
Accurate UTC offset handling
Identify liquidity pools fast, trade cleaner charts, and track where smart money hunts liquidity.
Built for precision, clarity, and confluence.

Turtle soupHi all!
This indicator will show you turtle soups. The logic is that pivots detected from a higher timeframe, with the pivot lengths of left and right in the settings, will be up for 'grabs' by price that spents more than one candle above/below the pivot.
If only one candle is beyond the pivot it's a liquidity sweep or grab. Liquidity sweeps can be discovered through my script 'Market structure' (), but this script will discover turtle soup entries with false breakouts that takes liquidity.
The turtle soup can have a confirmation in the terms of a change of character (CHoCH). The turtle soup strategy usually comes with some sort of confirmation, in this case a CHoCH, but it can also be a market structure shift (MSS) or a change in state of delivery (CISD).
Turtle soups (pivots that have been 'taken') within a turtle soup will also be visible (but not have a turtle).
Alerts are available for when a turtle soup setup occurs and you can set the alert frequency of your liking (to get early signals with a script that might repaint or wait for a closed candle).
I hope that this description makes sense, tell me otherwise. Also tell me if you have any improvements or feature requests.
Best of trading luck!
The chart in the publication contains a 4 hour chart with a daily timeframe and confirmations with CHoCH.

Liquidity Pro Map [ChartPrime]⯁ OVERVIEW
Liquidity Pro Map is a market-structure tool that simulates liquidity distribution by splitting price history into buy-side and sell-side profiles. Using candle volume and the standard deviation of close, the indicator builds two mirrored volume maps on the right-hand side of the chart. It also extends liquidity levels backwards in time until they are crossed by price, allowing you to see which zones remain untouched and where liquidity is most likely resting. Cumulative skew lines and highlighted POC levels give additional clarity on imbalance between buyers and sellers.
⯁ KEY FEATURES
Dual Liquidity Profiles: The chart is divided into buy-side (green) and sell-side (red) liquidity profiles, letting you instantly compare both sides of order flow.
Level Extension Logic: Each liquidity level is extended back in time until price crosses it. If not crossed, it persists all the way to the indicator’s lookback period, marking zones that remain “untapped.”
Dynamic Binning with Standard Deviation: The indicator distributes candle volumes into bins using close-price deviation, creating a more realistic liquidity map than static price levels.
priceDeviation = ta.stdev(close, 25) * 2
priceReference = close > open ? low - priceDeviation : high + priceDeviation
Cumulative Volume Skew Lines: Polylines on the right-hand side show the aggregated buy and sell volume profiles, making it easy to spot imbalance.
POC Identification: Highest-volume levels on both sides are marked as POC (Point of Control) , providing key zones of interest.
Clear Color Coding: Gradient shading intensifies with volume concentration—dark teal/green for buy zones, dark pink/red for sell zones.
⯁ HOW IT WORKS (UNDER THE HOOD)
Volume Distribution: Each bar’s volume is assigned to a price bin based on its reference price (close ± standard deviation offset).
Buy vs. Sell Splitting: If bins above last close price, volume is allocated to sell-side liquidity; otherwise, it’s allocated to buy-side liquidity.
Level Extension: Boxes marking liquidity bins extend back until crossed by price. If uncrossed, they anchor all the way to the start of the lookback window.
Cumulative Polylines: As bins are stacked, cumulative buy and sell values form skew polylines plotted at the right edge.
POC Levels: The highest-volume bin on each side is highlighted with labels and arrows, marking where the heaviest liquidity is concentrated.
⯁ USAGE
Use buy/sell profiles to see where liquidity is likely resting. Green shelves suggest potential support zones; red shelves suggest resistance or sell liquidity pools.
Watch untouched extended levels —these often become magnets for price as liquidity is swept.
Track POC levels as primary liquidity targets, where reactions or fakeouts are most common.
Compare cumulative skew lines to judge which side dominates in volume. Heavy buy skew may indicate absorption of sell pressure, and vice versa.
Adjust lookback period to switch between intraday liquidity maps and larger swing-based profiles.
Use separator feature to hide bins borders for better visual clarity.
Use as a confluence tool with OBs, support/resistance, and liquidity sweep setups.
⯁ CONCLUSION
Liquidity Pro Map transforms candle volume into a structured simulation of where liquidity may rest across the chart. By dividing buy vs. sell profiles, extending untouched levels, and marking cumulative skew and POC, it equips traders with a clear visual map of potential liquidity pools. This allows for better anticipation of sweeps, reversals, and areas of high market activity.

[RealEdgeFX] - Manipulation CandleOverview
The Manipulation Candle indicator highlights potential liquidity grabs and false breakouts directly on the chart. It focuses on moments when price sweeps prior highs or lows but closes in the opposite direction, suggesting a possible manipulation before a market reversal.
Core Logic
The indicator compares the current candle against the previous one and colors the bar when specific conditions are met:
Sell Manipulation (dark red)
When the current candle breaks above the previous high but then closes below the prior low.
→ This often signals a stop hunt to the upside followed by bearish intent.
Buy Manipulation (light green)
When the current candle breaks below the previous low but then closes above the prior high.
→ This suggests a liquidity sweep to the downside before bullish continuation.
Neutral candles remain uncolored to avoid clutter and keep the focus on high-impact moments.
Design Approach
Clarity: Only the candles that meet strict criteria are marked, reducing noise.
Liquidity Focused : Built for traders who want to quickly spot manipulative price action.
Non-Repainting : Once a candle is identified as manipulation, the color stays fixed.
Usage
Add it as an overlay on your chart.
Watch for green or red manipulation candles as alerts of possible reversals or liquidity events.
Combine with your own market structure or bias tools to increase accuracy.
Cumulative Volume Delta (SB-1) 2.0
📈 Cumulative Volume Delta (CVD) — Stair-Step + Threshold Alerts
🔍 Overview
This Cumulative Volume Delta (CVD) tool visualizes aggressive buying and selling pressure in the market by plotting candlestick-style bars based on volume delta. It helps traders understand which side — buyers or sellers — is exerting more control on lower timeframes and highlights momentum shifts through stair-step patterns and delta threshold breaks. Resets to zero at EOD
Ideal for futures traders, scalpers, and intraday strategists looking for orderflow-based confirmation.
🧠 What Is CVD?
CVD (Cumulative Volume Delta) measures the difference between market buys and sells over a specific timeframe. When the delta is rising, it suggests buyers are being more aggressive. Falling delta suggests seller dominance.
This script aggregates volume delta from a lower timeframe and plots it in a higher timeframe context, allowing you to track microstructure shifts within larger candles.
📊 Features
✅ CVD Candlesticks
Each bar represents volume delta as an OHLC-style candle using:
Open: Delta at the start of the bar
High/Low: Peak delta range
Close: Final delta value at bar close
Teal candles = Net buying pressure
Red candles = Net selling pressure
✅ Threshold Levels (Key Visual Zones)
The script includes horizontal dashed lines at:
+5,000 and +10,000 → Signify strong buying pressure
-5,000 and -10,000 → Signify strong selling pressure
0 line → Neutrality line (no net pressure)
These levels act as volume-based support/resistance zones and breakout confirmation tools. For example:
A CVD cross above +5,000 shows buyers taking control
A CVD cross above +10,000 implies strong bullish momentum
A CVD cross below -5,000 or -10,000 signals intense selling pressure
📈 Stair-Step Pattern Detection
Detects two specific volume-based continuation setups:
Bullish Stair-Step: Both the high and low of the CVD candle are higher than the previous candle
Bearish Stair-Step: Both the high and low of the CVD candle are lower than the previous candle
These patterns often appear during trending moves and serve as confirmation of strength or continuation.
Visual markers:
🟢 Green triangles below bars = Bullish stair-step
🔴 Red triangles above bars = Bearish stair-step
🔔 Alert Conditions
Get real-time alerts when:
Bullish Stair-Step is detected
Bearish Stair-Step is detected
CVD crosses above +5,000
CVD crosses below -5,000
📢 Alerts only trigger on crossover, not every time CVD remains above or below. This avoids repetitive notifications.
⚙️ Inputs & Customization
Anchor Timeframe: The higher timeframe to which CVD data is applied (default: 1D)
Lower Timeframe: The timeframe used to calculate the CVD delta (default: 5 minutes)
Optional Override: Use custom timeframe toggle to force your own micro timeframe
📌 How to Use This CVD Indicator (Step-by-Step Guide)
✅ 1. Confirm Bias Using the Zero Line
The zero line (0 CVD) represents neutral pressure — neither buyers nor sellers are dominating.
Use it as your first filter:
🔼 If CVD is above 0 and rising → Buyer control
🔽 If CVD is below 0 and falling → Seller control
🧠 Tip: CVD rising while price is consolidating may signal hidden buyer interest.
✅ 2. Watch for Crosses of Key Levels: +5,000 and +10,000
These levels act as momentum thresholds:
Level Signal Type What It Means
+5,000 Buyer breakout Buyers are starting to dominate
+10,000 Strong bull bias Strong institutional or algorithmic buying flow
-5,000 Seller breakout Sellers are taking control
-10,000 Strong bear bias Heavy selling pressure is entering the market
Wait for CVD to cross above +5K or below -5K to confirm the active side.
Use these crossovers as entry triggers, breakout confirmations, or trade filters.
🔔 Alerts fire only when the level is first crossed, not every bar above/below.
✅ 3. Use Stair-Step Patterns for Continuation Confirmation
The indicator shows stair-step patterns using triangle signals:
🟢 Green triangle below bar = Bullish stair-step
Suggests a higher high and higher low in delta → buyers stepping up
🔴 Red triangle above bar = Bearish stair-step
Suggests lower highs and lower lows in delta → selling pressure building
Use stair-step signals:
To confirm a continuation of trend
As an entry or add-on signal
Especially after a threshold breakout
🧠 Example: If CVD breaks above +5K and forms bullish stairs → confirms strong trend, ideal for momentum entries.
✅ 4. Combine with Price Action or Structure
CVD works best when used with price, not in isolation. For example:
📉 Price makes a new low but CVD doesn’t → potential bullish divergence
📈 CVD surges while price lags → buyers are absorbing, breakout likely
Use it with:
VWAP
Orderblocks
Liquidity sweeps
Break of market structure/MSS/BOS
✅ 5.
Set Anchor Timeframe = Daily
Set Lower Timeframe = 5 minutes (default)
This lets you:
See intraday flow inside daily bars
Confirm whether a daily candle is being built on net buying or selling
🧠 You’re essentially seeing intra-bar aggression within a bigger time structure.
🧭 Example Trading Setup
Bullish Scenario:
CVD is rising and above 0
CVD crosses above +5,000 → alert fires
Green stair-step appears
Price breaks local resistance or liquidity sweep completes
✅ Consider long entry with structure and CVD alignment
🎯 Place stops below last stair-step or structural low
📌 Final Notes
This tool does not repaint and is designed to work in real-time across all futures, crypto, and equity instruments that support volume data. If your symbol does not provide volume, the script will notify you.
Use it in confluence with VWAP, liquidity zones, or structure breaks for high-confidence trades.

FMX Trend Confirmation - No Reversals🔍 FMX Continuation Signal – No Reversals
Powered by the FMX Model (Fundamentals Meet Execution)
This indicator is designed to capture high-probability continuation trades only, avoiding risky reversals. It confirms buy or sell signals based on:
✅ 15-Minute Structure Shift Confirmation
✅ Liquidity Sweeps (stop hunts beyond recent highs/lows)
✅ Trend Validation using HTF SMA (default: 15min)
✅ Second Candle Close inside the sweep range — FMX-grade precision
📈 Green “Buy” labels appear when:
Liquidity is swept below recent lows
Price closes back inside the range
The higher timeframe trend is bullish
📉 Orange “Sell” labels appear when:
Liquidity is swept above recent highs
Price closes back inside the range
The higher timeframe trend is bearish
🛡️ No reversal signals are plotted. This tool is meant for traders who follow the trend with smart money logic, inspired by FMX principles.
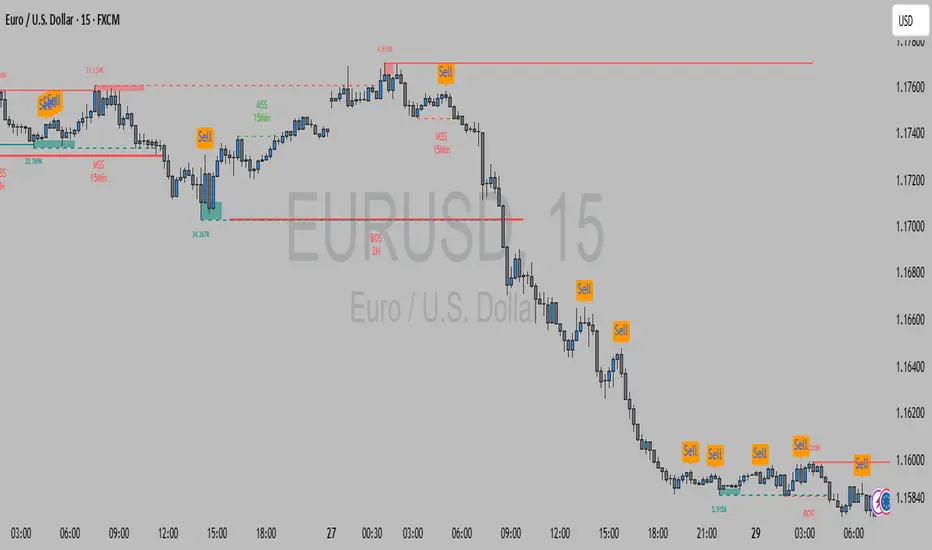
Liquidity Hunter HeatmapLiquidity Hunter (GPS Companion Tool)
Liquidity Hunter is a specialized script designed to help traders visualize and track potential liquidation zones, clusters, and imbalance traps in real-time. It is particularly useful for scalpers and short-term traders who rely on liquidity sweeps, stop hunts, and reversion plays.
This tool does not replicate open-source liquidation trackers. Instead, it uses a proprietary combination of volume surges, candle displacement, VWAP deviation, and high-timeframe wicks to infer areas of trapped traders and display them with clear, color-coded markers.
Key Features:
• Real-Time Liquidation Estimates: Detects where major stop losses (and potential liquidations) may have occurred, based on proprietary volume + price action logic.
• Cluster Strength Bubbles: Visual bubbles (scaled by cluster size) show where liquidations are stacking. Purple for bearish, white for bullish — intensity reflects strength.
• Pre-Liquidation Warning Zones: Highlights areas where price is likely to sweep liquidity before reversing, helping traders avoid chasing moves.
• Dollar-Based Labels (Optional): Displays the estimated value liquidated, helping traders size the significance of a move (e.g., $8.4M).
• Minimal Clutter Mode: Designed for intraday clarity — hides excess lines and uses bubbles, not shapes, for cleaner visualization.

Liquidity stop huntThis tool identifies key liquidity zones where stop hunts are likely to occur.
**How it works:**
- Detects swing highs/lows on your selected timeframe.
- Marks levels where "liquidity sweeps" (fakeouts) often happen.
- Plots these zones as dotted lines for visual reference.
**How to use:**
1. Look for price rejections near marked levels.
2. Avoid placing stops too close to obvious liquidity zones.
3. Combine with price action for confirmation.
**Settings:**
- Timeframe: Choose the historical period for analysis (e.g., 1D, 1W).
- Sweep Type: "Wick Only" for precise tails, "Regular" for all breaks.
- Colors/Style: Customize appearance.
Note: Works best in trending markets. Not a standalone strategy — always confirm with additional analysis.
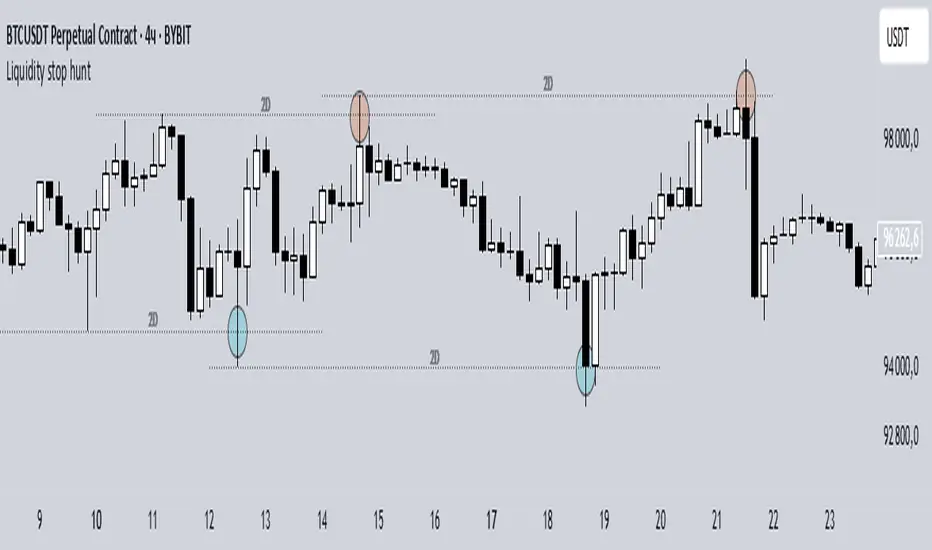
Equal High/Low (EQH/EQL) [AlgoAlpha]OVERVIEW
This script detects and visualizes Equal High (EQH) and Equal Low (EQL) zones—key liquidity areas where price has previously stalled or reversed. These levels often attract institutional interest due to the liquidity buildup around them. The indicator is built to highlight such zones using dynamic thresholding, overbought/oversold RSI filtering, and adaptive mitigation logic to manage zone relevance over time.
CONCEPTS
Equal Highs/Lows are price points where the market has repeatedly failed to break past a certain high or low, hinting at areas where stop orders and pending interest may be concentrated. These areas are often prime targets for liquidity grabs or reversals. By combining this with RSI filtering, the script avoids false signals during neutral conditions and instead focuses on zones where market pressure is more directional.
FEATURES
Detection Logic: The script identifies EQH and EQL zones by comparing the similarity between recent highs or lows with a dynamic volatility threshold. The `tolerance` input allows users to control how strict this comparison is.
RSI Filtering: If enabled, it only creates zones when RSI is significantly overbought or oversold (based on the `state_thresh` input). This helps ensure zones form only in meaningful market conditions.
Zone Display: Bullish (EQL) zones are shown in grey, while bearish (EQH) zones are in blue. Two horizontal lines mark the zone using wick and body extremes, and a filled area visualizes the zone between them.
Zone Management: Zones automatically extend with price until they’re invalidated. You can choose whether a zone is removed based on wick or body sweeps and whether it requires one or two candle confirmations. Zones also expire after a customizable number of bars.
Alerts: Four alert conditions are built in—when a new EQH/EQL is formed and when one is mitigated—making it easy to integrate into alert-based workflows.
USAGE
Equal highs/lows can be used as liquidity markers, either as entry points or as take-profit targets.
This tool is ideal for liquidity-based strategies and helps traders map out possible reversal or sweep zones that often precede aggressive moves.
