Liquidity Sweep Reversal [Grimoire]The Liquidity Sweep Reversal indicator is designed to spot potential turning points by watching for “liquidity sweeps” above key prior highs. Specifically, it marks when price briefly pushes above levels such as:
The high of the previous candle
The high of the prior trading day
The high of the previous week
These sweeps often trigger stop-hunts or liquidity hunts, after which price frequently reverses. By highlighting those moments, the indicator helps you anticipate and trade these reversal moves more easily.
Cari dalam skrip untuk "sweep"

1H/3m Concept [RunRox]🕘 1H/3m Concept is a versatile trading methodology based on liquidity sweeps from fractal points identified on higher timeframes, followed by price reversals at these key moments.
Below, I will explain this concept in detail and provide clear examples demonstrating its practical application.
⁉️ WHAT IS A FRACTALS?
In trading, a fractal is a technical analysis pattern composed of five consecutive candles, typically highlighting local market turning points. Specifically, a fractal high is formed when a candle’s high is higher than the highs of the two candles on either side, whereas a fractal low occurs when a candle’s low is lower than the lows of the two adjacent candles on both sides.
Traders use fractals as reference points for identifying significant support and resistance levels, potential reversal areas, and liquidity zones within price action analysis. Below is a screenshot illustrating clearly formed fractals on the chart.
📌 ABOUT THE CONCEPT
The 1H/3m Concept involves marking Higher Timeframe (HTF) fractals directly onto a Lower Timeframe (LTF) chart. When a liquidity sweep occurs at an HTF fractal level, we remain on the same LTF chart (since all HTF fractals are already plotted on this lower timeframe) and wait for a clear Market Structure Shift (MSS) to identify our potential entry point.
Below is a schematic illustration clearly demonstrating how this concept works in practice.
Below is another 💡 real-chart example , showing liquidity in the form of a 1H fractal, swept by a rapid impulse move. Immediately afterward, a clear Market Structure Shift (MSS) occurs, signaling a potential entry point into the trade.
Another example is shown below, where we see our hourly fractal, from which price clearly reacts, providing an opportunity to search for an entry point.
As illustrated on the chart, the fractal levels from the higher timeframe are clearly displayed, but we’re working directly on the 5-minute chart. This allows us to remain on one timeframe without needing to switch back and forth between charts to spot such trading setups.
🔍 MTF FRACTALS
This concept can be applied across various HTF-LTF timeframe combinations. Although our examples illustrate 1H fractals used on a 5-minute chart, you can effectively utilize many other timeframe combinations, such as:
30m HTF fractals on 1m chart
1H HTF fractals on 3m chart
4H HTF fractals on 15m chart
1D HTF fractals on 1H chart
The key idea behind this concept is always the same: identify liquidity at fractal levels on the higher timeframe (HTF), then wait for a clear Market Structure Shift (MSS) on the lower timeframe (LTF) to enter trades.
⚙️ SETTINGS
🔷 Trade Direction – Select the preferred trading direction (Long, Short, or Both).
🔷 HTF – Choose the higher timeframe from which fractals will be displayed on the current chart.
🔷 HTF Period – Number of candles required on both sides of a fractal candle (before and after) to confirm fractal formation on the HTF.
🔷 Current TF Period – Sensitivity to the impulse that sweeps liquidity, used for identifying and forming the MSS line.
🔷 Show HTF – Enable or disable displaying HTF fractal lines on your chart. You can also customize line style and color.
🔷 Max Age (Bars) – Number of recent bars within which fractals from the selected HTF will be displayed.
🔷 Show Entry – Enable or disable displaying the MSS line on the chart.
🔷 Enable Alert – Activates TradingView alerts whenever the MSS line is crossed.
You can also enable 🔔 alerts, which notify you whenever price crosses the MSS line. This significantly simplifies the process of identifying these setups on your charts. Simply configure your preferred timeframes and wait for notifications when the MSS line is crossed.
🔶 We greatly appreciate your feedback and suggestions for improving the indicator!

Smart Money LITE — Daily Sweep → HQ Signals (VWAP • FVG • CHoCH) 🔗 PRO VERSION (VWAP + FVG + CHoCH — full confirmations, all timeframes):
chartedgepro.gumroad.com/l/rmnbhw
Daily liquidity sweep → confluence signals with VWAP, FVG & CHoCH. Works on all timeframes & markets (Indices, Forex, Crypto).
WHAT IT DOES
Smart Money LITE+ highlights high-quality LONG/SHORT signals only after daily liquidity is swept (previous day high/low) with confluence from VWAP, FVG and structure (BOS/CHoCH).
Works on all timeframes and across markets: indices, forex, crypto.
KEY FEATURES (Lite)
• Daily sweep logic (PDH/PDL) + previous day zones
• VWAP + deviation bands (optional) and proximity filter
• 3-bar FVG boxes (visual) with adjustable extension
• ATR/volatility filter, optional HTF trend filter
• Anti-spam cooldown, clean LONG/SHORT labels
• Alerts: HQ LONG / HQ SHORT
HOW TO USE
1. Wait for price to sweep PDH/PDL → indicator opens “signal window”.
2. Look for confluence: VWAP touch/proximity + CHoCH or BOS in direction.
3. Enter with proper risk management (stop beyond swing/zone, partials).
SETTINGS TIPS
• Enable “Require VWAP Confluence?” for strictest setups.
• Use “HTF Trend Filter?” to align with higher-timeframe EMA trend.
• Adjust “After sweep (bars)” to define signal validity window.
• FVGs are visual in Lite — advanced filtering and confirmation are in Pro.
WHO IT'S FOR
Scalpers, intraday, and swing traders looking for objective, visual signals based on liquidity sweeps and VWAP/FVG confluence.
PRO VERSION (full confirmations)
Adds advanced FVG/iFVG logic, more confluence filters, dynamic risk tools and extended alert packages — optimized for all timeframes.
👉 chartedgepro.gumroad.com/l/rmnbhw
NOTES
• For educational purposes only. No financial advice.
• “Lite” is open-source; redistribution of code follows TradingView rules.

XAUUSD Liquidity Sweep + Engulfing (4H/2H/15m)Key Features in This Script:
4H Bias (Trend): We use RSI on 4H to determine if the market is in a bullish or bearish trend.
2H Setup: When price sweeps below previous lows or above previous highs (liquidity sweep), we confirm it with RSI and an engulfing candle.
15m Entry: After the liquidity sweep is confirmed on the 15m chart, we check for a bullish engulfing (for buys) or bearish engulfing (for sells) with RSI confirmation.
How to Use It:
Add the Script: Copy-paste the code above into TradingView’s Pine Editor.
Apply it to the 15-minute chart for XAUUSD (Gold).
Alerts: Set up alerts when a Buy or Sell signal appears based on the conditions.
Alerts Example:
When a liquidity sweep and RSI flip happens with an engulfing candle, TradingView will notify you, helping you enter at the right time.
🚀 Next Steps:
Try it out and let me know how the alerts and signals are working for you.
If you'd like to add custom stop-loss or take-profit calculations, or include Fibonacci levels, let me know!

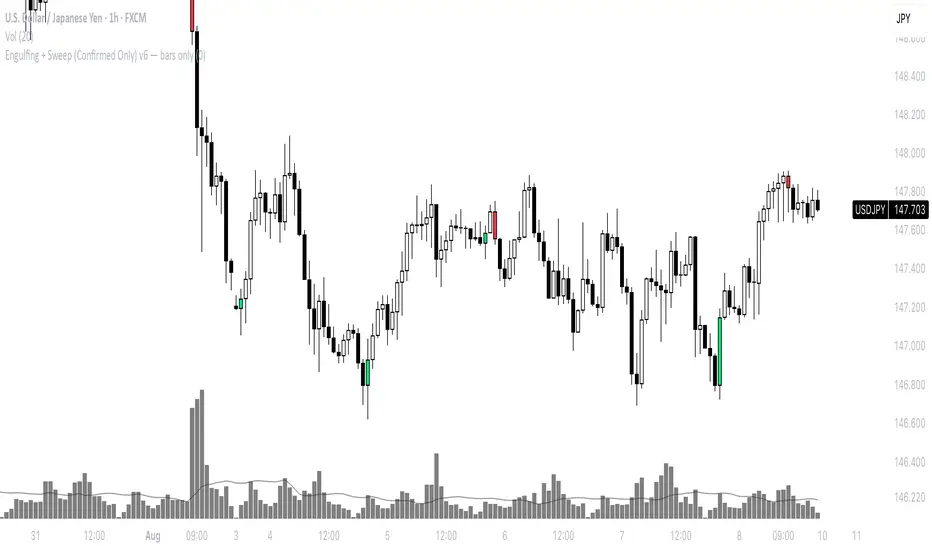
Engulfing + Sweep (Confirmed Only) v6 — bars onlyMarks bullish/bearish engulfing candles with liquidity sweeps and confirms them on the next candle — no repaint.
✳️ Features:
• 🟩 Bullish Engulfing + Low Sweep
• 🟥 Bearish Engulfing + High Sweep
• 🎛 Require opposite-color previous candle (optional)
• 📏 Min body-to-range filter
• 🔔 Alerts on confirmation candle
🎯 Best for:
• Price action & reversal traders
• Liquidity sweep confluence setups
PHL Sweep Signals(1 Hour)PHL Sweep Signals (Full History)
This indicator is designed to identify high-probability reversal setups by detecting liquidity sweeps of the previous standard hour's high and low (PHL). It provides clear, actionable signals complete with visual aids and a data table to keep you in tune with the higher-timeframe context.
Key Features
Previous Hour Levels: Automatically draws the high and low of the previous standard hour as key reference lines for the current trading hour. The line colors rotate to provide a clear visual separation.
Bearish Sweep Signal: Identifies a specific bearish pattern: a green (bullish) candle that wicks above the previous hour's high but fails to hold, with its body remaining entirely below the line.
Bullish Sweep Signal: Identifies the opposite bullish pattern: a red (bearish) candle that wicks below the previous hour's low but is absorbed, with its body remaining entirely above the line.
Clear Visual Signals: When a signal is confirmed, the indicator provides a multi-faceted alert:
Plots a "Buy" or "Sell" arrow on the chart.
Draws a colored box around the signal candle for easy identification.
Displays a label with the potential Stop Loss size (calculated from the size of the signal candle).
Informative Display Table: Includes a convenient table in the corner showing the Open and Close data for the last 3 hours, helping you stay aware of the broader market context without leaving your chart.
Built-in Alerts: Triggers an alert for every confirmed Buy and Sell signal so you never miss a potential setup.
How to Use
This indicator helps you spot potential exhaustion and reversals at key hourly levels.
A "Sell" signal suggests a failed breakout to the upside, indicating potential weakness and a possible entry for shorts.
A "Buy" signal suggests a failed breakdown to the downside, indicating potential strength and a possible entry for longs.
As with any tool, these signals are most powerful when used as part of a comprehensive trading strategy and combined with your own analysis for confirmation.
Optimal Settings:
Timeframe: 5-Minute
Time Zone: UTC-4 (New York Time)
-ratheeshinv

S&P Power Hour Liquidity Sweep StrategyThis indicator is designed for intraday traders who want to take advantage of liquidity grabs, break of structure (BOS), and optimal entry points during the most volatile hours of the trading day: the NYSE Power Hours (09:30–10:30 AM and 02:30–04:00 PM EST).
Key Features:
Power Hour Detection:
Automatically identifies the two most liquid hours of the trading session.
Liquidity Sweep Detection:
Highlights when price sweeps a recent swing high or low — a common trap before reversals.
Break of Structure (BOS):
Confirms trend shift after a liquidity sweep with smart money-style BOS markers.
Fair Value Gap (FVG) Highlighting: (Optional)
Spot institutional imbalances between candles to fine-tune trade entries.
How It Works:
Wait for price to sweep a swing high or low during the power hours.
Look for a break of structure (BOS) in the opposite direction.
Enter on the next candle or FVG retest.
The indicator will plot a yellow circle for entry, a red line for stop, and a green line for the target (based on your RR setting).
Customizable Inputs:
Swing sensitivity (lookback bars)
Risk-to-reward ratio
Optional FVG visibility
Best Used With:
Higher timeframe bias (15m/1H)
Order blocks or volume analysis
Avoiding major news events
Whether you're a scalper or precision-based intraday trader, this tool helps you spot high-probability reversal setups with clean visuals and clear confirmations.

Swing High/Low Levels (Auto Remove)Plots untapped swing high and low levels from higher timeframes. Used for liquidity sweep strategy. Cluster of swing levels are a magnet for price to return to and reverse. Indicator gives option for candle body or wick for sweep.

Bubbles + Clusters + SweepsIndicator For Bubbles + Clusters + Sweeps
✔ Volume bubbles
✔ Delta coloring (green/red intensity)
✔ Auto supply/demand zones
✔ Volume-profile style blocks inside zones
✔ Liquidity sweep markers
✔ Box drawings extending until filled
✔ Optional bubble filters (min-volume threshold)

[Asian Range + Sweeps]Main Features
Asian Range (S2) — fully configurable session band (start/end, hour:minute) with automatic detection and visual high/low markers.
HOD/LOD (S1) — adaptive cutoff logic for Forex vs Indices, with optional manual override.
Gap Correction — optional true HOD/LOD detection using a 1-minute base with overnight gap adjustment.
Sweep Detection — real-time alerts for S1 and S2 sweeps, with independent cooldown control to avoid duplicate signals.
Visual Controls — customizable colors, line thickness, and transparency.
KeepDays Setting — allows you to manage how many past session drawings are preserved on the chart

Son Model ICT [TradingFinder] HTF DOL H1 + Sweep M15 + FVG M1🔵 Introduction
The ICT Son Model setup is a precise trading strategy based on market structure and liquidity, implemented across multiple timeframes. This setup first identifies a liquidity level in the 1-hour (1H) timeframe and then confirms a Market Structure Shift (MSS) in the 5-minute (5M) timeframe to validate the trend. After confirmation, the price forms a new swing in the 5-minute timeframe, absorbing liquidity.
Once this level is broken, traders typically drop to the 30-second (30s) timeframe and enter trades based on a Fair Value Gap (FVG). However, since access to the 30-second timeframe is not available to most traders, we take the entry signal directly from the 5-minute timeframe, using the same liquidity zones and confirmed breakouts to execute trades. This approach simplifies execution and makes the strategy accessible to all traders.
This model operates in two setups :
Bullish ICT Son Model and Bearish ICT Son Model. In the bullish setup, liquidity is first accumulated at the lows of the 1-hour timeframe, and after confirming a market structure shift, a long position is initiated. Conversely, in the bearish setup, liquidity is first drawn from higher levels, and upon confirmation of a bearish trend, a short position is executed.
Bullish Setup :
Bearish Setup :
🔵 How to Use
The ICT Son Model setup is designed around liquidity analysis and market structure shifts and can be applied in both bullish and bearish market conditions. The strategy first identifies a liquidity level in the 1-hour (1H) timeframe and then confirms a Market Structure Shift (MSS) in the 5-minute (5M) timeframe.
After this shift, the price forms a new swing, absorbing liquidity. When this level is broken in the 5-minute timeframe, the trader enters based on a Fair Value Gap (FVG). While the ideal entry is in the 30-second (30s) timeframe, due to accessibility constraints, we take entry signals directly from the 5-minute timeframe.
🟣 Bullish Setup
In the Bullish ICT Son Model, the 1-hour timeframe first identifies liquidity at the market lows, where price sweeps this level to absorb liquidity. Then, in the 5-minute timeframe, an MSS confirms the bullish shift.
After confirmation, the price forms a new swing, absorbing liquidity at a higher level. The price then retraces into a Fair Value Gap (FVG) created in the 5-minute timeframe, where the trader enters a long position, placing the stop-loss below the FVG.
🟣 Bearish Setup
In the Bearish ICT Son Model, liquidity at higher market levels is identified in the 1-hour timeframe, where price sweeps these levels to absorb liquidity. Then, in the 5-minute timeframe, an MSS confirms the bearish trend.
After confirmation, the price forms a new swing, absorbing liquidity at a lower level. The price then retraces into a Fair Value Gap (FVG) created in the 5-minute timeframe, where the trader enters a short position, placing the stop-loss above the FVG.
🔵 Settings
Swing period : You can set the swing detection period.
Max Swing Back Method : It is in two modes "All" and "Custom". If it is in "All" mode, it will check all swings, and if it is in "Custom" mode, it will check the swings to the extent you determine.
Max Swing Back : You can set the number of swings that will go back for checking.
FVG Length : Default is 120 Bar.
MSS Length : Default is 80 Bar.
FVG Filter : This refines the number of identified FVG areas based on a specified algorithm to focus on higher quality signals and reduce noise.
Types of FVG filters :
Very Aggressive Filter: Adds a condition where, for an upward FVG, the last candle's highest price must exceed the middle candle's highest price, and for a downward FVG, the last candle's lowest price must be lower than the middle candle's lowest price. This minimally filters out FVGs.
Aggressive Filter: Builds on the Very Aggressive mode by ensuring the middle candle is not too small, filtering out more FVGs.
Defensive Filter: Adds criteria regarding the size and structure of the middle candle, requiring it to have a substantial body and specific polarity conditions, filtering out a significant number of FVGs.
Very Defensive Filter: Further refines filtering by ensuring the first and third candles are not small-bodied doji candles, retaining only the highest quality signals.
🔵 Conclusion
The ICT Son Model setup is a structured and precise method for trade execution based on liquidity analysis and market structure shifts. This strategy first identifies a liquidity level in the 1-hour timeframe and then confirms a trend shift using the 5-minute timeframe.
Trade entries are executed based on Fair Value Gaps (FVGs), which highlight optimal entry points. By applying this model, traders can leverage existing market liquidity to enter high-probability trades. The bullish setup activates when liquidity is swept from market lows and a market structure shift confirms an upward trend, whereas the bearish setup is used when liquidity is drawn from market highs, confirming a downtrend.
This approach enables traders to identify high-probability trade setups with greater precision compared to many other strategies. Additionally, since access to the 30-second timeframe is limited, the strategy remains fully functional in the 5-minute timeframe, making it more practical and accessible for a wider range of traders.

Shamji's Liquidity Sweep + FVG (Follow-up + Filters) Purpose (what it does)
This indicator looks for two related price structures used by many smart-money / liquidity-hunt traders:
Liquidity Sweeps — candles that wick beyond a recent swing high (for buy-side stop-hunts) or swing low (for sell-side stop-hunts), then close back inside. These are flagged as potential stop-hunt events that clear obvious liquidity.
Fair Value Gaps (FVGs) — simple 3-bar style gaps where an older bar’s high is below the current low (bullish FVG) or an older bar’s low is above the current high (bearish FVG). When an FVG appears after a sweep (within a configurable window), this is considered a follow-up alignment.
The script adds optional filters (volume spike and candle-range vs ATR) to increase confidence, and can restrict marking/alerts to only events that meet the follow-up and filter rules.

Break & Retest + Liquidity Sweep EntryIdentify a BOS (vertical line appears).
Wait for price to retest the broken level (circle shows up).
Optionally confirm with liquidity sweep.
Enter long/short trades based on bullish/bearish retest signals.
Use ATR or personal risk management for stop-loss placement.

[TTM] ICT Sessions & Ranges🌟 Overview 🌟
The ICT Sessions & Ranges Indicator helps traders identify key intraday price levels by marking custom session highs/lows and opening ranges.
It helps traders spot potential liquidity grabs, reversals, and breakout zones by tracking price behavior around these key areas
🌟 Session Highs & Lows – Liquidity Zones 🌟
Session highs and lows often attract price due to stop orders resting above or below them. These levels are frequently targeted during high-volatility moves.
🔹 Asia Session
- Usually ranges in low volatility.
- Highs/lows often get swept during early London.
- Price may raid these levels, then reverse.
🔹 London Session
- First major volatility of the day.
- Highs/lows often tested or swept in New York.
- Commonly forms the day’s true high or low.
🌟 Opening Range Concepts 🌟
The Opening Range is the first 15, 30, or 60 minutes of a session (e.g., New York).
The high (ORH) and low (ORL) define the market’s initial balance and key reaction levels.
🔹 Breakout Trade
- Price breaks ORH/ORL with momentum.
- Signals directional intent.
- Traders enter on the breakout, with stops inside the range.
🔹 Liquidity Raid
- Price briefly breaks ORH/ORL to trigger stops.
- Reverses after the sweep.
- Look for structure shift and entry near FVG or OB.
🌟 Customizable Settings 🌟
The indicator includes 3 configurable ranges , each with:
Start & End Time – Set any custom time window.
Display Type – Choose Box (highlight range) or Lines (mark high/low).
Color Settings – Set custom colors for boxes and lines.
🌟 Default Settings 🌟
Range 1 : 19:00–00:00 (Asia Session)
Range 2 : 01:45–05:15 (London Session)
Range 3 : 09:30–10:00 (NY Opening Range – 30m)

Auto Trendline using Liquidity Sweeps By Vachaspati JhaThis auto trendline systime uses Liquidity sweep points to draw, making them extremely reliable- price action respects these trendlines.
You can choose different pivot numbers for Green and Red lines to suit market condition. For instance in uptrend green line pivot number can be 2 or higher and Red line pivot number can be 1 for pullback opportunities.

Liquidity Buy SignalLiquidity Buy Signal is an indicator designed to detect BUY entries based on liquidity (swing lows) combined with a bullish reversal candle pattern. It automatically marks recent swing-low zones/levels, tracks the transition from solid → dashed when a level gets broken, and then confirms a signal when price sweeps/cuts the correct level and a bullish candle pattern appears.
OANDA:EURUSD
BUY signal (green triangle) triggers when:
A bullish reversal candle pattern (based on a set of rules) is detected, and
The Liquidity chain conditions are satisfied using the most recent swing lows:
Price crosses the level with the lower wick, or
The level is within the lower 30% range of the previous candle (n-1), and
The level does not pass through the bodies of older candles (filtered by lookback).
Key settings:
Pivot Lookback: controls swing-low detection sensitivity.
Swing Area: Wick Extremity / Full Range for zone definition.
Filter lookback older bodies: filters out levels that intersect older candle bodies (skips n-2).
Style: toggle Swing Low display + zone/line colors.
Alerts:
Includes a built-in alertcondition for BUY signals (useful for notifications/webhooks).
This indicator is especially well-suited for identifying potential bottoms in a downtrend.
Note: This tool provides trading signals and should be combined with context (trend/HTF/volume/risk management) before entering trades. Not financial advice.

Stop Hunt / Liquidity Sweep Detector with Momentum Ratingdetects liquidity sweeps as they happen then gives you a rating on how much momentum the reversal has.

amir Liquidity Sweeps [amir]this indicator is from luxalgon i think this is the code that made this incdicator never get destroyed by aanyone

Liquidity Sweeps (Improved)this is improved version of liqudity sweep and alert thois is my third attempt

BSL/SSL Sweep + FVG Strategy Jobin (c) The New York ATM Model is a structured intraday strategy designed to capture algorithmic stop-hunts and reversals during the New York session open. It focuses on liquidity sweeps—either Buy-Side or Sell-Side—followed by a confirmation using Fair Value Gaps (FVGs).

SM Trap Detector – Liquidity Sweeps & Institutional ReversalsOverview:
This script is designed to help traders detect Smart Money traps, liquidity grabs, and false breakouts with high precision.
Inspired by institutional trading logic (SMC, ICT, Wyckoff), this tool combines:
🟦 Liquidity Zone Mapping – Detects stop hunt targets near highs/lows
🚨 Trap Candle Detection – Identifies fakeouts using wick + volume logic
✅ Reversal Confirmation – Entry signals based on real market structure
🧭 Dashboard Panel – Always see the last trap type, price, and confirmation
🔔 Real-Time Alerts – Stay notified of traps and entry points
🧠 Logic Breakdown:
Trap Candle = Large wick, small body, volume spike, and sweep of a liquidity zone
Confirmed Entry = Reversal price action following the trap (engulfing-style)
📈 Best Used On:
Markets: Crypto, Forex, Stocks
Timeframes: No limitation but works best on 1H, 4H, Daily
🛠 Suggested Use:
Trade only confirmed entries for best results
Place stops beyond wick highs/lows
Target previous structure or use RR-based exits
📊 Backtest Tip:
Use alerts + replay mode to manually validate past traps.
Note: Please backtest before using it for entry.

Liquidity Sweep + BOS Retest System — Prop Firm Edition🟦 Liquidity Sweep + BOS Retest System — Prop Firm Edition
A High-Probability Smart Money Strategy Built for NQ, ES, and Funding Accounts
🚀 Overview
The Liquidity Sweep + BOS Retest System (Prop Firm Edition) is a precision-engineered SMC strategy built specifically for prop firm traders. It mirrors institutional liquidity behavior and combines it with strict account-safe entry rules to help traders pass and maintain funding accounts with consistency.
Unlike typical indicators, this system waits for three confirmations — liquidity sweep, displacement, and a clean retest — before executing any trade. Every component is optimized for low drawdown, high R:R, and prop-firm-approved risk management.
Whether you’re trading Apex, TakeProfitTrader, FFF, or OneUp Trader, this system gives you a powerful mechanical framework that keeps you within rules while identifying the market’s highest-probability reversal zones.
🔥 Key Features
1. Liquidity Sweep Detection (Stop Hunt Logic)
Automatically identifies when price clears a previous swing high/low with a sweep confirmation candle.
✔ Filters noise
✔ Eliminates early entries
✔ Locks onto true liquidity grabs
2. Automatic Break of Structure (BOS) Confirmation
Price must show true displacement by breaking structure opposite the sweep direction.
✔ Confirms momentum shift
✔ Removes fake reversals
✔ Ensures institutional intent
3. Precision Retest Entry Model
The strategy enters only when price retests the BOS level at premium/discount pricing.
✔ Zero chasing
✔ Extremely tight stop loss placement
✔ Prop-firm-friendly controlled risk
4. Built-In Risk & Trade Management
SL set at swept liquidity
TP set by user-defined R:R multiplier
Optional session filter (NY Open by default)
One trade at a time (no pyramiding)
Automatically resets logic after each trade
This prevents overtrading — the #1 cause of evaluation and account breaches.
5. Designed for Prop Firm Futures Trading
This script is optimized for:
Trailing/static drawdown accounts
Micro contract precision
Funding evaluations
Low-risk, high-probability setups
Structured, rule-based execution
It reduces randomness and emotional trading by automating the highest-quality SMC sequence.
🎯 The Trading Model Behind the System
Step 1 — Liquidity Sweep
Price must take out a recent high/low and close back inside structure.
This confirms stop-hunting behavior and marks the beginning of a potential reversal.
Step 2 — BOS (Break of Structure)
Price must break the opposite side swing with a displacement candle. This validates a directional shift.
Step 3 — Retest Entry
The system waits for price to retrace into the BOS level and signal continuation.
This creates optimal R:R entry with minimal drawdown.
📈 Best Markets
NQ (NASDAQ Futures) – Highly recommended
ES, YM, RTY
Gold (XAUUSD)
FX majors
Crypto (with high volatility)
Works best on 1m, 2m, 5m, or 15m depending on your trading style.
🧠 Why Traders Love This System
✔ No signals until all confirmations align
✔ Reduces overtrading and emotional decisions
✔ Follows market structure instead of random indicators
✔ Perfect for maintaining long-term funded accounts
✔ Built around institutional-grade concepts
✔ Makes your trading consistent, calm, and rules-based
⚙️ Recommended Settings
Session: 06:30–08:00 MST (NY Open)
R:R: 1.5R – 3R
Contracts: Start with 1–2 micros
Markets: NQ for best structure & volume
📦 What’s Included
Complete strategy logic
All plots, labels, sweep markers & BOS alerts
BOS retest entry automation
Session filtering
Stop loss & take profit system
Full SMC logic pipeline
🏁 Summary
The Liquidity Sweep + BOS Retest System is a complete, prop-firm-ready, structure-based strategy that automates one of the cleanest and most reliable SMC entry models. It is designed to keep you safe, consistent, and rule-compliant while capturing premium institutional setups.
If you want to trade with confidence, discipline, and prop-firm precision — this system is for you.
Good Luck -BG

Gold 15m: Trend + S/R + Liquidity Sweep (RR 1:2)This strategy is designed for short-term trading on XAUUSD (Gold) using the 15-minute timeframe. It combines trend direction, support/resistance pivots, liquidity sweep detection, and momentum confirmation to identify high-probability reversal setups in line with the dominant market trend.
⚙️ Core Logic:
Trend Filter (EMA 200):
The strategy only takes long positions when price is above the 200 EMA and short positions when price is below it.
Support/Resistance via Pivots:
Dynamic swing highs and lows are identified using pivot points. These act as local supply and demand levels where liquidity is likely to accumulate.
Liquidity Sweep Detection:
A bullish liquidity sweep occurs when price briefly breaks below the last pivot low (grabbing liquidity) and then closes back above it.
A bearish sweep occurs when price breaks above the last pivot high and then closes back below.
Momentum & Candle Strength:
The strategy filters signals based on candle range and body size to ensure entries occur during strong price reactions, not weak retracements.
Risk Management (1:2 RR):
Stop-loss is placed slightly beyond the last pivot level using ATR-based buffers, and take-profit is set at 2× the risk distance, maintaining a reward-to-risk ratio of 1:2.
💼 Trade Logic Summary:
Long Entry:
After a bullish liquidity sweep & reclaim, momentum confirmation, and trend alignment (above EMA 200).
Short Entry:
After a bearish sweep & reclaim, momentum confirmation, and trend alignment (below EMA 200).
Exit:
Automated via ATR-based Stop Loss and Take Profit targets.
📊 Customization Options:
Adjustable EMA length, pivot settings, ATR multipliers, and RR ratio.
Option to enable/disable trend filter.
Toggle display of S/R zones on chart.
🧠 Best Use:
Works best during London and New York sessions when Gold shows strong momentum.
Can be adapted for forex pairs and indices by tuning ATR and pivot parameters.
