Premium & Liquidity Zones By TradingSmurf ver.20250911=========================================
Premium & Liquidity Zones (PLZ) + AEMA
=========================================
Features:
----------
• Liquidity Zones (Daily / Weekly / Monthly)
- Previous Highs/Lows with text labels
- Auto purge when liquidity is swept
• Adaptive EMA (Kaufman-style)
- Fast = 2, Slow = 30, Efficiency = 10
- Toggle On/Off
• Premium & Discount Zones
- Supply/Demand imbalance shading
• Market Structure Tools
- BOS (Break of Structure) / CHoCH detection
- Order Blocks
- Fair Value Gaps (FVGs)
- MSS signals
- Swing High/Low labels
• Signals & Alerts
- SSMA crossover Buy/Sell signals
- BOS, CHoCH, MSS alerts
Usage:
-------
All-in-one Smart Money Concepts (SMC) toolkit
for liquidity, structure, and adaptive trend
confirmation.
Cari dalam skrip untuk "swing high low"

Bullish & Bearish Engulfing ProHello Traders!
Overview
The Bullish & Bearish Engulfing Pro indicator is a powerful pattern recognition tool that identifies key reversal points and trend continuation opportunities. These engulfing patterns often mark the beginning of a significant price move and are widely used in technical analysis. For example, in an uptrend, a Bullish Engulfing pattern can provide an ideal pullback entry signal.
This indicator combines traditional candlestick theory with advanced technical filters like trend direction and volatility analysis to offer traders precise, high-confidence signals.
Key Features :
Accurate pattern detection:
Uses refined algorithms to detect true Bullish and Bearish Engulfing patterns, filtering out noise and false positives.
Trend filter:
Customizable Simple Moving Average (SMA) ensures trades are aligned with the market’s broader trend, improving trade success rates.
Volatility awareness:
ATR-based filtering ensures that only statistically significant engulfing patterns are highlighted.
Visual clarity:
Bullish and Bearish Engulfing patterns are displayed with distinct, customizable colors and labels for instant recognition.
Flexible customization:
Users can adjust detection criteria, SMA settings, and visual options to suit their personal strategy.
Filtered signal display:
Option to visualize filtered-out signals to better understand how the logic makes its decisions.
Bullish Engulfing Pattern
Appears after a downtrend or during a pullback in an uptrend
Consists of two candles
A smaller bearish candle
Followed by a larger bullish candle that completely engulfs the previous body
Bearish Engulfing Pattern
Appears after an uptrend or during a pullback in a downtrend
Consists of two candles
A smaller bullish candle
Followed by a larger bearish candle that completely engulfs the previous body
Key differences in this implementation
What makes this indicator unique
Trend and volatility filters
Ensure patterns occur in meaningful market conditions
Comprehensive pattern analysis:
Factors in candle body ratios, wick sizes, and relative size to past candles for smarter detection
Adaptive to market conditions:
Dynamic thresholds based on ATR allow pattern recognition to adjust to different volatility regimes
Educational value:
Visualizing rejected patterns helps traders build intuition and refine their discretion
How to Trade with this Indicator
Engulfing patterns can signal strong reversals or pullback continuations. Use them with trend and volume confirmation to maximize their effectiveness.
snapshot
Bullish Opportunities:
Look for Bullish Engulfing patterns (aqua-colored candles and labels) during or after a pullback in an uptrend.
Bearish Opportunities:
Watch for Bearish Engulfing patterns (orange-colored candles and labels) during or after a rally in a downtrend.
Entry: Enter on the next bar open after the engulfing candle completes.
Stop loss: 2 ticks below/above the engulfing candle’s low/high.
Take profit: Aim for at least a 2R target, a swing high/low or manage the tradewith a trailing stop.
Trend Alignment:
For higher win probability, take trades only in the direction of the SMA-defined trend.
Note: To ensure the candle coloring appears correctly, place the indicator at the top of the object tree.

Auto Unlimited Fibs 1.0Still in development, this indicator automatically draws unlimited Fibonacci Retracements so you don't have to keep manually drawing them.
Upwards moves are colored green by default and downward moves are colored red by default, idea being an upward move creates a green retracement level that may be an area to buy and vice versa for short moves. The retracements are drawn on every 3-bar swing high/low, this idea was taken from Inner Circle Trader (ICT). If the move then goes on to retrace past the 0.764 fib retracement, the move is mitigated. If a new high or low is put in the fib gets extended. The mitigation levels are customisable.
Also hides moves that are below a minimum size, as I don't like to see fibs of small moves, these are hidden based on a % of price, customisable in the script.
As the fibs get extended/mitigated and hidden you should end up with all the fibs that are still valid for a retracement.
There is a display option to draw shorter lines as things can get pretty messy with lots of fibs on one chart. Also, bigger moves have longer lines and are slightly brighter in color, shorter moves are shorter lines and duller in color.
Finally the user can customise the amount to show in each direction, so if you only want to see long moves set the Total Short Fibs To Show to 0, or choose 1 of each if you only want to see the most recent smallest fib.

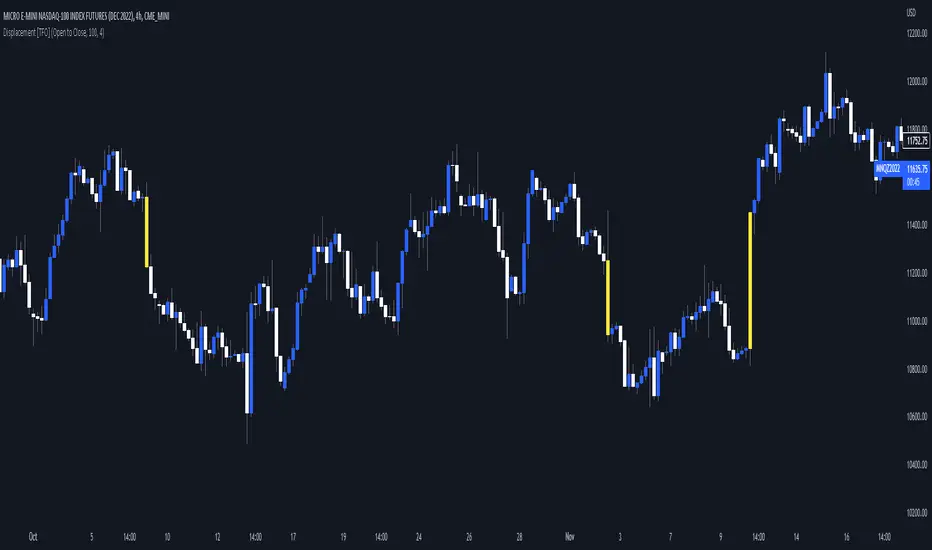
Visualizing Displacement [TFO]An easy and basic way to visualize displacement (energetic moves) in single bars/candles. This is determined by comparing the bar range (either from high to low, or from open to close) to its standard deviation over some specified length. The strength parameter applies some multiple to the standard deviation, which can help to filter out only the strongest indications of potential displacement.
Displacement is a key concept in Inner Circle Trader (ICT) concepts, especially when anticipating potential changes in trend. Although it's fairly easy to see "displacement candles" with large ranges, the bar coloring in this script can help remind us of who is in control (buyers or sellers) based on what side is creating those energetic moves most recently. Once we see signs of displacement, we can then apply concepts like premium/discount, order blocks, optimal trade entries, etc. to look for reasonable trade opportunities in the direction of the current trend.
A lack of displacement can be just as telling - if an effort to displace through a key swing high/low has failed, it's possible that a reversal may be underway.
Strategy Myth-Busting #20 - HalfTrend+HullButterfly - [MYN]#20 on the Myth-Busting bench, we are automating the " I Found Super Easy 1 Minute Scalping System And Backtest It 100 Times " strategy from " Jessy Trading " who claims 30.58% net profit over 100 trades in a couple of weeks with a 51% win rate and profit factor of 1.56 on EURUSD .
This one surprised us quite a bit. Despite the title of this strategy indicating this is on the 1 min timeframe, the author demonstrates the backtesting manually on the 5 minute timeframe. Given the simplicity of this strategy only incorporating a couple of indicators, it's robustness being able to be profitable in both low and high timeframes and on multiple symbols was quite refreshing.
The 3 settings which we need to pay most attention to here is the Hull Butterfly length, HalfTrend amplitude and the Max Number Of Bars Between Hull and HalfTrend Trigger. Depending on the timeframe and symbol, these settings greatly impact the performance outcomes of the strategy. I've listed a couple of these below.
And as always, If you know of or have a strategy you want to see myth-busted or just have an idea for one, please feel free to message me.
This strategy uses a combination of 3 open-source public indicators:
Hull Butterfly Oscillator by LuxAlgo
HalfTrend by Everget
Trading Rules
5 min candles but higher / lower candles work too.
Stop loss at swing high/low
Take Profit 1.5x the risk
Long
Hull Butterfly gives us green column, Wait for HalfTrend to present an up arrow and enter trade.
Short
Hull Butterfly gives us a red column , Wait for HalfTrend to present a down arrow and enter trade.
Alternative Trading Settings for different time frames
1 Minute Timeframe
Move the Hull Butterfly length from the default 11 to 9
Move the HalfTrend Amplitude from the default 2 to 1
Enabling ADX Filter with a 25 threshold
2 Hour Timeframe
Move the HalfTrend Amplitude from the default 2 to 1
Laddered Take Profits from 14.5% to 19% with an 8% SL

TridentI call this strategy "Trident", as it uses three different, modified, customizable indicators:
50 Exponential Moving Average (Trend)
Relative Strength Index (Momentum)
Average Directional Index (Volatility)
Strategy will be improved with future updates. You alone decide when to enter and when to exit a trade. PRICE ACTION IS KING and the TREND IS YOUR FRIEND
What do these three indicators tell us
Exponential Moving Average:
Trend
Price < EMA = downtrend
Price > EMA = uptrend
trend direction and reducing noise
Average Directional Index:
Volatility
direction of market movement when there is a sharp increase in volatility
Relative Strength Index:
Momentum
Strength
Possible shift in momentum
How this strategy works
As I mentioned above, this strategy uses uses three different, modified, customizable indicators:
Exponential Moving Average (50) (Trend): When price closes above or below the 50 period EMA, then the first condition is met. I know some people use multiple EMAs as dynamic support and resistance levels. Therefore, I also added a 21 and a 200 period EMA, but this strategy uses specifically the 50 period EMA as one of three conditions. All EMAs can be adjusted, turned on and off.
Relative Strength Index (80, 20, 3) (Momentum): In his video, TSM uses a 3 period RSI and 80 and 20 bands. If price is above 80, it`s overbought and if it`s below 20, then it`s oversold. Two out of three conditions are met.
Average Directional Index (5, 5) (Volatility): TSM uses the ADX to measure the volatility. Both ADX Smoothing and DI Length are set to 5. If this indicator moves above 30, then the third contidion is met.
Rules to enter the trade
Long Entry:
50 EMA < Price
RSI < 20
ADX > 30
Enter trade at breakout of high of the green candle, which is the candle that pulls the RSI from oversold conditions back inside.
Short Entry:
50 EMA > Price
RSI > 80
ADX > 30
Enter trade at breakout of low of the red candle, which is the candle that pulls the RSI from overbought conditions back inside.
Risk:Reward and Timeframe
Use a 1:1 to 1:1.5
Set your S/L below key levels (-> 2nd point @ Tips), or twice the length of the signal candle
Preferably 5 Minute Time Frame, but at the end you decide
Tips
Avoid periods of consolidation
Trade from support/resistance-levels, supply/demand-levels, pivot points-levels, Fibonacci-levels, swing high/low-levels
Trade during market hours, for example London and New York Session
Trade narrow spreads, if you scalp
Use Price Action
Trade with the trade, not against
The further away the price moves from the EMA the stronger the trend
The long the price doesn't touch the EMA the stronger the trend
RSI + ADX: Confirm when the market is turning and pick a good entry point
ADX + 50 EMA: Filters trades when there is not much activity in the market
I mentioned above that the code of this strategy is still under development. You can not only rely on this strategy alone as it might give you false signals. I coded this, because it makes it easier to visualize were all three conditions are met.
Use your brain, use price action, use these tips, use this strategy.
Frequently Asked Questions
Does it only work for scalping? - No, but try it out yourself
Does it only work for Forex? - No, but try it out yourself
Does only work on the 5 Minute Timeframe? - No, but try it out yourself
Good Luck!

Crack_RACD_Divergence_Ver_1.0.1Hello my dear traders. This is Tommy.
This time our team spent so much time and effort developing a technical indicator that catches the trend reversal signal relatively earlier than any other existing indicators.
Two RSIs (which quantify the relative strength of the price momentum using closed price of a candle) with certain parameters that we have found were exponentially smoothed using our very own equations.
We have programmed it to be signaled when golden and death crosses appear above and below certain area that we have concluded it as an overbought and oversold zone.
Similar to MACD (Moving Average Convergence Divergence) trading strategy, the histogram represents the distance between two RSIs.
When the histograms are trending towards the centerline, this means that the RSIs are converging and vice versa when histograms are going away from the centerline.
Moreover, when this logic confirms swing highs/lows using highs and lows of the candles (instead of closed), it automatically shows both the bullish and bearish divergences.
Thank you.
안녕하세요 트레이더 여러분. 토미입니다.
최근에 저희가 연구 및 개발한 지표는 단기와 중기 추세를 반영하는 두개의 선(RSI를 특정 로직으로 exponentially smoothed한)의 크로스오버가 저희가 정한 과매수/과매도 구간에서 발생할 시 변곡으로 해석해서 시그널을 주는 괴물 같은 녀석입니다.
히스토그램은 MACD 지표 비슷하게 두 선의 이격도를 나타냅니다. 센터라인으로 방향으로 히스토그램이 줄어들면 두 선의 차이가 줄어들고 있는 뜻이고, 히스토그램이 음/양의 방향으로 더 높아지면 두 선의 차이가 늘어나고 있는 뜻입니다.
게다가 자동으로 다이버전스도 잡아줍니다.
지표 사용을 원하시는 분들은 저희 채널에 문의 주시면 됩니다~
감사합니다.

Trendlines Breakouts Pro V1.2 - 4TP [Wukong Algo]Trendlines Breakouts Pro
Trading method “High Tight Trendline Breakout”. This is a simple but effective and flexible method that can support many other methods such as: support and resistance, supply and demand, volume profile...
Automatically connect TradingView and MetaTrader 5 (MT5) for automatic trading and order management via PineConnector
The system includes a risk management grid including the levels: Stop Loss (SL), Break-even (BE), Trail Trigger, Trailing Stop, TP1 (1/4), TP2 (2/4), TP3 (3/4), TP4 (4/4). This grid helps you easily monitor and manage orders on TradingView in parallel with automatic order management on MT5.
Focus on tight capital and risk management, reduce emotion and stress when trading
Suitable for all markets: Forex, Gold, Crypto, Stocks, as long as you use MT5 and TradingView
If you do not need to trade automatically via MT5, the Trendlines Breakokuts Pro can also be used as an effective indicator in visual order management on TradingView charts, helps maintain discipline and good trading psychology (less Stress or FOMO)
Trendlines Breakouts Pro System User Guide
Step 1 - Draw trendline AB. Just click to select 2 points A, B on the chart
This is a straight line at the border of a chart pattern or support/resistance zone on the chart that you determine has high potential when it is broken, the price will have strong momentum and you will enter the order (Entry). The trendline AB can be a diagonal line or a horizontal line.
Step 2 - Entry Window: Set the time allowed for transactions
You can choose the earliest and latest time allowed for trading signals, called Entry Window. This means that the system will not allow trading outside the Entry Window. This option allows you to manage trading times as you wish, avoiding bad times for trading such as sideways, choppy, high volatility, news
Step 3 - Set up the input parameters for trading
You choose the direction you want to wait for trading: Wait Long (Buy), Wait Short (Sell), Turn Off, Hidden
You enter the ID of your PineConnector account if you want to trade automatically from TradingView to MT5
You enter the order parameters: Lotsize per order, Stop Loss (SL%), BE(%), Trail Trigger (%), TP1(%), TP2(%), TP3(%), TP4(%)
You enter the safe filter parameters for Entry: max distance from entry to swing high/low, max distance from entry to trendline's breakpoint C, max entries per trendlines
See more details in the screenshots
Step 4 - Set up automatic trading from TradingView via MT5
If you do not need automatic trading in MT5, skip this step. Entry signals and risk management grids will still be displayed on the TradingView chart for you to see, but there is no connection and automatic trading signal shooting and automatic order management from TradingView to MT5 via PineConnector.
We need to create an Alert in TradingView and attach it to this Indicator so that the Alert's trading signals are transmitted via MetaTrader 5 (MT5) via PineConnector.
When trading, you need to turn on 3 software at the same time to be able to connect to each other to operate: TradingView, MetaTrader 5 (MT5), PineConnector
See more details in the screenshots
Step 5 - Complete setup, and wait for trading signals
You have completed the setup steps for the Indicator, ready when there is a trading signal
You do not need to sit in front of the screen all day if you do not want. The system has been set up to execute and manage orders automatically.
Of course, sometimes you should still check your transaction status, in case of unexpected problems such as lost internet connection.
If you still have questions about this Indicator, please email tuanwukongvn@gmail.com for support.

Strategy Myth-Busting #11 - TrendMagic+SqzMom+CDV - [MYN]This is part of a new series we are calling "Strategy Myth-Busting" where we take open public manual trading strategies and automate them. The goal is to not only validate the authenticity of the claims but to provide an automated version for traders who wish to trade autonomously.
Our 11th one is an automated version of the "Magic Trading Strategy : Most Profitable Indicator : 1 Minute Scalping Strategy Crypto" strategy from "Fx MENTOR US" who doesn't make any official claims but given the indicators he was using, it looked like on the surface that this might actually work. The strategy author uses this on the 1 minute and 3 minute timeframes on mostly FOREX and Heiken Ashi candles but as the title of his strategy indicates is designed for Crypto. So who knows..
To backtest this accurately and get a better picture we resolved the Heiken Ashi bars to standard candlesticks . Even so, I was unable to sustain any consistency in my results on either the 1 or 3 min time frames and both FOREX and Crypto. 10000% Busted.
This strategy uses a combination of 3 open-source public indicators:
Trend Magic by KivancOzbilgic
Squeeze Momentum by LazyBear
Cumulative Delta Volume by LonesomeTheBlue
Trend Magic consists of two main indicators to validate momentum and volatility. It uses an ATR like a trailing Stop to determine the overarching momentum and CCI as a means to validate volatility. Together these are used as the primary indicator in this strategy. When the CCI is above 0 this is confirmation of a volatility event is occurring with affirmation based upon current momentum (ATR).
The CCI volatility indicator gets confirmation by the the Cumulative Delta Volume indicator which calculates the difference between buying and selling pressure. Volume Delta is calculated by taking the difference of the volume that traded at the offer price and the volume that traded at the bid price. The more volume that is traded at the bid price, the more likely there is momentum in the market.
And lastly the Squeeze Momentum indicator which uses a combination of Bollinger Bands, Keltner Channels and Momentum are used to again confirm momentum and volatility. During periods of low volatility, Bollinger bands narrow and trade inside Keltner channels. They can only contract so much before it can’t contain the energy it’s been building. When the Bollinger bands come back out, it explodes higher. When we see the histogram bar exploding into green above 0 that is a clear confirmation of increased momentum and volatile. The opposite (red) below 0 is true when there are low periods. This indicator is used as a means to really determine when there is premium selling plays going on leading to big directional movements again confirming the positive or negative momentum and volatility direction.
If you know of or have a strategy you want to see myth-busted or just have an idea for one, please feel free to message me.
Trading Rules
1 - 3 min candles
FOREX or Crypto
Stop loss at swing high/low | 1.5 risk/ratio
Long Condition
Trend Magic line is Blue ( CCI is above 0) and above the current close on the bar
Squeeze Momentum's histogram bar is green/lime
Cumulative Delta Volume line is green
Short Condition
Trend Magic line is Red ( CCI is below 0) and below the current close on the bar
Squeeze Momentum's histogram bar is red/maroon
Cumulative Delta Volume line is peach

Stella EdgeStella Edge — Quick Guide (EN)
1. What It Does
Stella Edge provides a stellar advantage in the markets by visualizing a key gravitational price level (EMA) and an upper resistance zone based on higher-timeframe volatility (ATR). The system delivers sharp entry signals (▲▼), confirms take-profit targets with a shining star (⭐️), and warns of high-risk "black hole" events (💀), helping you trade with a clear edge.
2. Choosing the Best Markets & Timeframes
This indicator works best in markets that exhibit clear trending and consolidation phases, such as major FX pairs, indices, and cryptocurrencies, especially for scalping and day trading.
Recommended timeframes: 1 minute to 30 minutes.
For high-volatility assets (e.g., BTC, Gold), consider using the higher end of the range (5m to 30m) to focus on more stable zones.
For lower-volatility assets (e.g., major FX pairs), 1m–15m charts can effectively capture shorter-term opportunities.
Tip : Adjust the Higher TF for EMA/ATR setting to match your trading style. A higher TF provides broader, more stable zones, while a lower TF reacts more quickly to price.
3. Building Your Trade Plan
Entry Signals: Look for buy signals (▲) as the price crosses the invisible lower volatility boundary. Look for sell signals (▼) as the price pushes into or crosses the visible upper resistance zone.
Take-Profit Target : The central EMA line is your primary target. The indicator will automatically plot a ⭐️ sign when the price touches this line after an entry signal, indicating a successful exit point.
Stop-Loss Placement : A logical Stop Loss can be placed using a multiple of the ATR or at a recent swing high/low outside the entry band.
Danger Signal (💀): A 💀 icon warns of extreme, news-driven volatility. It is strongly advised to avoid new entries and protect existing positions when this signal appears.
4. Key Parameters
Higher TF for EMA/ATR: The most important setting. This determines the timeframe from which the core EMA/ATR channel is calculated.
ATR Multiplier : Controls the width of the resistance zone and the invisible lower band. Increase for wider zones (fewer signals), decrease for narrower zones (more signals).
Enable Extreme Volatility Filter? : Toggles the 💀 danger signal feature on or off.
ATR & Volume Spike Multiplier : Adjusts the sensitivity of the danger signal. Lower values make the filter more sensitive to spikes.
5. Important Disclaimer
This tool suggests potential trade setups and risk areas; it does not guarantee profit or prevent loss. News shocks, thin liquidity, or abnormal volatility can negate any signal. All trading decisions and resulting P&L are entirely your responsibility. Leveraged trading can exceed your initial deposit—use only risk capital you can afford to lose. We accept no liability for losses or damages arising from the use of this tool.
Stella Edge — クイックガイド (JP)
1. 機能概要
「Stella Edge」は、星の引力のように相場の中心となるEMAラインと、上位足のボラティリティに基づいた抵抗帯(レジスタンスゾーン)を可視化するトレーディングシステムです。
鋭いエントリーサイン(▲▼)、星の輝きのような利確目標(⭐️)、そして危険なブラックホール相場(💀)を知らせる警告で、あなたのトレードに優位性をもたらします。
2. 最適な銘柄・時間軸の選定
スキャルピングやデイトレードなど、短期売買を主体とする銘柄(主要通貨ペア、指数、暗号資産など)と相性◎
推奨時間軸 :1分足~30分足
ボラティリティが高い銘柄(BTC、ゴールドなど)⇒ 5分~30分足で、より安定したゾーンを基準に分析するのがおすすめです。
ボラティリティが低い銘柄(主要通貨ペアなど)⇒ 1分~15分足で、短期的なチャンスを捉えるのに有効です。
ヒント: 設定のHigher TF for EMA/ATRを調整することで、ご自身のスタイルに合った時間軸のゾーンを表示できます。
3. トレードプランの策定
エントリーポイント: 買いサイン(▲)は、価格が目に見えない下限バンドをクロスしたときに出現します。売りサイン(▼)は、価格が紫色の抵抗帯に侵入、または上に抜けたときに出現します。
利食い目標 : 中心に走るEMAラインが、第一の利食い目標です。エントリー後、価格がこのEMAにタッチすると、利確を示す**⭐️**マークが自動で表示されます。
損切り設定 : ATRを基準にするか、直近の高値・安値の外側など、ご自身のルールに基づいて損切りを必ず設定してください。
危険サイン(💀)について : **💀**マークは、指標発表などで突発的なボラティリティが発生したことを示す警告です。このサインが出現した際は、新規エントリーを避け、ポジション管理を徹底することを強く推奨します。
4. 主要パラメーター解説
Higher TF for EMA/ATR: 最も重要な項目。インジケーターの核となるゾーンを、どの時間足を基準に計算するかを設定します。
ATR Multiplier : 抵抗帯の幅を調整します。数値を大きくするとゾーンが広くなりサインが厳選され、小さくするとゾーンが狭まりサインが増加します。
Enable Extreme Volatility Filter? : 危険サイン(💀)機能のON/OFFを切り替えます。
ATR & Volume Spike Multiplier : 危険サインの感度を調整します。数値を下げるほど、より敏感に異常なボラティリティを検知します。
5. 重要なご注意(Disclaimer)
本ツールは相場の反発ポイントやリスクを示唆するものであり、利益を保証するものではありません。ニュースや低流動性などによりサインが機能しない場合があります。取引で発生する損益はすべてご本人の責任となります。レバレッジ取引は証拠金を超える損失リスクを含みます。必ず余裕資金内でご利用ください。本ツールの利用に起因する損失・損害について、制作者は一切責任を負いません。

ICT Liquidity Sweep MAX RETRI (ALERT)Strategy Description: SMC + ICT Reversal Sniper | 5-Min | R2 TP
This strategy applies Smart Money Concepts (SMC) and ICT methodology to identify high-probability reversal trades using a clean, rule-based system designed for the 5-minute timeframe.
⸻
Core Logic:
• Liquidity Sweep: Identifies stop hunts beyond recent swing highs/lows using a configurable lookback window.
• Break of Structure (BOS): Validates a directional shift after the sweep.
• Fixed R2 Risk-Reward: Entry is followed by a 2:1 take-profit target. Stop loss is set at the sweep candle’s high/low.
• No Entry Between 8 PM–12 AM NY Time: Avoids the manipulation-prone and illiquid zone.
• Discreet SL Handling: SL hits close trades silently — no labels or visuals.
⸻
Entry Precision & Timing Notes:
• The strategy may occasionally fire before a confirmed liquidity sweep — this is expected. If a sweep occurs later, you may still re-enter toward equilibrium, with take profit also targeted at equilibrium.
• Alerts or trades that trigger near 9:30 AM NY often align with real direction, but this time can be volatile.
• For more reliable and lower-risk entries, focus on the 1:30 PM to 2:00 PM silver bullet window, which tends to produce cleaner setups with more favorable flow. 🖤

Custom Pattern DetectionOverview
Chart Patterns is a major tool for many traders. Pattern formation at specific location on the chart is used for investment/trading decisions.
This indicator is designed in a way to allow investors/traders to define patterns of their choice based on certain input parameters and then detect defined pattern on the chart.
Investors/traders can use their own creativity to create and detect patterns.
This indicator works in 2 modes
Create Pattern: One can define a pattern and verify sample pattern formation visually
Detect Pattern: Detect and mark patterns on the chart
Settings
Create Custom Pattern:
Show Custom Pattern – This will mark the pattern lines on the chart so that one can verify how pattern appears based on the input’s parameters provided for lines XA, AB, BC, CD, DE, EF
Offset – Used while pattern creation. Offset is horizonal distance between 2 lines.
XA Points – Used to draw XA line when sample pattern is drawn. XA points can be a negative or position number.
XA line is drawn based on Offset and XA Points. E.g. Offset = 5 and XA Points = -20. In this line would be drawn from last candle high to high – 20 (these are y1 and y2 points of a line). While drawing line distance of 5 candles would be placed between 2 line points (these are x1 and x2 points of a line). In XA line X forms start point and A forms end point of the line.
Line AB – Line AB is drawn from point X. To derive the end point of AB, average Fib% is derived based on From Fib% and To Fib% parameters. Finally end point is derived by applying Fib Retracement on Line XA based on average Fib%.
Line AB to Line EF – These points are derived as explained in Line AB.
The indicator can be used to define/create patterns up to 6 legs/lines. The line would be named as XA -> AB -> BC -> CD -> DE -> EF.
If one wish to create pattern consisting 3 legs then it can be achieved by unchecking/deselecting Line CD, DE and EF or by checking only Line AB and BC.
Based on the parameters above indicator draws a sample pattern after last candle/bar on the chart. Sample pattern helps to visually see how pattern will appear on the chart.
Pattern Identification
Indicator derive the swing high/low points based on the Pivot lookback and use as reference points while detecting patterns.
Use of From Fib% and To Fib% - While detecting pattern, retracement price points are derived for From Fib% and To Fib%. Price points between from Fib% and To Fib% are treated as valid retracement points.
How to configure and use indicator for detecting patterns
Sample Pattern 1
Sample Pattern 2
Sample Pattern 3
Sample Pattern 4

Dynamic EMA Stack Support & ResistanceEvery trader needs reliable support and resistance — but static zones and lagging indicators won't cut it in fast-moving markets. This script combines a Fibonacci-based 5-EMA stacking system and left/right pivots that create dynamic support & resistance logic to uncover real-time structural shifts & momentum zones that actually adapt to price action. This isn’t just a mashup — it’s a complete built-from-the-ground-up support & resistance engine designed for scalpers, intraday traders, and trend followers alike.
🧠 🧠 🧠What It Does🧠 🧠 🧠
This script uses two powerful engines working in sync:
1️⃣ EMA Stack (5-EMA Framework)
Built on Fibonacci-based lengths: 5, 8, 13, 21, 34, (configurable) this stack identifies:
🔹 Bullish Stack: EMAs aligned from fastest to slowest (uptrend confirmation)
🔹 Bearish Stack: EMAs aligned inversely (downtrend confirmation)
🟡 Narrowing Zones: When EMAs compress within ATR thresholds → possible breakout or reversal zone
🎯 Labels identify key transitions like:
✅"Begin Bear Trend?"
✅"Uptrend SPRT"
✅"RES?" (resistance test)
2️⃣ Pivot-Based Projection Engine
Using classic Left/Right Bar pivot logic, the script:
📌 Detects early-stage swing highs/lows before full confirmation
📈 Projects horizontal S/R lines that adapt to market structure
🔁 Keeps lines active until a new pivot replaces them
🧩 Syncs beautifully with EMA stack for confluence zones
🎯🎯🎯Key Features for Traders🎯🎯🎯
✅ Trend Detection
→ EMA order reveals real-time bias (bullish, bearish, compression)
✅ Dynamic S/R Zones
→ Historical support/resistance levels auto-draw and extend
✅ Smart Labeling
→ “SPRT”, “RES”, and “Trend?” labels for live context + testing logic
✅ Custom Candle Coloring
→ Choose from Bar Color or Full Candle Overlay modes
✅ Scalper & Swing Compatible
→ Use fast confirmations for scalping or stack consistency for longer trends
⚙️⚙️⚙️How to Use⚙️⚙️⚙️
✅Use Top/Bottom (trend state) Line Colors to quickly read trend conditions.
✅Use Pivot-based support/resistance projections to anticipate where price might pause or reverse.
✅Watch for yellow/blue zones to prepare for volatility shifts/reversals.
✅Combine with volume or momentum indicators for added confirmation.
📐📐📐Customization Options📐📐📐
✅EMA lengths (5, 8, 13, 21, 34) — fully configurable - try 21,34,55, 89, 144 for longer term trend states
✅Left/Right bar pivot settings (default: 21/5)
✅Label size, visibility, and color themes
✅Toggle line and label visibility for clean layouts
✅“Max Bars Back” to control how deep history is scanned safely
🛠🛠🛠Built-In Safeguards🛠🛠🛠
✅ATR-based filters to stabilize compression logic
✅Guarded lookback (max_bars_back) to avoid runtime errors
✅Works on any asset, any timeframe
🏁🏁🏁Final Word🏁🏁🏁
This script is not just a visual tool, it’s a complete trend and structure framework. Whether you're looking for clean trend alignment, dynamic support/resistance, or early warning labels, this system is tuned to help you react with confidence — not hindsight.
Rembember, no single indicator should be used in isolation. For best results, combine it with price action analysis, higher-timeframe context, and complementary tools like trendlines, moving averages etc Use it as part of a well-rounded trading approach to confirm setups — not to define them alone.
💡💡💡Turn logic into clarity. Structure into trades. And uncertainty into confidence.💡💡💡

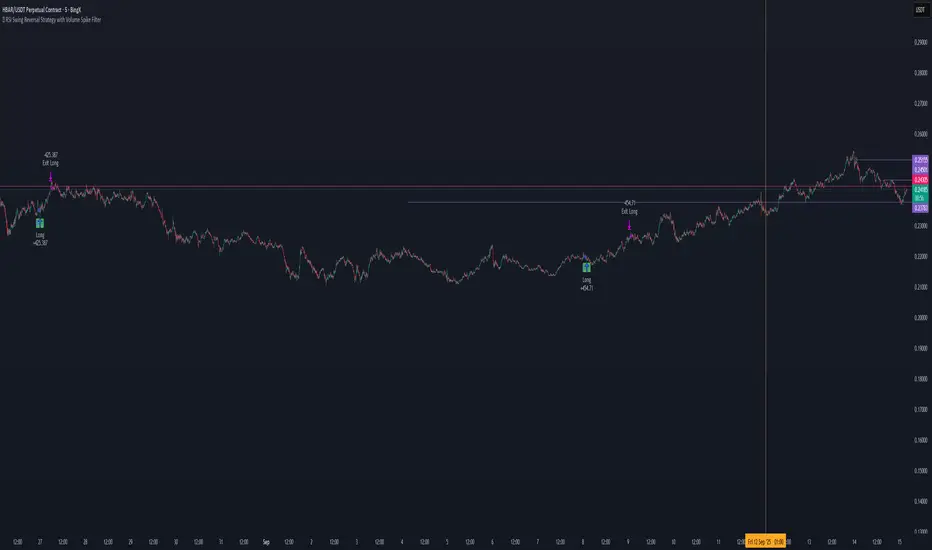
📊 RSI Swing Reversal Strategy with Volume Spike FilterHi , i did test that on Hbar time frame 5min. please let me know if i did miss something .85% win rate. please get back test.
What Will This Strategy Do?
Use RSI cross over/under its MA + Swing High/Low + optional Trend Filter.
Enter long on bullish signals.
Enter short on bearish signals.
Exit on opposite signals or optional take-profit/stop-loss.
Quantel.io Swing ProEnters near swing highs/lows to ride short- to medium-term trends for big overnight futures gains.

ICT FVG Buy/Sell SignalsThis bot is built on ICT (Inner Circle Trader) concepts such as:
Fair Value Gaps (FVGs) – imbalance zones between candles.
Consequent Encroachment (CE) – the midpoint of a gap.
Premium / Discount Arrays – dealing ranges split into premium (sell-side) and discount (buy-side) zones.
Displacement candles – strong impulsive moves that confirm intent.
The bot scans for FVGs, marks CE levels, and waits for price to return to these levels.
When price revisits a valid FVG zone with displacement confirmation and in the correct PD array, the bot generates a BUY or SELL signal.
✅ Signal Rules
Buy Signal
Price trades back into a Bullish FVG.
Current bar shows bullish displacement (large bullish body relative to ATR).
Price is in discount territory of the current dealing range (if PD filter is enabled).
Close is above the CE line of the FVG.
Sell Signal
Price trades back into a Bearish FVG.
Current bar shows bearish displacement.
Price is in premium territory of the current dealing range.
Close is below the CE line of the FVG.
🎯 What You’ll See on the Chart
Green “BUY” labels below candles when long signals trigger.
Red “SELL” labels above candles when short signals trigger.
Shaded background:
Red = Premium zone (sell side).
Teal = Discount zone (buy side).
Yellow line = dealing range midpoint (equilibrium).
Dots on CE lines = midpoints of the latest bullish/bearish FVG.
🔔 Alerts
ICT Buy → Triggers when a bullish setup confirms.
ICT Sell → Triggers when a bearish setup confirms.
You can connect these alerts to:
TradingView notifications.
Webhooks (for brokers or bots like MetaTrader, NinjaTrader, or Discord).
⚙️ Settings
Swing length – how many bars to use when detecting swing highs/lows for the dealing range.
Use PD filter – toggle ON/OFF for requiring discount/premium alignment.
Displacement ATR multiple – how strong the candle body must be compared to ATR to count as a displacement.
ATR length – used for displacement filter.
📈 Supported Markets
Works on all symbols and timeframes.
Commonly applied to:
NASDAQ (NQ, QQQ)
S&P500 (ES, SPX, SPY)
Forex pairs
Crypto (BTC, ETH, etc.)
⚠️ Disclaimer
This bot is for educational purposes only. It does not guarantee profits and should be tested on demo accounts first.
Always apply proper risk management before trading live.

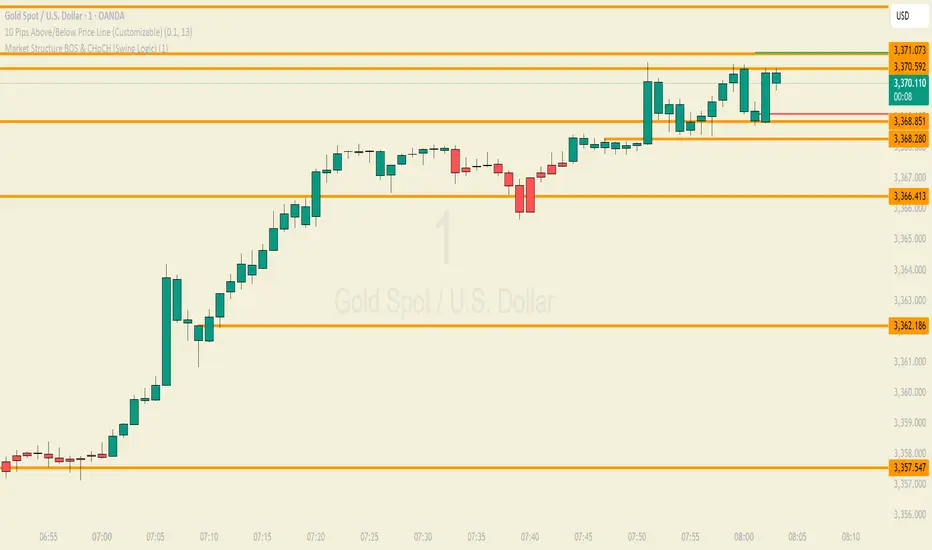
Easy Market Structure BOS & CHoCH (Swing Logic)A trend reversal occurs when the direction of the market changes from an uptrend to a downtrend or vice versa. It is typically confirmed by a shift in price structure, such as a break of key support or resistance, a change in swing highs/lows, or specific candlestick patterns like engulfing or pin bars. Indicators like RSI divergence or moving average crossovers can also support reversal identification. Reversals often follow a strong trend and signal a potential new direction in price movement

easy Market Structure BOS & CHoCH (Swing Logic)
A trend reversal occurs when the direction of the market changes from an uptrend to a downtrend or vice versa. It is typically confirmed by a shift in price structure, such as a break of key support or resistance, a change in swing highs/lows, or specific candlestick patterns like engulfing or pin bars. Indicators like RSI divergence or moving average crossovers can also support reversal identification. Reversals often follow a strong trend and signal a potential new direction in price movement
RSI Custom ADX VWAP Swing Signals Anmol Singh point.Anmol Singh
This indicator combines RSI, a custom ADX, VWAP, and Swing High/Low Break signals to identify potential buy and sell opportunities. It provides visual signals and alerts, helping traders spot trends and reversals more effectively on NASDAQ 1-minute charts.

FVG Strategy - Fair Value GapThe Fair Value Gap Strategy (FVG) is a trading approach that relies on price action analysis and involves identifying market inefficiencies or imbalances.
The strategy offers a variety of customizable settings to match your preferences and includes an entry and exit strategy to guide you through trades.
The script operates in the following manner:
It begins by searching for fair-value-gaps and subsequently identifies a break in structure.
The next step involves waiting for the price to retrace within the previously established fair value gap.
Within this gap, there is a Fibonacci retracement that must be reached before placing a stop-order.
Example: GER40, 1min Chart
STOP LOSS & RISK MANAGEMENT
FVG : The stop loss will be set at the end of the fair value gap
Last Swing : The stop loss will be at the last swing high/low
ATR (Average True Range) : The stop loss will be placed one 'Average True Range' away from the entry
TAKE PROFIT
Pips/Points : The stop loss will be set at the chosen amount of pips/points.
RiskReward TP : This is a fixed take profit where you can set a specific risk-to-reward ratio for the trade. For example, you can set a 1:3 risk-to-reward ratio.
Trailing Stop : This is a flexible stop that moves with the market price, allowing you to capture more profit as the trade moves in your favor.
Both : This option combines both the RiskReward TP and Trailing Stop. If the price target is set at a 1:3 risk-to-reward ratio, the trailing stop will move with the price until either the stop or take profit is reached, and the position will be closed completely.
THE FVG SECTION
In the FVG section, you will have the ability to customize your settings based on your specific requirements.
Firstly, you will have the choice of two possible entry options:
Candle Close : This option triggers the order once the candle has completely closed and all the set requirements are met.
Stop Orders : This option triggers the order once all the set requirements are met, even if the candle is still active and has not yet closed.
On top, you can activate the "Pinbar-Trading", that will allow you to take a trade on a pinbar, even when the candle just dipped into the FVG and snapped back.
FAIR VALUE GAP TYPE
On volatile market, it may happen that a massive FVG is created. Thats why we have separated the FVG into 2 different variables.
FVG Type: Normal : This is all regular FVG that meet the requirement of you minimum size range. As example FVG must be minimum 5$ big.
FVG Type: Big : This are all big FVG that meet the minimum set size range. The difference to the "normal" type, the stop loss will be set at 50% of the Big-FVG.
FIBONACCI RETRACEMENT & MARKET STRUCTURE
To refine the FVG strategy, you have three options:
Fibonacci Retracement Value (%) : The FVG strategy employs a Fibonacci retracement, which allows you to trade in the direction of the market movement. To initiate the order, the price must reach a predetermined Fibonacci level and then rebound.
Formation-to-Retracement Countdown: : This option provides you with a specified number of candles to meet the necessary conditions. For example, if the order is not triggered within 20 candles, delete the FVG-Zone and skip the trade to avoid getting caught in a sideways ranging trend.
Structure Lookback : This feature filters out older FVG Zones. You can specify the number of candles that should mark the FVG Zones. Keep in mind that newer and fresher zones will automatically conceal older ones.
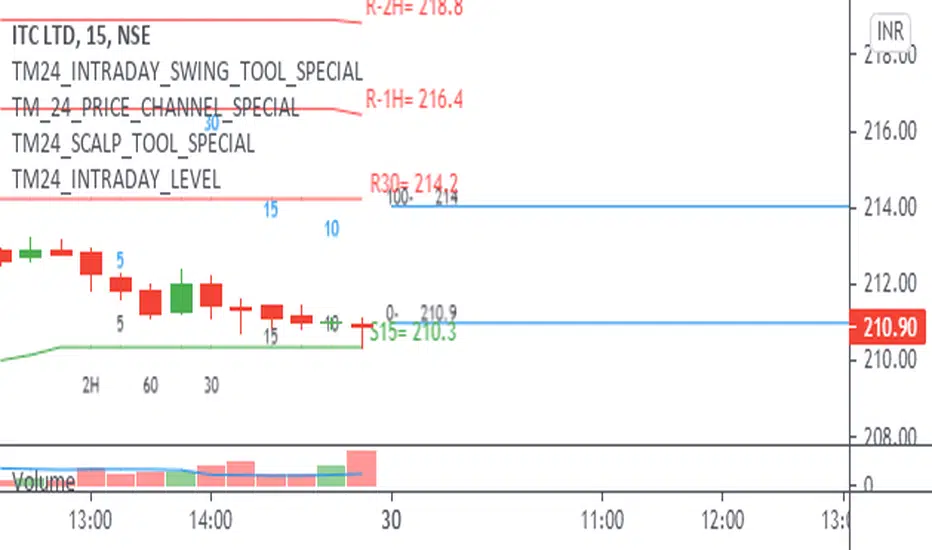
TM24_INVESTMENT_TOOLTM24_INVESTMENT_TOOL helps to identify following Things for Intraday Position on 60 Minutes + timeframe along with Buy or sell signal.
1. Market Trend (Different Timeframe)
2. Price Direction
3. Area of Support & Resistance
4. Price Momentum
Terminology Use ==> Black from Bottom for - Buy, Red from Top for - Sale Signal, and Numbers are to show time frame indication there is presence of buyer or seller like 30 for buy signal on 30 minute time frame etc.
Display and Interpretation ==> Buy Sale Signal in Digit with 15-30-60-D-W-M for different time frames.
any value signal ending with * shows breakout of support/ resistance and value signal starting with * shows entry to a momentum zone.
Green Mark with Triangle Up shows trend of that timeframe in positive and value shows upside possible direction on that timeframe vice versa for red signal with down triangle
Use market structure, chart pattern, trend lines for more support..
Time frame ==> Use proper Signal with 60 minute, 120 minute time frame
What to Identify ==> Overall Trend for the Swing
How to Use ==>
See how and order buildup is seen and current order position. Also area for volatility and expected movement in price direction
Note: - Use market structure, chart pattern, trend lines and price action parameter for more confirmation.
Entry ==>
Let’s wait the proper area of support or resistance ( Area of Value in case of trend pattern use)
Exit ==>
SL of swing high/low out of market structure with proper risk management and target with proper Risk/ Reward Ratio
Use the Below Contacts to Access this Indicator

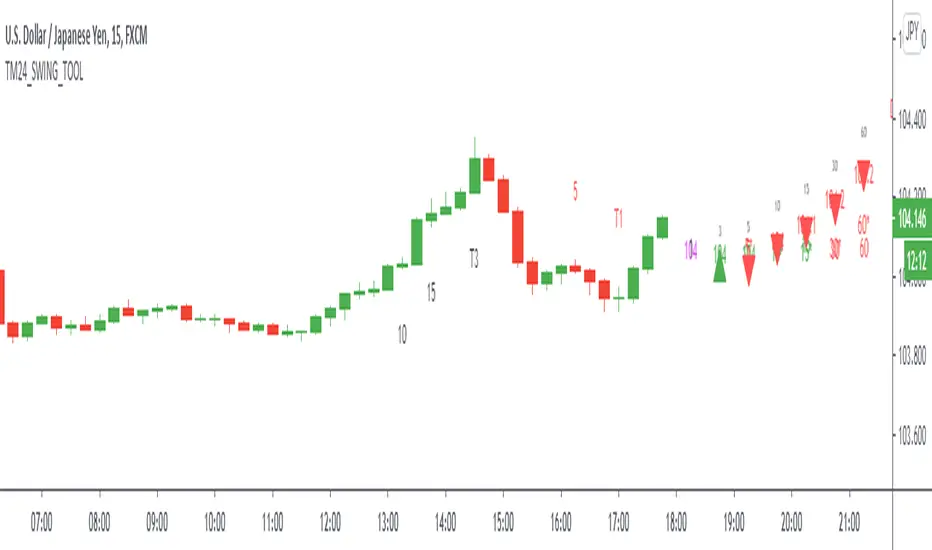
TM24_SWING_TOOLTM24_SWING_TOOL helps to identify following Things for Intraday Position on 15-30-60 Minutes timeframe along with Buy or sell signal.
1. Market Trend (Different Timeframe)
2. Price Direction
3. Area of Support & Resistance
4. Price Momentum
Terminology Use ==> Black from Bottom for - Buy, Red from Top for - Sale Signal, and Numbers are to show time frame indication there is presence of buyer or seller like 1 for buy signal on 1 minute time frame etc.
Display and Interpretation ==> Buy Sale Signal in Digit with 5-10-15-30-60-D for different time frames.
any value signal ending with * shows breakout of support/ resistance and value signal starting with * shows entry to a momentum zone.
Green Mark with Triangle Up shows trend of that timeframe in positive and value shows upside possible direction on that timeframe vice versa for red signal with down triangle
T1 stand for trend change in 1 Minute timeframe and T3 stand for trend change in 3 Minute timeframe
Use market structure, chart pattern, trend lines for more support..
Time frame ==> Use proper Signal with 15 minute, 30 minute time frame
What to Identify ==> Overall Trend for the Swing
How to Use ==>
See how and order buildup is seen and current order position. Also area for volatility and expected movement in price direction
Note: - Use market structure, chart pattern, trend lines and price action parameter for more confirmation.
Entry ==>
Let’s wait the proper area of support or resistance ( Area of Value in case of trend pattern use)
Exit ==>
SL of swing high/low out of market structure with proper risk management and target with proper Risk/ Reward Ratio
Use the Below Contacts to Access this Indicator
TM24_INTRADAY_LEVELTM24_INTRADAY_LEVEL tool shows overall market price structure of market for Intraday Position. It can be used with TM24_GANN_LEVELS tool
Terminology Use ==> Price Line, Price Level name and Price level
Timeframe ==> Use proper Signal with swing trend on 15 Min. or lower time frame (Best if Use with 15 Minutes chart or 5 Min. chart).
What to Identify ==> Overall market price structure for the Intraday Period
How to Use ==>
There are Many Line in price level chart
Green/red with Solid for important area of support or resistance
Other dotted lines are for retracement or extension of prices.
Important Structure==> Price behaviors on all lines of possible support and resistance
Use market structure, chart pattern, trend lines for more support..
Entry ==>
Let’s wait the proper area of support or resistance (Area of Value in case of trend pattern use)
Exit ==>
SL of swing high/low out of market structure with proper risk management and target with proper Risk/ Reward Ratio
Use the Below Contacts to Access this Indicator