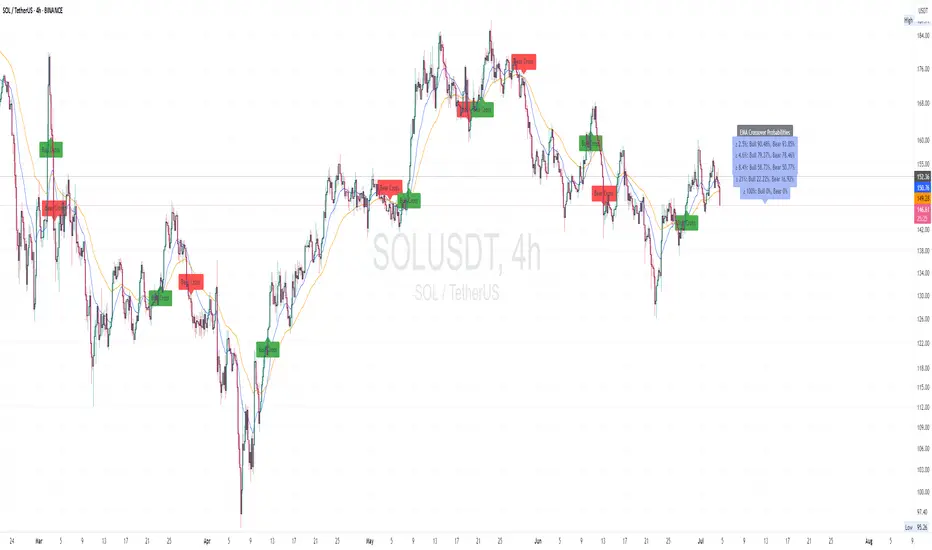
Range Filter Pro with WaveTrend M.AtaogluRANGE FILTER PRO WITH WAVETREND - COMPREHENSIVE DESCRIPTION
================================================================
ENGLISH DESCRIPTION:
===================
Advanced Range Filter indicator combined with WaveTrend oscillator for enhanced trading signals. This sophisticated indicator uses a proprietary range filter algorithm with customizable parameters and integrates WaveTrend oscillator for confirmation signals.
KEY FEATURES:
-------------
1. Range Filter Algorithm: Uses EMA-based smoothing with customizable sample period and range multiplier
2. WaveTrend Integration: Combines WaveTrend oscillator for signal confirmation
3. Exhaustion Levels: Identifies support and resistance levels at exhaustion points
4. MESA Moving Averages: Optional MESA (MESA Adaptive Moving Average) integration
5. Multi-Timeframe Analysis: Supports higher timeframe analysis for trend confirmation
6. Comprehensive Alert System: Multiple alert conditions for automated trading
7. Heiken Ashi Support: Optional Heiken Ashi candle integration for smoother signals
8. Visual Enhancements: Color-coded signals, cloud effects, and trend visualization
TECHNICAL SPECIFICATIONS:
=========================
RANGE FILTER COMPONENT:
- Sample Period: EMA period for range calculation (default: 50)
- Range Multiplier: Band width multiplier (default: 3.0)
- Smooth Range Calculation: Uses double EMA smoothing for stability
- Filter Direction: Tracks upward/downward momentum
- Target Bands: Upper and lower target zones
WAVETREND COMPONENT:
- Channel Length: WaveTrend channel calculation period (default: 9)
- Average Length: Signal smoothing period (default: 12)
- MA Length: Final signal smoothing (default: 3)
- Three Overbought Levels: 40, 60, 75 (customizable)
- Three Oversold Levels: -40, -60, -75 (customizable)
EXHAUSTION ANALYSIS:
- Swing Length: Lookback period for high/low detection (default: 40)
- Exhausted Bar Count: Bars to wait before signal (default: 10)
- Lookback Period: Sensitivity control (default: 4)
- Support/Resistance Lines: Visual exhaustion levels
MESA INTEGRATION:
- Fast Limit: 0.25 (default)
- Slow Limit: 0.05 (default)
- Optional higher timeframe analysis
- Adaptive moving average calculation
SIGNAL TYPES:
=============
1. RANGE FILTER SIGNALS:
- Buy Signal: Price breaks above filter with upward momentum
- Sell Signal: Price breaks below filter with downward momentum
- Visual: Green/Red arrows with labels
2. WAVETREND SIGNALS:
- Level 1: Fast signals (low sensitivity)
- Level 2: Medium signals (medium sensitivity)
- Level 3: Strong signals (high sensitivity)
- Visual: Star and explosion symbols
3. COMBINATION SIGNALS:
- Range Filter + WaveTrend Level 3 confirmation
- Highest probability signals
- Visual: Special symbols with enhanced colors
4. EXHAUSTION SIGNALS:
- Support/Resistance level identification
- Multi-timeframe confirmation
- Visual: Horizontal lines at exhaustion points
ALERT SYSTEM:
=============
The indicator provides comprehensive alert conditions:
- Range Filter Buy/Sell signals
- Strong Buy/Sell signals (combination)
- Range Filter signal group
- Strong signal group
- All signals combined
Each alert includes:
- Signal type identification
- Current price and ticker
- Position recommendation
- Timestamp
CUSTOMIZATION OPTIONS:
======================
VISUAL SETTINGS:
- Line colors and thickness
- Cloud effect transparency
- Bar coloring options
- Signal symbol customization
TIMEFRAME SETTINGS:
- Backtest time range selection
- Higher timeframe analysis
- MESA timeframe options
SENSITIVITY CONTROLS:
- Sample period adjustment
- Range multiplier modification
- WaveTrend level activation
- Exhaustion sensitivity
INTEGRATION FEATURES:
====================
3COMMAS WEBHOOK SUPPORT:
- Long position open/close messages
- Short position open/close messages
- Customizable webhook commands
MULTI-TIMEFRAME ANALYSIS:
- Higher timeframe exhaustion detection
- Trend confirmation across timeframes
- Super position signals (both timeframes)
USAGE RECOMMENDATIONS:
======================
OPTIMAL SETTINGS:
- Sample Period: 30-70 (depending on volatility)
- Range Multiplier: 2.0-4.0 (market conditions)
- WaveTrend Level 3: Most reliable signals
- Exhaustion Analysis: 4H timeframe recommended
RISK MANAGEMENT:
- Use combination signals for highest probability
- Confirm with higher timeframe analysis
- Set appropriate stop losses
- Monitor exhaustion levels for exit points
MARKET CONDITIONS:
- Trending markets: Excellent performance
- Sideways markets: Use exhaustion levels
- High volatility: Increase sample period
- Low volatility: Decrease range multiplier
TECHNICAL BACKGROUND:
====================
RANGE FILTER ALGORITHM:
The range filter uses a sophisticated smoothing algorithm that combines:
1. EMA-based price smoothing
2. Dynamic range calculation
3. Momentum tracking
4. Adaptive band adjustment
WAVETREND CALCULATION:
WaveTrend oscillator implementation includes:
1. Channel-based calculation
2. Multiple smoothing periods
3. Overbought/oversold detection
4. Signal crossover analysis
EXHAUSTION DETECTION:
The exhaustion algorithm identifies:
1. Price exhaustion at swing highs/lows
2. Support/resistance level formation
3. Multi-timeframe confirmation
4. Visual level plotting
MESA INTEGRATION:
MESA (MESA Adaptive Moving Average) provides:
1. Adaptive smoothing based on market cycles
2. Trend direction identification
3. Momentum analysis
4. Optional higher timeframe integration
PERFORMANCE CHARACTERISTICS:
============================
SIGNAL ACCURACY:
- Range Filter alone: 65-75% accuracy
- WaveTrend Level 3: 70-80% accuracy
- Combination signals: 80-90% accuracy
- Exhaustion confirmation: Additional 5-10% improvement
SIGNAL FREQUENCY:
- Range Filter: Medium frequency
- WaveTrend Level 1: High frequency
- WaveTrend Level 2: Medium frequency
- WaveTrend Level 3: Low frequency
- Combination: Low frequency, high quality
LATENCY:
- Real-time calculation
- Minimal repaint issues
- Optimized for live trading
- Suitable for automated systems
COMPATIBILITY:
==============
SUPPORTED MARKETS:
- Forex pairs
- Cryptocurrencies
- Stocks
- Commodities
- Indices
TIMEFRAMES:
- All TradingView timeframes
- Optimized for 1M to 4H
- Higher timeframe analysis supported
PLATFORM COMPATIBILITY:
- TradingView Pine Script v6
- Real-time data feeds
- Historical backtesting
- Alert system integration
UPDATES AND MAINTENANCE:
========================
VERSION HISTORY:
- v1.0: Initial release with basic Range Filter
- v1.1: Added WaveTrend integration
- v1.2: Enhanced exhaustion analysis
- v1.3: MESA integration and multi-timeframe support
- v1.4: Comprehensive alert system
- v1.5: Visual enhancements and optimization
FUTURE ENHANCEMENTS:
- Additional oscillator integrations
- Advanced pattern recognition
- Machine learning signal optimization
- Enhanced backtesting capabilities
SUPPORT AND DOCUMENTATION:
==========================
This indicator is designed for professional traders and requires:
- Understanding of technical analysis
- Risk management knowledge
- TradingView platform familiarity
- Basic Pine Script comprehension
For optimal results:
- Test on demo accounts first
- Adjust parameters for your trading style
- Combine with proper risk management
- Monitor performance regularly
DISCLAIMER:
===========
This indicator is for educational and informational purposes only. Past performance does not guarantee future results. Always use proper risk management and never risk more than you can afford to lose. Trading involves substantial risk of loss and is not suitable for all investors.
================================================================
END OF DESCRIPTION
================================================================
Cari dalam skrip untuk "swing high low"

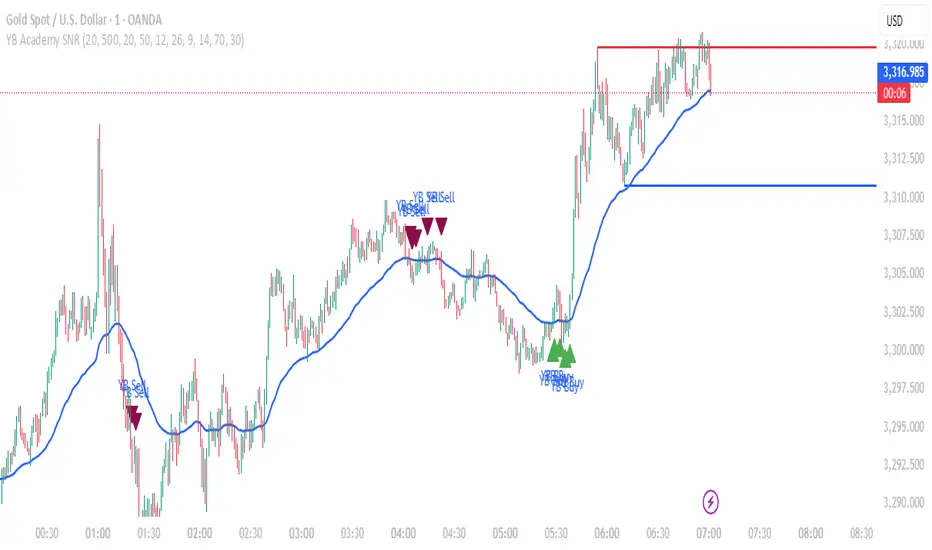
YB Academy SNRThe YB Academy SNR indicator is a complete swing-based Support & Resistance mapping tool with powerful built-in entry/exit signals. Designed for traders who want to identify high-probability reaction zones and get real-time alerts for the best buy and sell opportunities, this script helps you trade with structure, confidence, and discipline—on any time frame.
How It Works
1. Automatic Support & Resistance Detection
The indicator automatically scans for major swing highs and swing lows on your chart using a sensitivity parameter.
Every time a new swing high/low forms, a horizontal SNR line is drawn at that price level.
Both support and resistance lines automatically extend to the right of your chart, providing a persistent map of key levels for future entries and exits.
You can control how many recent zones are shown (max_snrs), keeping your chart clean and focused.
2. Smart Buy/Sell Signal Generation
Buy signals (“YB Buy”): Trigger when price touches or bounces off a support line, with trend/momentum/freshness filters:
Price is above the EMA50 (trend filter)
MACD is bullish (momentum)
RSI confirms no overbought
Sell signals (“YB Sell”): Trigger when price hits resistance, with strict confirmation:
Price is below EMA50
MACD is bearish
RSI not oversold
Both signals are shown as clear up/down triangle arrows directly on your chart.
3. Powerful Alerts
Never miss a trade: Real-time alerts fire as soon as a valid buy or sell condition appears.
Use with TradingView app, web, or SMS for 24/7 notification—no chart-watching needed.
4. Fully Customizable
Change sensitivity for tighter/looser SNR mapping.
Control the look and feel: colors for SNR, signals, number of zones, extension distance.
Works on any market: gold, forex, indices, crypto, stocks.
5. Clean Visuals, Zero Clutter
SNR lines are automatically managed—older zones are removed as new ones appear.
Only the latest/best buy/sell signals are shown, so you can act quickly and decisively.
Perfect For:
Scalpers, Day Traders, Swing Traders
Anyone who wants to trade using clean price action levels, NOT lagging indicators
Traders looking for rule-based, mechanical entries and exits
What Makes This Unique?
Precision: Uses swing structure, not arbitrary pivots or moving averages, for SNR.
Multi-Filter Entries: Combines trend, momentum, and overbought/oversold logic for high-probability signals.
Alerts & Automation: Built-in, with no need for manual chart watching.
Simple to Use: Add to any TradingView chart, adjust settings, and go.
Upgrade your trading with the YB Academy SNR!
Get alerted to the real opportunities—right at the key price zones, with all the discipline of a professional.
Liqudation HeatMap [BigBeluga]🔵 OVERVIEW
An advanced liquidity visualization tool that plots horizontal heat zones to highlight where potential liquidations and volume clusters are most likely hiding beneath price action.
Liqudation HeatMap scans historical price movements for local highs and lows with elevated volume or candle range. It then draws dynamic heatmap boxes—shaded from lime (low interest) to yellow (high interest)—revealing potential zones of trapped positions or stop clusters. A vertical scale on the right shows you the relative strength of volume behind each level, from 0 to the highest detected.
🔵 CONCEPTS
Maps areas of potential liquidity using volume or candle range (if volume is unavailable).
Identifies swing highs/lows (pivots) and extends heatmap boxes outward from these levels. Colors each zone based on the relative strength of volume concentration.
Fades or removes zones once price crosses their midpoints, simulating the idea of liquidity being “consumed.”
Displays a live vertical scale that shows the volume range for quick reference.
🔵 FEATURES
Dynamic Heatmap Zones:
Draws few boxes above and after pivot highs and below pivot lows, each shaded based on volume concentration.
Smart Coloring System:
Uses a gradient from lime (low) to yellow (high) to visually distinguish between weak and strong liquidity zones.
Adaptive ATR Widths:
Automatically adjusts zone thickness based on volatility (ATR), scaling intelligently across timeframes.
Liquidity Consumption Logic:
Zones are stope extending once price interacts with them—mimicking the behavior of real liquidation sweeps.
Volume Scale Legend:
A real-time scale is plotted on the right side, showing the min-max range of volume used for heat calculations.
🔵 HOW TO USE
Look for thick yellow zones to identify areas of concentrated stop losses or liquidation triggers.
Use these levels to anticipate mean reversion points or high-volatility zones.
Combine with your trend or structure tools to trade into or fade these liquidity pools.
On lower timeframes, use this tool to confirm entries around sweeps or deviations.
Use the right-side scale to compare relative zone strength instantly.
🔵 CONCLUSION
Liqudation HeatMap is a powerful visualization tool that uncovers where liquidity likely resides on the chart. By highlighting hidden traps and reactive levels in real-time, it gives traders a significant edge when it comes to spotting stop hunts, mean reversions, and areas of institutional interest. Whether you’re scalping or swing trading, this heatmap provides unmatched context on the market’s hidden intent.

ziksfx Structure - LiteInspired by the 'mentfx Structure' indicator created by Anton (mentfx) on TradingView, I have developed my own unique version of the market structure indicator, enhancing it with features that resonate with my personal trading style and offer additional insights into market behaviour.
In the spirit of Anton's original concept, my indicator incorporates the fundamental idea of "sells before buys" for bullish ranges and "buys before sells" for bearish ranges. This methodological approach is designed to mirror the activities of large market participants who typically offload positions before accumulating again in a bullish context, and accumulate before offloading in a bearish context.
The "ranges" displayed on the chart represent historical and updated highs and lows, reflecting the structural delivery of price across any timeframe. This approach assumes that in a bullish range, the market is likely to sustain upward momentum until it reaches a new high or experiences a significant "sell before buy" scenario, and conversely in a bearish range.
Key Enhancements and Features:
Immediate Break of Structure (BOS) Recognition: This feature promptly updates the high/low to the candle that triggers a BOS, providing a more agile response compared to the original mentfx Structure's approach of waiting for a swing high/low to set the range. This adaptation allows me for quicker adaptation to the market's unfolding narrative.
Market Stage Visualization: By seamlessly integrating with the structure tracking, my indicator presents the current 'Market Stage,' offering a clear stage of the current market's phase, which is crucial for informed trading decisions. The core methodology for determining market stages is derived from the foundational concepts established by mentfx.
Moving Average Integration: The inclusion of a Moving Average (MA) within the indicator adds a layer of trend confirmation, reinforcing decisions based on market structure with established trend analysis techniques. You can use EMA or SMA.
Customizable Session Settings: Tailor the indicator to focus on specific market hours, enhancing its utility for session-based trading strategies and backtesting efficiency.
Triple M: The Triple-M feature is also included in this indicator, which provides a visual representation of the market's momentum and potential reverse.
ATR: Utilizes the Average True Range (ATR) to estimate stop loss levels, providing a data-driven method to manage risk in accordance with current market volatility.
Watermark: Displays the name of the ticker and the current timeframe directly on the chart for easy reference, ensuring clarity and orientation when analyzing multiple instruments or timeframes.
How It Works:
When a range is assigned as being bullish, it will continue updating the high until a new high is created after the bos (= the new high of the range) and will not update or change until a candle's body, open's or close's above it - which will re-update the high and update the low. The low will be updated based on the last time price had a candle (open or closure) below a previous candle low, and then will find the lowest low after the rule was met to assign a low (the idea here is to locate the last major "sell before buy" and showcase that range. And this will occur vice versa, where: when a range is assigned as bearish, it will continue updating the low until a true low is created (=low of the range) and will not update or change until a candle's body, open's or close's below it - which will reupdate the low and update the high. The high will be updated based on the last time price had a candle (open or closure) above a previous candle high, and then will find the highest high after the rule was met to assign a high (once again, the idea being to locate the last major "buy before sell" and showcase price as existing in that range.)
A high is considered as a high that has a lower high to its left and to its right. And a low is considered as a low that has a higher low to its left and to its right. These high and low are used to determine the final high or low of a Bullish or Bearish range (respectively).
Range Determination: The indicator assesses the market momentum and assigns a Bullish or Bearish state based on the most recent directional break.
High/Low Rules Adaptation: In a Bullish range, indicator updates the high if a candle's body, not just the wick, exceeds the current high. This subtle yet significant change allows for a more conservative and potentially more accurate portrayal of bullish sentiment.
Dynamic Updating: As the market evolves, the indicator recalibrates the high and low lines based on the latest price movements, ensuring that you always have the most current and relevant data.
The indicator is not merely a trend-following or scalping tool. It leverages a distinct interpretation of market behavior, focusing on the last major "sell before buy" in Bullish ranges and "buy before sell" in Bearish ranges. By doing so, it aims to pinpoint the true sentiment behind price movements, offering traders a more grounded basis for anticipating market trends.
Of course, a special acknowledgment is due to Anton for his foundational work and the insightful knowledge he's giving day-by-day. The principles of his structure tracking method and market approach have significantly influenced the creation of this indicator, which now carries those insights forward, adapted through the lens of my personal trading philosophy.

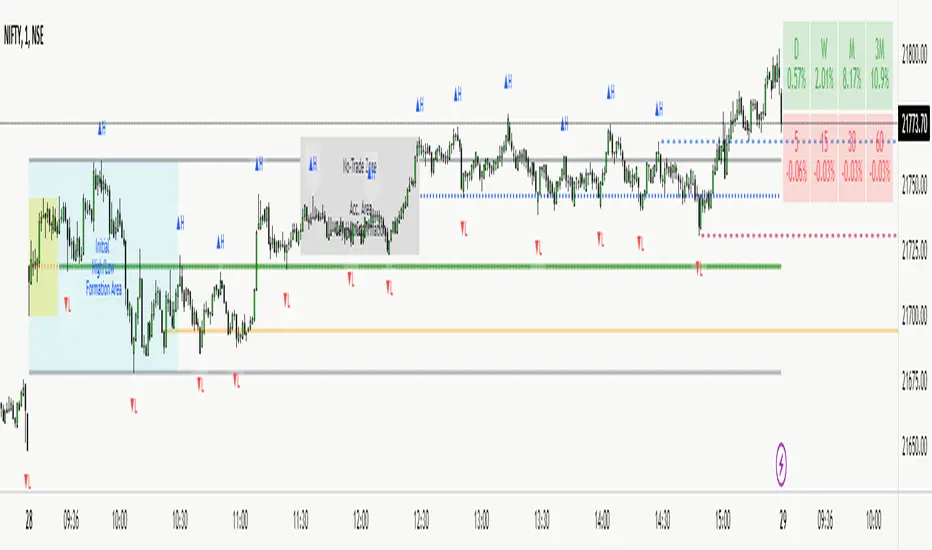
NITS - NIFTY INTRADAY TRADING SYSTEMNSE:NIFTY
Hello Traders..!
This is another indicator / system to make use for NIFTY & BANK NIFTY Intra day trading.
This is my Gift to the traders for this New Year 2024. Use this to your Edge and make some profits. All explained below.
NIFTY INTRA-DAY TRADING SYSTEM
Explanation of Arrays:
-------------------------------
## FIRST 15 MIN SESSION BOX ##
From 09:15 to 09:30 where the initial orders will get collected and Auction takes place.
DO NOT engage into any trade in this session. Let the Box develop.
## INITIAL HIGH / LOW FORMATION SESSION ##
This session is from 09:15 to 10:30.
We can observe the Initial High or Low being formed for the day, that is VALID TILL 11:30.
## NO-TRADE ZONE / ACC. AREA / DAY’S H OR L CONFIRMATION SESSION ##
From 11:30 to 12:30
90% of time this is the session where the whole Day’s High or Low will get confirmed. Sometimes the market may violate this Session!
DO NOT engage into any fresh trade in this area.
Once the box is developed, you can see the Mid price line will be formed which is valid for the afternoon Trading session till 15:30.
## SIGNAL LINE, MIDDLE PRICE LINE, SESSION HIGH LOW LINES ##
Middle Price Line – the dotted line (Red colour) is Mid Price Line for the Initial session box. This acts as an important price level for the whole day.
Signal Line – the Solid line that will form after 10:30. Consider this price line as very important price line to which the price reacts with a good momentum, either break through or rejection and valid for the whole trading day.
Session High Low price line – high and low prices of the Initial session box which acts as a good Support / Resistance / Target / Stop loss. Even previous session’s price lines can also be used for the current day too.
## TREND BOX ##
Multi-Time frame trend box will show the real-time trend on different time frames. This box will be very helpful in trade decision. Please note that at least THREE HIGHER TIME FRAME TRENDS must be in the same direction to support your trade criteria for the better confirmation.
## VOLUME IMBALANCE ##
These orange coloured boxes are very tiny imbalances between prices that were formed during price movements. Algorithm will try to fill these imbalances on its way of filling orders. These price imbalances can be used for our edge while taking trades.
SOME TIPS:
---------------------------
1) Avoid Break out trades
2) Always trade the pull backs
3) Keep your Stops above / below the KEY LEVELS
4) Always follow the Higher Time frame trend while taking a trade.
If you trade in 1m TF consider 5m trend
If you trade in 5m TF consider 1H or 15m trend
5) Consider the higher TF closure of prices only, to validate the break out.
6) Trade what you see, market can do anything it wants.
7) Do not worry about losses. It happens and that is the business.
8) End your trading week in green no matter how big or small the profit is. Consistency is the key this business.
9) Keep in mind that the Market does two things only, either it will FILL THE GAP or GRAB THE LIQUIDITY. Just plan your trades accordingly. Liquidity levels like Previous Session / Day / Week / highs and lows.
10) The Market is a continuous business. It does not end for the specific day. It will not end its Buy or Sell model unless it completes its cycle, hence TRADE WHAT YOU SEE and not WHAT YOU THINK!
11) Unless the key swing high / low is broken and closed, DO NOT consider that move as a reversal. Consider that as a Liquidity grab. And it will continue in its previous trend.
HOW TO TAKE TRADE USING NITS: (one of the Techniques)
--------------------------------------------------------------------------------
As explained above, Do not engage in trade for the first 15 minutes.
Once the 15m box forms then look for divergence between NIFTY and BANK NIFTY.
Both Indices are supposed to trade in the same direction but at key levels and times, these instruments will make DIVERGENCE with its Highs and Lows.
Ex: one Index will make LOW AND LOWER LOW and at the same time other will make LOW AND HIGHER LOW. This deflection can be used for taking Buy Trades.
Ex:
If the Divergence forms at the Bottom then the market will move upwards.
If the Divergence forms at the Top then the market makes down move.
To confirm this divergence, the price will move away from that deflected Lows or Highs.
-----------------------------------
POINTS TO OBSERVE
------------------------------------
Mostly the first 15 min range that forms will either be very large candles or normal candles with rejection wicks or Shaved bar (open and H/L same)
Whenever you observe a very large wide range bars within the 15min range, consider the Day’s high and Low is already formed. And the market will be hovering inside that range only. Very useful for taking 50 points scalping here and there by using the signal line and middle line or Acc box mid line. In this scenario you have three important info of the day, OPEN HIGH & LOW established already, The market will only look for its close.
Ex:
If the market trades with normal candles, then consider your trades in two parts.
From 09:30 to 11:30 and from 12:30 to 15:30 as 11:30 to 12:30 will confirm the current day’s High / Low hence do not take a fresh position within that time.
1) Initial session trade – If the price does not break and close the 15 min range high/low, consider it is going to reverse and continue its trend till 10:30
Ex:
2) Mid session Trade – mostly the market accumulates positions and collects orders between 11:30 to 12:30 for the afternoon session. Once the session box is developed, the middle price line will form. Wait for the market breakout and close off this session’s high or low in Higher TF. The market will continue in the direction of breakout from this session and continue till 15:30. Hence wait for pull back till its mid price / high or low price lines of this Acc box and take trade in the initial breakout direction keeping stop above or below the session’s high or low.
Ex:
## Fixed Range Volume Profile as a Tool ##
-----------------
Note:
-----------------
Kindly do not ask for any codes or script details. The one technique what I explained (Divergence method) is more than enough for making a consistent earnings. Please study and back test / forward test for yourself for atleast 2 weeks time. Every traders aspect and mindset is different in seeing the market movements. Please design your own methodology and CONSIDER this as a BUSINESS..!
JUST.....
Believe the System
Be patient
Be Disciplined &
Be a Successful Earner..!!
LET YOUR ENDS MEET
(Hope I explained well)
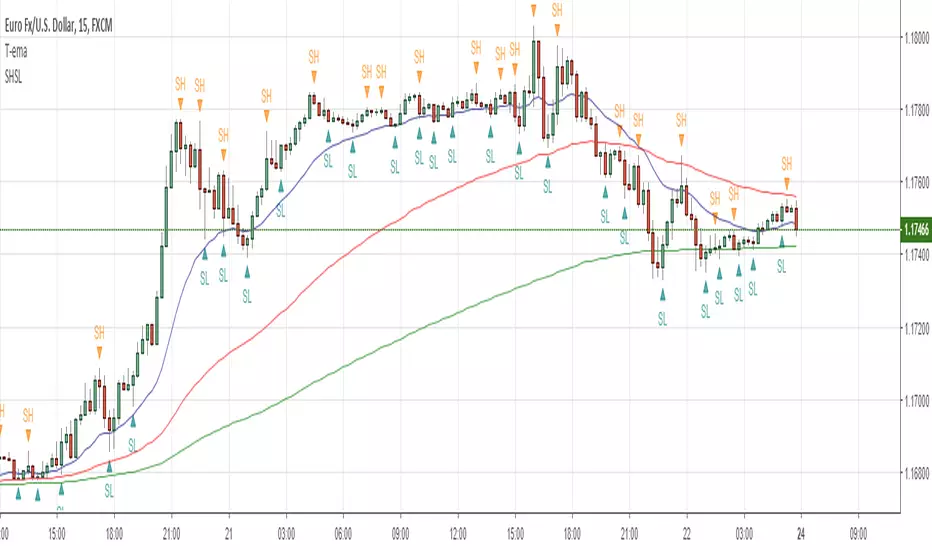
Swing Highs and LowsSimple script to overlay swing highs and lows.
A Swing High (SH): a price bar high preceded by two lower highs (LH) and followed by two lower highs (LH).
Quantura - Quantified Price Action StrategyIntroduction
“Quantura – Quantified Price Action Strategy” is an invite-only Pine Script strategy designed to combine multiple price action concepts into a single trading framework. It integrates supply and demand zones, liquidity sweeps and runs, fair value gaps (FVGs), RSI filters, and EMA trend confirmation. The strategy also provides a visual overlay with dynamic trend-colored candles for easier chart interpretation. It is intended for multi-market use across cryptocurrencies, Forex, equities, and indices.
Originality & Value
The strategy is original in how it unifies several institutional-style price action elements and validates trades only when they align. This reduces noise compared to using single indicators in isolation. Its unique value lies in the combination of:
Supply & Demand detection: Dynamic boxes identified through pivots, ATR, and volume sensitivity.
Liquidity sweeps and runs: Detects when swing highs/lows are broken and retested, distinguishing between liquidity grabs (sweeps) and directional runs.
RSI filter: Can be set to normal or aggressive, confirming momentum before trades.
Fair Value Gaps (FVGs): Optional detection and filtering of price inefficiencies.
EMA filter: Aligns trades with the broader market trend.
Trend candle visualization: Candles dynamically colored bullish, bearish, or neutral, based on strategy positions.
This layered confluence approach ensures that entries are not taken on a single condition but require agreement across several dimensions of market structure, momentum, and order flow.
Functionality & Indicators
Supply & Demand Zones: Zones are created when pivots, ATR sensitivity, and volume thresholds overlap.
Liquidity: Swing highs and lows are tracked, with options for sweep (fakeout/reversal) or run (continuation) detection.
RSI: Confirms long signals when oversold and shorts when overbought, with configurable aggressiveness.
FVG filter: Adds validation by requiring price interaction with inefficiency zones.
EMA filter: Ensures longs are above EMA and shorts below EMA.
Signals & Visualization: Trade entries are marked on the chart, while candles change color to reflect trade direction and status.
Parameters & Customization
Supply & Demand: Sensitivity (swing range, volume multiplier, ATR multiplier) and display options.
Liquidity filter: Mode (Run or Sweep), display, and swing length.
RSI: Enable/disable, length, and style (normal or aggressive).
Fair Value Gaps: Sensitivity via ATR factor, optional volume filter, and display toggles.
EMA: Length, enable/disable, and visualization.
Risk management: Up to three configurable take-profit levels, stop-loss, break-even logic, and capital-based position sizing.
Visualization: Custom candle coloring and optional overlay for better clarity.
Default Properties (Strategy Settings)
Initial Capital: 10,000 USD
Position Size: 100% of equity per trade (backtest default)
Commission: 0.1%
Slippage: 1
Pyramiding: 0 (only one position at a time)
Note: The default of 100% equity per trade is used for testing purposes only and would not be sustainable in real trading. A typical allocation in practice would be between 1–5% of account equity per trade, sometimes up to 10%.
Backtesting & Performance
Backtests on XPTUSD over 2.5 years with the default settings produced:
129 trades
73.64% win rate
Profit factor: 2.6
Maximum drawdown: 18.2%
These results show how the confluence of supply/demand, liquidity, and RSI filters can produce robust setups. However, past performance does not guarantee future results. While the trade count (129) is sufficient for statistical analysis, results may vary across markets and timeframes.
Risk Management
Three configurable take-profit levels with percentage allocation.
Initial stop-loss based on user-defined percentage.
Dynamic stop-loss that adjusts with market movement.
Break-even logic that shifts stops to entry after predefined gains.
Position sizing based on risk percentage of equity.
This framework allows both conservative and aggressive configurations, depending on user preference.
Limitations & Market Conditions
Works best in volatile and liquid markets such as crypto, metals, indices, and FX.
May produce false signals in low-volume or sideways environments.
Unexpected news or macro events can override technical conditions.
Default position sizing of 100% equity is highly aggressive and should be reduced before any practical use.
Usage Guide
Add “Quantura – Quantified Price Action Strategy” to your chart.
Select Supply & Demand, Liquidity, RSI, EMA, and FVG settings according to your market and timeframe.
Configure risk management: take-profits, stop-loss, and risk-per-trade percentage.
Use the Strategy Tester to analyze statistics, equity curve, and performance under different conditions.
Optimize parameters before applying the strategy to different markets.
Author & Access
Developed 100% by Quantura. Published as an Invite-Only script. Access is available upon request via the Author’s Instructions field.
Important
This description complies with TradingView’s publishing rules. It clarifies originality, explains the underlying logic, discloses default properties, and presents backtest results with realistic disclaimers.

Swing Failure Pattern (SFP) with AlertsSwing Failure Pattern (SFP) — Indicator Overview
Detects classic Swing Failure Patterns and their confirmations, with optional volume validation and EMA-based trend/reversal filters. Includes convenient alert categories.
1) What are SFPs?
Price briefly breaks a prior swing high/low (liquidity grab), fails to continue, and snaps back inside the range — often a potential reversal from trapped breakout participants.
2) What the indicator plots
SFP candle: wick extending beyond the previous swing (bearish above a swing high, bullish below a swing low).
Opposite/confirmation level: dotted level derived from the opposite side of the swing structure.
Confirmation: a later close beyond the opposite level; optional ▲/▼ triangles can appear with the “SFP” labels.
Two moving averages: fast/slow MAs for context (plot type selectable); style (color/width) set in the Style tab.
3) Volume validation (optional)
Uses a lower timeframe to compare the share of volume outside the swing level (wick area) against a threshold.
None: Use when volume data is questionable (CFDs/FX) or when you want maximum SFP visibility and rely on price confirmation only.
Volume outside swing < Threshold: Default for ranges/quiet phases. Idea: thin volume outside the level suggests a liquidity sweep rather than a true breakout. Start with 20–30%. Fewer but cleaner setups; works well near HTF zones (Daily/4H).
Volume outside swing > Threshold: For news/volatility/capitulation spikes. Idea: heavy pressure beyond the level was absorbed (long wick) — strong reversals possible but more false signals. Start with 50–60%. Always wait for price confirmation.
You can auto-select a lower timeframe or set one manually for the volume check.
4) EMA filter: Trend vs. Reversal
Filtering uses EMAs of the chosen fast/slow lengths (independent of the plotted MA type).
NO MA-Filter: no EMA condition; all SFPs allowed.
Reversal Signal: bullish SFP only if fast EMA < slow EMA ; bearish SFP only if fast EMA > slow EMA .
Trend Follow: bullish SFP only if fast EMA > slow EMA ; bearish SFP only if fast EMA < slow EMA .
Tip: MA colors/widths are controlled in the Style tab; the EMA filter logic isn’t affected by the plotted MA type.
5) Alerts
Multiple alert categories let you react to events like any bullish/bearish signal, SFP detected, and confirmation occurred — without listing each individual condition. Create an alert on the indicator and pick what fits your workflow.
Always trade without risk management.
Reminder: Backtest, align with HTF context and sessions, and use solid risk management.

Lanxang Pin Bar Pro V.2How to use (step-by-step)
Mark context first
Draw your Supply/Demand zones and note HTF structure (H1).
Use the indicator as a price action confirmation at those POIs.
Wait for a pin bar at a level
Bullish pin: long lower wick rejecting demand; Bearish pin: long upper wick rejecting supply.
Ensure it prints within your session and passes ATR/shape filters.
Choose your entry style
Conservative: Enter on break of pin high (bull) / low (bear).
Aggressive (RR-optimized): Place a limit near the 50% retrace of the pin bar (you removed lines, so measure the midpoint quickly: (High+Low)/2 from the data box).
Place stop
Beyond the wick + small buffer (e.g., 10–20 pts on XAUUSD M5–M15).
Keep SL reasonable (≤ ~1–1.2× ATR of your entry TF).
Targets & management
T1 = 1R, take partial, move to BE after structure break or at 1R depending on volatility.
T2 at the next opposing SD zone, prior swing, or session high/low.
Let a small runner trail via swing highs/lows if trend is strong.
Risk
Keep risk fixed % (e.g., 1%) per trade. Your math is already RR-driven—perfect for journaling and expectancy.
Recommended defaults (XAUUSD, M5–M30)
Min Wick : Body Ratio = 2.0–2.5
Max Body / Range = 0.30–0.35
Min Range as ATR multiple = 0.8–1.0
HTF = 60 min; EMAs = 50/200
Sessions = London core + NY open
Alerts
Turn on alerts for Bullish Pin Bar / Bearish Pin Bar (and optionally “Entry Trigger” if you use it).
Use them to route to your phone or EA bridge (you already use webhook flows).
Pro tips (fits your SMC style)
Prefer pins that sweep liquidity (wick pokes above equal highs / below equal lows) and close back inside your zone.
Extra confluence: FVG edge, HTF OB boundary, or daily/weekly high/low.
Skip mid-range pins with no level.
Track R results in your journal to monitor expectancy.

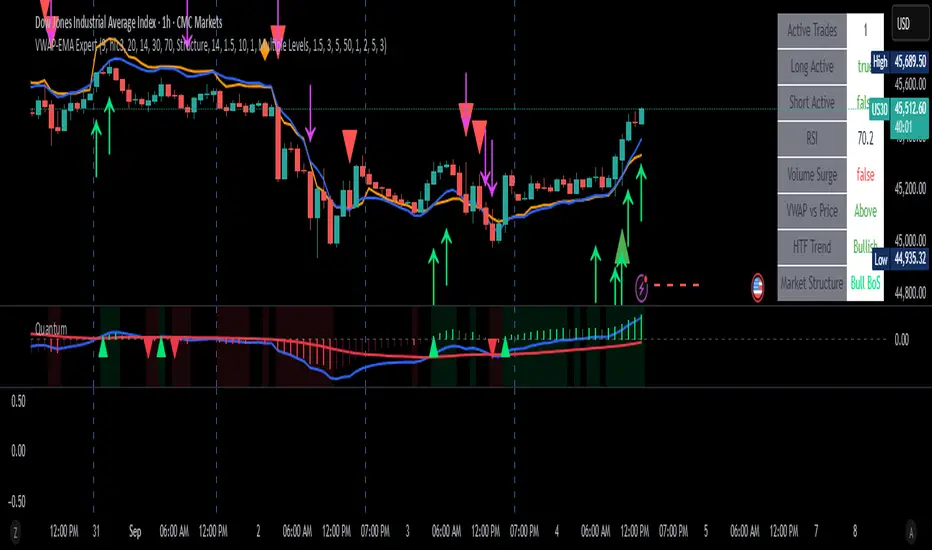
RUBY SYSTEM📋 Step 1: Setup & Installation
Add to TradingView:
Copy the entire Pine Script code from the artifact above
Open TradingView → Go to Pine Editor (bottom of screen)
Paste the code and click "Add to Chart"
Boom! Your chart now has institutional-level analysis
Customize Your Settings:
Click the ⚙️ gear icon on the indicator to adjust:
EMA Length: Keep at 9 (optimal for price action)
Stop Loss Method: Choose "Structure" (uses swing highs/lows)
Risk:Reward: TP1 at 1.5R, TP2 at 3R (customize as needed)
Volume Filter: Keep ON (avoids low-conviction moves)
🎯 Step 2: Reading the Visual Signals
What You'll See on Your Chart:
📊 Core Lines:
🟠 Orange Line: VWAP (institutional fair value)
🔵 Blue Line: EMA 9 (trend filter)
📦 Order Flow Boxes:
🟢 Green Boxes: Bullish Order Blocks (banks bought here)
🔴 Red Boxes: Bearish Order Blocks (institutions sold here)
📱 Green/Red FVG Boxes: Fair Value Gaps (price imbalances)
🎯 Entry Signals:
🟢 Green Triangle UP: Long entry signal
🔴 Red Triangle DOWN: Short entry signal
💎 Orange Diamonds: Liquidity sweeps (stop hunts)
⬆️ Lime Arrows: Bullish Break of Structure
⬇️ Purple Arrows: Bearish Break of Structure
📏 Trade Management Lines:
🔴 Red Dashed Line: Stop Loss level
🟢 Green Dashed Line: Take Profit level
🚀 Step 3: How to Trade
🔍 BEFORE Entering Any Trade:
Check the Dashboard (top-right corner):
HTF Trend: Only trade WITH the trend
Volume Surge: Want this to be TRUE
Market Structure: Look for BoS signals
📈 LONG ENTRY Checklist:
✅ Green triangle appears (entry signal)
✅ Price above VWAP (orange line)
✅ Price above EMA (blue line)
✅ HTF Trend shows "Bullish"
✅ Volume Surge = True
✅ Recent Break of Structure UP (↑)
📉 SHORT ENTRY Checklist:
✅ Red triangle appears (entry signal)
✅ Price below VWAP (orange line)
✅ Price below EMA (blue line)
✅ HTF Trend shows "Bearish"
✅ Volume Surge = True
✅ Recent Break of Structure DOWN (↓)
💰 Step 4: Trade Management
🛑 Stop Loss (Red Dashed Line):
Automatically calculated at recent swing high/low
NEVER move your stop against you
Only move to break-even after hitting first target
🎯 Take Profit (Green Dashed Line):
TP1: 1.5 Risk:Reward (take 50% profits)
TP2: 3.0 Risk:Reward (take remaining 50%)
Or hold until price closes opposite side of EMA
🚪 Exit Rules:
LONG: Exit when price closes BELOW EMA (blue line)
SHORT: Exit when price closes ABOVE EMA (blue line)
Or hit your stop loss
🏆 Step 5: Advanced Strategies
🎪 The "Liquidity Sweep" Setup:
Wait for orange diamond (liquidity sweep)
Look for immediate reversal back into structure
Enter when green/red triangle confirms
These are PREMIUM setups - highest win rate
📦 The "Order Block Retest":
Wait for price to hit a green/red box (order block)
Look for rejection from that zone
Enter when triangle signal appears
Institutions often defend these levels
🔄 The "VWAP Retest":
Price breaks VWAP with volume
Comes back to retest VWAP (orange line)
Gets support/resistance at VWAP
Enter on triangle signal confirmation
🚨 Step 6: Risk Management Rules
⚠️ NEVER Trade When:
Volume Surge = False (low conviction)
HTF Trend contradicts your direction
No Break of Structure signal
Market Structure shows "Ranging"
💡 Position Sizing:
Risk 1-2% per trade maximum
Use the stop loss line to calculate position size
Never risk more than you can afford to lose
📊 Best Timeframes:
5M-15M: Scalping (quick in/out)
1H-4H: Swing trading (hold longer)
Daily: Position trading
🎯 Quick Start Checklist:
✅ Add indicator to chart
✅ Wait for green/red triangle signal
✅ Check dashboard shows favorable conditions
✅ Confirm HTF trend alignment
✅ Enter trade at signal
✅ Set stop at red dashed line
✅ Take profits at green dashed line
✅ Exit if price closes opposite side of EMA
🚀 Pro Tips:
Be patient - wait for ALL confirmations
Quality over quantity - fewer high-probability trades win
Practice on paper before going live
Backtest on historical data to build confidence
Set up alerts so you don't miss signals
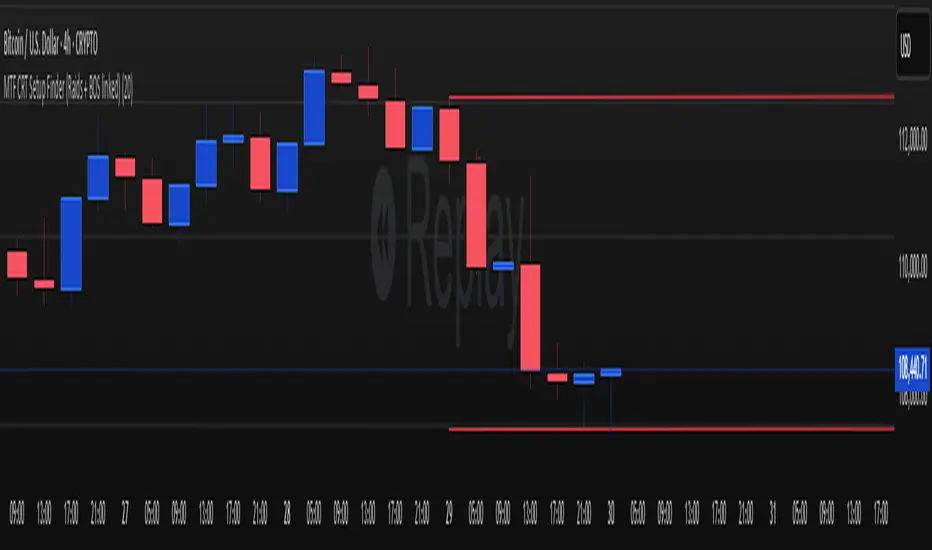
MTF CRT Setup Finder (Raids + BOS linked)//@version=6
indicator("MTF CRT Setup Finder (Raids + BOS linked)", overlay=true, max_lines_count=500)
// === INPUTS ===
lookback = input.int(5, "Swing Lookback Bars", minval=2)
// === Function: Detect swing highs/lows ===
swingHigh(src, lb) => ta.pivothigh(src, lb, lb)
swingLow(src, lb) => ta.pivotlow(src, lb, lb)
// === Function: Detect CRT with memory ===
f_crt(tf) =>
hi = request.security(syminfo.tickerid, tf, high)
lo = request.security(syminfo.tickerid, tf, low)
cl = request.security(syminfo.tickerid, tf, close)
sh = request.security(syminfo.tickerid, tf, swingHigh(high, lookback))
sl = request.security(syminfo.tickerid, tf, swingLow(low, lookback))
raidHigh = not na(sh) and hi > sh and cl < sh
raidLow = not na(sl) and lo < sl and cl > sl
// store last raid state
var bool hadRaidHigh = false
var bool hadRaidLow = false
if raidHigh
hadRaidHigh := true
if raidLow
hadRaidLow := true
bosDown = hadRaidHigh and cl < sl
bosUp = hadRaidLow and cl > sh
// reset after BOS
if bosDown
hadRaidHigh := false
if bosUp
hadRaidLow := false
// === Apply on H1 only first (test) ===
= f_crt("60")
// === Plot ===
plotshape(raidHigh, title="Raid High", style=shape.diamond, color=color.red, size=size.small, text="Raid High")
plotshape(raidLow, title="Raid Low", style=shape.diamond, color=color.green, size=size.small, text="Raid Low")
plotshape(bosDown, title="Bearish CRT", style=shape.triangledown, color=color.red, size=size.large, text="CRT↓")
plotshape(bosUp, title="Bullish CRT", style=shape.triangleup, color=color.green, size=size.large, text="CRT↑")
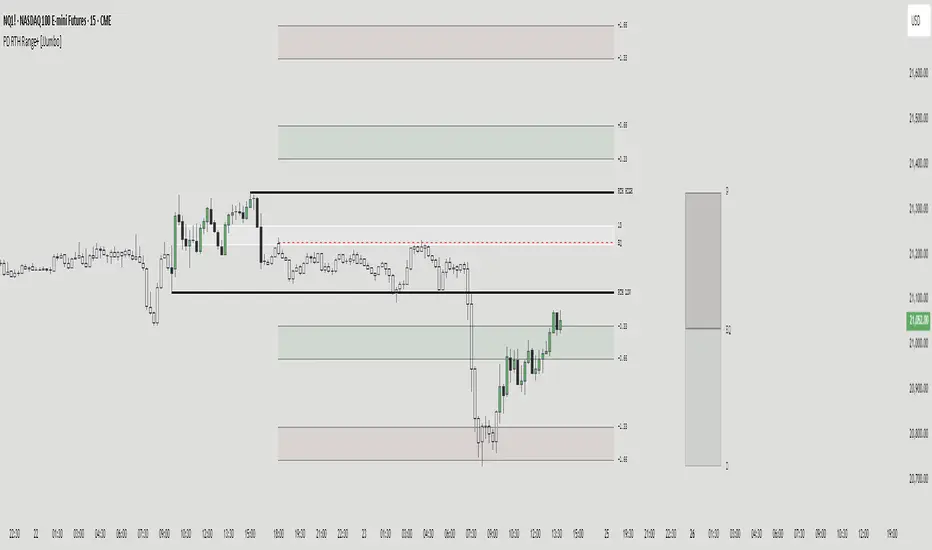
PD RTH Range+ [JJumbo]Introduction:
The PD RTH Range+ indicator is a powerful tool designed to visualize and track previous day and previous day's Regular Trading Hours (RTH) ranges for futures markets. This indicator identifies and plots automatically key price levels established during standard US trading hours (9:30 AM - 4:15 PM ET "RTH") and Globex hours, helping traders identify important key levels and fair value zones.
Just like my other time based range indicator "SDRange+" it works around the same idea but with a different context and different ranges in use, range deviations are still a big part in this framework.
Key features:
Range functions and plot modes:
This tool is equipped with two modes "RTH" range and "Previous day" range, which help you visualize previous day's points of interest and swing high and low essentially helping you framing the current day's daily candle in relation to previous day ranges both RTH and previous day.
Projections feature:
The projection feature in the tool also has two plot modes "Fixed" and "Custom", the Fixed mode projections make use of the rule of thirds (just like the SDRange+) but with two areas 0.33-0.66 and 1.33-1.66, here is where most deviations happen and price exhausts above/below the range.
These are your actionable areas to expect price lose momentum and retrace back into the range.
Dynamic Premium&Discount visualization:
This feature will allow you to identify fair value and equilibrium at current price dynamically updating until out projections or levels have been met and and swing high/low has formed, helping you identify the equilibrium of the market at the current state and where premium or discounted prices are.
Automatic First presentation Fair Value Gap:
A concept idea originated from The Inner Circle Trader (ICT), the feature in the indicator will automatically plot the first presented fair value gap (first FVG present of Regular trading hours) dynamically changing time-frame as well, showing the first presented FVG in any time frame you are visualizing.
This can be used as you area of action as well or targets (during RTH hours).
ETH (Eletronic Trading Hours) candles transparency:
This feature is important for define ETH and RTH hours, removing the color out of the the ETH hours candles helping visualize better the RTH hours, which is where you want base your trading day on.
Customizable inputs:
Fully customizable aesthetics in the input menu
How can traders use this framework and tool effectively in their trading:
Trading range sequences:
This framework is based on IF-THEN statements sequences, it will generate your daily bias by following the sequences.
Sequences: EQ > high/low, high/low > EQ,EQ > fixed projections, fixed projections >EQ.
When following these sequences, you will easily find you daily direction, which are also data-backed by statistics (you can see about it in my X profile, you will find the link in my Trading View profile)
Trading retracements/reversals:
Retracements are often taken from the projections areas until Equilibrium of the dynamic premium and discount feature in the indicator, often participating in the moves to fair value from the deviation of the range.
Reversals are often taken from the projections areas until opposing levels of the range (EQ or high/low)
Terms & Conditions
Our charting tools are products provided for informational and educational purposes only and do not constitute financial, investment, or trading advice. Our charting tools are not designed to predict market movements or provide specific recommendations. Users should be aware that past performance is not indicative of future results and should not be relied upon for making financial decisions. By using our charting tools, the purchaser agrees that the seller and the creator are not responsible for any decisions made based on the information provided by these charting tools. The purchaser assumes full responsibility and liability for any actions taken and the consequences thereof, including any loss of money or investments that may occur as a result of using these products. Hence, by purchasing these charting tools, the customer accepts and acknowledges that the seller and the creator are not liable nor responsible for any unwanted outcome that arises from the development, the sale, or the use of these products. We hold no reimbursement, refund, or chargeback policy. Once these Terms and Conditions are accepted by the Customer, before purchase, no reimbursements, refunds or chargebacks will be provided under any circumstances.
By continuing to use these charting tools, the user acknowledges and agrees to the Terms and Conditions outlined in this legal disclaimer.
EURUSD Kill Zone [Plazo Sullivan Roche Capital]EUR/USD Kil Zone
Core Logic: Navigating the New‑York Kill‑Zone
The EUR/USD Killzone is designed to exploit repeatable patterns that occur during the overlap of the London and New‑York trading sessions. Research shows that the New‑York “kill zone”—roughly 07:00–09:00 EST—produces the most dramatic moves in EUR‑ and USD‑linked currency pairs
During this window, large institutions often sweep out liquidity resting above or below the Asian and early‑London session extremes , triggering sharp reversals before a new intraday trend emerges. This is in contrast to the single pre-market sweeps occuring for GOLD/
This modeul uses ICT/Smart Money Concepts to read these patterns and waits for three confirmations before signalling a trade:
Liquidity Sweep & Rejection. Price must spike beyond the combined Asian and early‑London range and then reject that area (a sharp wick and opposite‑coloured candle), signalling that stops have been cleared. The module defines the Asian range from 00:00–05:00 EST and the London range from 02:00–05:00 EST, following the guideline that overlapping sessions produce the greatest volatility
Market Structure Break. It then waits for the 5‑minute price to close beyond the most recent swing high/low (pivot), confirming that a genuine shift in order flow has occurred rather than a simple stop‑run.
Fair‑Value‑Gap (FVG) Re‑Test. Upon the break, the script records the high and low of that 5‑minute “displacement” candle and defines a fair‑value gap—the imbalance between buyers and sellers. Rather than entering immediately, it sets a virtual limit order at the 50 % level of this gap. A trade is only triggered once price retraces to this mid‑point, providing a high‑probability, high‑reward entry.
These three filters help avoid common pitfalls when trading kill zones, such as false breakouts and news‑driven whipsaws. The indicator also monitors higher‑timeframe bias (4‑hour and daily charts) using 50‑ and 200‑period moving averages to gauge whether the intraday signal aligns with the broader trend.
Feature Set
The indicator provides a suite of visual and analytical tools to support disciplined trading:
Session Range Mapping: automatically draws the Asian (00:00–05:00 EST) and London (02:00–05:00 EST) session highs and lows, making it easy to see when price sweeps these levels.
Kill‑Zone Monitoring: a built‑in timer isolates the 07:30–09:00 EST window and limits the indicator to one trade per session to avoid over‑trading.
Pivot‑Break Detection: uses 5‑minute swing highs/lows to confirm that order flow has shifted before looking for entries.
Fair‑Value‑Gap Re‑test: defines an FVG from the displacement candle and waits for a 50 % retrace before triggering a signal. This improves risk‑to‑reward by entering at a discount (for longs) or premium (for shorts).
Higher‑Timeframe Dashboard: displays bullish/bearish/neutral biases on the 4‑hour and daily charts, plus a confidence rating (0–2) indicating how many of these timeframes agree with the signal direction.
Alerts: optional alerts can be configured for buy‑only, sell‑only or either‑direction signals.
Best Practices for Use
Align with Major Volatility Windows. The indicator is most effective during the New‑York kill zone. Avoid trading outside this window, and be aware of high‑impact news (e.g., FOMC announcements) that can distort price action
Check Higher‑Timeframe Bias. Use the dashboard to ensure the intraday signal aligns with the 4‑hour and daily trends. For instance, a long signal that aligns with a bullish daily bias carries higher conviction than one going against it.
Manage Risk Responsibly. Even with multiple filters, no strategy is foolproof. Use stop‑loss orders just beyond the liquidity sweep and size positions appropriately.
Combine with Fundamental Awareness. Check your economic calendar for European and U.S. data releases. If an important release occurs during the kill zone, consider standing aside or reducing risk.
Back‑test and Forward‑Test. Always validate the strategy across different market conditions and broker feeds. Pay attention to how spreads, volatility and news events influence the indicator.
Use as Part of a Toolkit. Consider combining the indicator with other confirmation tools such as momentum oscillators, volume analysis or price‑action patterns to refine entries further. Smart‑Money Concepts often use confluence, not a single signal.
What's in It for You?
The EUR/USD Liquidity Sweep Indicator distils institutional concepts—liquidity hunts, market‑structure shifts and fair‑value gaps—into an intuitive, automated tool. By waiting for a retrace into the displacement candle’s imbalance, it helps capture trades where risk‑to‑reward is skewed strongly in your favour. The dashboard encourages you to trade with the higher‑timeframe trend, and built‑in alerts ensure you never miss an opportunity.
In volatile kill‑zone environments, discipline and patience are vital. This indicator enforces both: it tracks session ranges, confirms structure, waits for a retrace, and triggers only when multiple conditions align. Coupled with sound risk management and your own judgement, it can become a cornerstone of a high‑probability trading plan.
Always remember that markets evolve. Continue to refine the indicator and your strategy as you gather more experience and data. The learning journey never ends, but this tool is designed to accelerate it.

ACE FVG & IFVG Trading System1. What the Script Does
The "ACE FVG & IFVG Trading System " is a TradingView Pine Script (version 5) that identifies and trades Fair Value Gaps (FVGs) and Inverse Fair Value Gaps (IFVGs). It offers:
Detection of bullish/bearish FVGs and IFVGs with customizable parameters.
Multiple entry types: regular FVG retracement, Break of Structure (BOS), breakaway gaps, and Immediate/Retrace IFVG entries.
A pending setup system showing potential trades before they trigger.
Risk management with configurable stop loss (SL) and take profit (TP) based on FVG levels, swing points, or risk-reward ratios.
Market structure analysis using swing highs/lows, BOS, and Market Structure Shifts (MSS).
Time filters to restrict trading to specific sessions.
Visualizations including FVG boxes, trade boxes, pivot lines, and labels.
Entry and performance tables displaying trade details and metrics like win rates and P&L by entry type.
2. How It Works
The script is organized into modular sections for efficient execution:
Inputs: Extensive customization options (e.g., FVG size, entry types, SL/TP modes, time filters) grouped for clarity.
Data Structures: Custom types (FVGData, SwingPoint, EntryData) store FVG, pivot, and trade data in arrays.
Utility Functions: Handle calculations like risk-reward ratios, time validation, and trade size filtering.
Swing Point Detection: Uses ta.pivothigh/ta.pivotlow to identify pivots, supporting BOS/MSS and SL/TP calculations.
FVG Detection: Identifies regular FVGs (low > high or high < low ) and IFVGs (mitigated FVGs with immediate or retrace signals).
Entry Logic: Triggers trades based on user-enabled conditions (e.g., retracement, BOS, breakaway gaps) with dynamic SL/TP.
Trade Management: Tracks active/pending trades, updates visualizations (boxes, lines, labels), and handles cancellations/invalidations.
Main Logic: Executes on each bar to detect FVGs, process entries, update trades, and manage visualizations.
Tables: Displays recent trades and performance stats (e.g., win rates by entry type) on the last bar.
Pivot Visualization: Plots swing points with dynamic extensions and mitigation status (solid/dotted lines).
3. How to Use It
Add to TradingView:
Open Pine Editor, paste the script, save it, and add to chart.
Configure Inputs:
Access settings via chart (right-click indicator > Settings).
Adjust:
fvgMinSize for market volatility (e.g., 5 for forex).
Entry types (e.g., enable IFVG, disable breakaway gaps).
SL/TP modes and minimum R:R (e.g., 2.0 for 1:2).
Time filters for active sessions (e.g., 09:30-16:00).
Visual settings (box transparency, table positions).
Interpret Output:
FVG Boxes: Green (bullish), red (bearish), purple (IFVG/mitigated).
Trade Boxes: Gray-green/red-gray (pending), green/red (active), updated for win/loss.
Pivot Lines: Solid (unmitigated), dotted (mitigated).
Tables: Entry table shows trade details; performance table shows win rates/P&L.
Trading:
Monitor pending setups for entry signals.
Enter manually at active trade levels, following SL/TP.
Use performance stats to refine settings.
Test on demo charts and adjust for market/timeframe.
Best Practices:
Use higher timeframes (e.g., 1H, 4H) for less noise.
Combine with other analysis (e.g., support/resistance).
Backtest using TradingView’s replay feature.
Originality
The script is original due to its unique combination of features:
Enhanced IFVG Strategy: Dual Immediate/Retrace IFVG modes with a novel “Immediate Then Retrace” preference.
Pending Setup System: Proactive visualization of potential trades with auto-cancellation.
Granular Performance Tracking: Detailed breakdown of win rates/P&L by entry type (regular FVG, IFVG, breakaway).
Dynamic Pivot Visualization: Real-time mitigation updates (solid to dotted lines).
Modular Design: Custom types and organized logic for extensibility. It builds on general FVG concepts (e.g., from ICT) but implements unique logic and features not found in standard
TradingView FVG scripts, distinguishing it from both open-source and premium indicators.
Credit of Concepts to ICT
Collaborations with JMAC and Timeless

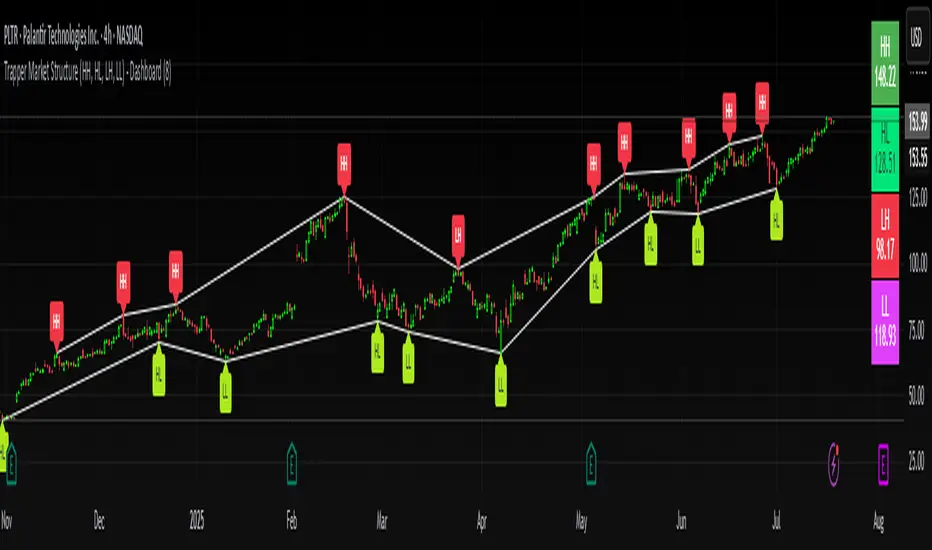
Trapper Market Structure (HH, HL, LH, LL)This script is designed to visually identify price action market structure in real time using pivot-based logic. It highlights the key components of trend direction by labeling:
- **HH** – Higher Highs
- **HL** – Higher Lows
- **LH** – Lower Highs
- **LL** – Lower Lows
These labels help traders track evolving market conditions and spot trend continuations, breaks in structure, or potential reversals — all without guessing.
**How It Works**
The script detects local swing highs and lows based on a customizable pivot strength. Once a valid pivot is confirmed, it’s classified in context with the previous relevant pivot to determine its structural significance.
For example:
- If a pivot high is higher than the previous, it’s marked as a **HH**.
- If a pivot low is lower than the previous, it’s marked as a **LL**, and so on.
This running analysis helps traders anticipate shifts between bullish and bearish structures.
**Customizable Features**
- Adjust **Pivot Strength** to increase or reduce sensitivity (more reactive or more stable)
- Toggle **Labels** on/off for cleaner charts
- Toggle **Connecting Lines** between pivots to visualize structure flow
**Use Case**
This indicator is ideal for:
- Price action traders
- Market structure analysis
- Identifying entry zones during pullbacks (e.g., buying at HLs during uptrends)
- Confirming trend reversals or break-of-structure (BoS)
You can use this tool as a foundation for more advanced systems such as CHoCH/BOS detection, liquidity zones, or sniper-style entry frameworks.
**Concepts Used**
- Swing High/Low detection using `ta.pivothigh` and `ta.pivotlow`
- Market structure labeling logic
- Visual flow to reinforce trader psychology on trend states
Disclaimer
This script is provided for educational purposes only. It is not financial advice and should not be relied upon for trading decisions. Always conduct your own analysis and risk management.
#marketstructure #priceaction #technicalanalysis #tradingviewopen #pivotpoints
Market Structure- ZigZag, Break of Structure & Order BlocksDescription:
This script is an all-in-one market structure tool designed for traders who follow price action, Smart Money Concepts (SMC), or institutional order flow. It combines Order Block detection , Break of Structure (BOS) , Internal Structure Shifts (CHoCH) , and a ZigZag swing framework to provide a clear and actionable view of market behavior.
Key Features:
Order Blocks (OB) :
-Detects Bullish (Green) and Bearish (Red) order blocks upon valid market structure shifts.
-Optional deletion of mitigated (touched) blocks to keep charts clean.
-Customizable block duration, fill color, and border color.
Break of Structure (BOS) :
-Marks BOS with horizontal dotted lines when price breaks previous swing highs/lows.
-Confirms new trends and structural shifts.
Internal Structure Shifts (CHoCH-like) :
-Detects early internal changes in direction before BOS.
-User-selectable logic: based on candle Open or High/Low.
-Plotted as small black triangle markers.
ZigZag Swings :
-Connects confirmed internal shifts with black zigzag lines.
-Visually simplifies trend structure and major swing points.
-Tracks last swing highs/lows for BOS validation.
Alerts :
-Bullish/Bearish Engulfments (OB signals)
-Internal Structure Shifts
-Bullish/Bearish Break of Structure
-OB Mitigation Events
Inputs & Settings :
-Show/Hide Bullish or Bearish Order Blocks
-Calculate internal shifts by: Open or High/Low
-Set order block fill and border colors
-Enable or disable automatic deletion of mitigated blocks
-Set duration for order block display
This tool is designed to support price action trading by visually mapping key structural changes and zones of interest directly on your chart. It is not intended to function as a standalone trading strategy , but rather as a supplementary tool to inform your own analysis and discretion.

SMT Divergences By RootkitHow It Works:
Heikin Ashi Smoothing
Instead of using raw OHLC price data, the script applies Heikin Ashi smoothing to reduce noise and better identify pivot highs and lows.
Pivot Detection
It looks for local swing highs and lows using a user-defined lookback period (Pivot Lookback). These are used to detect potential divergences.
SMT Divergence Logic
An SMT divergence is identified when:
A pivot low occurs on the main chart.
But one or more of the comparison symbols makes a higher low instead (or lower high for bearish SMT).
This signals a disagreement between instruments, often attributed to smart money accumulation or distribution.
Trend Filter
To reduce false signals, the script only allows:
Buy signals during an uptrend
Sell signals during a downtrend
The trend is determined by comparing Heikin Ashi highs/lows to previous bars.
Signal Markers
BUY labels appear below bars at valid bullish SMT divergences.
SELL labels appear above bars at valid bearish SMT divergences.
Optional trend lines visually connect the last significant pivot to the current one.
⚙️ Inputs:
Pivot Lookback – Number of bars for swing high/low detection.
Symbol A/B/C – Up to 3 comparison symbols (futures, indices, etc.).
Toggle Each Symbol – Enable or disable any comparison ticker.
Custom Colors – Choose your own line colors for buy/sell signals.
🧠 Why It Matters:
SMT divergence is used by professional traders to spot early signs of accumulation/distribution, often before price reverses. This script helps you detect these signals automatically while keeping them filtered by overall market trend.

Rawstocks 15 Minute ModelRawstocks 15-Minute Model
The Rawstocks 15-Minute Model is a precision intraday trading strategy designed for the US stock market (9:30 AM - 4:00 PM ET), optimized for the 15-minute timeframe. It combines institutional order flow concepts with Fibonacci retracements to identify high-probability reversal setups while enforcing strict risk management and session-based rules.
Key Features
Time-Based Execution
Trading Hours: 9:30 AM - 4:00 PM ET (no new entries after 4:00 PM)
Force Close: All positions auto-exit at 4:30 PM ET (prevents overnight risk)
Entry Logic
Order Block + Fib Confluence:
Identifies institutional order blocks (previous swing highs/lows)
Requires price pullback to 61.8% or 79% Fibonacci level
Liquidity Confirmation:
Waits for stop runs (liquidity sweeps) before reversal entries
Exit Rules
Stop Loss: 1x ATR (14) from entry
Take Profit: 2:1 Risk-Reward (adjustable)
Visual Signals
Green Triangle: Valid long setup (pullback to bullish OB + Fib)
Red Triangle: Valid short setup (pullback to bearish OB + Fib)
Blue/Purple Background: Highlights active trading vs. close period
How It Works
Identify the Setup
Wait for a strong impulse move (break of structure)
Mark the order block (institutional zone)
Confirm Pullback
Price must retrace to 61.8% or 79% Fib level
Must occur within trading hours (9:30 AM - 4:00 PM)
Enter on Confirmation
Long: Break of pullback candle high (stop below recent swing low)
Short: Break of pullback candle low (stop above recent swing high)
Manage the Trade
Trail stop or exit at 2R (risk-to-reward)
All positions close at 4:30 PM sharp

Four-Color Order Flow System Four-Color Order Flow System – Smart Money Liquidity Tracking
Revolutionizing Market Structure with a Four-Color Candle System
Traditional candlestick charts lack real-time liquidity visibility, forcing traders to rely on lagging indicators. The Four-Color Order Flow System solves this by integrating Order Blocks (OBs), Accumulation/Distribution (AD), Swing High/Low (SH/SL), and Delta metrics directly into the candle structure. This mashup of volume, price action, and liquidity flow gives traders an intuitive and immediate read on market conditions.
📌 Key Features & How They Work Together
🔹 Four-Color Candles – A Visual Edge Over Traditional Charts
Instead of basic red/green candles, we introduce a four-color system to highlight key liquidity shifts:
• 🔴 Red – Bearish pressure, aggressive sellers dominating.
• 🟢 Green – Bullish pressure, buyers stepping in.
• 🔵 Blue – Swing Highs (SH), Bullish Order Blocks (OBs), Accumulation zones.
• 🟡 Yellow – Swing Lows (SL), areas of liquidity sweep or potential reversal.
This eliminates the need to switch between multiple indicators—price structure, liquidity zones, and order flow are embedded directly into the chart.
🔹 EMA Logic – The Trend Foundation
The EMA acts as the core trend filter, dynamically adjusting to market bias. When combined with delta and liquidity flow, it helps traders confirm whether price action aligns with smart money movements.
🔹 Order Flow & Liquidity Mashup – What’s Really Moving the Market?
📊 Rolling Delta & Cumulative Delta – Track aggressive buyers/sellers and confirm if momentum is sustained or fading.
💰 Liquidity Flow & Shift – Shows whether market makers are accumulating or distributing, helping traders avoid fake breakouts.
📈 Money Flow Index & Value – Measures real institutional participation vs. retail noise.
These elements combine to validate price moves, making it clear when smart money is truly in control.
🔹 Swing Highs & Lows – Market Structure in Real-Time
SH/SL markers don’t lag behind multiple candles like in traditional indicators. Instead, they align with OBs and liquidity flow, giving a strong confirmation of trend continuation or reversal.
🔹 Live Label Update – Real-Time Market Intelligence
The dynamic label box provides a live feed of critical metrics, including:
✅ EMA Bias – Confirms market direction.
✅ Rolling & Cumulative Delta – Tracks aggressive buy/sell imbalances.
✅ Liquidity Flow & Money Flow Index – Confirms institutional strength.
✅ FVG Execution Scanning (Coming Soon!)
This ensures traders have instant insight into market conditions without needing to check multiple sources.
📈 Why Traders Need This System
🔹 Faster Decision-Making – No need to flip between indicators; everything is visible on the chart.
🔹 Clearer Liquidity Insights – Order flow, delta, and structure all in sync.
🔹 Works for Scalping & Day Trading – Designed for real-time execution, not lagging signals.
By integrating order blocks, liquidity shifts, and a four-color candle system, this tool provides the most complete view of market control in a single chart.
📌 Stop reacting. Start anticipating. Trade with the flow of smart money.

Fibonacci Ranges (Real-Time) [LuxAlgo]The "Fibonacci Ranges" indicator combines Fibonacci ratio-derived ranges (channels), together with a Fibonacci pattern of the latest swing high/low.
🔶 USAGE
The indicator draws real-time ranges based on Fibonacci ratios as well as retracements. Breakouts from a Fibonacci Channel are also indicated by labels, indicating a potential reversal.
Each range extremity/area can also be used as support/resistance.
🔶 CONCEPTS
Fibonacci Channels
Latest Fibonacci
Both, Latest Fibonacci and Fibonacci Channels , display different Fibonacci levels (labels not included in the code):
However, the 2 react in a totally different way.
🔹 Fibonacci Channels
2 conditions must be fulfilled until a Fibonacci Channel is displayed:
New swing high/low
close has to be between chosen limits/levels ( Break level )
As visual guidance, chosen Break levels are accentuated by 2 small gray blocks:
Once the channel is displayed, it will remain visible until x consecutive bars break out of the chosen Break level at closing time.
• x consecutive bars is set by Break count .
The amount of breaks is counted in the code. When the price, without breaking the user-set limit, closes back between the 2 levels, the count is reset to 0.
By enabling Channels and Shadows you can see previous channels (" Shadows ", which is always delayed with 1 bar)
Previous channels can be helpful in finding potential support/resistance areas, especially from large channel blocks
The more narrow Break levels are set the less chance the price closes between these 2 levels, and the quicker close breaks out.
In other words, narrow levels give fewer & smaller channels, broader levels give more & larger channels.
Note:
• swing settings: L & R
• Break count (x consecutive bars that close outside chosen levels to invalidate the Fibonacci Channel )
will also be of influence in displaying the channels.
• Show breaks enable you to visualize signals when there is a break:
• Alerts can also be set ( Break Down / Break Up )
🔹 Latest Fibonacci
This displays the Fibonacci levels between the latest swing high and swing low, independently from the Fibonacci Channel .
The Lastest Fibonacci can be helpful in detecting the current trend against the larger Fibonacci Channel .
🔶 SETTINGS
🔹 Swing Settings
L: set left of pivothigh / pivotlow
R: set right of pivothigh / pivotlow
🔹 Fibonacci Channels
Channel : Channel / Channels + Shadows / None
Break level
-0.382 - 1.382
0.000 - 1.000
0.236 - 0.764
0.382 - 0.618
Break count
🔹 Fibonacci
Toggle
Colours: [ -0.382 - 0 ], [ 0.236 - 0.382 ], [ 0.5 ], [ 0.618 - 0.764 ], [ 1 - 1.382 ]

Order-Flow Market StructureOrder-Flow Market Structure by The_Forex_Steward
A precision tool for visualizing internal shifts, swing structure, BOS events, Fibonacci levels, and multi-timeframe alerts.
What It Does
The Order-Flow Market Structure indicator intelligently tracks and visualizes price structure using higher timeframe candles. It automatically detects:
• Internal bullish and bearish structure shifts
• Swing highs and lows (HH, HL, LH, LL)
• Break of Structure (BoS) confirmations
• Fibonacci retracement levels from recent swing moves
• Real-time alerts across LTF, MTF, and HTF modes
It’s a complete tool for traders who follow Smart Money Concepts, ICT, or institutional price action strategies.
How It Works
• You select a Higher Timeframe (HTF) to set the structural context
• Internal shifts are identified using HTF candle closes
• The indicator scans for swing highs/lows after each internal shift
• Breaks of previous swing points confirm BoS and plot horizontal lines
• Zigzag lines visually connect structural points (swings and BoS)
• Fibonacci levels are drawn between the latest swings
• Alerts can be configured for structure shifts, BoS events, and fib level breaks
How to Use It
Set your preferred HTF (e.g., 1H while trading on 5-minute)
Enable Fibonacci levels to visualize retracement zones
Watch for:
• Bullish internal shifts → HL to HH
• Bearish internal shifts → LH to LL
• BOS → Breakout confirmation
Enable alerts to catch structural events in real-time
Adjust the "Safe History Offset" if working with long lookbacks or volatile assets
Who It's For
• Traders using Smart Money, ICT, or market structure-based systems
• Scalpers, day traders, and swing traders
• Anyone needing precise structural insight across multiple timeframes
Features
• BoS detection with custom line styles and width
• HH, HL, LH, LL label plotting
• Optional Fibonacci retracement zones
• Custom alerts for swing shifts and fib level breaks
• LTF, MTF, and HTF alert modes
Stay aligned with structure, trade with precision, and get alerted to key shifts in real time.

DR-SK A B C SK A B C - Target and Stop Loss Indicator for Trading
The "SK A B C" script is an advanced technical analysis tool designed to identify price targets and stop loss levels based on three input points (A, B, C) on the chart. The script calculates four potential targets (E, N, V, NT) based on the movement between the points, allowing for customization to suit different trading strategies. It also supports various stop loss methods, including Fixed Percentage, ATR-Based, and Swing High/Low.
Key Features:
Target Calculation (E, N, V, NT): The script calculates and displays potential targets (E, N, V, NT) based on the price movement between the input points (A, B, C).
Stop Loss Options:
Fixed Stop Loss: Based on a percentage of the price.
ATR-Based Stop Loss: Uses the Average True Range (ATR) for calculating the stop loss level.
Swing High/Low Stop Loss: Based on the most recent swing high or low.
Display Targets with Labels: Displays targets clearly on the chart, with options for price labels and boxes around the targets.
Full Customization: Customize colors, lines, and labels to fit your personal preferences.
Real-Time Alerts: Set up alerts to notify you when the price hits a target or stop loss level.
Summary Results Display: A table that shows the targets along with their prices and percentage distance from the current price.
How to Use the Script:
Set Input Points: Select three points (A, B, C) on the chart. The script will calculate the targets based on these points.
Choose Stop Loss Method: Select your preferred stop loss method (Fixed, ATR-Based, Swing High/Low).
Customize the Display: Customize the chart’s appearance by adjusting colors and other options.
Set Alerts: Enable alerts to be notified when the price reaches the targets or stop loss levels.
Notes:
The script follows basic technical analysis principles and helps traders accurately determine potential price targets using input points.
It provides flexibility through customizable stop loss methods and target options, making it a versatile and user-friendly tool.

CM EMA Crossover Price Probabilities customCM EMA Crossover Price Probabilities
This indicator combines Exponential Moving Average (EMA) crossovers with swing high/low detection to calculate and display the historical probability of price movements exceeding user-defined percentage thresholds. Unlike standard EMA crossover indicators, it quantifies the likelihood of specific price changes following bullish (fast EMA crossing above slow EMA) or bearish (fast EMA crossing below slow EMA) crossovers, providing traders with data-driven insights into potential price behavior.
How It Works:EMA Crossovers: Detects when the fast EMA crosses above (bullish) or below (bearish) the slow EMA, marking these events with chart labels.
Price Change Measurement: Measures the percentage price change from the crossover point to the next swing high (for bullish crossovers) or swing low (for bearish crossovers), using pivot point detection.
Probability Calculation: Analyses historical crossover data to compute the probability of price changes meeting or exceeding customizable percentage thresholds (e.g., 2.5%, 5%). Probabilities are displayed as labels on the last bar, showing both bullish and bearish outcomes.
Customization: Allows users to adjust EMA lengths, pivot lookback, historical data limit, and probability thresholds via inputs.
Inputs:Fast EMA Length (default: 20): Period for the fast EMA.
Slow EMA Length (default: 50): Period for the slow EMA.
Pivot Lookback (default: 15): Bars used to detect swing highs/lows.
Max Historical Crossovers (default: 100): Limits stored crossovers for performance.
Bin Thresholds (defaults: 2.5%, 4.6%, 8.4%, 21.0%, 100.0%): Five customizable percentage thresholds for probability calculations.
Usage:
Add the indicator to your chart and adjust inputs to match your trading style. Bullish and bearish crossover points are labeled on the chart, and probability labels appear in the top-right corner when sufficient data is available. Use these probabilities to assess the historical likelihood of price movements after EMA crossovers, aiding in trade planning or risk assessment.
Why It’s Useful:
By combining EMA crossovers with swing-based price change analysis, this indicator offers a unique perspective on market behaviour post-crossover. The customizable probability thresholds allow traders to focus on specific price movement targets, making it a versatile tool for studying trend strength and potential outcomes.
Notes:
Probabilities are based on historical data and do not predict future performance.
Set bin thresholds in ascending order for accurate probability calculations.
Designed for educational purposes to analyze EMA crossover patterns.