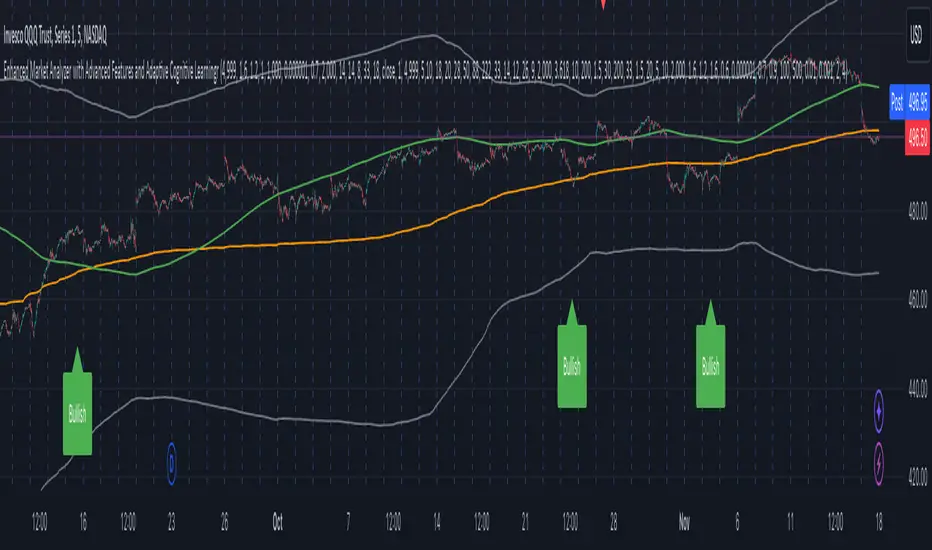
Enhanced Market Analyzer with Adaptive Cognitive LearningThe "Enhanced Market Analyzer with Advanced Features and Adaptive Cognitive Learning" is an advanced, multi-dimensional trading indicator that leverages sophisticated algorithms to analyze market trends and generate predictive trading signals. This indicator is designed to merge traditional technical analysis with modern machine learning techniques, incorporating features such as adaptive learning, Monte Carlo simulations, and probabilistic modeling. It is ideal for traders who seek deeper market insights, adaptive strategies, and reliable buy/sell signals.
Key Features:
Adaptive Cognitive Learning:
Utilizes Monte Carlo simulations, reinforcement learning, and memory feedback to adapt to changing market conditions.
Adjusts the weighting and learning rate of signals dynamically to optimize predictions based on historical and real-time data.
Hybrid Technical Indicators:
Custom RSI Calculation: An RSI that adapts its length based on recursive learning and error adjustments, making it responsive to varying market conditions.
VIDYA with CMO Smoothing: An advanced moving average that incorporates Chander Momentum Oscillator for adaptive smoothing.
Hamming Windowed VWMA: A volume-weighted moving average that applies a Hamming window for smoother calculations.
FRAMA: A fractal adaptive moving average that responds dynamically to price movements.
Advanced Statistical Analysis:
Skewness and Kurtosis: Provides insights into the distribution and potential risk of market trends.
Z-Score Calculations: Identifies extreme market conditions and adjusts trading thresholds dynamically.
Probabilistic Monte Carlo Simulation:
Runs thousands of simulations to assess potential price movements based on momentum, volatility, and volume factors.
Integrates the results into a probabilistic signal that informs trading decisions.
Feature Extraction:
Calculates a variety of market metrics, including price change, momentum, volatility, volume change, and ATR.
Normalizes and adapts these features for use in machine learning algorithms, enhancing signal accuracy.
Ensemble Learning:
Combines signals from different technical indicators, such as RSI, MACD, Bollinger Bands, Stochastic Oscillator, and statistical features.
Weights each signal based on cumulative performance and learning feedback to create a robust ensemble signal.
Recursive Memory and Feedback:
Stores and averages past RSI calculations in a memory array to provide historical context and improve future predictions.
Adaptive memory factor adjusts the influence of past data based on current market conditions.
Multi-Factor Dynamic Length Calculation:
Determines the length of moving averages based on volume, volatility, momentum, and rate of change (ROC).
Adapts to various market conditions, ensuring that the indicator is responsive to both high and low volatility environments.
Adaptive Learning Rate:
The learning rate can be adjusted based on market volatility, allowing the system to adapt its speed of learning and sensitivity to changes.
Enhances the system's ability to react to different market regimes.
Monte Carlo Simulation Engine:
Simulates thousands of random outcomes to model potential future price movements.
Weights and aggregates these simulations to produce a final probabilistic signal, providing a comprehensive risk assessment.
RSI with Dynamic Adjustments:
The initial RSI length is adjusted recursively based on calculated errors between true RSI and predicted RSI.
The adaptive RSI calculation ensures that the indicator remains effective across various market phases.
Hybrid Moving Averages:
Short-Term and Long-Term Averages: Combines FRAMA, VIDYA, and Hamming VWMA with specific weights for a unique hybrid moving average.
Weighted Gradient: Applies a color gradient to indicate trend strength and direction, improving visual clarity.
Signal Generation:
Generates buy and sell signals based on the ensemble model and multi-factor analysis.
Uses percentile-based thresholds to determine overbought and oversold conditions, factoring in historical data for context.
Optional settings to enable adaptation to volume and volatility, ensuring the indicator remains effective under different market conditions.
Monte Carlo and Learning Parameters:
Users can customize the number of Monte Carlo simulations, learning rate, memory factor, and reward decay for tailored performance.
Applications:
Scalping and Day Trading:
The fast response of the adaptive RSI and ensemble learning model makes this indicator suitable for short-term trading strategies.
Swing Trading:
The combination of long-term moving averages and probabilistic models provides reliable signals for medium-term trends.
Volatility Analysis:
The ATR, Bollinger Bands, and adaptive moving averages offer insights into market volatility, helping traders adjust their strategies accordingly.
Cari dalam skrip untuk "swing trading"
Price Movement Predictor (PMP)The Price Movement Predictor (PMP) is a versatile trading indicator designed to assist traders in identifying potential buy and sell opportunities in the market. This indicator utilizes a combination of technical analysis tools to generate signals based on the relative strength index (RSI) and moving averages, ensuring a robust and strategic approach to trading.
Key Features:
RSI-Based Signal Generation:
The indicator monitors the RSI to identify overbought and oversold conditions in the market.
A buy signal is generated when the RSI drops below a predefined oversold threshold, indicating potential upward price movement.
Conversely, a sell signal is triggered when the RSI exceeds a specified overbought level, suggesting a possible price decline.
Moving Average Confirmation:
The indicator employs two moving averages: a short-term and a long-term moving average.
Buy and sell signals are confirmed only after a crossover event occurs, ensuring that trades are entered in alignment with market trends.
The short moving average crossing above the long moving average confirms a buy signal, while a crossover below confirms a sell signal.
Take Profit and Stop Loss Management:
The PMP includes adjustable take profit and stop loss levels, which are automatically calculated based on user-defined percentages.
Labels indicating the take profit (TP) and stop loss (SL) levels are plotted on the chart, helping traders manage their risk effectively.
Alerts are available for both TP and SL conditions, allowing traders to stay informed about their trade outcomes.
User-Friendly Interface:
The indicator provides an intuitive setup with adjustable parameters for moving average lengths, RSI levels, and TP/SL ratios.
Clear buy and sell signals are displayed directly on the chart, making it easy for traders to act on potential opportunities.
Usage:
The Price Movement Predictor is ideal for traders who seek a systematic approach to identify trading opportunities and manage risk. By combining RSI signals with moving average crossovers, the indicator helps filter out false signals and enhances the accuracy of trade entries. It is suitable for various trading styles, including day trading, swing trading, and long-term investing.

Stoch RSI and RSI Buy/Sell Signals with MACD Trend FilterDescription of the Indicator
This Pine Script is designed to provide traders with buy and sell signals based on the combination of Stochastic RSI, RSI, and MACD indicators, enhanced by the confirmation of candle colors. The primary goal is to facilitate informed trading decisions in various market conditions by utilizing different indicators and their interactions. The script allows customization of various parameters, providing flexibility for traders to adapt it to their specific trading styles.
Usefulness
This indicator is not just a mashup of existing indicators; it integrates the functionality of multiple momentum and trend-detection methods into a cohesive trading tool. The combination of Stochastic RSI, RSI, and MACD offers a well-rounded approach to analyzing market conditions, allowing traders to identify entry and exit points effectively. The inclusion of color-coded signals (strong vs. weak) further enhances its utility by providing visual cues about the strength of the signals.
How to Use This Indicator
Input Settings: Adjust the parameters for the Stochastic RSI, RSI, and MACD to fit your trading style. Set the overbought/oversold levels according to your risk tolerance.
Signal Colors:
Strong Buy Signal: Indicated by a green label and confirmed by a green candle (close > open).
Weak Buy Signal: Indicated by a blue label and confirmed by a green candle (close > open).
Strong Sell Signal: Indicated by a red label and confirmed by a red candle (close < open).
Weak Sell Signal: Indicated by an orange label and confirmed by a red candle (close < open).
Example Trading Strategy Using This Indicator
To effectively use this indicator as part of your trading strategy, follow these detailed steps:
Setup:
Timeframe : Select a timeframe that aligns with your trading style (e.g., 15-minute for intraday, 1-hour for swing trading, or daily for longer-term positions).
Indicator Settings : Customize the Stochastic RSI, RSI, and MACD parameters to suit your trading approach. Adjust overbought/oversold levels to match your risk tolerance.
Strategy:
1. Strong Buy Entry Criteria :
Wait for a strong buy signal (green label) when the RSI is at or below the oversold level (e.g., ≤ 35), indicating a deeply oversold market. Confirm that the MACD shows a decreasing trend (bearish momentum weakening) to validate a potential reversal. Ensure the current candle is green (close > open) if candle color confirmation is enabled.
Example Use : On a 1-hour chart, if the RSI drops below 35, MACD shows three consecutive bars of decreasing negative momentum, and a green candle forms, enter a buy position. This setup signals a robust entry with strong momentum backing it.
2. Weak Buy Entry Criteria :
Monitor for weak buy signals (blue label) when RSI is above the oversold level but still below the neutral (e.g., between 36 and 50). This indicates a market recovering from an oversold state but not fully reversing yet. These signals can be used for early entries with additional confirmations, such as support levels or higher timeframe trends.
Example Use : On the same 1-hour chart, if RSI is at 45, the MACD shows momentum stabilizing (not necessarily negative), and a green candle appears, consider a partial or cautious entry. Use this as an early warning for a potential bullish move, especially when higher timeframe indicators align.
3. Strong Sell Entry Criteria :
Look for a strong sell signal (red label) when RSI is at or above the overbought level (e.g., ≥ 65), signaling a strong overbought condition. The MACD should show three consecutive bars of increasing positive momentum to indicate that the bullish trend is weakening. Ensure the current candle is red (close < open) if candle color confirmation is enabled.
Example Use : If RSI reaches 70, MACD shows increasing momentum that starts to level off, and a red candle forms on a 1-hour chart, initiate a short position with a stop loss set above recent resistance. This is a high-confidence signal for potential price reversal or pullback.
4. Weak Sell Entry Criteria :
Use weak sell signals (orange label) when RSI is between the neutral and overbought levels (e.g., between 50 and 64). These can indicate potential short opportunities that might not yet be fully mature but are worth monitoring. Look for other confirmations like resistance levels or trendline touches to strengthen the signal.
Example Use : If RSI reads 60 on a 1-hour chart, and the MACD shows slight positive momentum with signs of slowing down, place a cautious sell position or scale out of existing long positions. This setup allows you to prepare for a possible downtrend.
Trade Management:
Stop Loss : For buy trades, place stop losses below recent swing lows. For sell trades, set stops above recent swing highs to manage risk effectively.
Take Profit : Target nearby resistance or support levels, apply risk-to-reward ratios (e.g., 1:2), or use trailing stops to lock in profits as price moves in your favor.
Confirmation : Align these signals with broader trends on higher timeframes. For example, if you receive a weak buy signal on a 15-minute chart, check the 1-hour or daily chart to ensure the overall trend is not bearish.
Real-World Example: Imagine trading on a 15-minute chart :
For a buy:
A strong buy signal (green) appears when the RSI dips to 32, MACD shows declining bearish momentum, and a green candle forms. Enter a buy position with a stop loss below the most recent support level.
Alternatively, a weak buy signal (blue) appears when RSI is at 47. Use this as a signal to start monitoring the market closely or enter a smaller position if other indicators (like support and volume analysis) align.
For a sell:
A strong sell signal (red) with RSI at 72 and a red candle signals to short with conviction. Place your stop loss just above the last peak.
A weak sell signal (orange) with RSI at 62 might prompt caution but can still be acted on if confirmed by declining volume or touching a resistance level.
These strategies show how to blend both strong and weak signals into your trading for more nuanced decision-making.
Technical Analysis of the Code
1. Stochastic RSI Calculation:
The script calculates the Stochastic RSI (stochRsiK) using the RSI as input and smooths it with a moving average (stochRsiD).
Code Explanation : ta.stoch(rsi, rsi, rsi, stochLength) computes the Stochastic RSI, and ta.sma(stochRsiK, stochSmoothing) applies smoothing.
2. RSI Calculation :
The RSI is computed over a user-defined period and checks for overbought or oversold conditions.
Code Explanation : rsi = ta.rsi(close, rsiLength) calculates RSI values.
3. MACD Trend Filter :
MACD is calculated with fast, slow, and signal lengths, identifying trends via three consecutive bars moving in the same direction.
Code Explanation : = ta.macd(close, macdLengthFast, macdLengthSlow, macdSignalLength) sets MACD values. Conditions like macdLine < macdLine confirm trends.
4. Buy and Sell Conditions :
The script checks Stochastic RSI, RSI, and MACD values to set buy/sell flags. Candle color filters further confirm valid entries.
Code Explanation : buyConditionMet and sellConditionMet logically check all conditions and toggles (enableStochCondition, enableRSICondition, etc.).
5. Signal Flags and Confirmation :
Flags track when conditions are met and ensure signals only appear on appropriate candle colors.
Code Explanation : Conditional blocks (if statements) update buyFlag and sellFlag.
6. Labels and Alerts :
The indicator plots "BUY" or "SELL" labels with the RSI value when signals trigger and sets alerts through alertcondition().
Code Explanation : label.new() displays the signal, color-coded for strength based on RSI.
NOTE : All strategies can be enabled or disabled in the settings, allowing traders to customize the indicator to their preferences and trading styles.

Forex Relative Strength MatrixTraders often feel uncertain about which Forex pair to open a position with. This indicator is designed to help in that regard.
This indicator was created as described in the book Swing Trading with Heiken Ashi and Stochastics. In the original, the author suggests using it for swing trading. The author recommends applying it to a monthly chart with an 8-period moving average to analyze the context.
The logic of the indicator is to measure the relative strength of each currency by checking if the price of each Forex pair is above or below a chosen moving average. If the price is above the moving average, the base currency is awarded 1 point, indicating strength. If below, it scores 0, indicating weakness. By accumulating points across multiple pairs, the indicator ranks currencies from strongest to weakest, helping traders identify potential pairs for trading.
Trend Identification:
After identifying relative strength, the trader should observe the general trend using a 100-period SMA on 4-hour charts. If the price is above the SMA, the trend is bullish; if below, it is bearish.
Buy Logic:
A buy is triggered when the base currency is strong (price is above the moving average) and the quote currency is weak (price is below the moving average). After identifying the trend direction, the entry is confirmed by a color change in Heiken Ashi candles (from red to green in an uptrend) and a stochastic crossover in the trend’s direction.
Sell Logic:
A sell is triggered when the base currency is weak (price is below the moving average) and the quote currency is strong (price is above the moving average). The sell entry is confirmed by a color change in Heiken Ashi candles (from green to red in a downtrend) and a stochastic crossover aligned with the trend.
Entry Chart:
The entry chart used is the 4-hour chart. The trader should look for entry signals following a pullback in the trend direction, using Heiken Ashi candles. Entry is made when the Heiken Ashi candles change color (from red to green in an uptrend) and there is a smooth crossover of the stochastic indicator in the trend’s direction.
It would also be possible to adapt the indicator for day trading strategies with targets of 1 to 2 days. Here is a recommended setup:
Relative Strength Identification (1-Hour Chart):
Instead of monthly charts, use a 1-hour chart to identify currency strength with a 20-period moving average.
The 20-period moving average on the 1-hour chart captures a balanced view of short- to medium-term direction, covering nearly a day’s worth of trading but with enough sensitivity for day trading.
General Trend (5-Minute Chart with 100 SMA):
On the 5-minute chart, observe the 100-period SMA to identify the general trend direction throughout the day.
Price above the 100 SMA indicates an uptrend, and below indicates a downtrend, confirming the movement in shorter timeframes.
Entry Chart and Signals (5-Minute Chart):
Use the 15-minute chart to look for entry opportunities, focusing on pullbacks in the main trend direction.
Entry Signals: Enter the position when Heiken Ashi candles change color in the trend direction (from red to green in an uptrend) and the stochastic indicator makes a smooth crossover in the trend’s direction.

J Lines EMA + VWAPThe EMA + VWAP indicator combines the power of Exponential Moving Averages (EMA) with the Volume Weighted Average Price (VWAP) to help traders spot trends, identify potential entries/exits, and understand market momentum with ease. This dual-purpose tool is designed to give both beginner and experienced traders a clear view of price direction and volume influence, whether for day trading or swing trading.
Key Features:
Dynamic EMA Lines:
Six customizable moving averages (EMA by default) adapt to your selected timeframe. EMAs help track trend direction and strength, with various colors and opacity settings that visually separate them for clarity.
VWAP Tracking: A standalone VWAP line (blue) shows the average trading price adjusted for volume, making it ideal for pinpointing significant price levels where institutional interest often lies.
EMA Ribbons for Trend Confirmation: Soft-colored ribbons are placed between EMA pairs to make the trend strength visually apparent, with different color fills between lines. This makes it easy to gauge bullish or bearish conditions at a glance.
Flexible MA Options: Besides EMA, you can choose from SMA, WMA, HMA, and RMA, allowing you to adapt the indicator to various trading strategies.
This tool simplifies trend-following and volume-based analysis by giving you insight into both price momentum and market participation levels. EMAs adapt to volatility and changing market conditions, while the VWAP keeps you aware of critical price zones based on trading volume. Together, these help you stay on the right side of the market, avoid false breakouts, and make informed decisions on when to enter or exit trades.
Ideal for beginners due to its visual clarity and flexible enough for seasoned traders, EMA + VWAP is your go-to indicator for a structured approach to market trends.

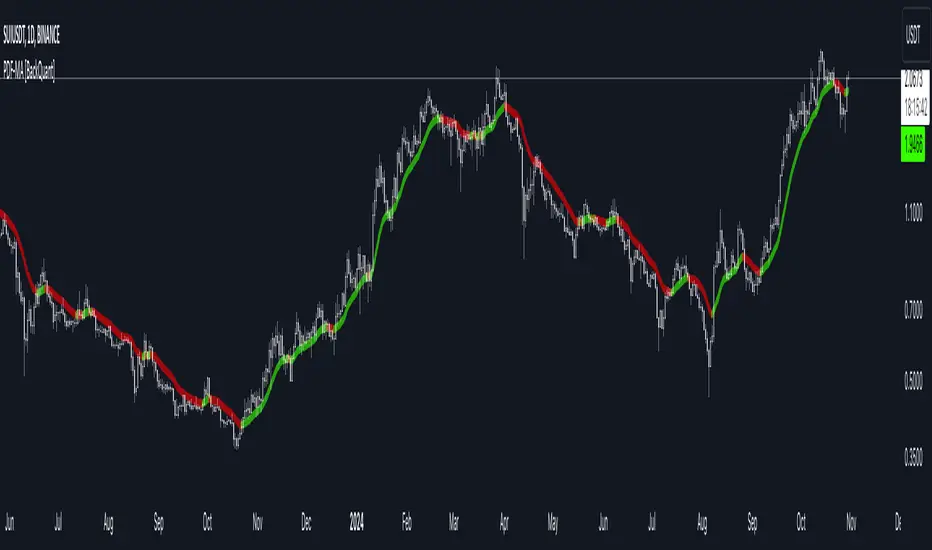
PDF Smoothed Moving Average [BackQuant]PDF Smoothed Moving Average
Introducing BackQuant’s PDF Smoothed Moving Average (PDF-MA) — an innovative trading indicator that applies Probability Density Function (PDF) weighting to moving averages, creating a unique, trend-following tool that offers adaptive smoothing to price movements. This advanced indicator gives traders an edge by blending PDF-weighted values with conventional moving averages, helping to capture trend shifts with enhanced clarity.
Core Concept: Probability Density Function (PDF) Smoothing
The Probability Density Function (PDF) provides a mathematical approach to applying adaptive weighting to data points based on a specified variance and mean. In the PDF-MA indicator, the PDF function is used to weight price data, adding a layer of probabilistic smoothing that enhances the detection of trend strength while reducing noise.
The PDF weights are controlled by two key parameters:
Variance: Determines the spread of the weights, where higher values spread out the weighting effect, providing broader smoothing.
Mean : Centers the weights around a particular price value, influencing the trend’s directionality and sensitivity.
These PDF weights are applied to each price point over the chosen period, creating an adaptive and smooth moving average that more closely reflects the underlying price trend.
Blending PDF with Standard Moving Averages
To further improve the PDF-MA, this indicator combines the PDF-weighted average with a traditional moving average, selected by the user as either an Exponential Moving Average (EMA) or Simple Moving Average (SMA). This blended approach leverages the strengths of each method: the responsiveness of PDF smoothing and the robustness of conventional moving averages.
Smoothing Method: Traders can choose between EMA and SMA for the additional moving average layer. The EMA is more responsive to recent prices, while the SMA provides a consistent average across the selected period.
Smoothing Period: Controls the length of the lookback period, affecting how sensitive the average is to price changes.
The result is a PDF-MA that provides a reliable trend line, reflecting both the PDF weighting and traditional moving average values, ideal for use in trend-following and momentum-based strategies.
Trend Detection and Candle Coloring
The PDF-MA includes a built-in trend detection feature that dynamically colors candles based on the direction of the smoothed moving average:
Uptrend: When the PDF-MA value is increasing, the trend is considered bullish, and candles are colored green, indicating potential buying conditions.
Downtrend: When the PDF-MA value is decreasing, the trend is considered bearish, and candles are colored red, signaling potential selling or shorting conditions.
These color-coded candles provide a quick visual reference for the trend direction, helping traders make real-time decisions based on the current market trend.
Customization and Visualization Options
This indicator offers a range of customization options, allowing traders to tailor it to their specific preferences and trading environment:
Price Source : Choose the price data for calculation, with options like close, open, high, low, or HLC3.
Variance and Mean : Fine-tune the PDF weighting parameters to control the indicator’s sensitivity and responsiveness to price data.
Smoothing Method : Select either EMA or SMA to customize the conventional moving average layer used in conjunction with the PDF.
Smoothing Period : Set the lookback period for the moving average, with a longer period providing more stability and a shorter period offering greater sensitivity.
Candle Coloring : Enable or disable candle coloring based on trend direction, providing additional clarity in identifying bullish and bearish phases.
Trading Applications
The PDF Smoothed Moving Average can be applied across various trading strategies and timeframes:
Trend Following : By smoothing price data with PDF weighting, this indicator helps traders identify long-term trends while filtering out short-term noise.
Reversal Trading : The PDF-MA’s trend coloring feature can help pinpoint potential reversal points by showing shifts in the trend direction, allowing traders to enter or exit positions at optimal moments.
Swing Trading : The PDF-MA provides a clear trend line that swing traders can use to capture intermediate price moves, following the trend direction until it shifts.
Final Thoughts
The PDF Smoothed Moving Average is a highly adaptable indicator that combines probabilistic smoothing with traditional moving averages, providing a nuanced view of market trends. By integrating PDF-based weighting with the flexibility of EMA or SMA smoothing, this indicator offers traders an advanced tool for trend analysis that adapts to changing market conditions with reduced lag and increased accuracy.
Whether you’re trading trends, reversals, or swings, the PDF-MA offers valuable insights into the direction and strength of price movements, making it a versatile addition to any trading strategy.
Multi-Average Trend Indicator (MATI)[FibonacciFlux]Multi-Average Trend Indicator (MATI)
Overview
The Multi-Average Trend Indicator (MATI) is a versatile technical analysis tool designed for traders who aim to enhance their market insights and streamline their decision-making processes across various timeframes. By integrating multiple advanced moving averages, this indicator serves as a robust framework for identifying market trends, making it suitable for different trading styles—from scalping to swing trading.
MATI 4-hourly support/resistance
MATI 1-hourly support/resistance
MATI 15 minutes support/resistance
MATI 1 minutes support/resistance
Key Features
1. Diverse Moving Averages
- COVWMA (Coefficient of Variation Weighted Moving Average) :
- Provides insights into price volatility, helping traders identify the strength of trends in fast-moving markets, particularly useful for 1-minute scalping .
- DEMA (Double Exponential Moving Average) :
- Minimizes lag and quickly responds to price changes, making it ideal for capturing short-term price movements during volatile trading sessions .
- EMA (Exponential Moving Average) :
- Focuses on recent price action to indicate the prevailing trend, vital for day traders looking to enter positions based on current momentum.
- KAMA (Kaufman's Adaptive Moving Average) :
- Adapts to market volatility, smoothing out price action and reducing false signals, which is crucial for 4-hour day trading strategies.
- SMA (Simple Moving Average) :
- Provides a foundational view of the market trend, useful for swing traders looking at overall price direction over longer periods.
- VIDYA (Variable Index Dynamic Average) :
- Adjusts based on market conditions, offering a dynamic perspective that can help traders capture emerging trends.
2. Combined Moving Average
- The MATI's combined moving average synthesizes all individual moving averages into a single line, providing a clear and concise summary of market direction. This feature is especially useful for identifying trend continuations or reversals across various timeframes .
3. Dynamic Color Coding
- Each moving average is visually represented with color coding:
- Green indicates bullish conditions, while Red suggests bearish trends.
- This visual feedback allows traders to quickly assess market sentiment, facilitating faster decision-making.
4. Signal Generation and Alerts
- The indicator generates buy signals when the combined moving average crosses above its previous value, indicating a potential upward trend—ideal for quick entries in scalping.
- Conversely, sell signals are triggered when the combined moving average crosses below its previous value, useful for exiting positions or entering short trades.
Insights and Applications
1. Scalping on 1-Minute Charts
- The MATI excels in fast-paced environments, allowing scalpers to identify quick entry and exit points based on short-term trends. With dynamic signals and alerts, traders can react swiftly to price movements, maximizing profit potential in brief price fluctuations.
2. Day Trading on 4-Hour Charts
- For day traders, the MATI provides essential insights into intraday trends. By analyzing the combined moving average and its relation to individual moving averages, traders can make informed decisions on when to enter or exit positions, capitalizing on daily price swings.
3. Swing Trading on Daily Charts
- The MATI also serves as a valuable tool for swing traders. By evaluating longer-term trends through the combined moving average, traders can identify potential swing points and adjust their strategies accordingly. The flexibility of adjusting the lengths of the moving averages allows for tailored approaches based on market volatility.
Benefits
1. Clarity and Insight
- The combination of diverse moving averages offers a clear visual representation of market trends, aiding traders in making informed decisions across multiple timeframes.
2. Flexibility and Customization
- With adjustable parameters, traders can adapt the MATI to their specific strategies, making it suitable for various market conditions and trading styles.
3. Real-Time Alerts and Efficiency
- Built-in alerts minimize response times, allowing traders to capitalize on opportunities as they arise, regardless of their trading style.
Conclusion
The Multi-Average Trend Indicator (MATI) is an essential tool for traders seeking to enhance their technical analysis capabilities. By seamlessly integrating multiple moving averages with dynamic color coding and real-time alerts, this indicator provides a comprehensive approach to understanding market trends. Its versatility makes it an invaluable asset for scalpers, day traders, and swing traders alike.
Important Note
As with any trading tool, thorough analysis and risk management are crucial when using this indicator. Past performance does not guarantee future results, and traders should always be prepared for market fluctuations.

Volume Trend Swing Points | viResearchVolume Trend Swing Points | viResearch
Conceptual Foundation and Innovation
The "Volume Trend Swing Points" script is designed to identify pivotal swing points in market trends by leveraging the Price Volume Trend (PVT) indicator. This unique approach combines price and volume movements to highlight moments when a market may experience a significant trend reversal. By detecting the highest and lowest points of the PVT over customizable periods, this script aims to provide traders with valuable insights into potential bullish or bearish market behavior.
The simplicity of the script, combined with its use of the PVT, offers an effective way for traders to anticipate key market swings based on both price and volume momentum.
Technical Composition and Calculation
The core of the "Volume Trend Swing Points" script is built around the Price Volume Trend (PVT) indicator, which adjusts price changes according to trading volume. The script focuses on identifying the highest and lowest values of the PVT over user-defined lookback periods:
Price Volume Trend (PVT): The PVT is used to calculate the momentum of price movements, taking volume into account. By incorporating both price and volume, the PVT offers a more dynamic and responsive indicator of trend direction compared to price alone.
Swing Point Detection: The script identifies the highest and lowest PVT values over user-defined lookback periods (x for highs and y for lows). When the current PVT matches either the highest or lowest value, it signals a potential trend reversal or continuation, depending on whether the high or low is detected.
Entry and Exit Signals: A long signal (bullish) is generated when the current PVT matches the highest value over the lookback period, while a short signal (bearish) is generated when the current PVT matches the lowest value. These signals can be visualized with alerts and background colors.
Features and User Inputs
The "Volume Trend Swing Points" script allows traders to customize several parameters to better suit their trading strategies and market conditions:
Lookback Periods (x and y): The script allows for two customizable lookback periods—one for detecting the highest PVT and another for the lowest. Adjusting these values can help refine the sensitivity of the swing points.
Bar Coloring: The script includes an optional setting to color the bars based on detected bullish or bearish trends, making it easier to visualize potential market shifts.
Background Colors: The background color changes dynamically based on whether a high or low swing point is detected, providing traders with a clear visual indication of potential trend reversals.
Alerts: The script includes alert conditions for both long and short signals, enabling traders to set notifications for when potential swing points are detected.
Practical Applications
The "Volume Trend Swing Points" script is ideal for traders who focus on price and volume dynamics when making trading decisions. Its application is particularly useful in the following scenarios:
Detecting Trend Reversals: By identifying the highest and lowest PVT values over a given period, the script can help traders spot potential reversal points, allowing for more timely entries or exits.
Confirming Trend Continuations: When the PVT continues to match the highest or lowest values, it may indicate that the trend is likely to continue, helping traders maintain their positions with greater confidence.
Volume-Based Trend Analysis: Since the script uses the PVT, it is particularly effective in markets where volume plays a significant role in driving price movements, offering insights that go beyond simple price-based indicators.
Advantages and Strategic Value
This script enhances traditional trend analysis by incorporating both price and volume through the PVT, providing a more comprehensive view of market momentum. The customizable lookback periods allow traders to adapt the script to different assets and timeframes, making it a versatile tool for swing trading and trend-following strategies.
The visual cues provided by bar coloring and background shading help traders quickly identify potential market shifts, improving decision-making speed and accuracy.
Summary and Usage Tips
The "Volume Trend Swing Points" script is a straightforward yet powerful tool for identifying market reversals and trend continuations based on both price and volume. By adjusting the lookback periods, traders can fine-tune the script to better suit their trading style and the assets they are monitoring. The visual and alert features further enhance the script's usability, making it easy to incorporate into a trading strategy.
Remember to backtest the script across various market conditions to better understand its performance. Past performance is not necessarily indicative of future results, so using this script in conjunction with other technical tools is recommended for optimal decision-making.

RV- Dynamic Trend AnalyzerRV Dynamic Trend Analyzer
The RV Dynamic Trend Analyzer is a powerful TradingView indicator designed to help traders identify and capitalize on trends across multiple time frames—daily, weekly, and monthly. With dynamic adjustments to key technical indicators like EMA and MACD, the tool adapts to different chart periods, ensuring more accurate signals. Whether you are swing trading or holding longer-term positions, this indicator provides reliable buy/sell signals, breakout opportunities, and customizable visual elements to enhance decision-making. Its intelligent use of EMAs and MACD values ensures high potential returns, making it suitable for traders seeking strong, data-driven strategies. Below are its core features and their respective benefits.
Supertrend Indicator:
Importance: The Supertrend is a trend-following tool that helps traders identify the market’s direction by offering clear buy and sell signals based on price movement relative to the Supertrend line.
Benefits:
Helps filter out market noise and enables traders to stay in trends longer.
The pullback detection feature enhances trade timing by identifying potential entry points during retracements.
ATH/ATL & 52-Week High/Low with Candle Coloring:
Importance: Tracking all-time highs (ATH), all-time lows (ATL), and 52-week high/low levels helps traders identify key support and resistance levels.
Benefits:
Offers insights into the strength of price movements and potential reversal zones.
Candle coloring improves visual analysis, allowing quick identification of bullish or bearish conditions at critical levels.
Multi-Time Frame Analysis
Importance: The ability to view indicators like RSI and MACD across multiple time frames provides a more in-depth and comprehensive view of market behavior, allowing traders to make informed decisions that align with both short-term and long-term trends.
Benefits:
Align Strategies Across Time frames: By using multiple time frames, traders can align their strategies with larger trends (such as weekly or daily) while executing trades on lower time frames (like 1-minute or 5-minute charts). This improves the accuracy of trade entries and exits.
Reduce False Signals: Viewing key technical indicators like RSI and MACD across different time frames reduces the likelihood of false signals by offering a broader market context, filtering out noise from smaller time frames.
Customization of Table Display: Traders can customize the position and size of a table that displays RSI and MACD values for selected time frames. This flexibility enhances visibility and ease of analysis.
Time frame-Specific Data: The code allows for displaying RSI and MACD data for up to seven different time frames, making it highly customizable for traders depending on their preferred analysis period.
Visual Clarity: The table displays key values such as RSI and MACD histogram readings in a visually clear format, with color coding to quickly indicate overbought/oversold levels or MACD crossovers.
Pivot Points:
Importance: Pivot points serve as key support and resistance levels that help predict potential price movements.
Benefits:
Assists in identifying potential reversal zones and breakout points, aiding in trade planning.
Displaying pivot points across multiple time frames enhances market insight and improves strategic planning.
Quarterly Earnings Table:
Importance: Understanding a company’s quarterly earnings releases is crucial, as these events often lead to significant price volatility. Traders can leverage this information to adjust their strategies around earnings reports and prevent unexpected losses.
Benefits:
Helps traders anticipate potential price movements due to earnings reports.
Allows traders to avoid sudden losses by being aware of important earnings announcements and adjusting positions accordingly.
Customizable Visuals for Traders:
Dark Mode: Toggle between dark and light themes based on your chart's color scheme.
Mini Mode: A condensed version that visually simplifies the data, making it quicker to interpret through color-coded traffic lights (green for positive, red for negative).
Table Size & Position: Customize the size and position of the table for better visibility on your charts.
Data Period (FQ vs FY): Easily switch between displaying quarterly or yearly data based on the selected period.
Top-Left Cell Display: Option to display Free Float or Market Cap in the top-left cell for quick reference.
Exponential Moving Averages (EMAs) with Adjustable Lengths:
Importance: EMAs are essential for identifying trends and generating reliable buy/sell signals. The indicator plots four EMAs that dynamically adjust based on the selected time frame.
Benefits:
Dynamic Time frame Logic: EMA lengths and sources automatically adapt based on whether the user selects daily, weekly, or monthly time frames. This ensures the EMAs are relevant for the chosen strategy.
Multiple EMAs: By incorporating four different EMAs, users can observe both short-term and long-term trends simultaneously, improving their ability to identify key trend shifts.
Breakout Arrow Functionality:
Importance: This feature visually signals potential buy/sell opportunities based on the interaction between EMAs and MACD crossovers.
Benefits:
Crossover Signals: Arrows are plotted when EMAs and MACD cross, indicating breakout opportunities and aiding in quick trade decisions.
RSI Filter Option: Users can apply an optional RSI filter to refine buy/sell signals, reducing false signals and improving overall accuracy.
Disclaimer:
Before engaging in actual trading, we strongly recommend back testing the this indicator to ensure it fits your trading style and risk tolerance. Be sure to adjust your risk-reward ratio and set appropriate stop-loss levels to safeguard your investments. Proper risk management is key to successful trading.

[3Commas] Signal BuilderSignal Builder is a tool designed to help traders create custom buy and sell signals by combining multiple technical indicators. Its flexibility allows traders to set conditions based on their specific strategy, whether they’re into scalping, swing trading, or long-term investing. Additionally, its integration with 3Commas bots makes it a powerful choice for those looking to automate their trades, though it’s also ideal for traders who prefer receiving alerts and making manual decisions.
🔵 How does Signal Builder work?
Signal Builder allows users to define custom conditions using popular technical indicators, which, when met, generate clear buy or sell signals. These signals can be used to trigger TradingView alerts, ensuring that you never miss a market opportunity. Additionally, all conditions are evaluated using "AND" logic, meaning signals are only activated when all user-defined conditions are met. This increases precision and helps avoid false signals.
🔵 Available indicators and recommended settings:
Signal Builder provides access to a wide range of technical indicators, each customizable to popular settings that maximize effectiveness:
RSI (Relative Strength Index): An oscillator that measures the relative strength of price over a specific period. Traders typically configure it with 14 periods, using levels of 30 (oversold) and 70 (overbought) to identify potential reversals.
MACD (Moving Average Convergence Divergence): A key indicator tracking the crossover between two moving averages. Common settings include 12 and 26 periods for the moving averages, with a 9-period signal line to detect trend changes.
Ultimate Oscillator: Combines three different time frames to offer a comprehensive view of buying and selling pressure. Popular settings are 7, 14, and 28 periods.
Bollinger Bands %B: Provides insight into where the price is relative to its upper and lower bands. Standard settings include a 20-period moving average and a standard deviation of 2.
ADX (Average Directional Index): Measures the strength of a trend. Values above 25 typically indicate a strong trend, while values below suggest weak or sideways movement.
Stochastic Oscillator: A momentum indicator comparing the closing price to its range over a defined period. Popular configurations include 14 periods for %K and 3 for %D smoothing.
Parabolic SAR: Ideal for identifying trend reversals and entry/exit points. Commonly configured with a 0.02 step and a 0.2 maximum.
Money Flow Index (MFI): Similar to RSI but incorporates volume into the calculation. Standard settings use 14 periods, with levels of 20 and 80 as oversold and overbought thresholds.
Commodity Channel Index (CCI): Measures the deviation of price from its average. Traders often use a 20-period setting with levels of +100 and -100 to identify extreme overbought or oversold conditions.
Heikin Ashi Candles: These candles smooth out price fluctuations to show clearer trends. Commonly used in trend-following strategies to filter market noise.
🔵 How to use Signal Builder:
Configure indicators: Select the indicators that best fit your strategy and adjust their settings as needed. You can combine multiple indicators to define precise entry and exit conditions.
Define custom signals: Create buy or sell conditions that trigger when your selected indicators meet the criteria you’ve set. For example, configure a buy signal when RSI crosses above 30 and MACD confirms with a bullish crossover.
TradingView alerts: Set up alerts in TradingView to receive real-time notifications when the conditions you’ve defined are met, allowing you to react quickly to market opportunities without constantly monitoring charts.
Monitor with the panel: Signal Builder includes a visual panel that shows active conditions for each indicator in real time, helping you keep track of signals without manually checking each indicator.
🔵 3Commas integration:
In addition to being a valuable tool for any trader, Signal Builder is optimized to work seamlessly with 3Commas bots through Webhooks. This allows you to automate your trades based on the signals you’ve configured, ensuring that no opportunity is missed when your defined conditions are met. If you prefer automation, Signal Builder can send buy or sell signals to your 3Commas bots, enhancing your trading process and helping you manage multiple trades more efficiently.
🔵 Example of use:
Imagine you trade in volatile markets and want to trigger a sell signal when:
Stochastic Oscillator indicates overbought conditions with the %K value crossing below 80.
Bollinger Bands %B shows the price has surpassed the upper band, suggesting a potential reversal.
ADX is below 20, indicating that the trend is weak and could be about to change.
With Signal Builder , you can configure these conditions to trigger a sell signal only when all are met simultaneously. Then, you can set up a TradingView alert to notify you as soon as the signal is activated, giving you the opportunity to react quickly and adjust your strategy accordingly.
👨🏻💻💭 If this tool helps your trading strategy, don’t forget to give it a boost! Feel free to share in the comments how you're using it or if you have any questions.
_________________________________________________________________
The information and publications within the 3Commas TradingView account are not meant to be and do not constitute financial, investment, trading, or other types of advice or recommendations supplied or endorsed by 3Commas and any of the parties acting on behalf of 3Commas, including its employees, contractors, ambassadors, etc.

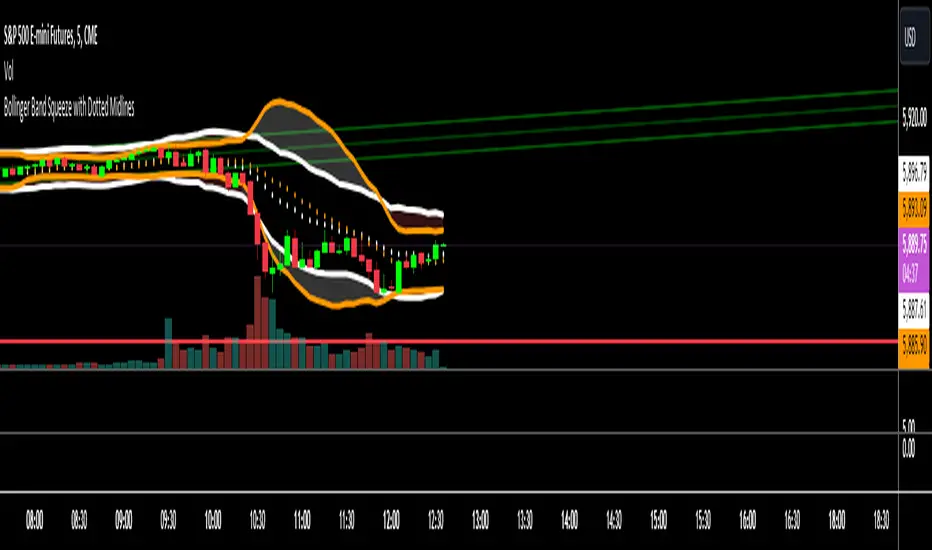
Bollinger Band Squeeze with Dotted MidlinesBollinger Band Squeeze with Dotted Midlines
Overview:
The Bollinger Band Squeeze with Dotted Midlines indicator is a powerful tool designed to identify periods of low volatility in the market, known as "squeeze" conditions, which often precede significant price movements. By combining Bollinger Bands and Keltner Channels, this indicator highlights when the market is consolidating and prepares traders for potential breakouts.
Key Features:
• Squeeze Detection: The indicator fills the area between the Bollinger Bands and Keltner Channels with a semi-transparent red color when both the upper and lower Bollinger Bands are within the Keltner Channels. This visual cue signifies a squeeze condition.
• Dynamic Color Filling: When the Bollinger Bands move outside the Keltner Channels, the fill color changes to a semi-transparent white, indicating the end of the squeeze and the potential start of increased volatility.
• Enhanced Visual Clarity:
o Upper and Lower Bands: The upper and lower lines of both the Bollinger Bands and Keltner Channels are plotted with increased thickness (3pt) for better visibility.
o Midlines with Dotted Effect: The middle lines (50% lines) for both the Bollinger Bands and Keltner Channels are plotted as dotted lines using circles with a thinner line width (1pt), providing a clear yet unobtrusive reference point.
Indicator Components:
1. Bollinger Bands (Orange Lines):
o Upper Bollinger Band: Calculated as the moving average plus a multiple of the standard deviation.
o Lower Bollinger Band: Calculated as the moving average minus a multiple of the standard deviation.
o Middle Bollinger Band: The simple moving average (SMA) of the closing price.
2. Keltner Channels (White Lines):
o Upper Keltner Channel: Calculated as the exponential moving average (EMA) plus a multiple of the average true range (ATR).
o Lower Keltner Channel: Calculated as the EMA minus a multiple of the ATR.
o Middle Keltner Channel: The EMA of the closing price.
3. Squeeze Condition Fill:
o Red Fill (40% Opacity): Indicates a squeeze condition where the Bollinger Bands are entirely within the Keltner Channels.
o White Fill (40% Opacity): Indicates normal market conditions where the Bollinger Bands have moved outside the Keltner Channels.
How to Use:
1. Identifying Squeeze Conditions:
o Look for Red Filled Areas: When you see the area between the Bollinger Bands and Keltner Channels filled in semi-transparent red, it signals a squeeze condition. This means the market is experiencing low volatility and may be preparing for a significant move.
2. Preparing for Potential Breakouts:
o Monitor for Fill Color Changes: A transition from red to white fill suggests that the squeeze is ending, and volatility is increasing. Traders often interpret this as a potential opportunity for a breakout in either direction.
3. Utilizing Midlines:
o Reference Midlines for Trend Direction: The dotted midlines provide insight into the overall trend. Crossing of the price above or below these lines can offer additional confirmation for trading decisions.
Customization Options:
• Bollinger Bands Settings:
o Length: Default is 20 periods. Adjust to change the sensitivity of the bands.
o Multiplier: Default is 2.0. Modify to increase or decrease the band width based on standard deviation.
• Keltner Channels Settings:
o Length: Default is 20 periods. Alter to adjust the responsiveness of the channels.
o Multiplier: Default is 1.5. Change to widen or narrow the channels based on average true range.
Advantages:
• Visual Clarity: Enhanced line thickness and semi-transparent fills make it easy to spot key market conditions at a glance.
• Early Warning System: By identifying squeeze conditions, traders can anticipate potential breakouts and plan their strategies accordingly.
• Flexible Application: Suitable for various timeframes and trading styles, including day trading, swing trading, and position trading.
Limitations:
• False Signals: Like all technical indicators, it may produce false signals, especially in choppy or range-bound markets.
• Should Be Used with Other Indicators: For better accuracy, it's recommended to use this indicator in conjunction with other technical analysis tools and not as a standalone signal generator.
Conclusion:
The Bollinger Band Squeeze with Dotted Midlines indicator is a valuable addition to any trader's toolkit. By effectively highlighting periods of consolidation and potential breakout points, it aids in making informed trading decisions. The visual enhancements improve usability, allowing traders to quickly interpret market conditions and respond appropriately.
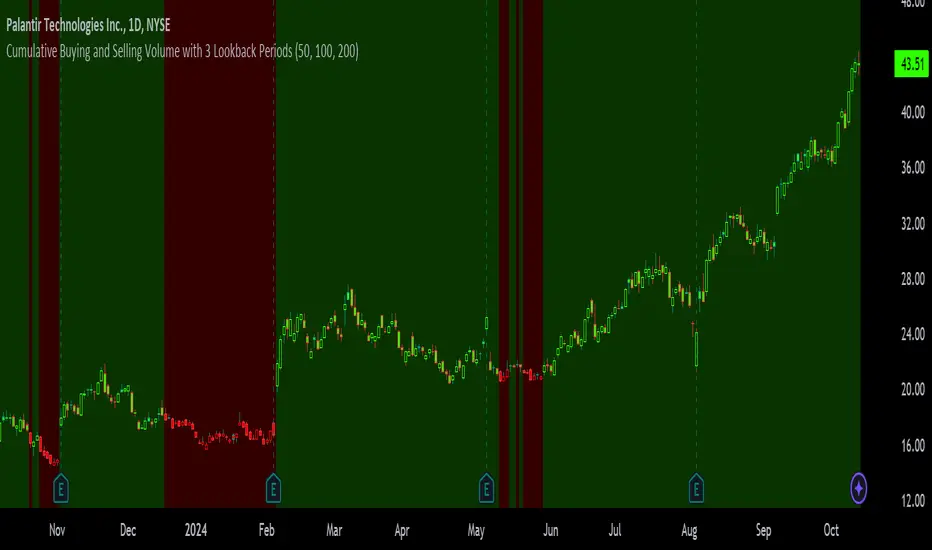
Cumulative Buying and Selling Volume with 3 Lookback PeriodsScript Overview:
This script is designed to help traders identify market momentum by analyzing buying and selling volume. It calculates the cumulative buying and selling pressure over three different lookback periods, providing insights into whether the bulls or bears are dominating at any given time. The script does this by computing the cumulative buying and selling volume for each period and comparing them through exponential moving averages (EMA) to smooth out short-term fluctuations.
Purpose and Use:
The primary goal of this script is to highlight shifts in market sentiment based on volume dynamics. Volume is a critical component in market analysis, often signaling the strength behind price movements. By focusing on cumulative buying and selling pressure, the script gives traders an idea of whether the market is trending towards more buying or selling during specific periods. Traders can use this tool to:
Identify potential entry points when buying pressure is strong.
Recognize potential selling opportunities when selling pressure is increasing.
Detect periods of indecision when neither buying nor selling dominates.
Key Concepts:
1. Buying Volume (BV):
The buying volume is calculated based on the price range of each candle. It represents the volume allocated to the bullish side of the market:
When the close is near the high, the buying volume is higher.
Formula: BV = volume * (close - low) / (high - low).
2. Selling Volume (SV):
Similarly, selling volume is derived based on the position of the close relative to the low:
When the close is near the low, selling volume is higher.
Formula: SV = volume * (high - close) / (high - low)
3. Lookback Periods:
The script allows users to define three different lookback periods (5, 10, and 20 by default). These periods smooth out the cumulative buying and selling volumes using EMA calculations:
Shorter periods capture more immediate changes in volume dynamics.
Longer periods provide a broader perspective on market trends.
4. Cumulative Volume Calculation:
For each lookback period, cumulative buying and selling volumes are tracked separately and then smoothed with EMA:
emaBuyVol and emaSellVol are the smoothed values for buying and selling volumes over the lookback periods.
5. Market Pressure Comparison:
Buying Pressure: If the EMA of buying volume is greater than the EMA of selling volume for a particular lookback period, the script considers that buying pressure dominates for that period.
Selling Pressure: Conversely, if selling volume dominates over buying volume for a period, the script registers selling pressure.
6. Overall Market Pressure:
The script aggregates the buying and selling pressures from the three lookback periods to determine the overall market sentiment:
If the majority of periods show buying pressure, the market is bullish.
If the majority show selling pressure, the market is bearish.
If neither side dominates, it suggests a neutral or indecisive market.
Visual Cues:
The script provides visual feedback to help traders quickly interpret the market pressure:
Background Color:
Green (#2bff00) when buying pressure dominates.
Red (#ff0000) when selling pressure dominates.
Gray (#404040) when there is no clear dominance.
Bar Color: The script also colors the price bars based on the dominant market pressure:
Green for buying pressure.
Red for selling pressure.
Gray for neutral or balanced market pressure.
Reset Mechanism:
At the start of each new candle, the cumulative volumes for all three periods are reset to zero. This ensures that the cumulative volumes are only measured for the current candle, preventing carryover from previous periods that could distort the analysis.
How Traders Can Use This Script:
Trend Confirmation: Traders can use the script as a trend confirmation tool. When the background turns green (buying dominance), it suggests bullish momentum. When red, bearish momentum is likely. This information can be used to confirm existing positions or signal new trades in the direction of the market pressure.
Reversal Detection: A sudden shift in the background color (from green to red or vice versa) can indicate a potential reversal. This can be particularly useful when combined with other technical indicators such as price action or support/resistance levels.
Multiple Timeframes: Since the script supports three different lookback periods, it provides a comprehensive view of market pressure across short-term, medium-term, and long-term perspectives. Traders can tailor the lookback periods based on their preferred timeframe to match their trading style, whether it’s intraday trading or longer-term swing trading.
Risk Management: The script's clear visual cues help traders manage risk by highlighting when selling pressure increases, allowing them to consider reducing long positions or tightening stop-losses.
Trade Entry Detector, Wick to Body Ratio Trade Entry Detector: Wick-to-Body Ratio Strategy with Bollinger Bands
Overview
The Trade Entry Detector is a custom strategy for TradingView that leverages the Bollinger Bands and a unique wick-to-body ratio approach to capture precise entry opportunities. This indicator is designed for traders who want to pinpoint high-probability reversal points when price interacts with Bollinger Bands, all while offering flexible entry fill options.
The strategy performs primary analysis on the daily time frame, regardless of your current chart setting, allowing you to view daily Bollinger Band levels and entry signals even on lower time frames. This approach is suitable for swing traders and short-term traders looking to align intraday moves with higher time frame signals.
How the Strategy Works
1. Bollinger Band Analysis on the Daily Time Frame
Bollinger Bands are calculated using a 20-period simple moving average (SMA) and a standard deviation multiplier (default is 2). These bands dynamically expand and contract based on market volatility, making them ideal for identifying overbought and oversold conditions:
* Upper Band: Indicates potential overbought levels.
* Lower Band: Indicates potential oversold levels.
2. Wick-to-Body Ratio Condition
This strategy places significant emphasis on candle wicks relative to the candle body. Here’s why:
* A large upper wick relative to the body signals potential selling pressure after testing the upper Bollinger Band.
* A large lower wick relative to the body indicates buying support after testing the lower Bollinger Band.
* Ratio Threshold: You can set a minimum wick-to-body ratio (default is 1.0), meaning that the wick must be at least equal in size to the body. This ensures only candles with significant reversals are considered for entry.
3. Flexible Entry Timing
To adapt to various trading styles, the indicator allows you to choose the entry fill timing:
* Daily Close: Enter at the close of the daily candle.
* Daily Open: Enter at the open of the following daily candle.
* HOD (High of Day): Set entry at the daily high, for those who want confirmation of upward momentum.
* LOD (Low of Day): Set entry at the daily low, ideal for confirming downward movement.
4. Position Sizing and Risk Management
The strategy calculates position size based on a fixed risk percentage of your account balance (default is 1%). This approach dynamically adjusts position sizes based on stop-loss distance:
* Stop Loss: Placed at the nearest swing high (for shorts) or swing low (for longs).
* Take Profit: Exits are triggered when the price reaches the opposite Bollinger Band.
5. Order Expiration
Each pending order (long or short) expires after two days if unfilled, allowing for new setups on subsequent candles if conditions are met again.
Using the Trade Entry Detector
Step-by-Step Guide
1. Set the Primary Time Frame
The core calculations run on the daily time frame, but the strategy can be applied to intraday charts (e.g., 65-minute or 15-minute) for deeper insights.
2. Adjust Bollinger Band Settings
* Length: Default is 20, which determines the period for calculating the moving average.
* Standard Deviation Multiplier: Default is 2.0, which sets the width of the bands. Adjusting this can help you capture broader or tighter volatility ranges.
3. Define the Wick-to-Body Ratio
Set the minimum ratio between wick and body (default 1.0). Higher values filter out candles with less wick-to-body contrast, focusing on stronger rejection moves.
4. Choose Entry Fill Timing
Select your preferred fill condition:
* Daily Close: Confirms the trade at the end of the daily session.
* Daily Open: Executes the entry at the open of the next day.
* HOD/LOD: Uses the daily high or low as an additional confirmation for upward or downward moves.
5. Position Sizing and Risk Management
* Set your account balance and risk percentage. The strategy automatically calculates position sizes based on the stop distance to manage risk efficiently.
* Stop Loss and Take Profit points are automatically set based on swing highs/lows and opposing Bollinger Bands, respectively.
Practical Example
Let’s say SPY (S&P 500 ETF) tests the lower Bollinger Band on the daily time frame, with a lower wick that is twice the size of the body (meeting the 1.0 ratio threshold). Here’s how the strategy might proceed:
1. Signal: The lower wick on SPY suggests buying interest at the lower Bollinger Band.
2. Entry Fill Timing: If you’ve selected "Daily Open," the entry order will be placed at the next day's open price.
3. Stop Loss: Positioned at the nearest daily swing low to minimize risk.
4. Take Profit: If SPY price moves up and reaches the upper Bollinger Band, the position is automatically closed.
Indicator Features and Benefits
* Multi-Time Frame Compatibility: Perform daily analysis while tracking signals on any intraday chart.
* Automatic Position Sizing: Tailor risk per trade based on account balance and desired risk percentage.
* Flexible Entry Options: Choose from close, open, HOD, or LOD for optimal timing.
* Effective Trend Reversal Identification: Uses wick-to-body ratio and Bollinger Band interaction to pinpoint potential reversals.
* Dynamic Visualization: Bollinger Bands are displayed on your chosen time frame, allowing seamless intraday tracking.
Summary
The Trade Entry Detector provides a unique, data-driven way to spot reversal points with customizable entry options. By combining Bollinger Bands with wick-to-body ratio conditions, it identifies potential trade setups where price has tested extremes and shown reversal signals. With its flexible entry timing, risk management features, and multi-time frame compatibility, this indicator is ideal for traders looking to blend daily market context with shorter-term execution.
Tips for Usage:
* For swing trading, consider the Daily Open or Close entry options.
* For momentum entries, HOD or LOD may offer better alignment with the direction of the wick.
* Backtest on different assets to find optimal Bollinger Band and wick-to-body settings for your market.
Use this indicator to enhance your understanding of price behavior at key levels and improve the precision of your entry points. Happy trading!

Custom 4 Moving Averages with Styles & ThresholdsThis Pine Script indicator is designed to provide traders with a unique method of analyzing price action through four customizable moving averages, alongside buy and sell threshold detection. The script is fully original and adds value by allowing traders to configure and visualize multiple MAs with different smoothing options, and by detecting critical buy/sell moments based on the interaction between price and the moving averages.
What the Script Does:
Custom Moving Averages: The script plots four distinct moving averages (MA1, MA2, MA3, and MA4) on the chart. Each MA can be configured for length, offset, and optional smoothing to match different trading strategies. This flexibility allows traders to tailor the script for various timeframes, trend detection, and market conditions.
Buy (BT) and Sell (ST) Threshold Detection: The indicator identifies critical points for buying and selling:
Buy Threshold (BT): The script identifies potential buy points when the current candle's low is above the MA2 from the previous candle, suggesting potential upward momentum.
Sell Threshold (ST): It detects potential sell points when the current MA2 falls below the previous candle’s low, indicating possible downward momentum. These thresholds are clearly marked on the chart with green arrows for BT (Buy) and red arrows for ST (Sell).
Horizontal Threshold Lines: Horizontal lines are drawn when BT or ST conditions are met. These lines help traders visualize support and resistance levels, providing clarity in decision-making. The length of these lines is customizable, allowing users to control how long they remain visible on the chart.
Dynamic Cleanup of Old Lines: To keep the chart clean and reduce clutter, the script automatically removes old BT and ST lines after a set period, ensuring that traders can focus on the most relevant data.
Underlying Concepts:
Moving Averages: Moving averages are a fundamental tool in technical analysis for identifying trends. This script uses various moving averages (calculated from high, low, close, and HL2) and allows for smoothing to adjust the sensitivity to price movements. Traders can apply this flexibility to multiple trading styles, from scalping to swing trading.
Threshold Conditions: The buy and sell conditions in this script are based on simple but effective price action patterns, where the interaction between price and MA2 determines entry or exit points. This approach is useful in trend-following strategies, where traders aim to capitalize on momentum shifts.
How to Use the Script:
Configure Moving Averages: Start by adjusting the lengths, offsets, and smoothing options for each moving average. For short-term trading, shorter MA lengths might be more suitable, while longer MAs can help identify broader trends.
Observe Buy and Sell Signals: Look for green arrows (BT) as potential buy signals and red arrows (ST) as potential sell signals. These signals appear when certain conditions between price and MA2 are met, giving traders clear visual cues for entries and exits.
Support/Resistance Levels: Pay attention to the horizontal lines drawn when BT or ST conditions occur. These lines can act as support or resistance levels, helping you identify potential price targets or stop-loss points.
Why This Script is Useful:
This indicator combines the power of multiple moving averages with customizable features, making it versatile for different market conditions. By adding clear buy and sell signals based on a logical threshold system, the script helps traders make informed decisions with minimal guesswork. Unlike many basic indicators, this one provides flexibility and original insight into market dynamics, making it a valuable tool for both beginner and experienced traders.

Rolling VWAPGuide for Traders
What is the Rolling VWAP?
The Volume Weighted Average Price (VWAP) is a key indicator used by traders to assess the average price of an asset, weighted by volume over a specified period. Unlike a simple moving average, the VWAP accounts for trading volume, making it a more accurate reflection of price action and market sentiment.
The Rolling VWAP in this script dynamically updates based on a user-defined period, allowing traders to view the average price over a chosen number of bars. This is particularly useful for identifying trends and potential entry or exit points in the market.
Key Benefits of Using Rolling VWAP
Better Market Insight: VWAP provides insight into where most trading is occurring, helping you gauge the strength of a price move.
Support and Resistance Levels: It often acts as dynamic support or resistance, signaling areas where price might reverse.
Trend Confirmation: A rising VWAP suggests a bullish trend, while a falling VWAP indicates a bearish trend.
Informed Entry/Exit Decisions: Use the VWAP to find entry points below it in an uptrend or exit points above it in a downtrend.
How to Use this Script:
Custom Period Input:
You can modify the "VWAP Period" to adjust the number of bars considered in the rolling calculation.
The default period is 14 bars, but you can set it based on your strategy (e.g., shorter for intraday trading, longer for swing trading).
Chart Interpretation
Bullish Signals: When the price is above the VWAP line, it suggests upward momentum, and you may consider buying opportunities.
Bearish Signals: When the price is below the VWAP, it indicates downward momentum, and you may consider selling or shorting opportunities.
Reversion to VWAP: Prices often revert to the VWAP after extended moves away from it, offering potential trade setups.
Combine with Other Indicators:
Momentum Indicators: Use with RSI, MACD, or moving averages for confirmation.
Volume Analysis: VWAP works well when combined with volume indicators to assess if a breakout is supported by high trading volume.
Customization:
Traders can customize the script's period and plot color to fit their charting preferences.
Practical Tips:
Intraday Traders: Use shorter periods (e.g., 5 or 10) to capture VWAP trends in fast-moving markets.
Swing Traders: Use longer periods (e.g., 50 or 100) to assess longer-term price and volume trends.
By integrating this Rolling VWAP into your strategy, you can better understand where the majority of trading volume has occurred, allowing you to make more informed decisions in your trading process.
Adaptive Gaussian MA For Loop [BackQuant]Adaptive Gaussian MA For Loop
PLEASE Read the following carefully before applying this indicator to your trading system. Knowing the core logic behind the tools you're using allows you to integrate them into your strategy with confidence and precision.
Introducing BackQuant's Adaptive Gaussian Moving Average For Loop (AGMA FL) — a sophisticated trading indicator that merges the Gaussian Moving Average (GMA) with adaptive volatility to provide dynamic trend analysis. This unique indicator further enhances its effectiveness by utilizing a for-loop scoring mechanism to detect potential shifts in market direction. Let's dive into the components, the rationale behind them, and how this indicator can be practically applied to your trading strategies.
Understanding the Gaussian Moving Average (GMA)
The Gaussian Moving Average (GMA) is a smoothed moving average that applies Gaussian weighting to price data. Gaussian weighting gives more significance to data points near the center of the lookback window, making the GMA particularly effective at reducing noise while maintaining sensitivity to changes in price direction. In contrast to simpler moving averages like the SMA or EMA, GMA provides a more refined smoothing function, which can help traders follow the true trend in volatile markets.
In this script, the GMA is calculated over a defined Calculation Period (default 14), applying a Gaussian filter to smooth out market fluctuations and provide a clearer view of underlying trends.
Adaptive Volatility: A Dynamic Edge
The Adaptive feature in this indicator gives it the ability to adjust its sensitivity based on current market volatility. If the Adaptive option is enabled, the GMA uses a standard deviation-based volatility measure (with a default period of 20) to dynamically adjust the width of the Gaussian filter, allowing the GMA to react faster in volatile markets and more slowly in calm conditions. This dynamic nature ensures that the GMA stays relevant across different market environments.
When the Adaptive setting is disabled, the script defaults to a constant standard deviation value (default 1.0), providing a more stable but less responsive smoothing function.
Why Use Adaptive Gaussian Moving Average?
The Gaussian Moving Average already provides smoother results than standard moving averages, but by adding an adaptive component, the indicator becomes even more responsive to real-time price changes. In fast-moving or highly volatile markets, this adaptation allows traders to react quicker to emerging trends. Conversely, in quieter markets, it reduces over-sensitivity to minor fluctuations, thus lowering the risk of false signals.
For-Loop Scoring Mechanism
The heart of this indicator lies in its for-loop scoring system, which evaluates the smoothed price data (the GMA) over a specified range, comparing it to previous values. This scoring system assigns a numerical value based on whether the current GMA is higher or lower than previous values, creating a trend score.
Long Signals: These are generated when the for-loop score surpasses the Long Threshold (default set at 40), signaling that the GMA is gaining upward momentum, potentially identifying a favorable buying opportunity.
Short Signals: These are triggered when the score crosses below the Short Threshold (default set at -10), indicating that the market may be losing strength and that a selling or shorting opportunity could be emerging.
Thresholds & Customization Options
This indicator offers a high degree of flexibility, allowing you to fine-tune the settings according to your trading style and risk preferences:
Calculation Period: Adjust the lookback period for the Gaussian filter, affecting how smooth or responsive the indicator is to price changes.
Adaptive Mode: Toggle the adaptive feature on or off, allowing the GMA to dynamically adjust based on market volatility or remain consistent with a fixed standard deviation.
Volatility Settings: Control the standard deviation period for adaptive mode, fine-tuning how quickly the GMA responds to shifts in volatility.
For-Loop Settings: Modify the start and end points for the for-loop score calculation, adjusting the depth of analysis for trend signals.
Thresholds for Signals: Set custom long and short thresholds to determine when buy or sell signals should be generated.
Visualization Options: Choose to color bars based on trend direction, plot signal lines, or adjust the background color to reflect current market sentiment visually.
Trading Applications
The Adaptive Gaussian MA For Loop can be applied to a variety of trading styles and markets. Here are some key ways you can use this indicator in practice:
Trend Following: The combination of Gaussian smoothing and adaptive volatility helps traders stay on top of market trends, identifying significant momentum shifts while filtering out noise. The for-loop scoring system enhances this by providing a numerical representation of trend strength, making it easier to spot when a new trend is emerging or when an existing one is gaining strength.
Mean Reversion: For traders looking to capitalize on short-term market corrections, the adaptive nature of this indicator makes it easier to identify when price action is deviating too far from its smoothed trend, allowing for strategic entries and exits based on overbought or oversold conditions.
Swing Trading: With its ability to capture medium-term price movements while avoiding the noise of short-term fluctuations, this indicator is well-suited for swing traders who aim to profit from market reversals or short-to-mid-term trends.
Volatility Management: The adaptive feature allows the indicator to adjust dynamically in volatile markets, ensuring that it remains responsive in times of increased uncertainty while avoiding unnecessary noise in calmer periods. This makes it an effective tool for traders who want to manage risk by staying in tune with changing market conditions.
Final Thoughts
The Adaptive Gaussian MA For Loop is a powerful and flexible indicator that merges the elegance of Gaussian smoothing with the adaptability of volatility-based adjustments. By incorporating a for-loop scoring mechanism, this indicator provides traders with a comprehensive view of market trends and potential trade opportunities.
It’s important to test the settings on historical data and adapt them to your specific trading style, timeframe, and market conditions. As with any technical tool, the AGMA For Loop should be used in conjunction with other indicators and solid risk management practices for the best results.
Thus following all of the key points here are some sample backtests on the 1D Chart
Disclaimer: Backtests are based off past results, and are not indicative of the future.
INDEX:BTCUSD
INDEX:ETHUSD
BINANCE:SOLUSD

Two Pole Butterworth For Loop [BackQuant]Two Pole Butterworth For Loop
PLEASE read the following carefully, as understanding the underlying concepts and logic behind the indicator is key to incorporating it into your trading system in a sound and methodical manner.
Introducing BackQuant's Two Pole Butterworth For Loop (2P BW FL) — an advanced indicator that fuses the power of the Two Pole Butterworth filter with a dynamic for-loop scoring mechanism. This unique approach is designed to extract actionable trading signals by smoothing out price data and then analyzing it using a comparative scoring method. Let's delve into how this indicator works, why it was created, and how it can be used in various trading scenarios.
Understanding the Two Pole Butterworth Filter
The Butterworth filter is a signal processing tool known for its smooth response and minimal distortion. It's often used in electronic and communication systems to filter out unwanted noise. In trading, the Butterworth filter can be applied to price data to smooth out the volatility, providing traders with a clearer view of underlying trends without the whipsaws often associated with market noise.
The Two Pole Butterworth variant further enhances this effect by applying the filter with two poles, effectively creating a sharper transition between the passband and stopband. In simple terms, this allows the filter to follow the price action more closely, reacting to changes while maintaining smoothness.
In this script, the Two Pole Butterworth filter is applied to the Calculation Source (default is set to the closing price), creating a smoothed price series that serves as the foundation for further analysis.
Why Use a Two Pole Butterworth Filter?
The Two Pole Butterworth filter is chosen for its ability to reduce lag while maintaining a smooth output. This makes it an ideal choice for traders who want to capture trends without being misled by short-term volatility or market noise. By filtering the price data, the Two Pole Butterworth enables traders to focus on the broader market movements and avoid false signals.
The For-Loop Scoring Mechanism
In addition to the Butterworth filter, this script uses a for-loop scoring system to evaluate the smoothed price data. The for-loop compares the current value of the filtered price (referred to as "subject") to previous values over a defined range (set by the start and end input). The score is calculated based on whether the subject is higher or lower than the previous points, and the cumulative score is used to determine the strength of the trend.
Long and Short Signal Logic
Long Signals: A long signal is triggered when the score surpasses the Long Threshold (default set at 40). This suggests that the price has built sufficient upward momentum, indicating a potential buying opportunity.
Short Signals: A short signal is triggered when the score crosses under the Short Threshold (default set at -10). This indicates weakening price action or a potential downtrend, signaling a possible selling or shorting opportunity.
By utilizing this scoring system, the indicator identifies moments when the price momentum is shifting, helping traders enter positions at opportune times.
Customization and Visualization Options
One of the strengths of this indicator is its flexibility. Traders can customize various settings to fit their personal trading style or adapt it to different markets and timeframes:
Calculation Periods: Adjust the lookback period for the Butterworth filter, allowing for shorter or longer smoothing depending on the desired sensitivity.
Threshold Levels: Set the long and short thresholds to define when signals should be triggered, giving you control over the balance between sensitivity and specificity.
Signal Line Width and Colors: Customize the visual presentation of the indicator on the chart, including the width of the signal line and the colors used for long and short conditions.
Candlestick and Background Colors: If desired, the indicator can color the candlesticks or the background according to the detected trend, offering additional clarity at a glance.
Trading Applications
This Two Pole Butterworth For Loop indicator is versatile and can be adapted to various market conditions and trading strategies. Here are a few use cases where this indicator shines:
Trend Following: The Butterworth filter smooths the price data, making it easier to follow trends and identify when they are gaining or losing strength. The for-loop scoring system enhances this by providing a clear indication of how strong the current trend is compared to recent history.
Mean Reversion: For traders looking to identify potential reversals, the indicator’s ability to compare the filtered price to previous values over a range of periods allows it to spot moments when the trend may be losing steam, potentially signaling a reversal.
Swing Trading: The combination of smoothing and scoring allows swing traders to capture short to medium-term price movements by filtering out the noise and focusing on significant shifts in momentum.
Risk Management: By providing clear long and short signals, this indicator helps traders manage their risk by offering well-defined entry and exit points. The smooth nature of the Butterworth filter also reduces the risk of getting caught in false signals due to market noise.
Final Thoughts
The Two Pole Butterworth For Loop indicator offers traders a powerful combination of smoothing and scoring to detect meaningful trends and shifts in price momentum. Whether you are a trend follower, swing trader, or someone looking to refine your entry and exit points, this indicator provides the tools to make more informed trading decisions.
As always, it's essential to backtest the indicator on historical data and tailor the settings to your specific trading style and market. While the Butterworth filter helps reduce noise and smooth trends, no indicator can predict the future with absolute certainty, so it should be used in conjunction with other tools and sound risk management practices.
Thus following all of the key points here are some sample backtests on the 1D Chart
Disclaimer: Backtests are based off past results, and are not indicative of the future.
INDEX:BTCUSD
INDEX:ETHUSD
BINANCE:SOLUSD

Strength/Weakness IndicatorThe Strength/Weakness Indicator is a customisable tool designed to help traders identify key areas of market strength and weakness based on the 50% Fibonacci retracement level .
█ Underlying Concept:
The concept behind this indicator draws heavily on the principles of Fibonacci retracement and WD Gann’s market theories , particularly the importance of the 50% level in signalling critical psychological areas of support and resistance. Historically, the 50% retracement level has been regarded as a key marker where markets either find new buyers/sellers or continue a trend. Gann himself placed significant emphasis on the halfway point of a previous market move as a critical level for market strength and reversal.
Strength : When an asset is trading above the 50% retracement level, it suggests that buyers are in control and that the market is showing strength. This is particularly useful for traders aiming to ride the continuation of an uptrend.
Weakness : Conversely, when the price falls below the 50% retracement level, it indicates that sellers are dominating, and the market is showing signs of weakness. This can be an early indication of a potential reversal or further decline.
█ Key Features:
1 — Multi-Timeframe Fibonacci Analysis :
This indicator supports up to two distinct retracement levels, allowing traders to analyse multiple timeframes simultaneously. Customise the look-back periods for each level to track the highest high and lowest low over your chosen period.
The tool is adaptable to short-term, swing trading, and long-term investing, making it useful across different trading styles.
2 — Dynamic Strength/Weakness Labelling :
The script dynamically calculates and displays whether the asset is “STRONG” or “WEAK” based on its position relative to the 50% retracement levels. If the price is above both levels, it is considered "VERY STRONG." Conversely, trading below both levels signals "VERY WEAK" conditions. This real-time feedback helps traders gauge market sentiment with ease.
3 — Customizable Visual Representation :
Both retracement levels are fully customisable, including line colours, styles, and thicknesses. The script offers custom background fills—highlighting areas of strength (green) and weakness (red)—to provide a clear visual aid for identifying key price zones.
Traders can modify the appearance of text labels (size, colour, position) and choose whether to extend lines left, right, both directions, or not at all.
4 — Cross-Timeframe Validation :
Traders can cross-reference price action between two timeframes to confirm trends. If both levels signal strength or weakness, it validates market momentum, increasing confidence in trade decisions.
5 — Strategic Decision-Making Aid :
The indicator aids in identifying support and resistance zones based on the 50% retracement level. Use it to time entries and exits effectively: price above the 50% level suggests potential trend continuation, while falling below may indicate reversal.
█ How It Works:
1 — Defining Custom Timeframes :
The trader selects custom time periods (days, weeks, months, or years) to calculate the highest high and lowest low, allowing precise control over the analysis.
2 — Calculating Strength/Weakness :
Once the 50% retracement level is calculated, the price’s position relative to it determines the market’s condition. Above 50% signals strength, below signals weakness.
3 — Comparing Multiple Timeframes :
Enable a second retracement level to compare different time periods. This feature is useful for spotting divergences between short-term and long-term trends or validating strength across timeframes.
█ How to Use:
1 — Assess Market Conditions :
If price trades above both 50% retracement levels, it indicates strong bullish momentum. Conversely, trading below both levels signals bearish conditions.
2 — Plan Entries/Exits :
Use the 50% level as a reference for support and resistance. Plan to enter when the price bounces off the 50% level, or exit if it breaks down below this critical level.
3 — Cross-Timeframe Analysis :
Validate the market trend by comparing retracement levels across different timeframes. This helps in confirming whether the trend is strong enough to justify holding a position.
█ Why This Indicator is Unique:
Comprehensive Multi-Timeframe Analysis : While most Fibonacci indicators focus on a single period, this tool provides a deeper understanding by allowing traders to compare price action across multiple timeframes.
Customizable and Dynamic : The real-time strength/weakness labeling, customizable background fills, and the ability to analyze two retracement levels simultaneously make this tool adaptable to any trading strategy.
Valuable for All Traders : Whether you are day trading, swing trading, or investing long-term, the Strength/Weakness Indicator offers clarity on key market levels and sentiment, improving decision-making for entries and exits.
Disclaimer : This script is for educational purposes and is not financial advice. Trading involves significant risk, so please consult a professional advisor before making investment decisions. For the best results, use this indicator alongside other technical analysis methods like trend lines or moving averages to help you confirm signals and make more informed decisions.
Trend CCITrend CCI (TCCI) Indicator
Description:
The Trend CCI (TCCI) indicator is a unique combination of the Commodity Channel Index (CCI) and the Average True Range (ATR), designed to identify trends and market reversals with a refined sensitivity to price volatility. The indicator plots the CCI, adjusted by an ATR filter, and color-codes the trendline to signal uptrends and downtrends.
How It Works:
This indicator uses the CCI to measure price momentum and an ATR-based filter to smooth out market noise, making it easier to detect significant shifts in the market trend. Key parameters such as the ATR Period, ATR Multiplier, and CCI Period have been carefully chosen to optimize the indicator's performance:
1. ATR Period (default: 18)
The ATR Period determines the number of periods used to calculate the **Average True Range**, which reflects market volatility. In this case, an **ATR Period of 18** has been selected for several reasons:
Balance between responsiveness and noise reduction : A period of 18 strikes a balance between being responsive to recent price movements and filtering out minor fluctuations. Shorter ATR periods might be too reactive, creating false signals, while longer periods might miss shorter-term trends.
Adaptable to various market conditions : An 18-period ATR is suitable for both intraday and swing trading strategies, making it versatile across different time frames.
Standard industry practice : Many traders use ATR settings between 14 and 20 periods as a convention for detecting reliable volatility levels.
2. ATR Multiplier (default: 1.5)
The ATR Multiplier is applied to the ATR value to define how sensitive the indicator is to volatility. In this case, a multiplier of 1.5 has been chosen:
Avoiding whipsaws in low volatility markets: By setting the multiplier to 1.5, the indicator filters out smaller, less significant price movements, reducing the likelihood of whipsaw signals (i.e., false trend reversals during periods of low volatility).
Optimizing signal accuracy: A moderate multiplier like 1.5 ensures that the indicator only generates signals when the price moves a significant distance from the average range. Higher multipliers (e.g., 2.0) may ignore valid opportunities, while lower multipliers (e.g., 1.0) might create too many signals.
Enhancing trend clarity : The multiplier’s role in widening the range allows the indicator to respond more clearly during periods of strong trends, reducing signal noise and false positives.
3. CCI Period (default: 63)
The CCI Period defines the number of periods used to calculate the Commodity Channel Index. A 63-period CCI is selected based on the following considerations:
Smoothing the momentum calculation: A longer period, such as 63, is used to smooth out the CCI and reduce the effects of short-term price fluctuations. This period captures longer-term momentum, making it ideal for identifying more significant market trends.
-Filtering out short-term noise: While shorter CCI periods (e.g., 14 or 20) may be more reactive, they tend to produce more signals, some of which may be false. A 63-period CCI focuses on stronger and more sustained price movements, providing fewer but higher-quality signals.
Adapted to intermediate trading: A 63-period CCI aligns well with traders looking for medium-term trend-following strategies, striking a balance between long-term trend identification and responsiveness to significant price shifts.
How to Use:
Green Area: When the trendline turns green, it signals that the CCI is positive, reflecting upward momentum. This can be interpreted as a buy signal, indicating the potential for long positions or continuing bullish trades.
Red Area: When the trendline turns red, it signals that the CCI is negative, reflecting downward momentum. This can be interpreted as a sell signal, indicating potential short positions or bearish trades.
ATR Filter: The ATR helps reduce false signals by ignoring minor price movements. Traders can adjust the ATR Multiplier to make the indicator more or less sensitive based on market conditions. A lower multiplier (e.g., 1.2) may increase signal frequency, while a higher multiplier (e.g., 2.0) reduces it.
Originality:
The Trend CCI (TCCI) stands out due to its combination of the CCI and ATR. While many indicators simply plot raw CCI values, this script enhances the CCI’s effectiveness by incorporating an ATR-based volatility filter. This ensures that only significant trends trigger signals, making it a more reliable tool in volatile markets. The choice of the ATR period, multiplier, and CCI period ensures a refined balance between trend detection and noise reduction, distinguishing it as a powerful trend-following indicator.
Additionally, the visual aspect—using color-coded trendlines that dynamically shift between green and red—simplifies the interpretation of market trends, offering traders a clear and immediate understanding of trend direction and momentum strength.
Final Recommendations:
Use in Trending Markets The TCCI is most effective in trending markets, where its signals align with broader market momentum. In sideways or low-volatility markets, consider adjusting the ATR multiplier or using other complementary indicators to confirm the signals.
Risk Management: Always integrate robust risk management practices, such as using stop-loss orders and position sizing, to protect against sudden market reversals or periods of heightened volatility.
Adjust for Volatility: Consider the volatility of the asset being traded. In highly volatile assets, a higher ATR multiplier (e.g., 2.0) may be necessary to filter out noise, while in more stable assets, a lower multiplier (e.g., 1.2) might generate earlier signals.
By using the Trend CCI (TCCI) indicator with a deeper understanding of its key parameters, traders can better identify trends, reduce noise, and improve their overall decision-making in the markets.
Good Profits!

Connors VIX Reversal III invented by Dave LandryThis strategy is based on trading signals derived from the behavior of the Volatility Index (VIX) relative to its 10-day moving average. The rules are split into buying and selling conditions:
Buy Conditions:
The VIX low must be above its 10-day moving average.
The VIX must close at least 10% above its 10-day moving average.
If both conditions are met, a buy signal is generated at the market's close.
Sell Conditions:
The VIX high must be below its 10-day moving average.
The VIX must close at least 10% below its 10-day moving average.
If both conditions are met, a sell signal is generated at the market's close.
Exit Conditions:
For long positions, the strategy exits when the VIX trades intraday below its previous day’s 10-day moving average.
For short positions, the strategy exits when the VIX trades intraday above its previous day’s 10-day moving average.
This strategy is primarily a mean-reversion strategy, where the market is expected to revert to a more normal state after the VIX exhibits extreme behavior (i.e., large deviations from its moving average).
About Dave Landry
Dave Landry is a well-known figure in the world of trading, particularly in technical analysis. He is an author, trader, and educator, best known for his work on swing trading strategies. Landry focuses on trend-following and momentum-based techniques, teaching traders how to capitalize on shorter-term price swings in the market. He has written books like "Dave Landry on Swing Trading" and "The Layman's Guide to Trading Stocks," which emphasize practical, actionable trading strategies.
About Connors Research
Connors Research is a financial research firm known for its quantitative research in financial markets. Founded by Larry Connors, the firm specializes in developing high-probability trading systems based on historical market behavior. Connors’ work is widely respected for its data-driven approach, including systems like the RSI(2) strategy, which focuses on short-term mean reversion. The firm also provides trading education and tools for institutional and retail traders alike, emphasizing strategies that can be backtested and quantified.
Risks of the Strategy
While this strategy may appear to offer promising opportunities to exploit extreme VIX movements, it carries several risks:
Market Volatility: The VIX itself is a measure of market volatility, meaning the strategy can be exposed to sudden and unpredictable market swings. This can result in whipsaws, where positions are opened and closed in rapid succession due to sharp reversals in the VIX.
Overfitting: Strategies based on specific conditions like the VIX closing 10% above or below its moving average can be subject to overfitting, meaning they work well in historical tests but may underperform in live markets. This is a common issue in quantitative trading systems that are not adaptable to changing market conditions .
Mean-Reversion Assumption: The core assumption behind this strategy is that markets will revert to their mean after extreme movements. However, during periods of sustained trends (e.g., market crashes or rallies), this assumption may break down, leading to prolonged drawdowns.
Liquidity and Slippage: Depending on the asset being traded (e.g., S&P 500 futures, ETFs), liquidity issues or slippage could occur when executing trades at market close, particularly in volatile conditions. This could increase costs or worsen trade execution.
Scientific Explanation of the Strategy
The VIX is often referred to as the "fear gauge" because it measures the market's expectations of volatility based on options prices. Research has shown that the VIX tends to spike during periods of market stress and revert to lower levels when conditions stabilize . Mean reversion strategies like this one assume that extreme VIX levels are unsustainable in the long run, which aligns with findings from academic literature on volatility and market behavior.
Studies have found that the VIX is inversely correlated with stock market returns, meaning that higher VIX levels often correspond to lower stock prices and vice versa . By using the VIX’s relationship with its 10-day moving average, this strategy aims to capture reversals in market sentiment. The 10% threshold is designed to identify moments when the VIX is significantly deviating from its norm, signaling a potential reversal.
However, academic research also highlights the limitations of relying on the VIX alone for trading signals. The VIX does not predict market direction, only volatility, meaning that it cannot indicate the magnitude of price movements . Furthermore, extreme VIX levels can persist longer than expected, particularly during financial crises.
In conclusion, while the strategy is grounded in well-established financial principles (e.g., mean reversion and the relationship between volatility and market performance), it carries inherent risks and should be used with caution. Backtesting and careful risk management are essential before applying this strategy in live markets.

RCYC Bullish Bearish Indicator
Summary: The RCYC Bullish Bearish Indicator is a custom trading tool designed to help traders identify potential bullish and bearish conditions in the market using a combination of KDJ and RSI indicators. This indicator uses color-coded candles to visually represent bullish and bearish signals, making it easy to identify trend changes on the chart. The script is particularly useful for traders who prefer visual signals and want to incorporate both trend momentum (KDJ) and relative strength (RSI) in their analysis.
Description:
The RCYC Bullish Bearish Indicator is a unique mashup of the KDJ and RSI indicators, optimized to provide a clear visual representation of market conditions through color-coded candles. This indicator not only identifies the potential trend shifts but also provides alerts for significant crossover points, enhancing a trader's ability to make informed decisions.
How It Works:
KDJ Calculation:
The KDJ is a variation of the Stochastic Oscillator that includes the %J line, which can go beyond the typical 0-100 range of %K and %D.
The KDJ component of this indicator calculates the highest high and lowest low over a specified period (KDJ Length), using these values to derive the %K line.
The %D line is a smoothed version of %K, and the %J line is derived from %K and %D using the formula: J = 3 * %K - 2 * %D.
This indicator focuses on the behavior of the %J line in relation to a mid-point level (50), identifying crossovers and crossunders that signal potential shifts in market sentiment.
RSI Calculation:
The Relative Strength Index (RSI) is a momentum oscillator that measures the speed and change of price movements. It is widely used to identify overbought or oversold conditions.
In this indicator, RSI values are adjusted and plotted to align visually with the KDJ values, providing a complementary momentum analysis.
Crossover Logic and Candle Coloring:
The indicator tracks two main events:
CrossOver50: When the %J line crosses above the 50 level, indicating potential bullish momentum.
CrossUnder50: When the %J line crosses below the 50 level, indicating potential bearish momentum.
Depending on the crossover events, the script changes the color of the candles on the chart:
Red candles on the initial crossover above 50, followed by dark blue candles to maintain bullish sentiment.
Yellow candles on the initial crossover below 50, followed by light blue candles to maintain bearish sentiment.
Alerts:
The indicator includes alert conditions for both bullish and bearish signals:
Red Candle Alert: Notifies the trader when the %J line crosses above 50.
Yellow Candle Alert: Notifies the trader when the %J line crosses below 50.
These alerts allow traders to react promptly to key market signals without continuously monitoring the chart.
Usage and Benefits:
This indicator is designed for traders looking to combine momentum and trend analysis into a single visual tool. It is particularly useful for those trading in trending markets or looking for entry/exit signals based on momentum shifts.
The color-coded candles provide an intuitive way to assess market conditions at a glance, reducing the complexity associated with analyzing multiple indicators separately.
By integrating both KDJ and RSI, the RCYC Bullish Bearish Indicator offers a balanced approach to trend detection and momentum confirmation, making it versatile for various trading styles, including scalping, swing trading, and position trading.
Originality and Usefulness:
While the indicator builds upon the familiar concepts of KDJ and RSI, it uniquely merges them into a cohesive visual tool with distinct crossover-based alerts and candle coloring.
This approach makes the indicator original, as it simplifies the interpretation of complex signals into straightforward visual cues, enhancing the decision-making process for traders who prefer chart-based analysis.

Uptrick: Momentum-Volatility Composite Signal### Title: Uptrick: Momentum-Volatility Composite Signal
### Overview
The "Uptrick: Momentum-Volatility Composite Signal" is an innovative trading tool designed to offer traders a sophisticated synthesis of momentum, volatility, volume flow, and trend detection into a single comprehensive indicator. This tool stands out by providing an integrated view of market dynamics, which is critical for identifying potential trading opportunities with greater precision and confidence. Its unique approach differentiates it from traditional indicators available on the TradingView platform, making it a valuable asset for traders aiming to enhance their market analysis.
### Unique Features
This indicator integrates multiple crucial elements of market behavior:
- Momentum Analysis : Utilizes Rate of Change (ROC) metrics to assess the speed and strength of market movements.
- Volatility Tracking : Incorporates Average True Range (ATR) metrics to measure market volatility, aiding in risk assessment.
- Volume Flow Analysis : Analyzes shifts in volume to detect buying or selling pressure, adding depth to market understanding.
- Trend Detection : Uses the difference between short-term and long-term Exponential Moving Averages (EMA) to detect market trends, providing insights into potential reversals or confirmations.
Customization and Inputs
The Uptrick indicator offers a variety of user-defined settings tailored to fit different trading styles and strategies, enhancing its adaptability across various market conditions:
Rate of Change Length (rocLength) : This setting defines the period over which momentum is calculated. Shorter periods may be preferred by day traders who need to respond quickly to market changes, while longer periods could be better suited for position traders looking at more extended trends.
ATR Length (atrLength) : Adjusts the timeframe for assessing volatility. A shorter ATR length can help day traders manage the quick shifts in market volatility, whereas longer lengths might be more applicable for swing or position traders who deal with longer-term market movements.
Volume Flow Length (volumeFlowLength): Determines the analysis period for volume flow to identify buying or selling pressure. Day traders might opt for shorter periods to catch rapid volume changes, while longer periods could serve swing traders to understand the accumulation or distribution phases better.
Short EMA Length (shortEmaLength): Specifies the period for the short-term EMA, crucial for trend detection. Shorter lengths can aid day traders in spotting immediate trend shifts, whereas longer lengths might help swing traders in identifying more sustainable trend changes.
Long EMA Length (longEmaLength): Sets the period for the long-term EMA, which is useful for observing longer-term market trends. This setting is particularly valuable for position traders who need to align with the broader market direction.
Composite Signal Moving Average Length (maLength): This parameter sets the smoothing period for the composite signal's moving average, helping to reduce noise in the signal output. A shorter moving average length can be beneficial for day traders reacting to market conditions swiftly, while a longer length might help swing and position traders in smoothing out less significant fluctuations to focus on significant trends.
These customization options ensure that traders can fine-tune the Uptrick indicator to their specific trading needs, whether they are scanning for quick opportunities or analyzing more prolonged market trends.
### Functionality Details
The indicator operates through a sophisticated algorithm that integrates multiple market dimensions:
1. Momentum and Volatility Calculation : Combines ROC and ATR to gauge the market’s momentum and stability.
2. Volume and Trend Analysis : Integrates volume data with EMAs to provide a comprehensive view of current market trends and potential shifts.
3. Signal Composite : Each component is normalized and combined into a composite signal, offering traders a nuanced perspective on when to enter or exit trades.
The indicator performs its calculations as follows:
Momentum and Volatility Calculation:
roc = ta.roc(close, rocLength)
atr = ta.atr(atrLength)
Volume and Trend Analysis:
volumeFlow = ta.cum(volume) - ta.ema(ta.cum(volume), volumeFlowLength)
emaShort = ta.ema(close, shortEmaLength)
emaLong = ta.ema(close, longEmaLength)
emaDifference = emaShort - emaLong
Composite Signal Calculation:
Normalizes each component (ROC, ATR, volume flow, EMA difference) and combines them into a composite signal:
rocNorm = (roc - ta.sma(roc, rocLength)) / ta.stdev(roc, rocLength)
atrNorm = (atr - ta.sma(atr, atrLength)) / ta.stdev(atr, atrLength)
volumeFlowNorm = (volumeFlow - ta.sma(volumeFlow, volumeFlowLength)) / ta.stdev(volumeFlow, volumeFlowLength)
emaDiffNorm = (emaDifference - ta.sma(emaDifference, longEmaLength)) / ta.stdev(emaDifference, longEmaLength)
compositeSignal = (rocNorm + atrNorm + volumeFlowNorm + emaDiffNorm) / 4
### Originality
The originality of the Uptrick indicator lies in its ability to merge diverse market metrics into a unified signal. This multi-faceted approach goes beyond traditional indicators by offering a deeper, more holistic analysis of market conditions, providing traders with insights that are not only based on price movements but also on underlying market dynamics.
### Practical Application
The Uptrick indicator excels in environments where understanding the interplay between volume, momentum, and volatility is crucial. It is especially useful for:
- Day Traders : Can leverage real-time data to make quick decisions based on sudden market changes.
- Swing Traders : Benefit from understanding medium-term trends to optimize entry and exit points.
- Position Traders : Utilize long-term market trend data to align with overall market movements.
### Best Practices
To maximize the effectiveness of the Uptrick indicator, consider the following:
- Combine with Other Indicators : Use alongside other technical tools like RSI or MACD for additional validation.
- Adapt Settings to Market Conditions : Adjust the indicator settings based on the asset and market volatility to improve signal accuracy.
- Risk Management : Implement robust risk management strategies, including setting stop-loss orders based on the volatility measured by the ATR.
### Practical Examples and Demonstrations
- Example for Day Trading : In a volatile market, a trader notices a sharp increase in the momentum score coinciding with a surge in volume but stable volatility, signaling a potential bullish breakout.
- Example for Swing Trading : On a 4-hour chart, the indicator shows a gradual alignment of decreasing volatility and increasing buying volume, suggesting a strengthening upward trend suitable for a long position.
### Alerts and Their Uses
- Alert Configurations : Set alerts for when the composite score crosses predefined thresholds to capture potential buy or sell events.
- Strategic Application : Use alerts to stay informed of significant market moves without the need to continuously monitor the markets, enabling timely and informed trading decisions.
Technical Notes
Efficiency and Compatibility: The indicator is designed for efficiency, running smoothly across different trading platforms including TradingView, and can be easily integrated with existing trading setups. It leverages advanced mathematical models for normalizing and smoothing data, ensuring consistent and reliable signal quality across different market conditions.
Limitations : The effectiveness of the Uptrick indicator can vary significantly across different market conditions and asset classes. It is designed to perform best in liquid markets where data on volume, volatility, and price trends are readily available and reliable. Traders should be aware that in low-liquidity or highly volatile markets, the signals might be less reliable and require additional confirmation.
Usage Recommendations : While the Uptrick indicator is a powerful tool, it is recommended to use it in conjunction with other analysis methods to confirm signals. Traders should also continuously monitor the performance and adjust settings as needed to align with their specific trading strategies and market conditions.
### Conclusion
The "Uptrick: Momentum-Volatility Composite Signal" is a revolutionary tool that offers traders an advanced methodology for analyzing market dynamics. By combining momentum, volatility, volume, and trend detection into a single, cohesive indicator, it provides a powerful, actionable insight into market movements, making it an indispensable tool for traders aiming to optimize their trading strategies.

Lsma For Loop | viResearchLsma For Loop | viResearch
Conceptual Foundation and Innovation
The "Lsma For Loop" indicator offers a unique combination of the Least Squares Moving Average (LSMA) with a dynamic scoring system based on a loop function. By comparing the current LSMA value with historical values over a user-defined range, this indicator generates a detailed score that helps detect trend strength and potential reversals. This approach provides traders with a more nuanced analysis of price action, allowing them to identify trends earlier and with more accuracy.
The LSMA, which minimizes lag compared to traditional moving averages, is ideal for detecting trends as it provides a smooth and quick-to-respond line. When combined with the loop-based scoring system, traders can benefit from a powerful tool for analyzing market momentum and capturing profitable trends.
Technical Composition and Calculation
The "Lsma For Loop" script features two essential components:
Least Squares Moving Average (LSMA): The LSMA is calculated over a user-defined length using a linear regression model. It provides a smooth line that follows price trends more closely, reducing the noise that is often present in simple moving averages.
For Loop Scoring System: This system evaluates the LSMA over a range of previous values, generating a score based on whether the current LSMA is higher or lower than its previous values within the specified range. The resulting score reflects the strength of the trend, with higher scores indicating a stronger uptrend and lower scores signaling a downtrend.
Key Calculations:
LSMA Calculation: The LSMA is derived from the closing price over the selected period (len), providing a smooth moving average that fits the price data closely.
For Loop Scoring:
The loop iterates over a range of previous LSMA values, comparing the current LSMA to each past value.
If the current LSMA is higher than a previous value, a positive score is added; if it is lower, a negative score is added. The sum of these comparisons forms the overall score.
Features and User Inputs
The "Lsma For Loop" script offers a range of customization options, allowing traders to tailor the indicator to their specific trading strategies and market conditions:
LSMA Length: Adjust the length of the LSMA, controlling the smoothness of the indicator and how quickly it reacts to price changes.
Loop Range (From and To): Define the range over which the for loop evaluates LSMA values. This provides flexibility in assessing momentum over different timeframes.
Thresholds: Customizable threshold levels are used to define when the score indicates an uptrend or downtrend. This allows traders to fine-tune the sensitivity of the indicator to market movements.
Practical Applications
The "Lsma For Loop" is a versatile tool for traders who want to leverage the advantages of LSMA smoothing while gaining a more detailed view of trend strength. This indicator is particularly useful for:
Identifying Trend Reversals: The loop-based scoring system provides an early indication of potential trend reversals, allowing traders to react before major market movements.
Confirming Trend Strength: By evaluating the LSMA against a range of previous values, the script helps confirm whether a trend is strengthening or weakening.
Enhanced Market Positioning: The customizable range and thresholds enable traders to adapt the script to different market conditions, whether they are day trading or swing trading.
Advantages and Strategic Value
The primary advantage of the "Lsma For Loop" script lies in its ability to provide a more granular analysis of LSMA behavior through the use of the for loop. This dynamic approach reduces the likelihood of false signals and offers greater accuracy in detecting trends. The indicator’s versatility makes it a valuable tool for both short-term and long-term trading strategies.
Alerts and Visual Cues
The script includes built-in alert conditions to notify traders of key trend changes:
Lsma For Loop Long: Indicates a potential upward trend when the score exceeds the upper threshold.
Lsma For Loop Short: Signals a potential downward trend when the score falls below the lower threshold.
Additionally, visual cues such as background color changes highlight when the score crosses certain key levels, providing an easy-to-read representation of market trends directly on the chart.
Summary and Usage Tips
The "Lsma For Loop | viResearch" indicator provides traders with a powerful tool that combines LSMA smoothing with a dynamic loop-based scoring system for trend detection. Incorporating this script into your trading strategy can help improve trend identification and enhance decision-making around entries and exits. Whether you are trading in trending markets or looking for early reversal signals, this script offers a reliable and flexible solution.
Note: Backtests are based on past results and are not indicative of future performance.
