Gold Trade Setup Strategy
Title: Profitable Gold Setup Strategy with Adaptive Moving Average & Supertrend
Introduction:
This trading strategy for Gold (XAU/USD) combines the Adaptive Moving Average (AMA) and Supertrend, tailored for high-probability setups during specific trading hours. The AMA identifies the trend, while the Supertrend confirms entry and exit points. The strategy is optimized for swing and intraday traders looking to capitalize on Gold’s price movements with precise trade timing.
Strategy Components:
1. Adaptive Moving Average (AMA):
• Reacts dynamically to market conditions, filtering noise in choppy markets.
• Serves as the primary trend indicator.
2. Supertrend:
• Confirms entry signals with clear buy and sell levels.
• Acts as a trailing stop-loss to protect profits.
Trading Rules:
Trading Hours:
• Only take trades between 8:30 AM and 10:30 PM IST.
• Avoid trading outside these hours to reduce noise and low-volume setups.
Buy Setup:
1. Trend Confirmation: The Adaptive Moving Average (AMA) must be green.
2. Signal Confirmation: The Supertrend should turn green after the AMA is green.
3. Trigger: Take the trade when the high of the trigger candle (the candle that turned Supertrend green) is broken.
Sell Setup (Optional if included):
• Reverse the rules for a short trade: AMA and Supertrend should both indicate bearish conditions (red), and take the trade when the low of the trigger candle is broken.
Stop-Loss and Targets:
• Place the stop-loss at the low of the trigger candle for long trades.
• Set a 1:2 risk-reward ratio or use the Supertrend line as a trailing stop-loss.
Timeframes:
• Recommended timeframes: 1H, 4H, or Daily for swing trading.
• For intraday trading, use 15-minute or 30-minute charts.
Why This Strategy Works:
• Combines trend-following (AMA) with momentum-based entries (Supertrend).
• Focused trading hours filter out low-probability setups.
• Provides precise entry, stop-loss, and target levels for disciplined trading.
Conclusion:
This Gold Setup Strategy is designed for traders seeking a structured approach to trading Gold. Follow the rules strictly, backtest the strategy extensively, and share your results. Let’s master the Gold market together!
Tags: #Gold #XAUUSD #SwingTrading #Intraday #Supertrend #AMA #TechnicalAnalysis #GoldStrategy
Cari dalam skrip untuk "swing trading"

Improved G-Trend DetectionIt is the Improved version of G trend channel detection.
The Umair Trend Detection Indicator is a powerful tool designed to help traders identify potential buy and sell opportunities by combining dynamic price channels with RSI-based confirmation. This indicator is suitable for all types of financial markets, including stocks, forex, and cryptocurrencies.
Key Features:
Dynamic G-Channels
Calculates upper, lower, and average price channels based on the "G-Channel" methodology.
Helps identify market extremes and potential reversal points.
RSI Confirmation
Integrates RSI (Relative Strength Index) to filter buy and sell signals.
Avoids false signals by ensuring market momentum aligns with trend direction.
Buy/Sell Signals
Generates "Buy" signals when bullish conditions align with oversold RSI levels.
Generates "Sell" signals when bearish conditions align with overbought RSI levels.
Exit Signals
Provides optional exit points for both long and short positions using a buffer for confirmation.
Visual Clarity
Displays clearly plotted channels and average lines to help visualize price trends.
Buy and sell signals are marked with arrows for easy identification on the chart.
Custom Alerts
Offers customizable alerts for buy, sell, and exit conditions, ensuring traders never miss an opportunity.
Input Parameters:
Channel Length: Controls the sensitivity of the G-Channels.
Multiplier: Adjusts the width of the channels to suit different market conditions.
RSI Settings: Customize RSI length and thresholds for overbought/oversold conditions.
Exit Signal Buffer: Adds flexibility to the exit strategy by delaying signals for confirmation.
How It Helps:
The Umair Trend Detection Indicator is perfect for traders looking for an easy-to-use trend-following system with strong confirmation. By combining dynamic channels with RSI, it provides accurate and reliable signals to enter and exit trades, minimizing risks associated with false breakouts or trend reversals.
Use Cases:
Trend Trading: Identify and follow long-term trends with confidence.
Swing Trading: Spot reversals and capitalize on medium-term price movements.
Risk Management: Use exit signals to lock in profits or limit losses effectively.
This indicator is a versatile tool for both novice and experienced traders. Fine-tune its settings to align with your trading style and improve your decision-making in any market.

Dynamic Signal EngineDynamic Signal Engine
The Dynamic Signal Engine is a powerful and versatile indicator, designed to help traders make informed decisions by combining trend analysis with key support and resistance levels. This tool is inspired by the Linear Regression Oscillator , which laid the foundation for this enhanced implementation. By building on the original concept, this script introduces additional features, customization, and integration with dynamic trading strategies to suit diverse trading styles.
Key Features
Inspiration and Foundation
This indicator draws inspiration from the Linear Regression Oscillator , leveraging its robust trend detection capabilities while adding custom enhancements for broader functionality and user adaptability.
Trading Style Customization
Adaptable for Scalping, Intraday, and Swing Trading with dynamic parameter adjustments for each style.
User-defined inputs for thresholds, lookback periods, and visualization options provide further control.
Enhanced Linear Regression Oscillator (LRO)
A refined implementation of the LRO calculates deviations from a regression line, normalized for improved trend detection.
Identifies bullish and bearish crossovers with added alerts and visual markers.
Includes proximity alerts for critical thresholds to help traders anticipate key market movements.
Dynamic Support and Resistance Integration
Incorporates ENIGMA Signal Logic to identify swing highs and lows, dynamically marking them as fractal support and resistance levels.
When a sell signal from ENIGMA is generated, traders can choose to sell immediately or use the low of the previous candle as the entry point. Similarly, for a buy signal, traders can buy immediately or use the high of the previous candle for entry. These signals are visually indicated by a green triangle for buy signals, ensuring clear and actionable insights.
Advanced Visualization
Displays key levels with customizable horizontal lines (solid, dashed, or dotted) and labels for clarity.
Candle colours and mini arrows highlight trends and potential trading opportunities.
Real-Time Alerts
Alerts for LRO threshold crossings and swing-level breaches keep you updated without the need for constant monitoring.
Optimized for Usability
Designed to keep charts clean by limiting displayed trades and signals to recent activity.
Adjustable parameters ensure flexibility and a user-friendly experience.
How It Works
Trend Detection with Enhanced LRO
The indicator builds on the Linear Regression Oscillator , calculating oscillations of price movements and normalizing them for trend analysis. Crossovers and threshold proximity are visualized on the chart and trigger alerts for potential market shifts.
Dynamic Support and Resistance Levels
The ENIGMA Signal Logic identifies recent swing highs and lows, marking them as key levels. These levels are dynamically updated as new swing points are detected, providing actionable support and resistance zones.
Signal Confirmation
Buy or sell signals are confirmed when:
Price breaches the swing levels.
The LRO aligns with directional bias (e.g., bearish crossover for sell signals).
Signals are further clarified by ENIGMA's green triangle indicators, showing key buy and sell opportunities.
Visualization and Alerts
Signals are displayed using arrows, labelled horizontal lines, and optional candle colours. Alerts notify traders of key events, such as LRO threshold crossings or swing-level breaches.
How to Use
Choose your Trading Style: Scalping, Intraday, or Swing Trading. The indicator adjusts its default settings automatically.
Fine-tune parameters like LRO thresholds, line lengths, and the number of visible trades to suit your preferences.
Observe the chart for signals:
Green arrows and lines indicate buy opportunities.
Red arrows and lines signal sell opportunities.
Use the alert system to stay informed about LRO thresholds and signal confirmations.
Integrate the indicator with your existing trading strategy for better decision-making.
Acknowledgement
This script was inspired by the Linear Regression Oscillator . While it builds on the core concept, this implementation introduces unique enhancements, such as dynamic signal integration, trading style adaptability, and advanced visualization tools, making it a highly customizable and versatile tool for traders.
Disclaimer
This indicator is intended for educational purposes only and should not be considered financial advice. Always perform due diligence and apply appropriate risk management when trading.

Filtered ATR with EMA OverlayFiltered ATR with EMA Overlay is an advanced volatility indicator designed to provide a more accurate representation of market conditions by smoothing the standard Average True Range (ATR). This is achieved by filtering out extreme price movements and abnormal bars that can distort traditional ATR calculations.
The indicator applies an Exponential Moving Average (EMA) to the filtered ATR, creating a dual-layered system that highlights periods of increased or decreased volatility.
Key Features:
Filtered ATR: Filters out extreme bars, reducing noise and making the ATR line more reliable.
EMA Overlay: An EMA (default period of 10) is applied to the filtered ATR, allowing traders to track average volatility trends.
Volatility Signals:
Filtered ATR > EMA(10): Indicates higher-than-average volatility. This often correlates with trend breakouts or strong price movements.
Filtered ATR < EMA(10): Suggests reduced volatility, signaling potential consolidation or sideways price action.
Parameters:
atrLength (Default: 5):
The number of bars used to calculate the ATR. A shorter period (e.g., 3-5) responds faster to price changes, while a longer period (e.g., 10-14) provides smoother results.
multiplier (Default: 1.8):
Controls the sensitivity of the filter. A lower multiplier (e.g., 1.5) filters out more bars, resulting in smoother ATR. Higher values (e.g., 2.0) allow more bars to pass through, retaining more price volatility.
maxIterations (Default: 20):
The maximum number of bars processed to detect abnormal values. Increasing this may improve accuracy at the cost of performance.
ema10Period (Default: 10):
The period for the Exponential Moving Average applied to the filtered ATR. Shorter periods provide faster signals, while longer periods give smoother, lagging signals.
Trading Strategies:
1. Breakout Strategy:
When filtered ATR crosses above EMA(10):
Enter long positions when price breaks above a key resistance level.
Higher volatility suggests strong price action and momentum.
When filtered ATR drops below EMA(10):
Exit positions or tighten stop-loss orders as volatility decreases.
Lower volatility may indicate consolidation or trend exhaustion.
2. Trend Following Strategy:
Use the filtered ATR line to track overall volatility.
If filtered ATR consistently stays above EMA: Hold positions or add to trades.
If filtered ATR remains below EMA: Reduce position size or stay out of trades.
3. Mean Reversion Strategy:
When filtered ATR spikes significantly above EMA, it may indicate market overreaction.
Look for price to revert to the mean once ATR returns below the EMA.
4. Stop-Loss Adjustment:
As volatility increases (ATR above EMA), widen stop-loss levels to avoid being stopped out by random fluctuations.
In low volatility (ATR below EMA), tighten stop-losses to minimize losses during low activity periods.
Benefits:
Reduced Noise: By filtering abnormal bars, the indicator provides cleaner signals.
Better Trend Detection: EMA smoothing highlights volatility trends.
Adaptable: The indicator can be customized for scalping, day trading, or swing trading.
Intuitive Visualization: Traders can visually see volatility shifts and adjust strategies in real-time.
Best Practices:
Timeframes: Works effectively on all timeframes, but higher timeframes (e.g., 1H, 4H, Daily) yield more reliable signals.
Markets: Suitable for forex, crypto, stocks, and commodities.
Combining Indicators: Use in combination with RSI, Moving Averages, Bollinger Bands, or price action analysis for stronger signals.
How It Works (Under the Hood):
The script calculates the Daily Range (High - Low) for each bar.
The largest and smallest bars are filtered out if their difference exceeds the multiplier (default 1.8).
The remaining bars are averaged to generate the filtered ATR.
An EMA(10) is then applied to the filtered ATR for smoother visualization.

TASC 2025.01 Linear Predictive Filters█ OVERVIEW
This script implements a suite of tools for identifying and utilizing dominant cycles in time series data, as introduced by John Ehlers in the "Linear Predictive Filters And Instantaneous Frequency" article featured in the January 2025 edition of TASC's Traders' Tips . Dominant cycle information can help traders adapt their indicators and strategies to changing market conditions.
█ CONCEPTS
Conventional technical indicators and strategies often rely on static, unchanging parameters, which may fail to account for the dynamic nature of market data. In his article, John Ehlers applies digital signal processing principles to address this issue, introducing linear predictive filters to identify cyclic information for adapting indicators and strategies to evolving market conditions.
This approach treats market data as a complex series in the time domain. Analyzing the series in the frequency domain reveals information about its cyclic components. To reduce the impact of frequencies outside a range of interest and focus on a specific range of cycles, Ehlers applies second-order highpass and lowpass filters to the price data, which attenuate or remove wavelengths outside the desired range. This band-limited analysis isolates specific parts of the frequency spectrum for various trading styles, e.g., longer wavelengths for position trading or shorter wavelengths for swing trading.
After filtering the series to produce band-limited data, Ehlers applies a linear predictive filter to predict future values a few bars ahead. The filter, calculated based on the techniques proposed by Lloyd Griffiths, adaptively minimizes the error between the latest data point and prediction, successively adjusting its coefficients to align with the band-limited series. The filter's coefficients can then be applied to generate an adaptive estimate of the band-limited data's structure in the frequency domain and identify the dominant cycle.
█ USAGE
This script implements the following tools presented in the article:
Griffiths Predictor
This tool calculates a linear predictive filter to forecast future data points in band-limited price data. The crosses between the prediction and signal lines can provide potential trade signals.
Griffiths Spectrum
This tool calculates a partial frequency spectrum of the band-limited price data derived from the linear predictive filter's coefficients, displaying a color-coded representation of the frequency information in the pane. This mode's display represents the data as a periodogram . The bottom of each plotted bar corresponds to a specific analyzed period (inverse of frequency), and the bar's color represents the presence of that periodic cycle in the time series relative to the one with the highest presence (i.e., the dominant cycle). Warmer, brighter colors indicate a higher presence of the cycle in the series, whereas darker colors indicate a lower presence.
Griffiths Dominant Cycle
This tool compares the cyclic components within the partial spectrum and identifies the frequency with the highest power, i.e., the dominant cycle . Traders can use this dominant cycle information to tune other indicators and strategies, which may help promote better alignment with dynamic market conditions.
Notes on parameters
Bandpass boundaries:
In the article, Ehlers recommends an upper bound of 125 bars or higher to capture longer-term cycles for position trading. He recommends an upper bound of 40 bars and a lower bound of 18 bars for swing trading. If traders use smaller lower bounds, Ehlers advises a minimum of eight bars to minimize the potential effects of aliasing.
Data length:
The Griffiths predictor can use a relatively small data length, as autocorrelation diminishes rapidly with lag. However, for optimal spectrum and dominant cycle calculations, the length must match or exceed the upper bound of the bandpass filter. Ehlers recommends avoiding excessively long lengths to maintain responsiveness to shorter-term cycles.

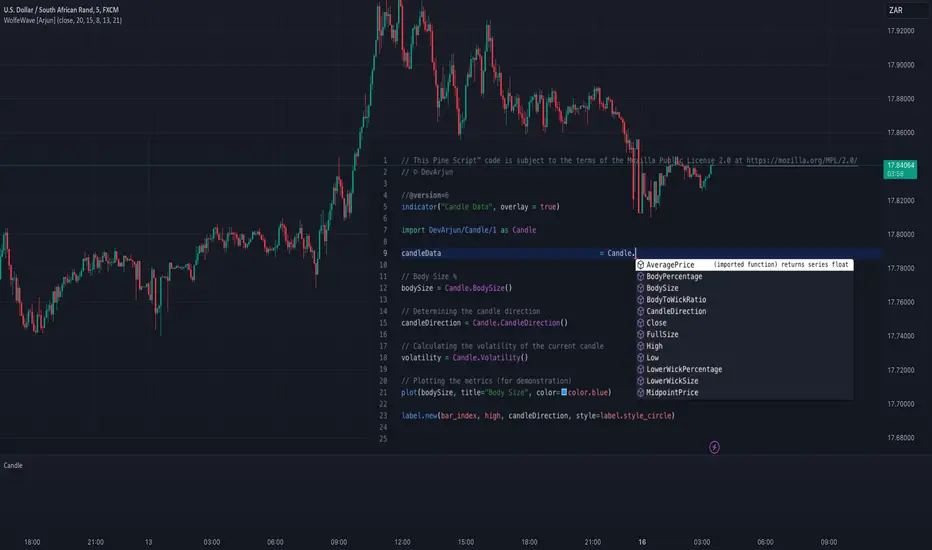
CandleCandle: A Comprehensive Pine Script™ Library for Candlestick Analysis
Overview
The Candle library, developed in Pine Script™, provides traders and developers with a robust toolkit for analyzing candlestick data. By offering easy access to fundamental candlestick components like open, high, low, and close prices, along with advanced derived metrics such as body-to-wick ratios, percentage calculations, and volatility analysis, this library enables detailed insights into market behavior.
This library is ideal for creating custom indicators, trading strategies, and backtesting frameworks, making it a powerful resource for any Pine Script™ developer.
Key Features
1. Core Candlestick Data
• Open : Access the opening price of the current candle.
• High : Retrieve the highest price.
• Low : Retrieve the lowest price.
• Close : Access the closing price.
2. Candle Metrics
• Full Size : Calculates the total range of the candle (high - low).
• Body Size : Computes the size of the candle’s body (open - close).
• Wick Size : Provides the combined size of the upper and lower wicks.
3. Wick and Body Ratios
• Upper Wick Size and Lower Wick Size .
• Body-to-Wick Ratio and Wick-to-Body Ratio .
4. Percentage Calculations
• Upper Wick Percentage : The proportion of the upper wick size relative to the full candle size.
• Lower Wick Percentage : The proportion of the lower wick size relative to the full candle size.
• Body Percentage and Wick Percentage relative to the candle’s range.
5. Candle Direction Analysis
• Determines if a candle is "Bullish" or "Bearish" based on its closing and opening prices.
6. Price Metrics
• Average Price : The mean of the open, high, low, and close prices.
• Midpoint Price : The midpoint between the high and low prices.
7. Volatility Measurement
• Calculates the standard deviation of the OHLC prices, providing a volatility metric for the current candle.
Code Architecture
Example Functionality
The library employs a modular structure, exporting various functions that can be used independently or in combination. For instance:
// This Pine Script™ code is subject to the terms of the Mozilla Public License 2.0 at mozilla.org
// © DevArjun
//@version=6
indicator("Candle Data", overlay = true)
import DevArjun/Candle/1 as Candle
// Body Size %
bodySize = Candle.BodySize()
// Determining the candle direction
candleDirection = Candle.CandleDirection()
// Calculating the volatility of the current candle
volatility = Candle.Volatility()
// Plotting the metrics (for demonstration)
plot(bodySize, title="Body Size", color=color.blue)
label.new(bar_index, high, candleDirection, style=label.style_circle)
Scalability
The modularity of the Candle library allows seamless integration into more extensive trading systems. Functions can be mixed and matched to suit specific analytical or strategic needs.
Use Cases
Trading Strategies
Developers can use the library to create strategies based on candle properties such as:
• Identifying long-bodied candles (momentum signals).
• Detecting wicks as potential reversal zones.
• Filtering trades based on candle ratios.
Visualization
Plotting components like body size, wick size, and directional labels helps visualize market behavior and identify patterns.
Backtesting
By incorporating volatility and ratio metrics, traders can design and test strategies on historical data, ensuring robust performance before live trading.
Education
This library is a great tool for teaching candlestick analysis and how each component contributes to market behavior.
Portfolio Highlights
Project Objective
To create a Pine Script™ library that simplifies candlestick analysis by providing comprehensive metrics and insights, empowering traders and developers with advanced tools for market analysis.
Development Challenges and Solutions
• Challenge : Achieving high precision in calculating ratios and percentages.
• Solution : Implemented robust mathematical operations and safeguarded against division-by-zero errors.
• Challenge : Ensuring modularity and scalability.
• Solution : Designed functions as independent modules, allowing flexible integration.
Impact
• Efficiency : The library reduces the time required to calculate complex candlestick metrics.
• Versatility : Supports various trading styles, from scalping to swing trading.
• Clarity : Clean code and detailed documentation ensure usability for developers of all levels.
Conclusion
The Candle library exemplifies the power of Pine Script™ in simplifying and enhancing candlestick analysis. By including this project in your portfolio, you showcase your expertise in:
• Financial data analysis.
• Pine Script™ development.
• Creating tools that solve real-world trading challenges.
This project demonstrates both technical proficiency and a keen understanding of market analysis, making it an excellent addition to your professional portfolio.
Library "Candle"
A comprehensive library to access and analyze the basic components of a candlestick, including open, high, low, close prices, and various derived metrics such as full size, body size, wick sizes, ratios, percentages, and additional analysis metrics.
Open()
Open
@description Returns the opening price of the current candle.
Returns: float - The opening price of the current candle.
High()
High
@description Returns the highest price of the current candle.
Returns: float - The highest price of the current candle.
Low()
Low
@description Returns the lowest price of the current candle.
Returns: float - The lowest price of the current candle.
Close()
Close
@description Returns the closing price of the current candle.
Returns: float - The closing price of the current candle.
FullSize()
FullSize
@description Returns the full size (range) of the current candle (high - low).
Returns: float - The full size of the current candle.
BodySize()
BodySize
@description Returns the body size of the current candle (open - close).
Returns: float - The body size of the current candle.
WickSize()
WickSize
@description Returns the size of the wicks of the current candle (full size - body size).
Returns: float - The size of the wicks of the current candle.
UpperWickSize()
UpperWickSize
@description Returns the size of the upper wick of the current candle.
Returns: float - The size of the upper wick of the current candle.
LowerWickSize()
LowerWickSize
@description Returns the size of the lower wick of the current candle.
Returns: float - The size of the lower wick of the current candle.
BodyToWickRatio()
BodyToWickRatio
@description Returns the ratio of the body size to the wick size of the current candle.
Returns: float - The body to wick ratio of the current candle.
UpperWickPercentage()
UpperWickPercentage
@description Returns the percentage of the upper wick size relative to the full size of the current candle.
Returns: float - The percentage of the upper wick size relative to the full size of the current candle.
LowerWickPercentage()
LowerWickPercentage
@description Returns the percentage of the lower wick size relative to the full size of the current candle.
Returns: float - The percentage of the lower wick size relative to the full size of the current candle.
WickToBodyRatio()
WickToBodyRatio
@description Returns the ratio of the wick size to the body size of the current candle.
Returns: float - The wick to body ratio of the current candle.
BodyPercentage()
BodyPercentage
@description Returns the percentage of the body size relative to the full size of the current candle.
Returns: float - The percentage of the body size relative to the full size of the current candle.
WickPercentage()
WickPercentage
@description Returns the percentage of the wick size relative to the full size of the current candle.
Returns: float - The percentage of the wick size relative to the full size of the current candle.
CandleDirection()
CandleDirection
@description Returns the direction of the current candle.
Returns: string - "Bullish" if the candle is bullish, "Bearish" if the candle is bearish.
AveragePrice()
AveragePrice
@description Returns the average price of the current candle (mean of open, high, low, and close).
Returns: float - The average price of the current candle.
MidpointPrice()
MidpointPrice
@description Returns the midpoint price of the current candle (mean of high and low).
Returns: float - The midpoint price of the current candle.
Volatility()
Volatility
@description Returns the standard deviation of the OHLC prices of the current candle.
Returns: float - The volatility of the current candle.
Multi VWAPThe Multi-VWAP Indicator is a versatile tool designed to plot up to three Volume Weighted Average Price (VWAP) lines simultaneously, each anchored to a user-defined period. This indicator provides traders with a comprehensive view of price action across multiple timeframes, making it ideal for analyzing trends, support, and resistance levels.
Key Features:
Multiple Anchoring Options:
Each VWAP can be independently anchored to one of the following periods:
Session: Resets at the start of each trading day.
Week: Resets at the start of each week.
Month: Resets at the start of each month.
Quarter: Resets at the start of each quarter.
Year: Resets at the start of each year.
User Customization:
Choose the anchoring period for each VWAP line via dropdown menus.
Assign distinct colors to each VWAP for better visual differentiation.
Dynamic Price Source:
The VWAP calculation is based on the average price (hlc3) by default but can be modified by the user to use other price inputs.
Clear Visualization:
Displays three separate VWAP lines simultaneously, helping traders identify confluences or divergences in price action across timeframes.
Use Cases:
Intraday Trading: Use session-anchored VWAP to track intraday trends and mean reversion points.
Swing Trading: Combine weekly and monthly VWAPs to identify longer-term support and resistance levels.
Multi-Timeframe Analysis: Visualize how price interacts with VWAPs from different periods to spot key zones of interest.
This indicator is a powerful tool for traders who want to incorporate VWAP into their strategies while maintaining flexibility to adapt to various market conditions.

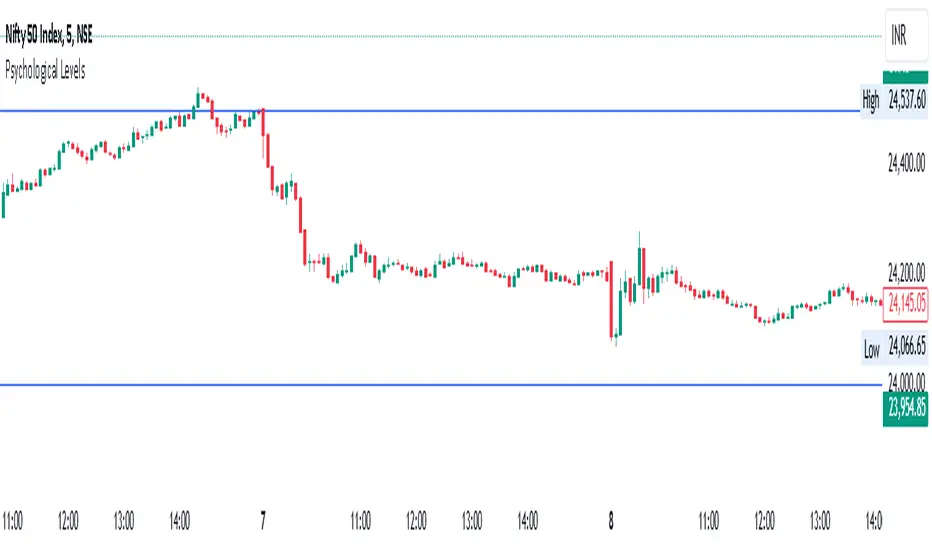
Psychological Levels- Rounding Numbers Psychological Levels Indicator
Overview:
The Psychological Levels Indicator automatically identifies and plots significant price levels based on psychological thresholds, which are key areas where market participants often focus their attention. These levels act as potential support or resistance zones due to human behavioral tendencies to round off numbers. This indicator dynamically adjusts the levels based on the stock's price range and ensures seamless visibility across the chart.
Key Features:
Dynamic Step Sizes:
The indicator adjusts the levels dynamically based on the stock price:
For prices below 500: Levels are spaced at 10.
For prices between 500 and 3000: Levels are spaced at 50, 100, and 1000.
For prices between 3000 and 10,000: Levels are spaced at 100 and 1000.
For prices above 10,000: Levels are spaced at 500 and 1000.
Extended Visibility:
The plotted levels are extended across the entire chart for improved visualization, ensuring traders can easily monitor these critical zones over time.
Customization Options:
Line Color: Choose the color for the levels to suit your charting style.
Line Style: Select from solid, dashed, or dotted lines.
Line Width: Adjust the thickness of the lines for better clarity.
Clean and Efficient Design:
The indicator only plots levels relevant to the visible chart range, avoiding unnecessary clutter and ensuring a clean workspace.
How It Works:
It calculates the relevant step sizes based on the price:
Smaller step sizes for lower-priced stocks.
Larger step sizes for higher-priced stocks.
Primary, secondary, and (if applicable) tertiary levels are plotted dynamically:
Primary Levels: The most granular levels based on the stock price.
Secondary Levels: Higher-order levels for broader significance.
Tertiary Levels: Additional levels for lower-priced stocks to enhance detail.
These levels are plotted across the chart, allowing traders to visualize key psychological areas effortlessly.
Use Cases:
Day Trading: Identify potential intraday support and resistance levels.
Swing Trading: Recognize key price zones where trends may pause or reverse.
Long-Term Investing: Gain insights into significant price zones for entry or exit strategies.
Historical High/Lows Statistical Analysis(More Timeframe interval options coming in the future)
Indicator Description
The Hourly and Weekly High/Low (H/L) Analysis indicator provides a powerful tool for tracking the most frequent high and low points during different periods, specifically on an hourly basis and a weekly basis, broken down by the days of the week (DOTW). This indicator is particularly useful for traders seeking to understand historical behavior and patterns of high/low occurrences across both hourly intervals and weekly days, helping them make more informed decisions based on historical data.
With its customizable options, this indicator is versatile and applicable to a variety of trading strategies, ranging from intraday to swing trading. It is designed to meet the needs of both novice and experienced traders.
Key Features
Hourly High/Low Analysis:
Tracks and displays the frequency of hourly high and low occurrences across a user-defined date range.
Enables traders to identify which hours of the day are historically more likely to set highs or lows, offering valuable insights into intraday price action.
Customizable options for:
Hourly session start and end times.
22-hour session support for futures traders.
Hourly label formatting (e.g., 12-hour or 24-hour format).
Table position, size, and design flexibility.
Weekly High/Low Analysis by Day of the Week (DOTW):
Captures weekly high and low occurrences for each day of the week.
Allows traders to evaluate which days are most likely to produce highs or lows during the week, providing insights into weekly price movement tendencies.
Displays the aggregated counts of highs and lows for each day in a clean, customizable table format.
Options for hiding specific days (e.g., weekends) and customizing table appearance.
User-Friendly Table Display:
Both hourly and weekly data are displayed in separate tables, ensuring clarity and non-interference.
Tables can be positioned on the chart according to user preferences and are designed to be visually appealing yet highly informative.
Customizable Date Range:
Users can specify a start and end date for the analysis, allowing them to focus on specific periods of interest.
Possible Uses
Intraday Traders (Hourly Analysis):
Analyze hourly price action to determine which hours are more likely to produce highs or lows.
Identify intraday trading opportunities during statistically significant time intervals.
Use hourly insights to time entries and exits more effectively.
Swing Traders (Weekly DOTW Analysis):
Evaluate weekly price patterns by identifying which days of the week are more likely to set highs or lows.
Plan trades around days that historically exhibit strong movements or price reversals.
Futures and Forex Traders:
Use the 22-hour session feature to exclude the CME break or other session-specific gaps from analysis.
Combine hourly and DOTW insights to optimize strategies for continuous markets.
Data-Driven Trading Strategies:
Use historical high/low data to test and refine trading strategies.
Quantify market tendencies and evaluate whether observed patterns align with your strategy's assumptions.
How the Indicator Works
Hourly H/L Analysis:
The indicator calculates the highest and lowest prices for each hour in the specified date range.
Each hourly high and low occurrence is recorded and aggregated into a table, with counts displayed for all 24 hours.
Users can toggle the visibility of empty cells (hours with no high/low occurrences) and adjust the table's design to suit their preferences.
Supports both 12-hour (AM/PM) and 24-hour formats.
Weekly H/L DOTW Analysis:
The indicator tracks the highest and lowest prices for each day of the week during the user-specified date range.
Highs and lows are identified for the entire week, and the specific days when they occur are recorded.
Counts for each day are aggregated and displayed in a table, with a "Totals" column summarizing the overall occurrences.
The analysis resets weekly, ensuring accurate tracking of high/low days.
Code Breakdown:
Data Aggregation:
The script uses arrays to store counts of high/low occurrences for both hourly and weekly intervals.
Daily data is fetched using the request.security() function, ensuring consistent results regardless of the chart's timeframe.
Weekly Reset Mechanism:
Weekly high/low values are reset at the start of a new week (Monday) to ensure accurate weekly tracking.
A processing flag ensures that weekly data is counted only once at the end of the week (Sunday).
Table Visualization:
Tables are created using the table.new() function, with customizable styles and positions.
Header rows, data rows, and totals are dynamically populated based on the aggregated data.
User Inputs:
Customization options include text colors, background colors, table positioning, label formatting, and date ranges.
Code Explanation
The script is structured into two main sections:
Hourly H/L Analysis:
This section captures and aggregates high/low occurrences for each hour of the day.
The logic is session-aware, allowing users to define custom session times (e.g., 22-hour futures sessions).
Data is displayed in a clean table format with hourly labels.
Weekly H/L DOTW Analysis:
This section tracks weekly highs and lows by day of the week.
Highs and lows are identified for each week, and counts are updated only once per week to prevent duplication.
A user-friendly table displays the counts for each day of the week, along with totals.
Both sections are completely independent of each other to avoid interference. This ensures that enabling or disabling one section does not impact the functionality of the other.
Customization Options
For Hourly Analysis:
Toggle hourly table visibility.
Choose session start and end times.
Select hourly label format (12-hour or 24-hour).
Customize table appearance (colors, position, text size).
For Weekly DOTW Analysis:
Toggle DOTW table visibility.
Choose which days to include (e.g., hide weekends).
Customize table appearance (colors, position, text size).
Select values format (percentages or occurrences).
Conclusion
The Hourly and Weekly H/L Analysis indicator is a versatile tool designed to empower traders with data-driven insights into intraday and weekly market tendencies. Its highly customizable design ensures compatibility with various trading styles and instruments, making it an essential addition to any trader's toolkit.
With its focus on accuracy, clarity, and customization, this indicator adheres to TradingView's guidelines, ensuring a robust and valuable user experience.

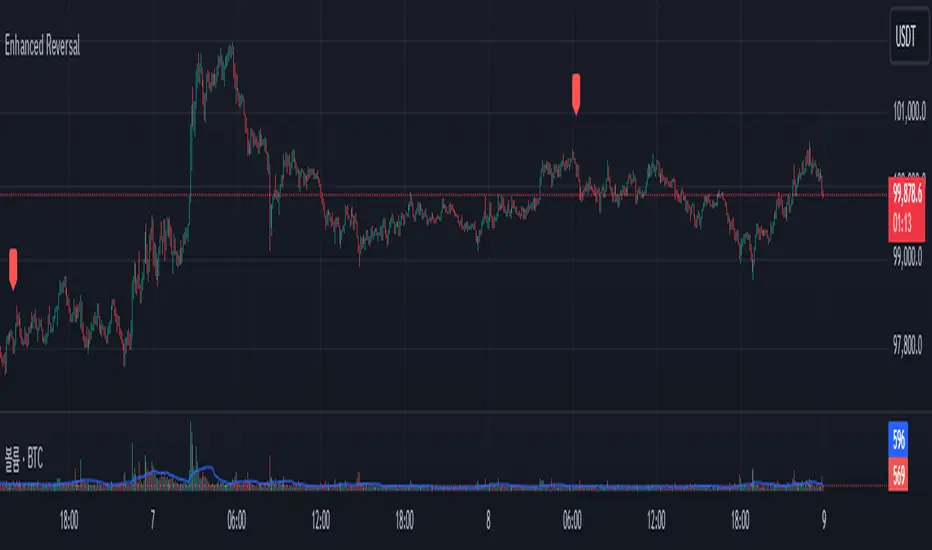
Enhanced Reversal DetectorEnhanced Reversal Detector - Script Description
Overview:
The Enhanced Reversal Detector is a highly refined indicator designed to identify precise trend reversals in financial markets. It improves upon the original reversal detection logic by incorporating additional filters for trend confirmation (using EMA), volume spikes, and candle patterns. These enhancements significantly increase the reliability and accuracy of reversal signals, making it an excellent tool for both short-term and long-term traders.
Key Features
Candle Lookback Logic:
The indicator evaluates historical price action over a user-defined lookback period to detect potential reversal zones.
Bullish reversal conditions are met when price consistently tests lows, and bearish reversal conditions are met when price tests highs.
Trend Confirmation (EMA Filter):
To ensure that reversal signals align with the broader market trend, the indicator incorporates an Exponential Moving Average (EMA) filter.
Bullish signals are only triggered when the price is above the EMA, while bearish signals are only triggered when the price is below the EMA.
Volume Spike Filter:
The indicator checks for significant increases in trading volume to confirm that the reversal is supported by strong market activity.
Volume spikes are calculated as trading volume exceeding a multiple of the 20-bar average volume (default: 1.5x).
Confirmation Period:
Users can define a confirmation window within which reversal signals must be validated.
This reduces false positives and ensures only strong reversals are considered.
Non-Repainting Mode:
Offers a non-repainting option, where signals are based on confirmed conditions from previous bars, ensuring reliability for backtesting.
Visual and Alert Features:
Clear visual markers on the chart indicate bullish (green triangle) and bearish (red triangle) reversal points.
Alert notifications can be enabled for both bullish and bearish reversals, keeping traders informed in real-time.
Inputs
Candle Lookback: Number of candles to evaluate for reversal conditions.
Confirm Within: Number of candles within which a reversal must be validated.
Non-Repainting Mode: Option to enable or disable repainting for signals.
EMA Length: The length of the Exponential Moving Average used for trend confirmation.
Volume Spike Multiplier: Multiplier for identifying significant increases in trading volume.
How It Works
Reversal Detection:
Bullish signals are triggered when:
Price consistently tests recent lows (lookback period).
Price closes above the EMA.
A significant volume spike occurs.
Bearish signals are triggered under opposite conditions (price testing highs, closing below EMA, and volume spike).
Signal Filtering:
Incorporates EMA and volume-based filters to eliminate false positives and focus on high-confidence reversal signals.
Alert Notifications:
Alerts notify users of bullish or bearish reversal opportunities as soon as they are detected.
Use Cases
Scalping and Day Trading:
Ideal for identifying reversals on lower timeframes (e.g., 1-minute or 5-minute charts).
Swing Trading:
Works effectively on higher timeframes (e.g., 1-hour or daily charts) for capturing significant
trend reversals.
Volatile Markets:
Particularly useful in high-volatility markets like cryptocurrencies or forex.
Customization Tips
Adjust the lookback period to fine-tune the sensitivity of the reversal detection.
Increase the volume spike multiplier for markets with irregular trading volumes to focus on significant moves.
Experiment with the EMA length to align signals with your trading strategy's preferred trend duration.
Conclusion
The Enhanced Reversal Detector combines advanced price action analysis, trend confirmation, and market participation filters to deliver high-accuracy reversal signals. With its customizable settings and robust filtering mechanisms, this indicator is an invaluable tool for identifying profitable trading opportunities while minimizing noise and false signals.
100s Level LinesPurpose of the Script
- Visualize Key Levels: The script highlights round-number levels (e.g., 100, 200, 300) automatically, making it easy to identify areas where price action might react.
- Improve Decision-Making: These levels can serve as benchmarks for entry, exit, stop-loss, or take-profit placement.
- Simplicity: Instead of manually drawing levels, the script dynamically updates to match the chart's price range.
Features of the Script
- Dynamic Level Calculation: The script calculates 100s levels based on the asset's current price range and plots lines above and below the visible chart area.
- Customizable Settings: Adjust line color, style (solid, dashed, or dotted), and width to suit your charting preferences.
- Auto-Scaling: Automatically adjusts to the chart's visible price range, ensuring plotted levels are always relevant.
- Labeling: Each line can optionally display its exact value (e.g., "1400," "1500") for easy reference.
- Performance Optimization: Efficient calculations ensure the script doesn’t slow down TradingView, even on volatile instruments like the US100.
How the Script Works
- The script detects the highest and lowest visible prices on the chart to define the range.
- Starting from the lowest 100-point increment within the visible range, the script calculates all 100-point levels up to the highest visible price.
- It plots horizontal lines across the chart for each calculated level.
- Optionally, labels can be added to display the value of each level.
How to Use the Script
- Copy the script code into the Pine Script editor in TradingView and apply it to your chart.
- Open the script settings to adjust line color, style, width, and label visibility.
- Use the plotted 100s levels as psychological support and resistance zones for trade entries, exits, and stop-loss or take-profit placement.
Example Use Cases
- Identify potential reversal points as the price approaches a 100s level in intraday trading.
- Confirm support or resistance zones on higher timeframes for swing trading setups.
- Use the levels to trail stop-losses during trending markets and lock in profits incrementally.
Customizable Options
- Line Color: Change the color of the horizontal lines.
- Line Style: Choose solid, dashed, or dotted lines.
- Line Width: Adjust the thickness of the lines for better visibility.
- Show Labels: Toggle price values on or off for each level.
Advantages
- Saves Time: Automatically plots levels, eliminating manual effort.
- Adaptable: Works on all timeframes and assets.
- Psychological Relevance: Highlights levels that align with trader psychology and market behavior.

Structure Pilot Vision [Wang Indicators]Built and refined with Dave Teaches, the HTF Vision Pro supercharges the trader, providing them with the tools to approach price with a layered analysis.
Providing the trader the instruments to put on the spotlight significant zones to anticipate price deliveries
HTF CANDLE VISION
Displays up to 3 series of HTF Candles
Shows candlesticks from a higher time frame (e.g., daily, 4-hour, weekly) on a lower time frame chart (e.g., 1-hour, 15-minute). This allows traders to simultaneously observe both short-term and long-term market dynamics.
Customizable Time Frames: Users can select any higher time frame to overlay on the current chart. Common time frames include daily, weekly, and monthly candles, but other custom time frames can also be used.
Color Coding: The HTF candles are color-coded for easy differentiation from the lower time frame candles. Users can customize colors to suit their preferences.
Open, High, Low, Close (OHLC) Representation: The indicator displays the full candlestick pattern for the chosen HTF, including the open, high, low, and close values. This helps traders easily identify key price levels and trends.
Settings :
Number of candles
Space between the chart and the HTF candles
Space between candles sets
Size : from Tiny (2x regular candle size) to Large (x8 regular candle size)
Space between candles
Colors of candles, borders and wicks
Incorporating a Higher Time Frame (HTF) candle into your Lower Time Frame (LTF) chart can be immensely beneficial for traders looking to enhance their analysis and decision-making process.
Use Cases for HTF Candles on LTF Charts:
Trend Confirmation:
Use Case: A trader might be looking at a 15-minute chart (LTF) but wants to confirm if the short-term trends align with the daily trend (HTF). Plotting a daily candle on the 15-minute chart helps visualize whether the short-term movements are part of a broader, longer-term trend.
Support and Resistance Identification:
Use Case: By plotting a weekly candle on a daily chart, traders can quickly identify levels that have acted as significant support or resistance in the past on the higher time frame, which might not be as visible or influential on the daily chart alone.
Entry and Exit Points Enhancement:
Use Case: When preparing to enter a trade based on a 1-hour chart, overlaying a 4-hour candle can provide insights into potential reversal points or continuation patterns that are more significant on the higher time frame, thus refining entry and exit strategies.
Volatility and Breakout Analysis:
Use Case: Seeing how a single HTF candle (like a monthly candle on a weekly chart) closes can give traders an idea of the market's volatility or the strength behind breakouts. A long wick on the HTF candle might suggest a rejected breakout or a potential reversal.
Risk Management:
Use Case: Using an HTF candle can help set more informed stop-loss levels. For instance, if a trader uses a 4-hour candle on a 1-hour chart, they might place their stop-loss just beyond the low of the HTF candle, assuming this represents a significant level of support or resistance.
Contextual Trading Decisions:
Use Case: For scalpers or day traders, understanding where the current price action sits within the context of a higher timeframe can lead to better decision-making. For instance, trading within an HTF consolidation range might suggest less aggressive moves, while being near the top or bottom of such a range might indicate potential for larger movements.
Market Sentiment Analysis:
Use Case: The color (red for bearish, green for bullish) and size of the HTF candle can give a quick visual cue of the market sentiment over that period, helping traders assess whether they are going with or against the broader market flow.
Swing Trading:
Use Case: Swing traders might plot a weekly candle on a daily chart to align their trades with the direction of the weekly trend, ensuring they're not fighting the broader market momentum.
Educational and Visual Reference:
Use Case: For educational purposes, having an HTF candle overlay can serve as a visual reminder for students or new traders about how price movements on different time frames can influence each other, aiding in teaching concepts like "the trend is your friend."
Wang use cases :
The way it is intended to be used is as follow
If you trade the 1 min chart and have a set of 5 min HTF candles plotted on your charts it could be used as follow :
As long as the 5 min keep providing close below the last 5 min candle if you're short you're safe ... if the 5 min candle stop closing below the last ones and start giving up-close you should consider closing your trade
Another use of HTF Candle is to find fractals responsible (up or down internal mouv before the breakout that creates a new zone). This fractal acts as supply and demand zone responsible for maintening the trend or for a reversal.
See examples below :
These fractals are interesting zones because they often cause the price to react, so following a flip in the fractal, you can take a short in bearish zones and a long in bullish zones. Fractals are easier to detect thanks to the HTF candles function, and allow you to enter positions with greater confidence. They can be used in the same way as the 70%, 50% and 30% interest zones, or they can be used simultaneously.
Use with zones :
▫️ VERTICAL BARS VISION ▫️
The vertical bars provide a view of market fractality: on a low time frame chart, they show the size of a candle in a higher time frame, and thus give a better understanding of the price fractality essential to the strategy we use.
Example :
For your information, when you modify data in the vertical bars or HTF candles parameters, the two are synchronized automatically.
The Vertical HTF Candle Closures Indicator is a simple yet effective tool that helps traders visually track the closing times of higher time frame (HTF) candles (such as 4H, 1H, 15M) on a lower time frame chart (e.g., 1-minute).
This feature plots vertical lines on the chart at the exact closure time of each selected HTF, allowing traders to quickly recognize key moments when the HTF candles close, or better yet when we trade above / below the last one and reverse ''sweepy sweepy'' .
Its more like a vertical and more micro visualisation than the HTF Candles.
Wang usage :
its a great tool to be able to reverse engineer what's in a HTFcandle precisely its a good combination with HTF candle projections to train the eyes of the traders about Whats is inside a candle that formed on the higher time frame
Limitation & know issues :
The chart may become cluttered with too many lines if multiple time frames are selected. Adjusting the line style or disabling certain time frames can help reduce visual noise.
On low time frame (<30s), some bar may notshow exactly on time (e.g : in 10sec timeframe, the 15min bar can be displayed at 01:15:10 instead of 01:15:00).
Because of the data provider and the interpreter of Trading View, if there is not data for a candle, Trading view just "skip" the candle. Sometime, those skip are on the candle that goes to 15min, 1 hour or 4 hour. As this is a Trading View issue. There is pretty much nothing we can do.
Some users may experience vertical bars at 1am, 5am, 9am ... instead of 0am, 4am, 8am ... That is because of the difference between the Timezone set on the chart and the timezone of the market they trade. Vertical bar will always refer to the symbol displayed

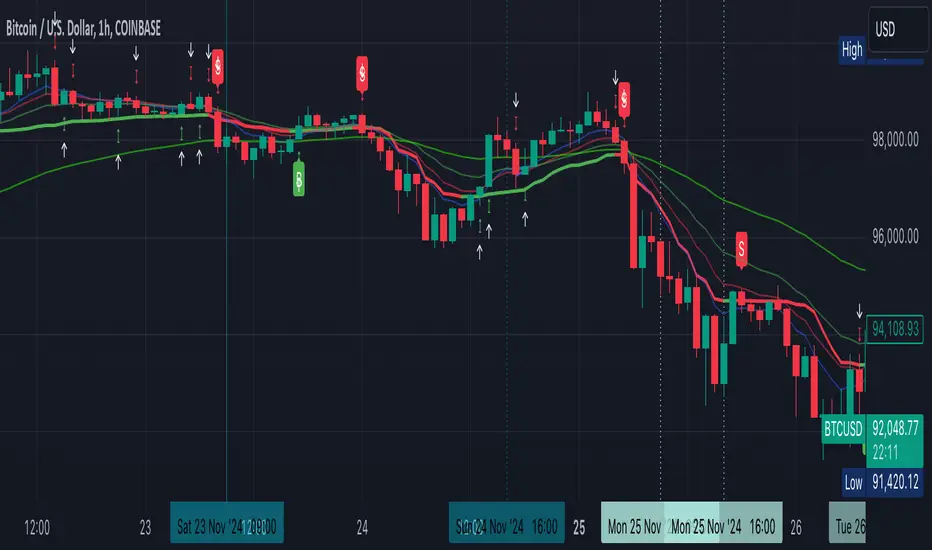
Enhanced Kaufman Adaptive Moving Average (KAMA) with Bollinger B# Enhanced Kaufman Adaptive Moving Average (KAMA) with Bollinger Bands
## Overview
This indicator combines the Kaufman Adaptive Moving Average (KAMA) with Bollinger Bands to create a comprehensive trading system. It provides adaptive trend following capabilities while measuring market volatility and potential reversal points.
## Key Features
- Adaptive moving average that adjusts to market conditions
- Dynamic Bollinger Bands for volatility measurement
- Color-coded KAMA line indicating trend direction
- Integrated buy/sell signals based on multiple confirmations
- Customizable parameters for both KAMA and Bollinger Bands
- Optional bar confirmation wait feature
- Built-in alert conditions for trade signals
## Main Components
### 1. Kaufman Adaptive Moving Average (KAMA)
- Adapts to market volatility using an efficiency ratio
- Changes color based on trend direction (green for uptrend, red for downtrend)
- Adjustable parameters for fine-tuning:
- Base Length: Controls the main calculation period (default: 10)
- Fast EMA Length: For rapid market response (default: 2)
- Slow EMA Length: For stable market conditions (default: 30)
### 2. Bollinger Bands
- Standard deviation-based volatility bands
- Customizable length and standard deviation multiplier
- Includes expansion threshold for volatility measurement
- Components:
- Upper Band: Upper volatility threshold
- Middle Band: Simple moving average
- Lower Band: Lower volatility threshold
## Signal Generation
### Buy Signals
Generated when:
1. KAMA color changes from red to green
2. Price closes above KAMA
3. Price closes above the middle Bollinger Band
4. Signals are marked with:
- Green triangles below the candles
- "B" labels for easy identification
### Sell Signals
Generated when:
1. KAMA color changes from green to red
2. Price closes below KAMA
3. Price closes below the middle Bollinger Band
4. Signals are marked with:
- Red triangles above the candles
- "S" labels for easy identification
## Customizable Parameters
### KAMA Settings
- Base Length (1-50)
- Fast EMA Length (1-10)
- Slow EMA Length (10-50)
- Source Price Selection
- Direction Highlight Toggle
- Bar Confirmation Option
### Bollinger Bands Settings
- Length (default: 20)
- Standard Deviation Multiplier (default: 2.0)
- Expansion Threshold (0.1-3.0)
## Alert Functionality
Built-in alerts for:
- Buy signals with customizable messages
- Sell signals with customizable messages
## Best Practices
### Timeframe Selection
- Works well on multiple timeframes
- Recommended for 15m to 4h charts for optimal signal generation
- Higher timeframes provide more reliable trend signals
### Parameter Optimization
- Adjust KAMA lengths based on trading style:
- Shorter lengths for day trading
- Longer lengths for swing trading
- Fine-tune BB multiplier based on market volatility
- Consider waiting for bar confirmation in volatile markets
### Risk Management
- Use in conjunction with other indicators for confirmation
- Consider market conditions and volatility when trading signals
- Implement proper position sizing and stop-loss levels
## Technical Notes
- Written in Pine Script™ v6
- Overlay indicator (displays on price chart)
- Compatible with all TradingView-supported markets
- Resource-efficient implementation for smooth performance
## Disclaimer
This indicator is provided under the Mozilla Public License 2.0. While it can be a valuable tool for technical analysis, it should not be used as the sole basis for trading decisions. Always combine with proper risk management and additional analysis methods.
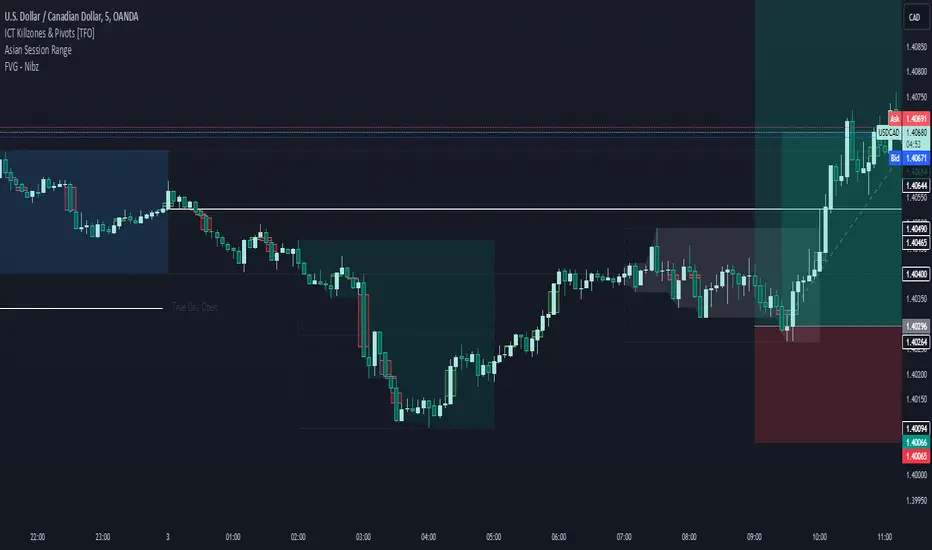
FVG - NibzDescription: Fair Value Gap (FVG) Indicator - Nibz
This Pine Script identifies and visualizes Fair Value Gaps (FVGs) on your TradingView chart. FVGs are price inefficiencies left behind when the market moves too quickly, skipping price levels that might not be tested. These gaps often act as magnets, attracting price for potential reversals or continuations.
The script works by detecting upward (bullish) and downward (bearish) price imbalances based on specific candlestick criteria and then marks these zones on your chart using customizable shaded boxes. This tool is essential for traders looking to identify key areas of market inefficiency that could signify support/resistance levels, potential reversal zones, or areas to monitor for market rebalancing.
How It Works
1. Bullish FVG Detection
The script identifies an upward imbalance when:
The low of the candlestick two bars back is less than or equal to the open of the previous bar.
The high of the current candlestick is greater than or equal to the close of the previous bar.
When this condition is met and the size of the imbalance is greater than zero, a green box is drawn from the low of the second candlestick back to the high of the current candlestick.
2. Bearish FVG Detection
The script identifies a downward imbalance when:
The high of the candlestick two bars back is greater than or equal to the open of the previous bar.
The low of the current candlestick is less than or equal to the close of the previous bar.
When this condition is met and the size of the imbalance is greater than zero, a red box is drawn from the low of the current candlestick to the high of the second candlestick back.
Customization Options
This script is highly customizable, allowing you to tailor the appearance of the FVG boxes to suit your trading style and chart aesthetics:
Bullish FVG:
Fill color and transparency.
Border color and transparency.
Bearish FVG:
Fill color and transparency.
Border color and transparency.
The settings are user-friendly, with intuitive sliders for transparency and color pickers for customization.
How to Use the Indicator
Adding the Script:
Add the indicator to your chart, and it will automatically mark bullish (green) and bearish (red) FVGs.
Interpreting FVGs:
Bullish FVGs (green zones): These often act as support or areas of potential price rebalancing on retracement.
Bearish FVGs (red zones): These often act as resistance or areas of interest for short entries.
Trade Ideas:
Use FVG zones to confirm other trade signals or strategies.
Watch for price interaction with these zones to time entries and exits.
Key Features
Automated detection of Fair Value Gaps.
Customizable visual representation to match your chart preferences.
Enhances trading precision by identifying price inefficiencies.
Suitable for scalping, day trading, or swing trading strategies.
This script provides a powerful tool to highlight important price levels and inefficiencies in the market, enabling traders to make informed decisions. Whether you're using it as a standalone indicator or combining it with other tools, the 'FVG - Nibz' indicator is a valuable addition to any trader's toolkit!
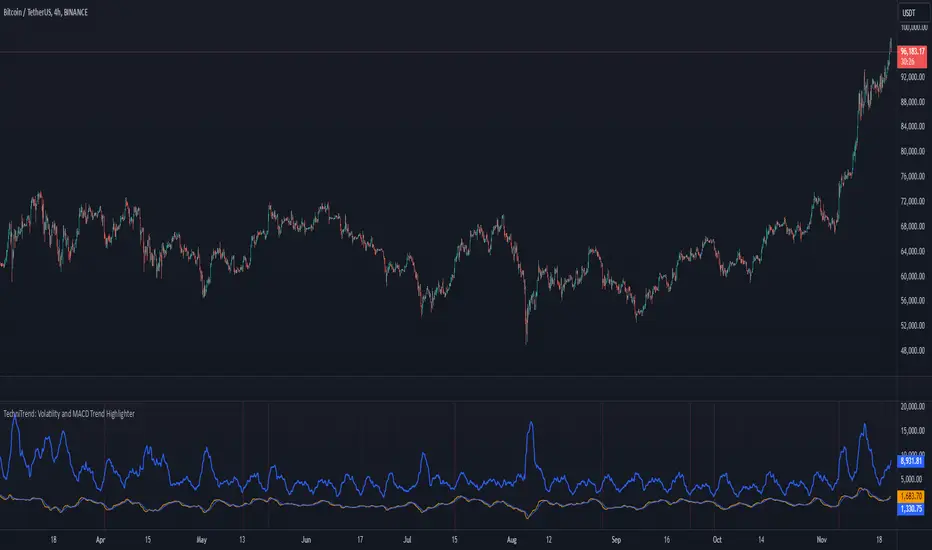
TechniTrend: Volatility and MACD Trend Highlighter🟦 Overview
The "Candle Volatility with Trend Prediction" indicator is a powerful tool designed to identify market volatility based on candle movement relative to average volume while also incorporating trend predictions using the MACD. This indicator is ideal for traders who want to detect volatile market conditions and anticipate potential price movements, leveraging both price changes and volume dynamics.
It not only highlights candles with significant price movements but also integrates a trend analysis based on the MACD (Moving Average Convergence Divergence), allowing traders to gauge whether the market momentum aligns with or diverges from the detected volatility.
🟦 Key Features
🔸Volatility Detection: Identifies candles that exceed normal price fluctuations based on average volume and recent price volatility.
🔸Trend Prediction: Uses the MACD indicator to overlay trend analysis, signaling potential market direction shifts.
🔸Volume-Based Analysis: Integrates customizable moving averages (SMA, EMA, WMA, etc.) of volume, providing a clear visualization of volume trends.
🔸Alert System: Automatically notifies traders of high-volatility situations, aiding in timely decision-making.
🔸Customizability: Includes multiple settings to tailor the indicator to different market conditions and timeframes.
🟦 How It Works
The indicator operates by evaluating the price volatility in relation to average volume and identifying when a candle's volatility surpasses a threshold defined by the user. The key calculations include:
🔸Average Volume Calculation: The user selects the type of moving average (SMA, EMA, etc.) to calculate the average volume over a set period.
🔸Volatility Measurement: The indicator measures the body change (difference between open and close) and the high-low range of each candle. It then calculates recent price volatility using a standard deviation over a user-defined length.
🔸Weighted Index: A unique index is created by dividing price change by average volume and recent volatility.
🔸Highlighting Volatility: If the weighted index exceeds a customizable threshold, the candle is highlighted, indicating potential trading opportunities.
🔸Trend Analysis with MACD: The MACD line and signal line are plotted and adjusted with a user-defined multiplier to visualize trends alongside the volatility signals.
🟦 Recommended Settings
🔸Volume MA Length: A default of 14 periods for the average volume calculation is recommended. Adjust to higher periods for long-term trends and shorter periods for quick trades.
🔸Volatility Threshold Multiplier: Set at 1.2 by default to capture moderately significant movements. Increase for fewer but stronger signals or decrease for more frequent signals.
🔸MACD Settings: Default MACD parameters (12, 26, 9) are suggested. Tweak based on your trading strategy and asset volatility.
🔸MACD Multiplier: Adjust based on how the MACD should visually compare to the average volume. A multiplier of 1 works well for most cases.
🟦 How to Use
🔸Volatile Market Detection:
Look for highlighted candles that suggest a deviation from typical price behavior. These candles often signify an entry point for short-term trades.
🔸Trend Confirmation:
Use the MACD trend analysis to verify if the highlighted volatile candles align with a bullish or bearish trend.
For example, a bullish MACD crossover combined with a highlighted candle suggests a potential uptrend, while a bearish crossover with volatility signals may indicate a downtrend.
🔸Volume-Driven Strategy:
Observe how volume changes impact candle volatility. When volume rises significantly and candles are highlighted, it can suggest strong market moves influenced by big players.
🟦 Best Use Cases
🔸Trend Reversals: Detect potential trend reversals early by spotting divergences between price and MACD within volatile conditions.
🔸Breakout Strategies: Use the indicator to confirm price breakouts with significant volume changes.
🔸Scalping or Day Trading: Customize the indicator for shorter timeframes to capture rapid market movements based on volatility spikes.
🔸Swing Trading: Combine volatility and trend insights to optimize entry and exit points over longer periods.
🟦 Customization Options
🔸Volume-Based Inputs: Choose from SMA, EMA, WMA, and more to define how average volume is calculated.
🔸Threshold Adjustments: Modify the volatility threshold multiplier to increase or decrease sensitivity based on your trading style.
🔸MACD Tuning: Adjust MACD settings and the multiplier for trend visualization tailored to different asset classes and market conditions.
🟦 Indicator Alerts
🔸High Volatility Alerts: Automatically triggered when candles exceed user-defined volatility levels.
🔸Bullish/Bearish Trend Alerts: Alerts are activated when highlighted volatile candles align with bullish or bearish MACD crossovers, making it easier to spot opportunities without constantly monitoring the chart.
🟦 Examples of Use
To better understand how this indicator works, consider the following scenarios:
🔸Example 1: In a strong uptrend, observe how volume surges and volatility highlight candles right before price consolidations, indicating optimal exit points.
🔸Example 2: During a downtrend, see how the MACD aligns with volume-driven volatility, signaling potential short-selling opportunities.
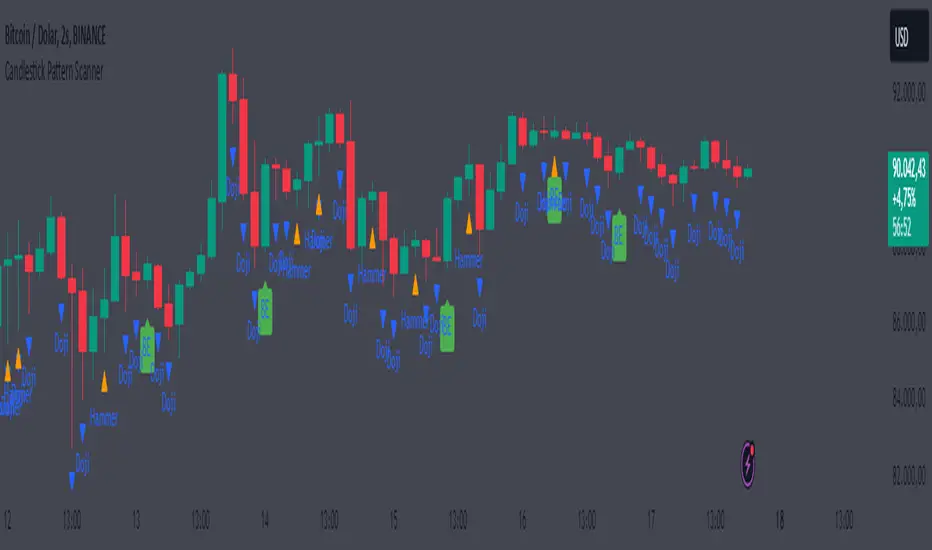
Candlestick Pattern ScannerCandlestick Pattern Scanner
This indicator identifies popular candlestick patterns on the chart and provides visual and alert-based support for traders. Based on technical analysis, it provides insights into potential trend reversals or continuation signals in price action. The following patterns are detected and marked:
1. Bullish Engulfing
Definition: Considered a strong bullish signal. A small red candle is followed by a large green candle that completely engulfs the previous one.
Chart Display: Marked with a green arrow below the price bar.
Alert Message: "Bullish Engulfing Pattern Detected!"
2. Bearish Engulfing
Definition: Considered a strong bearish signal. A small green candle is followed by a large red candle that completely engulfs the previous one.
Chart Display: Marked with a red arrow above the price bar.
Alert Message: "Bearish Engulfing Pattern Detected!"
3. Doji
Definition: Indicates indecision in the market. The candlestick has an opening and closing price that are almost the same, forming a very small body.
Chart Display: Marked with a blue triangle below the price bar.
Alert Message: "Doji Pattern Detected!"
4. Hammer
Definition: Can signal a strong bullish reversal. It has a long lower shadow and a small body, often appearing at the end of a downtrend.
Chart Display: Marked with an orange triangle below the price bar.
Alert Message: "Hammer Pattern Detected!"
5. Shooting Star
Definition: Can signal a strong bearish reversal. It has a long upper shadow and a small body, often appearing at the end of an uptrend.
Chart Display: Marked with a purple triangle above the price bar.
Alert Message: "Shooting Star Pattern Detected!"
Features:
Visual Support: Patterns are clearly marked on the chart using distinct shapes (arrows and triangles).
Alerts: Receive real-time notifications through TradingView’s alert system when a pattern is detected.
Versatility: Useful for identifying both trend reversals and continuation signals.
User-Friendly: Patterns are easily distinguishable with unique color coding.
Purpose:
This indicator helps traders identify potential reversal points or strong trend beginnings in price action. It can be used as a supportive tool in scalping, swing trading, or long-term investment strategies.
Multi-Symbol Scanner: Advanced EMA-RSI-Volume Strategy# Multi-Symbol Tech Stock Scanner: Advanced EMA-RSI-Volume Strategy
## Technical Analysis Methodology
This scanner implements a sophisticated multi-timeframe analysis approach combining three key technical elements:
### 1. Dual EMA System (Primary Trend Detection)
- **Long-term EMA (820 periods)**: Acts as the primary trend identifier
- Chosen specifically for tech stocks' longer-term price waves
- Helps filter out minor market noise while capturing major trend changes
- 820 periods approximately represents 3.2 years of trading days
- **Medium-term EMA (320 periods)**: Serves as trend confirmation
- Approximately 1.25 years of trading data
- Provides earlier entry signals while maintaining trend reliability
- Helps identify potential trend reversals before the major trend shift
### 2. Volume Analysis Component
The script employs a dynamic volume analysis system:
- Calculates 20-period moving average of volume as baseline
- Requires 1.5x surge above baseline for signal confirmation
- Volume surge requirement helps filter out weak moves and potential false breakouts
- Different from standard volume indicators as it uses adaptive thresholds
### 3. RSI Momentum Filter
Implements a specialized RSI configuration:
- 14-period RSI with dynamic overbought/oversold levels
- Oversold threshold: 30 (customizable)
- Overbought threshold: 70 (customizable)
- Used as a confirmation tool rather than primary signal generator
## Signal Generation Logic
### Buy Signal Requirements
1. Price must cross above 820 EMA (PRIMARY CONDITION)
2. Current price must be above 320 EMA (CONFIRMATION)
3. RSI must be above 30 but below 70 (MOMENTUM CHECK)
4. Volume must be 1.5x above 20-period average (STRENGTH VALIDATION)
### Sell Signal Requirements
1. Price must cross below 820 EMA (PRIMARY CONDITION)
2. Current price must be below 320 EMA (CONFIRMATION)
3. RSI must be above 30 but below 70 (MOMENTUM CHECK)
4. Volume must be 1.5x above 20-period average (STRENGTH VALIDATION)
## Risk Management Integration
The script automatically calculates key risk levels based on volatility:
1. **Stop Loss Calculation**:
- Default: 2% below entry for buys
- Dynamically adjusted based on price point
- Can be modified through input parameters
2. **Take Profit Targets**:
- Primary target: 6% above entry (3:1 reward-risk ratio)
- Based on historical tech stock movement patterns
- Adjustable through input parameters
## Multi-Symbol Implementation
The scanner monitors 6 symbols simultaneously using:
- Separate security calls for each data point
- Optimized data requests to prevent overload
- Individual signal processing for each symbol
- Synchronized alert generation system
## Technical Implementation Details
1. **Data Processing**:
```
- Security data requests on 10-minute timeframe
- Individual EMA calculations per symbol
- Separate volume analysis threads
- RSI calculations with standard deviation normalization
```
2. **Signal Processing**:
```
- Cross-verification of all conditions
- Time-based signal validation
- Volume surge confirmation
- Trend alignment check
```
3. **Alert System**:
```
- Bar-close confirmation required
- Multi-condition validation
- Detailed price level inclusion
- Risk parameter integration
```
## Optimization Features
1. **Memory Usage**:
- Optimized security calls
- Efficient data structure
- Reduced redundant calculations
2. **Processing Efficiency**:
- Single-pass data analysis
- Combined indicator calculations
- Streamlined alert generation
## Practical Application
The system is designed for:
1. Swing Trading (primary use)
2. Position Trading (secondary use)
3. Technical Breakout Trading
Optimal timeframes:
- Primary: 4H charts
- Secondary: Daily charts
- Verification: 1H charts
## Default Configuration
The scanner is preset to monitor key tech stocks:
- TSLA: High-volatility tech leader
- NVDA: Semiconductor sector benchmark
- AVGO: Stable tech infrastructure
- TSM: Global chip manufacturer
- META: Social media sector leader
- AMZN: E-commerce/Cloud computing leader
Each symbol can be modified through input parameters.
## Version Information
- Current Version: 1.3
- Last Updated: November 2024
- Compatibility: TradingView Pro/Pro+/Premium
## Limitations & Considerations
- Limited to 6 symbols due to TradingView security request limits
- Requires consistent market volume for optimal performance
- Best suited for liquid stocks with significant daily volume
- May need parameter adjustments during extreme market conditions

Holt-Winters Forecast BandsDescription:
The Holt-Winters Adaptive Bands indicator combines seasonal trend forecasting with adaptive volatility bands. It uses the Holt-Winters triple exponential smoothing model to project future price trends, while Nadaraya-Watson smoothed bands highlight dynamic support and resistance zones.
This indicator is ideal for traders seeking to predict future price movements and visualize potential market turning points. By focusing on broader seasonal and trend data, it provides insight into both short- and long-term market directions. It’s particularly effective for swing trading and medium-to-long-term trend analysis on timeframes like daily and 4-hour charts, although it can be adjusted for other timeframes.
Key Features:
Holt-Winters Forecast Line: The core of this indicator is the Holt-Winters model, which uses three components — level, trend, and seasonality — to project future prices. This model is widely used for time-series forecasting, and in this script, it provides a dynamic forecast line that predicts where price might move based on historical patterns.
Adaptive Volatility Bands: The shaded areas around the forecast line are based on Nadaraya-Watson smoothing of historical price data. These bands provide a visual representation of potential support and resistance levels, adapting to recent volatility in the market. The bands' fill colors (red for upper and green for lower) allow traders to identify potential reversal zones without cluttering the chart.
Dynamic Confidence Levels: The indicator adapts its forecast based on market volatility, using inputs such as average true range (ATR) and price deviations. This means that in high-volatility conditions, the bands may widen to account for increased price movements, helping traders gauge the current market environment.
How to Use:
Forecasting: Use the forecast line to gain insight into potential future price direction. This line provides a directional bias, helping traders anticipate whether the price may continue along a trend or reverse.
Support and Resistance Zones: The shaded bands act as dynamic support and resistance zones. When price enters the upper (red) band, it may be in an overbought area, while the lower (green) band may indicate oversold conditions. These bands adjust with volatility, so they reflect the current market conditions rather than fixed levels.
Timeframe Recommendations:
This indicator performs best on daily and 4-hour charts due to its reliance on trend and seasonality. It can be used on lower timeframes, but accuracy may vary due to increased price noise.
For traders looking to capture swing trades, the daily and 4-hour timeframes provide a balance of trend stability and signal reliability.
Adjustable Settings:
Alpha, Beta, and Gamma: These settings control the level, trend, and seasonality components of the forecast. Alpha is generally the most sensitive setting for adjusting responsiveness to recent price movements, while Beta and Gamma help fine-tune the trend and seasonal adjustments.
Band Smoothing and Deviation: These settings control the lookback period and width of the volatility bands, allowing users to customize how closely the bands follow price action.
Parameters:
Prediction Length: Sets the length of the forecast, determining how far into the future the prediction line extends.
Season Length: Defines the seasonality cycle. A setting of 14 is typical for bi-weekly cycles, but this can be adjusted based on observed market cycles.
Alpha, Beta, Gamma: These parameters adjust the Holt-Winters model's sensitivity to recent prices, trends, and seasonal patterns.
Band Smoothing: Determines the smoothing applied to the bands, making them either more reactive or smoother.
Ideal Use Cases:
Swing Trading and Trend Following: The Holt-Winters model is particularly suited for capturing larger market trends. Use the forecast line to determine trend direction and the bands to gauge support/resistance levels for potential entries or exits.
Identifying Reversal Zones: The adaptive bands act as dynamic overbought and oversold zones, giving traders potential reversal areas when price reaches these levels.
Important Notes:
No Buy/Sell Signals: This indicator does not produce direct buy or sell signals. It’s intended for visual trend analysis and support/resistance identification, leaving trade decisions to the user.
Not for High-Frequency Trading: Due to the nature of the Holt-Winters model, this indicator is optimized for higher timeframes like the daily and 4-hour charts. It may not be suitable for high-frequency or scalping strategies on very short timeframes.
Adjust for Volatility: If using the indicator on lower timeframes or more volatile assets, consider adjusting the band smoothing and prediction length settings for better responsiveness.

Enhanced Market Analyzer with Adaptive Cognitive LearningThe "Enhanced Market Analyzer with Advanced Features and Adaptive Cognitive Learning" is an advanced, multi-dimensional trading indicator that leverages sophisticated algorithms to analyze market trends and generate predictive trading signals. This indicator is designed to merge traditional technical analysis with modern machine learning techniques, incorporating features such as adaptive learning, Monte Carlo simulations, and probabilistic modeling. It is ideal for traders who seek deeper market insights, adaptive strategies, and reliable buy/sell signals.
Key Features:
Adaptive Cognitive Learning:
Utilizes Monte Carlo simulations, reinforcement learning, and memory feedback to adapt to changing market conditions.
Adjusts the weighting and learning rate of signals dynamically to optimize predictions based on historical and real-time data.
Hybrid Technical Indicators:
Custom RSI Calculation: An RSI that adapts its length based on recursive learning and error adjustments, making it responsive to varying market conditions.
VIDYA with CMO Smoothing: An advanced moving average that incorporates Chander Momentum Oscillator for adaptive smoothing.
Hamming Windowed VWMA: A volume-weighted moving average that applies a Hamming window for smoother calculations.
FRAMA: A fractal adaptive moving average that responds dynamically to price movements.
Advanced Statistical Analysis:
Skewness and Kurtosis: Provides insights into the distribution and potential risk of market trends.
Z-Score Calculations: Identifies extreme market conditions and adjusts trading thresholds dynamically.
Probabilistic Monte Carlo Simulation:
Runs thousands of simulations to assess potential price movements based on momentum, volatility, and volume factors.
Integrates the results into a probabilistic signal that informs trading decisions.
Feature Extraction:
Calculates a variety of market metrics, including price change, momentum, volatility, volume change, and ATR.
Normalizes and adapts these features for use in machine learning algorithms, enhancing signal accuracy.
Ensemble Learning:
Combines signals from different technical indicators, such as RSI, MACD, Bollinger Bands, Stochastic Oscillator, and statistical features.
Weights each signal based on cumulative performance and learning feedback to create a robust ensemble signal.
Recursive Memory and Feedback:
Stores and averages past RSI calculations in a memory array to provide historical context and improve future predictions.
Adaptive memory factor adjusts the influence of past data based on current market conditions.
Multi-Factor Dynamic Length Calculation:
Determines the length of moving averages based on volume, volatility, momentum, and rate of change (ROC).
Adapts to various market conditions, ensuring that the indicator is responsive to both high and low volatility environments.
Adaptive Learning Rate:
The learning rate can be adjusted based on market volatility, allowing the system to adapt its speed of learning and sensitivity to changes.
Enhances the system's ability to react to different market regimes.
Monte Carlo Simulation Engine:
Simulates thousands of random outcomes to model potential future price movements.
Weights and aggregates these simulations to produce a final probabilistic signal, providing a comprehensive risk assessment.
RSI with Dynamic Adjustments:
The initial RSI length is adjusted recursively based on calculated errors between true RSI and predicted RSI.
The adaptive RSI calculation ensures that the indicator remains effective across various market phases.
Hybrid Moving Averages:
Short-Term and Long-Term Averages: Combines FRAMA, VIDYA, and Hamming VWMA with specific weights for a unique hybrid moving average.
Weighted Gradient: Applies a color gradient to indicate trend strength and direction, improving visual clarity.
Signal Generation:
Generates buy and sell signals based on the ensemble model and multi-factor analysis.
Uses percentile-based thresholds to determine overbought and oversold conditions, factoring in historical data for context.
Optional settings to enable adaptation to volume and volatility, ensuring the indicator remains effective under different market conditions.
Monte Carlo and Learning Parameters:
Users can customize the number of Monte Carlo simulations, learning rate, memory factor, and reward decay for tailored performance.
Applications:
Scalping and Day Trading:
The fast response of the adaptive RSI and ensemble learning model makes this indicator suitable for short-term trading strategies.
Swing Trading:
The combination of long-term moving averages and probabilistic models provides reliable signals for medium-term trends.
Volatility Analysis:
The ATR, Bollinger Bands, and adaptive moving averages offer insights into market volatility, helping traders adjust their strategies accordingly.
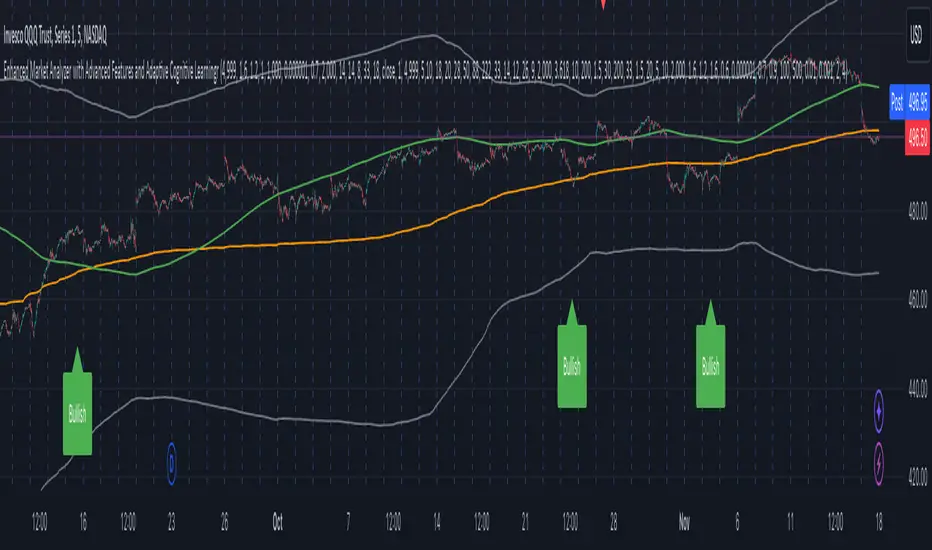
Price Movement Predictor (PMP)The Price Movement Predictor (PMP) is a versatile trading indicator designed to assist traders in identifying potential buy and sell opportunities in the market. This indicator utilizes a combination of technical analysis tools to generate signals based on the relative strength index (RSI) and moving averages, ensuring a robust and strategic approach to trading.
Key Features:
RSI-Based Signal Generation:
The indicator monitors the RSI to identify overbought and oversold conditions in the market.
A buy signal is generated when the RSI drops below a predefined oversold threshold, indicating potential upward price movement.
Conversely, a sell signal is triggered when the RSI exceeds a specified overbought level, suggesting a possible price decline.
Moving Average Confirmation:
The indicator employs two moving averages: a short-term and a long-term moving average.
Buy and sell signals are confirmed only after a crossover event occurs, ensuring that trades are entered in alignment with market trends.
The short moving average crossing above the long moving average confirms a buy signal, while a crossover below confirms a sell signal.
Take Profit and Stop Loss Management:
The PMP includes adjustable take profit and stop loss levels, which are automatically calculated based on user-defined percentages.
Labels indicating the take profit (TP) and stop loss (SL) levels are plotted on the chart, helping traders manage their risk effectively.
Alerts are available for both TP and SL conditions, allowing traders to stay informed about their trade outcomes.
User-Friendly Interface:
The indicator provides an intuitive setup with adjustable parameters for moving average lengths, RSI levels, and TP/SL ratios.
Clear buy and sell signals are displayed directly on the chart, making it easy for traders to act on potential opportunities.
Usage:
The Price Movement Predictor is ideal for traders who seek a systematic approach to identify trading opportunities and manage risk. By combining RSI signals with moving average crossovers, the indicator helps filter out false signals and enhances the accuracy of trade entries. It is suitable for various trading styles, including day trading, swing trading, and long-term investing.

Stoch RSI and RSI Buy/Sell Signals with MACD Trend FilterDescription of the Indicator
This Pine Script is designed to provide traders with buy and sell signals based on the combination of Stochastic RSI, RSI, and MACD indicators, enhanced by the confirmation of candle colors. The primary goal is to facilitate informed trading decisions in various market conditions by utilizing different indicators and their interactions. The script allows customization of various parameters, providing flexibility for traders to adapt it to their specific trading styles.
Usefulness
This indicator is not just a mashup of existing indicators; it integrates the functionality of multiple momentum and trend-detection methods into a cohesive trading tool. The combination of Stochastic RSI, RSI, and MACD offers a well-rounded approach to analyzing market conditions, allowing traders to identify entry and exit points effectively. The inclusion of color-coded signals (strong vs. weak) further enhances its utility by providing visual cues about the strength of the signals.
How to Use This Indicator
Input Settings: Adjust the parameters for the Stochastic RSI, RSI, and MACD to fit your trading style. Set the overbought/oversold levels according to your risk tolerance.
Signal Colors:
Strong Buy Signal: Indicated by a green label and confirmed by a green candle (close > open).
Weak Buy Signal: Indicated by a blue label and confirmed by a green candle (close > open).
Strong Sell Signal: Indicated by a red label and confirmed by a red candle (close < open).
Weak Sell Signal: Indicated by an orange label and confirmed by a red candle (close < open).
Example Trading Strategy Using This Indicator
To effectively use this indicator as part of your trading strategy, follow these detailed steps:
Setup:
Timeframe : Select a timeframe that aligns with your trading style (e.g., 15-minute for intraday, 1-hour for swing trading, or daily for longer-term positions).
Indicator Settings : Customize the Stochastic RSI, RSI, and MACD parameters to suit your trading approach. Adjust overbought/oversold levels to match your risk tolerance.
Strategy:
1. Strong Buy Entry Criteria :
Wait for a strong buy signal (green label) when the RSI is at or below the oversold level (e.g., ≤ 35), indicating a deeply oversold market. Confirm that the MACD shows a decreasing trend (bearish momentum weakening) to validate a potential reversal. Ensure the current candle is green (close > open) if candle color confirmation is enabled.
Example Use : On a 1-hour chart, if the RSI drops below 35, MACD shows three consecutive bars of decreasing negative momentum, and a green candle forms, enter a buy position. This setup signals a robust entry with strong momentum backing it.
2. Weak Buy Entry Criteria :
Monitor for weak buy signals (blue label) when RSI is above the oversold level but still below the neutral (e.g., between 36 and 50). This indicates a market recovering from an oversold state but not fully reversing yet. These signals can be used for early entries with additional confirmations, such as support levels or higher timeframe trends.
Example Use : On the same 1-hour chart, if RSI is at 45, the MACD shows momentum stabilizing (not necessarily negative), and a green candle appears, consider a partial or cautious entry. Use this as an early warning for a potential bullish move, especially when higher timeframe indicators align.
3. Strong Sell Entry Criteria :
Look for a strong sell signal (red label) when RSI is at or above the overbought level (e.g., ≥ 65), signaling a strong overbought condition. The MACD should show three consecutive bars of increasing positive momentum to indicate that the bullish trend is weakening. Ensure the current candle is red (close < open) if candle color confirmation is enabled.
Example Use : If RSI reaches 70, MACD shows increasing momentum that starts to level off, and a red candle forms on a 1-hour chart, initiate a short position with a stop loss set above recent resistance. This is a high-confidence signal for potential price reversal or pullback.
4. Weak Sell Entry Criteria :
Use weak sell signals (orange label) when RSI is between the neutral and overbought levels (e.g., between 50 and 64). These can indicate potential short opportunities that might not yet be fully mature but are worth monitoring. Look for other confirmations like resistance levels or trendline touches to strengthen the signal.
Example Use : If RSI reads 60 on a 1-hour chart, and the MACD shows slight positive momentum with signs of slowing down, place a cautious sell position or scale out of existing long positions. This setup allows you to prepare for a possible downtrend.
Trade Management:
Stop Loss : For buy trades, place stop losses below recent swing lows. For sell trades, set stops above recent swing highs to manage risk effectively.
Take Profit : Target nearby resistance or support levels, apply risk-to-reward ratios (e.g., 1:2), or use trailing stops to lock in profits as price moves in your favor.
Confirmation : Align these signals with broader trends on higher timeframes. For example, if you receive a weak buy signal on a 15-minute chart, check the 1-hour or daily chart to ensure the overall trend is not bearish.
Real-World Example: Imagine trading on a 15-minute chart :
For a buy:
A strong buy signal (green) appears when the RSI dips to 32, MACD shows declining bearish momentum, and a green candle forms. Enter a buy position with a stop loss below the most recent support level.
Alternatively, a weak buy signal (blue) appears when RSI is at 47. Use this as a signal to start monitoring the market closely or enter a smaller position if other indicators (like support and volume analysis) align.
For a sell:
A strong sell signal (red) with RSI at 72 and a red candle signals to short with conviction. Place your stop loss just above the last peak.
A weak sell signal (orange) with RSI at 62 might prompt caution but can still be acted on if confirmed by declining volume or touching a resistance level.
These strategies show how to blend both strong and weak signals into your trading for more nuanced decision-making.
Technical Analysis of the Code
1. Stochastic RSI Calculation:
The script calculates the Stochastic RSI (stochRsiK) using the RSI as input and smooths it with a moving average (stochRsiD).
Code Explanation : ta.stoch(rsi, rsi, rsi, stochLength) computes the Stochastic RSI, and ta.sma(stochRsiK, stochSmoothing) applies smoothing.
2. RSI Calculation :
The RSI is computed over a user-defined period and checks for overbought or oversold conditions.
Code Explanation : rsi = ta.rsi(close, rsiLength) calculates RSI values.
3. MACD Trend Filter :
MACD is calculated with fast, slow, and signal lengths, identifying trends via three consecutive bars moving in the same direction.
Code Explanation : = ta.macd(close, macdLengthFast, macdLengthSlow, macdSignalLength) sets MACD values. Conditions like macdLine < macdLine confirm trends.
4. Buy and Sell Conditions :
The script checks Stochastic RSI, RSI, and MACD values to set buy/sell flags. Candle color filters further confirm valid entries.
Code Explanation : buyConditionMet and sellConditionMet logically check all conditions and toggles (enableStochCondition, enableRSICondition, etc.).
5. Signal Flags and Confirmation :
Flags track when conditions are met and ensure signals only appear on appropriate candle colors.
Code Explanation : Conditional blocks (if statements) update buyFlag and sellFlag.
6. Labels and Alerts :
The indicator plots "BUY" or "SELL" labels with the RSI value when signals trigger and sets alerts through alertcondition().
Code Explanation : label.new() displays the signal, color-coded for strength based on RSI.
NOTE : All strategies can be enabled or disabled in the settings, allowing traders to customize the indicator to their preferences and trading styles.

Forex Relative Strength MatrixTraders often feel uncertain about which Forex pair to open a position with. This indicator is designed to help in that regard.
This indicator was created as described in the book Swing Trading with Heiken Ashi and Stochastics. In the original, the author suggests using it for swing trading. The author recommends applying it to a monthly chart with an 8-period moving average to analyze the context.
The logic of the indicator is to measure the relative strength of each currency by checking if the price of each Forex pair is above or below a chosen moving average. If the price is above the moving average, the base currency is awarded 1 point, indicating strength. If below, it scores 0, indicating weakness. By accumulating points across multiple pairs, the indicator ranks currencies from strongest to weakest, helping traders identify potential pairs for trading.
Trend Identification:
After identifying relative strength, the trader should observe the general trend using a 100-period SMA on 4-hour charts. If the price is above the SMA, the trend is bullish; if below, it is bearish.
Buy Logic:
A buy is triggered when the base currency is strong (price is above the moving average) and the quote currency is weak (price is below the moving average). After identifying the trend direction, the entry is confirmed by a color change in Heiken Ashi candles (from red to green in an uptrend) and a stochastic crossover in the trend’s direction.
Sell Logic:
A sell is triggered when the base currency is weak (price is below the moving average) and the quote currency is strong (price is above the moving average). The sell entry is confirmed by a color change in Heiken Ashi candles (from green to red in a downtrend) and a stochastic crossover aligned with the trend.
Entry Chart:
The entry chart used is the 4-hour chart. The trader should look for entry signals following a pullback in the trend direction, using Heiken Ashi candles. Entry is made when the Heiken Ashi candles change color (from red to green in an uptrend) and there is a smooth crossover of the stochastic indicator in the trend’s direction.
It would also be possible to adapt the indicator for day trading strategies with targets of 1 to 2 days. Here is a recommended setup:
Relative Strength Identification (1-Hour Chart):
Instead of monthly charts, use a 1-hour chart to identify currency strength with a 20-period moving average.
The 20-period moving average on the 1-hour chart captures a balanced view of short- to medium-term direction, covering nearly a day’s worth of trading but with enough sensitivity for day trading.
General Trend (5-Minute Chart with 100 SMA):
On the 5-minute chart, observe the 100-period SMA to identify the general trend direction throughout the day.
Price above the 100 SMA indicates an uptrend, and below indicates a downtrend, confirming the movement in shorter timeframes.
Entry Chart and Signals (5-Minute Chart):
Use the 15-minute chart to look for entry opportunities, focusing on pullbacks in the main trend direction.
Entry Signals: Enter the position when Heiken Ashi candles change color in the trend direction (from red to green in an uptrend) and the stochastic indicator makes a smooth crossover in the trend’s direction.

J Lines EMA + VWAPThe EMA + VWAP indicator combines the power of Exponential Moving Averages (EMA) with the Volume Weighted Average Price (VWAP) to help traders spot trends, identify potential entries/exits, and understand market momentum with ease. This dual-purpose tool is designed to give both beginner and experienced traders a clear view of price direction and volume influence, whether for day trading or swing trading.
Key Features:
Dynamic EMA Lines:
Six customizable moving averages (EMA by default) adapt to your selected timeframe. EMAs help track trend direction and strength, with various colors and opacity settings that visually separate them for clarity.
VWAP Tracking: A standalone VWAP line (blue) shows the average trading price adjusted for volume, making it ideal for pinpointing significant price levels where institutional interest often lies.
EMA Ribbons for Trend Confirmation: Soft-colored ribbons are placed between EMA pairs to make the trend strength visually apparent, with different color fills between lines. This makes it easy to gauge bullish or bearish conditions at a glance.
Flexible MA Options: Besides EMA, you can choose from SMA, WMA, HMA, and RMA, allowing you to adapt the indicator to various trading strategies.
This tool simplifies trend-following and volume-based analysis by giving you insight into both price momentum and market participation levels. EMAs adapt to volatility and changing market conditions, while the VWAP keeps you aware of critical price zones based on trading volume. Together, these help you stay on the right side of the market, avoid false breakouts, and make informed decisions on when to enter or exit trades.
Ideal for beginners due to its visual clarity and flexible enough for seasoned traders, EMA + VWAP is your go-to indicator for a structured approach to market trends.
