HTF Supply & Demand Zones 📊 Overview
Advanced supply and demand zone indicator that automatically detects institutional-level price zones on higher timeframes and dynamically adapts zone colors based on price position. Zones below price act as demand (support) and zones above price act as supply (resistance).
✨ Key Features
🎯 Dynamic Zone Recognition
- Smart Color Adaptation: Zones automatically change from demand (green) to supply (red) when price crosses them
- Higher Timeframe Analysis: Detect zones from any timeframe while trading on lower timeframes
- Base/Blast Pattern Detection**: Identifies strong institutional zones using base-blast candle methodology
- Automatic Zone Flipping: Broken demand zones become supply and vice versa
📈 Zone Detection Method
Uses the proven Base & Blast candle pattern:
- Base Candle: Small consolidation candle with minimal wick
- Blast Candle: Strong momentum candle breaking from the base
- Customizable Ratio: Adjust base/blast body size ratio (default 8:1)
- Wick Filter: Ensures clean base candles for higher probability zones
🎨 Visual Features
- Clean Zone Boxes: Extended zones with customizable colors and transparency
- Smart Labels: Display zone type and touch count
- Touch Counter: Track how many times price has tested each zone
- Info Dashboard: Real-time statistics in top-right corner
⚙️ Zone Management
- Auto-Delete After X Touches**: Remove zones after specified number of tests (default: 5)
- Optional Break Deletion**: Choose whether to delete zones when price breaks through
- Maximum Zone Limit**: Control chart cleanliness by limiting displayed zones
- Extended Zones**: All zones extend to the right for forward visibility
🔧 Settings
Detection Parameters
- Higher Timeframe: Select any timeframe for zone detection (empty = current timeframe)
- Base/Blast Ratio: 4.0 to 30.0 (default: 8.0) - Higher = stronger zones, fewer signals
- Wick Threshold: 0.1 to 0.5 (default: 0.3) - Maximum base candle wick size
Display Options
- Toggle demand/supply zones independently
- Maximum zones to display (1-50)
- Show/hide zone labels
- Customizable colors for demand and supply zones
- Adjustable border width
Zone Management
- Delete after X touches (1-30 touches)
- Delete on break option
- Touch counter displays current/max touches
💡 How to Use
For Swing Trading
1. Set timeframe to Daily or Weekly
2. Use 8:1 ratio for high-quality zones
3. Enable auto-delete after 3-5 touches
4. Trade pullbacks to green zones (demand) for longs
5. Trade rallies to red zones (supply) for shorts
For Day Trading
1. Set timeframe to 1H or 4H
2. Use 6:1 ratio for more zones
3. Watch for zone color changes as confirmation
4. Enter when price retests zones in the direction of the higher timeframe trend
For Scalping
1. Set timeframe to 15m or 1H
2. Use 5:1 ratio for frequent signals
3. Focus on first touch of fresh zones
4. Use lower timeframes for precise entries
📋 Best Practices
✅ DO:
- Use zones from higher timeframes for better reliability
- Wait for zone color change as confirmation of flip
- Focus on first 2-3 touches of a zone
- Combine with trend analysis
- Use zones as targets and entry levels
❌ DON'T:
- Trade every zone - quality over quantity
- Ignore the touch counter
- Use on very low timeframes without HTF context
- Trade zones that have been tested many times
🎓 Understanding Dynamic Colors
Green Zones (Demand) = Below current price = Support = Look for bounces
Red Zones (Supply) = Above current price = Resistance = Look for rejections
When price breaks a green zone downward, it flips to red (former support becomes resistance)
When price breaks a red zone upward, it flips to green (former resistance becomes support)
📊 Info Dashboard
The top-right table displays:
- Active timeframe
- Current demand zones count (below price)
- Current supply zones count (above price)
- Active base/blast ratio
- Maximum touches setting
🔔 Trading Signals
High Probability Setups:
- Fresh zones (0-1 touches) on higher timeframes
- Zones that align with major support/resistance
- First test after a zone color flip
- Multiple timeframe confluence
Avoid:
- Zones with 4+ touches
- Zones in choppy/ranging markets
- Counter-trend zones during strong momentum
⚡ Performance Notes
- Maximum 500 boxes and lines supported
- Optimized for real-time scanning
- Minimal resource usage
- No repainting - all zones are confirmed
🎯 Recommended Settings by Trading Style
Conservative (Higher Quality)
- Ratio: 10:1
- Wick Threshold: 0.2
- Delete After: 3 touches
Balanced (Default)
- Ratio: 8:1
- Wick Threshold: 0.3
- Delete After: 5 touches
Aggressive (More Signals)
- Ratio: 6:1
- Wick Threshold: 0.4
- Delete After: 7 touches
---
📖 Additional Resources
For more information on supply and demand trading:
- Study institutional order flow
- Learn base and blast candle patterns
- Understand market structure and liquidity zones
- Practice on demo before live trading
Risk Warning: This indicator is a tool for technical analysis. Always use proper risk management and combine with your trading strategy. Past performance does not guarantee future results.
---
Compatible with all markets: Forex, Stocks, Crypto, Futures, and Indices
Version: 1.0 | Language: Pine Script v5
Cari dalam skrip untuk "swing trading"

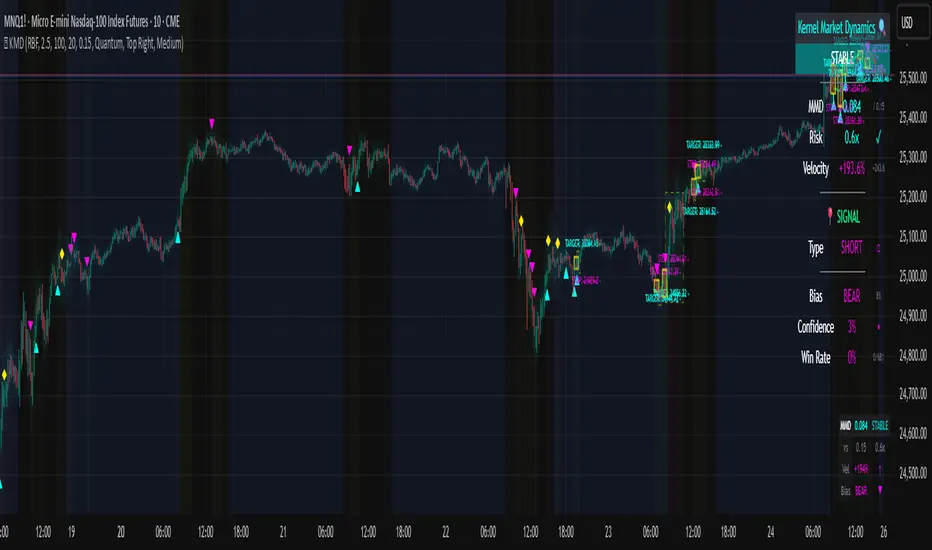
Kernel Market Dynamics🔍 Kernel Market Dynamics Pro - Advanced Distribution Divergence Detection System
OVERVIEW
Kernel Market Dynamics Pro (KMD Pro) is a revolutionary market regime detection system that employs Maximum Mean Discrepancy (MMD) - a cutting-edge statistical technique from machine learning - to identify when market behavior diverges from its recent historical distribution patterns. The system transforms complex statistical divergence analysis into actionable trading signals through kernel density estimation, regime classification algorithms, and multi-dimensional visualization frameworks that reveal hidden market transitions before traditional indicators can detect them.
WHAT MAKES IT ORIGINAL
While conventional indicators measure price or momentum divergence, KMD Pro analyzes distribution divergence - detecting when the statistical properties of market returns fundamentally shift from their baseline state. This approach, borrowed from high-frequency trading and quantitative finance, uses kernel methods to map market data into high-dimensional feature spaces where regime changes become mathematically detectable. The system is the first TradingView implementation to combine MMD with real-time regime visualization, making institutional-grade statistical arbitrage techniques accessible to retail traders.
HOW IT WORKS (Technical Methodology)
1. KERNEL DENSITY ESTIMATION ENGINE
Maximum Mean Discrepancy (MMD) Calculation:
The core innovation - measures distance between probability distributions:
• Maps return distributions to Reproducing Kernel Hilbert Space (RKHS)
• Computes empirical mean embeddings for reference and test windows
• Calculates supremum of mean differences across all RKHS functions
• MMD = ||μ_P - μ_Q||_H where H is the RKHS induced by kernel k
Three Kernel Functions Available:
RBF (Radial Basis Function) Kernel:
• k(x,y) = exp(-||x-y||²/2σ²)
• Gaussian kernel with smooth, infinite-dimensional feature mapping
• Bandwidth σ controls sensitivity (0.5-10.0 user configurable)
• Optimal for normally distributed returns
• Default choice providing balanced sensitivity
Laplacian Kernel:
• k(x,y) = exp(-|x-y|/σ)
• Exponential decay with heavier tails than RBF
• More sensitive to outliers and sudden moves
• Ideal for volatile, news-driven markets
• Faster regime shift detection at cost of more false positives
Cauchy Kernel:
• k(x,y) = 1/(1 + ||x-y||²/σ²)
• Heavy-tailed distribution from statistical physics
• Robust to extreme values and fat-tail events
• Best for cryptocurrency and emerging markets
• Most stable signals with fewer whipsaws
Implementation Details:
• Reference window: 30-300 bars of baseline distribution
• Test window: 10-100 bars of recent distribution
• Double-sum kernel matrix computation with O(m*n) complexity
• EMA smoothing (period 3) reduces noise in raw MMD
• Real-time updates every bar with incremental calculation
2. REGIME DETECTION FRAMEWORK
Three-State Regime Classification:
STABLE Regime (MMD < threshold):
• Market follows historical distribution patterns
• Mean-reverting behavior dominates
• Low probability of breakouts
• Reduced position sizing recommended
• Visual: Subtle background coloring
SHIFTING Regime (threshold < MMD < 2×threshold):
• Distribution divergence detected
• Transition period with directional bias emerging
• Optimal entry zone for trend-following
• Increased volatility expected
• Visual: Yellow/orange zone highlighting
EXTREME Regime (MMD > 2×threshold):
• Severe distribution anomaly
• Black swan or structural break potential
• Maximum caution required
• Consider hedging or exit
• Visual: Red/magenta warning zones
Adaptive Threshold System:
• Base threshold: 0.05-1.0 (default 0.15)
• Volatility adjustment: ±30% based on ATR ratio
• Regime persistence: 20-bar minimum for stability
• Cooldown periods prevent signal clustering
3. DIRECTIONAL BIAS DETERMINATION
Multi-Factor Direction Analysis:
Distribution Mean Comparison:
• Recent mean = SMA(normalized_returns, test_window)
• Reference mean = SMA(normalized_returns, reference_window)
• Direction = sign(recent_mean - reference_mean)
Momentum Confluence:
• Price momentum = close - close
• Volume momentum = volume/SMA(volume, reference_window)
• Weighted composite direction score
Trend Alignment:
• Fast EMA vs Slow EMA positioning
• Slope analysis of regression line
• Multi-timeframe bias confirmation (optional)
4. SIGNAL GENERATION ARCHITECTURE
Entry Signal Logic:
Stage 1 - Regime Shift Detection:
• MMD crosses above threshold
• Sustained for minimum 2 bars
• No signals within cooldown period
Stage 2 - Direction Confirmation:
• Distribution mean aligns with momentum
• Volume ratio > 1.0 (optional)
• Price above/below VWAP (optional)
Stage 3 - Risk Assessment:
• Calculate ATR-based stop distance
• Verify risk/reward ratio > 1.5
• Check for nearby support/resistance
Stage 4 - Signal Generation:
• Long: Regime shift + bullish direction
• Short: Regime shift + bearish direction
• Extreme: MMD > 2×threshold warning
5. PROBABILITY CLOUD VISUALIZATION
Adaptive Confidence Intervals:
• Standard deviation multiplier = 1 + MMD × 3
• Inner band: ±0.5 ATR × multiplier (68% probability)
• Outer band: ±1.0 ATR × multiplier (95% probability)
• Width expands with divergence magnitude
• Real-time adjustment every bar
Interpretation:
• Narrow cloud: Low uncertainty, stable regime
• Wide cloud: High uncertainty, shifting regime
• Asymmetric cloud: Directional bias present
6. MOMENTUM FLOW VECTORS
Three-Style Momentum Visualization:
Flow Arrows:
• Length proportional to momentum strength
• Width indicates confidence (1-3 pixels)
• Angle shows rate of change
• Frequency: Every 5 bars or on events
Gradient Bars:
• Vertical lines from price
• Height = momentum/ATR ratio
• Opacity based on strength
• Continuous flow indication
Momentum Ribbon:
• Envelope around price action
• Expands in momentum direction
• Color intensity shows strength
7. SIGNAL CONNECTION SYSTEM
Relationship Mapping:
• Links consecutive signals with lines
• Solid lines: Same direction (continuation)
• Dotted lines: Opposite direction (reversal)
• Maximum 10 connections maintained
• Distance limit: 100 bars
Purpose:
• Identifies signal clusters
• Shows trend development
• Reveals regime persistence
• Confirms directional bias
8. REGIME ZONE MAPPING
Unified Zone Visualization:
• Main zones: Full regime periods (entry to exit)
• Emphasis zones: Specific trigger points
• Historical memory: Last 20 regime shifts
• Color gradient based on intensity
• Border style indicates zone type
Zone Analytics:
• Duration tracking
• Maximum excursion
• Retest probability
• Support/resistance conversion
9. DYNAMIC RISK MANAGEMENT
ATR-Based Position Sizing:
• Stop loss: 1.0 × ATR from entry
• Target 1: 2.0 × ATR (2R)
• Target 2: 4.0 × ATR (4R)
• Volatility-adjusted scaling
Visual Target System:
• Entry pointer lines
• Target boxes with prices
• Stop boxes with invalidation
• Real-time P&L tracking
10. PROFESSIONAL DASHBOARD
Real-Time Metrics Display:
Primary Metrics:
• Current MMD value and threshold
• Risk level (MMD/threshold ratio)
• Velocity (rate of change)
• Acceleration (second derivative)
Signal Information:
• Active signal type and entry
• Stop loss and targets
• Current P&L percentage
• Bars since signal
Market Metrics:
• Directional bias (BULL/BEAR)
• Confidence percentage
• Win rate statistics
• Signal count tracking
Visual Design:
• Four position options
• Three size modes
• Five color themes
• Gauge visualizations
• Status banners
11. MMD INFO PANEL
Floating Statistics:
• Compact 3×4 table
• MMD vs threshold comparison
• Velocity with direction arrows
• Current bias indication
• Always-visible reference
FIVE COLOR THEMES
Quantum: Cyan/Magenta/Yellow - Modern, high contrast, optimal visibility
Matrix: Green/Red - Classic terminal aesthetic, traditional
Fire: Orange/Gold/Red - Warm spectrum, energetic feel
Aurora: Northern lights palette - Unique, beautiful gradients
Nebula: Deep space colors - Purple/Blue, futuristic
HOW TO USE
Step 1: Select Your Kernel
• RBF for normal markets (stocks, forex majors)
• Laplacian for volatile markets (small-caps, news-driven)
• Cauchy for fat-tail markets (crypto, emerging markets)
Step 2: Configure Bandwidth
• 0.5-2.0: Scalping (high sensitivity)
• 2.0-5.0: Day trading (balanced)
• 5.0-10.0: Swing trading (smooth signals)
Step 3: Set Analysis Windows
• Reference: 3-5× your holding period
• Test: Reference ÷ 3 approximately
• Adjust based on timeframe
Step 4: Calibrate Threshold
• Start with 0.15 default
• Increase if too many signals
• Decrease for earlier detection
Step 5: Enable Visuals
• Probability Cloud for volatility assessment
• Momentum Flow for direction confirmation
• Regime Zones for historical context
• Signal Connections for trend visualization
Step 6: Monitor Dashboard
• Check MMD vs threshold
• Verify regime state
• Confirm directional bias
• Review confidence metrics
Step 7: Execute Signals
• Wait for triangle markers
• Verify regime shift confirmed
• Check risk/reward setup
• Enter at close or next open
Step 8: Manage Position
• Place stop at calculated level
• Scale out at Target 1 (2R)
• Trail remainder to Target 2 (4R)
• Exit if regime reverses
OPTIMIZATION GUIDE
By Market Type:
Forex Majors:
• Kernel: RBF
• Bandwidth: 2.0-3.0
• Windows: 100/30
• Threshold: 0.15
Stock Indices:
• Kernel: RBF
• Bandwidth: 3.0-4.0
• Windows: 150/50
• Threshold: 0.20
Cryptocurrencies:
• Kernel: Cauchy
• Bandwidth: 2.5-3.5
• Windows: 100/30
• Threshold: 0.10-0.15
Commodities:
• Kernel: Laplacian
• Bandwidth: 2.0-3.0
• Windows: 200/60
• Threshold: 0.15-0.25
By Timeframe:
Scalping (1-5m):
• Test Window: 10-20
• Reference: 50-100
• Bandwidth: 1.0-2.0
• Cooldown: 5-10 bars
Day Trading (15m-1H):
• Test Window: 30-50
• Reference: 100-150
• Bandwidth: 2.0-3.0
• Cooldown: 10-20 bars
Swing Trading (4H-Daily):
• Test Window: 50-100
• Reference: 200-300
• Bandwidth: 3.0-5.0
• Cooldown: 20-50 bars
ADVANCED FEATURES
Multi-Timeframe Capability:
• HTF MMD calculation via security()
• Regime alignment across timeframes
• Fractal analysis support
Statistical Arbitrage Mode:
• Pair trading applications
• Spread divergence detection
• Cointegration breaks
Machine Learning Integration:
• Export signals for ML training
• Regime labels for classification
• Feature extraction support
PERFORMANCE METRICS
Computational Complexity:
• MMD calculation: O(m×n) where m,n are window sizes
• Memory usage: O(m+n) for kernel matrices
• Update frequency: Every bar (real-time)
• Optimization: Incremental updates where possible
Typical Signal Frequency:
• Conservative settings: 2-5 signals/week
• Balanced settings: 5-10 signals/week
• Aggressive settings: 10-20 signals/week
Win Rate Expectations:
• Trend following mode: 40-50% wins, 2:1 reward/risk
• Mean reversion mode: 60-70% wins, 1:1 reward/risk
• Depends heavily on market conditions
IMPORTANT DISCLAIMERS
• This indicator detects statistical divergence, not future price direction
• MMD measures distribution distance, not predictive probability
• Past regime shifts do not guarantee future performance
• Kernel methods are descriptive statistics, not AI predictions
• Requires minimum 100 bars historical data for stability
• Performance varies significantly across market conditions
• Not suitable for illiquid or heavily manipulated markets
• Always use proper risk management and position sizing
• Backtest thoroughly on your specific instruments
• This is an analysis tool, not a complete trading system
THEORETICAL FOUNDATION
The Maximum Mean Discrepancy was introduced by Gretton et al. (2012) as a kernel-based statistical test for comparing distributions. In financial markets, we adapt this technique to detect when return distributions shift, indicating potential regime changes. The mathematical rigor of MMD provides a robust, non-parametric approach to identifying market transitions without assuming specific distribution shapes.
SUPPORT & UPDATES
• Questions or configuration help via TradingView messaging
• Bug reports addressed within 48 hours
• Feature requests considered for monthly updates
• Video tutorials available on request
• Join our community for strategy discussions
FINAL NOTES
KMD Pro represents a paradigm shift in technical analysis - moving from price-based indicators to distribution-based detection. By measuring statistical divergence rather than price divergence, the system identifies regime changes that precede traditional breakouts. This anticipatory capability, combined with comprehensive visualization and risk management, provides traders with an institutional-grade toolkit for navigating modern market dynamics.
Remember: The edge comes not from the indicator alone, but from understanding when market distributions diverge from their normal state and positioning accordingly. Use KMD Pro as part of a complete trading strategy that includes fundamental analysis, risk management, and market context.
[PS] Planetary Movements & Nakshatras - Adv Astrological Trading🌟 Planetary Movements & Nakshatras - Advanced Astrological Trading Indicator
📊 Overview
Planetary Movements & Nakshatras is a comprehensive Pine Script indicator that bridges ancient Vedic astrology with modern technical analysis. This powerful tool overlays planetary positions, transitions, alignments, and nakshatras (lunar mansions) directly on your price charts, providing unique insights into potential market movements based on celestial patterns.
🎯 Key Features
1. Real-Time Planetary Tracking
Displays current positions of 7 major celestial bodies: Sun ☉, Moon ☽, Mercury ☿, Venus ♀, Mars ♂, Jupiter ♃, and Saturn ♄
Shows each planet's current zodiac sign and nakshatra
Optional degree display for precise astronomical positioning
Color-coded labels for easy identification
2. Industry-Specific Intelligence
Choose from 15 industry classifications with customized planetary and nakshatra associations:
Technology - Mercury, Rahu, Uranus (Innovation & Communication)
Finance/Banking - Jupiter, Mercury, Venus (Wealth & Trade)
Healthcare/Pharma - Sun, Moon, Jupiter (Vitality & Healing)
Energy/Oil - Sun, Mars (Power & Energy)
Agriculture - Moon, Venus, Jupiter (Growth & Fertility)
Real Estate - Saturn, Mars, Venus (Property & Construction)
Media/Entertainment - Venus, Mercury, Moon (Arts & Creativity)
Transportation - Mars, Mercury, Moon (Movement & Travel)
Metals/Mining - Saturn, Mars, Sun (Minerals & Iron)
FMCG/Retail - Venus, Mercury, Moon (Commerce & Consumer Goods)
Telecom - Mercury, Rahu (Communication & Networks)
Automobile - Mars, Saturn, Mercury (Machinery & Engineering)
Defense - Mars, Sun, Saturn (War & Discipline)
Education - Jupiter, Mercury, Moon (Knowledge & Learning)
General - All planets (Universal application)
Primary planets for each industry are marked with ★ and highlighted with vibrant colors, while secondary planets appear muted.
3. 27 Nakshatras (Lunar Mansions)
Complete coverage of all 27 Vedic nakshatras from Ashwini to Revati:
Each nakshatra spans 13.33° of the zodiac
Industry-specific favorable nakshatras marked with ✓
Visual nakshatra boundaries with dotted lines
Configurable display: Lines, Labels, Both, or None
Enhanced visualization for auspicious nakshatras
4. Planetary Transitions & Sign Changes
Track when planets change zodiac signs (every 30°):
Triangle markers indicate sign transitions
Historical price impact displayed with each transition
Shows average upward ↑% and downward ↓% swing following the event
Significant transitions highlighted at chart bottom
Regular transitions appear at chart top
5. Planetary Alignments & Aspects
Detects major astronomical events:
Conjunctions - Planets in the same position (customizable orb: 1-15°)
Oppositions - Planets 180° apart (customizable orb: 1-15°)
Sun-Moon Conjunctions (New Moon) - Powerful market turning points
Sun-Moon Oppositions (Full Moon) - High volatility periods
Jupiter-Saturn Conjunctions - Major cycle indicators (every 20 years)
Background highlighting for major alignments
6. Advanced Pattern Detection System
Machine learning-inspired historical analysis:
Automatic Pattern Recognition - Identifies recurring planetary configurations
Swing Analysis - Calculates price movements following each event
Configurable Parameters:
Minimum Swing Threshold (0.5% - 50%)
Lookforward Period (5-180 days)
Minimum Occurrences (1-10 instances)
Statistical Tracking:
Count of pattern occurrences
Average upward swing percentage
Average downward swing percentage
Maximum upward swing
Maximum downward swing
Industry Relevance Filtering - Focus only on patterns relevant to your sector
7. Three Interactive Information Tables
📋 Industry Planet Guide Table (Configurable Position)
Shows primary planets to watch for your selected industry
Lists favorable nakshatras for optimal timing
Legend explaining symbols (★ = Primary, ✓ = Favorable)
Compact format with color-coded information
📊 Pattern Statistics Table (Configurable Position)
Historical performance data for all detected patterns
Sortable by significance
Columns: Pattern Name, Count, Avg↑%, Avg↓%, Max↑%, Max↓%, Relevance
Color-coded thresholds (green for bullish, red for bearish)
Industry relevance marked with ★
Shows up to 15 most significant patterns
🔮 Future Events Table (Configurable Position)
Projects planetary events up to 365 days into the future
Lists upcoming transitions, conjunctions, and oppositions
Shows historical average price impacts for each future event
Date, Event type, Sign/Nakshatra, Expected swing percentages
Significant events marked with ★
Displays up to 20 upcoming events
Table Positioning: Each table can be placed in any of 9 positions:
Top: Left, Center, Right
Middle: Left, Center, Right
Bottom: Left, Center, Right
8. Visual Enhancements
Nakshatra Boundary Lines - Dotted vertical lines every 27 bars
Color-Coded Events - Orange (Sun), Silver (Moon), Yellow (Mercury), Green (Venus), Red (Mars), Purple (Jupiter), Blue (Saturn)
Significance Highlighting - Bright colors for high-impact events, muted for regular events
Background Shading - Subtle yellow for Sun-Moon conjunctions, purple for Jupiter-Saturn conjunctions
Responsive Labels - Adjustable size (tiny, small, normal, large)
9. Astronomical Calculations
Julian Day Number conversion for precise date handling
Keplerian Orbital Elements for planetary position calculation
J2000 Epoch (January 1, 2000) as reference point
Accurate for historical, current, and future dates
Accounts for mean longitude and orbital mechanics
🎛️ Comprehensive Settings
Industry Settings
15 industry types with pre-configured planetary associations
Planets Group
Toggle planetary positions display
Toggle transition markers
Toggle alignment indicators
Planet Selection
Individual on/off switches for all 7 planets
Mix and match based on your trading strategy
Pattern Detection
Enable/disable pattern recognition
Minimum swing threshold (%)
Days to measure swing impact
Minimum pattern occurrences for validity
Highlight significant events
Filter by industry-relevant planets
Alignments
Conjunction orb (1-15°)
Opposition orb (1-15°)
Customizable sensitivity
Display Options
Label size selection
Show/hide degree measurements
Toggle all three information tables
Nakshatra display modes
Table Settings
Show/hide Future Events Table
Show/hide Pattern Statistics Table
Show/hide Industry Guide Table
Configure position for each table (9 positions)
Adjust future projection days (30-365)
Nakshatras
Display modes: Lines, Labels, Both, or None
Automatic favorable nakshatra highlighting
💡 Use Cases
Timing Market Entries & Exits
Identify high-probability periods using planetary alignments
Watch for favorable nakshatra transits in your industry
Track historical success rates of specific planetary configurations
Risk Management
Be aware of volatile periods (Full Moons, major transitions)
Reduce position sizes during unfavorable planetary periods
Increase exposure during auspicious nakshatra alignments
Industry-Specific Analysis
Technology stocks may respond to Mercury movements
Banking stocks may correlate with Jupiter-Venus alignments
Energy stocks may track Sun-Mars aspects
Long-Term Cycle Analysis
Jupiter-Saturn conjunctions mark major market cycles (20-year cycles)
Saturn transitions indicate sector rotation (2.5-year cycles)
Jupiter transitions show expansion/contraction phases (1-year cycles)
Intraday & Swing Trading
Moon transitions every 2.5 days for short-term timing
Mercury retrogrades for communication/tech sector volatility
Venus transitions for consumer goods and luxury items
Pattern Backtesting
Quantify historical price impacts of specific events
Build confidence in planetary timing strategies
Compare multiple patterns for optimal selection
📈 Performance & Optimization
Efficient Calculations - Optimized algorithms for minimal lag
Smart Pattern Storage - Tracks only significant patterns
Configurable Display Limits - Control label and line counts
Future Projection - Pre-calculates events without real-time overhead
Industry Filtering - Reduces noise by focusing on relevant patterns
🔧 Technical Specifications
Pine Script Version: 6
Chart Type: Overlay (true)
Max Labels: 500
Max Lines: 500
Max Boxes: 500
Calculation Method: Simplified Keplerian orbital mechanics
Date Range: Works for past, present, and future dates
Zodiac System: Tropical (Western) zodiac with Vedic nakshatras
🌙 Nakshatra Reference
All 27 nakshatras are supported with industry-specific favorable classifications:
Ashwini - Swift action, healing, pioneering (Tech, Auto, Transport)
Bharani - Transformation, restraint (Defense, Entertainment)
Krittika - Purification, cutting through (Energy, Real Estate, Metals)
Rohini - Growth, beauty, fertility (Finance, Agriculture, FMCG)
Mrigashira - Seeking, curiosity (Agriculture, Auto)
Ardra - Storm, transformation, breakthroughs (Tech, Telecom)
Punarvasu - Renewal, expansion (Agriculture, Transport, Telecom, Education)
Pushya - Nourishment, prosperity (Finance, Healthcare, Agriculture, Education)
Ashlesha - Control, mysticism (Healthcare)
Magha - Power, authority, leadership (Energy, Metals, Defense)
... and 17 more nakshatras with specific industry associations
🎨 Color Scheme
Sun ☉ - Orange (vitality, authority)
Moon ☽ - Silver (emotions, public)
Mercury ☿ - Yellow (communication, intellect)
Venus ♀ - Green (beauty, wealth, harmony)
Mars ♂ - Red (action, energy, conflict)
Jupiter ♃ - Purple (expansion, wisdom, fortune)
Saturn ♄ - Blue (restriction, discipline, structure)
📚 Trading Strategy Ideas
The Industry-Specific Strategy
Select your stock's industry classification
Focus only on primary planet transitions (marked with ★)
Wait for favorable nakshatra alignments (marked with ✓)
Check Pattern Statistics Table for historical success rate
Enter on confluence of favorable conditions
The Alignment Trading Strategy
Monitor Sun-Moon conjunctions (New Moons) for trend reversals
Track Sun-Moon oppositions (Full Moons) for volatility spikes
Use conjunction orb settings to fine-tune sensitivity
Compare with technical support/resistance levels
The Pattern Recognition Strategy
Enable Pattern Detection with your preferred parameters
Set minimum swing threshold based on your risk tolerance
Focus on patterns with high occurrence counts (5+)
Use Future Events Table to plan entries in advance
Backtest patterns in Pattern Statistics Table
The Nakshatra Timing Strategy
Identify favorable nakshatras for your industry
Wait for Moon to transit through favorable nakshatras
Combine with planetary transitions for stronger signals
Use nakshatra boundary lines for visual confirmation
⚠️ Disclaimer
This indicator is for educational and research purposes only. Planetary positions and astrological calculations should not be the sole basis for trading decisions. Always combine with fundamental analysis, technical analysis, and proper risk management. Past performance of planetary patterns does not guarantee future results. Trading involves substantial risk of loss.
🔄 Updates & Support
This indicator combines ancient wisdom with modern data analysis. While planetary positions are calculated using established astronomical formulas, the correlation between celestial events and market movements is a subject of ongoing research and debate. Use this tool as one component of a comprehensive trading strategy.

Profitolio Swing Strategy V1.2Profitolio Swing Strategy V1.2 - User Guide
Overview
The Profitolio Swing Strategy (PSS V1.2) is a comprehensive swing trading indicator designed to identify high-probability trade setups by combining multiple technical analysis methods. This indicator helps traders capture medium-term price movements while managing risk effectively.
What This Indicator Does
This indicator analyzes market momentum and volatility to generate clear BUY and SELL signals. It uses a confluence approach, meaning signals only appear when multiple conditions align, reducing false signals and improving trade quality.
Key Features
Visual Components
1. Signal Markers
Green Triangle (BUY): Appears below candles when bullish conditions align
Red Triangle (SELL): Appears above candles when bearish conditions align
2. Reference Lines
Blue Line: 21-period Exponential Moving Average (EMA) - shows medium-term trend direction
Orange Circles: Volume Weighted Average Price (VWAP) - represents fair value based on price and volume
3. Stoploss Management
Red Horizontal Line: Active stoploss for long positions (appears after BUY signal)
Green Horizontal Line: Active stoploss for short positions (appears after SELL signal)
"SL HIT!" Label: Appears when price touches the stoploss level
4. Background Color
Light Green: Indicates overall bullish market condition
Light Red: Indicates overall bearish market condition
No Color: Neutral/mixed conditions
5. Dashboard (Top Right)
Shows the status of multiple trend variants and the final decision:
Individual variant status (Variant 1, 2, 3)
Overall decision (BULLISH/BEARISH/NEUTRAL)
Active stoploss value
Parameters Used
ATR-Based Calculations
The indicator uses different Average True Range (ATR) and multipliers which measures market volatility
Lower multipliers: More sensitive, faster signals
Higher multipliers: Less sensitive, more stable signals
Moving Averages
21 EMA: Helps identify the prevailing trend direction. Price above EMA suggests uptrend, below suggests downtrend
VWAP: Acts as dynamic support/resistance. Institutional traders often use this as a reference point
How to Use This Indicator
Step 1: Wait for Signal Confirmation
Do not trade when background is absent (neutral condition)
Look for BUY signal when background turns light green
Look for SELL signal when background turns light red
Step 2: Entry Rules
For Long Positions (BUY):
Wait for green triangle below candle
Confirm price is above the 21 EMA (blue line) for stronger probability
Enter at current market price or next candle open
For Short Positions (SELL):
Wait for red triangle above candle
Confirm price is below the 21 EMA (blue line) for stronger probability
Enter at current market price or next candle open
Step 3: Risk Management
Stoploss Placement:
For BUY trades: The indicator automatically marks a stoploss level (red line) based on recent price action
For SELL trades: The indicator automatically marks a stoploss level (green line) based on recent price action
These levels persist until hit or trend reverses
Exit Strategies:
Stoploss Exit: Exit when price hits the marked stoploss line (you'll see "SL HIT!" label)
Signal Reversal: Exit when opposite signal appears
Background Change: Consider exiting when background color disappears (trend weakening)
Step 4: Additional Confirmation
Use EMA & VWAP for Confluence:
Stronger BUY: When price is above both EMA and VWAP
Stronger SELL: When price is below both EMA and VWAP
Caution: When price is between EMA and VWAP (mixed signals)
Best Practices
✅ DO:
Use on higher timeframes (4H, Daily) for swing trading
Wait for clear signal confirmation
Respect the stoploss levels
Check dashboard for overall market condition
Use on trending markets for best results
❌ DON'T:
Trade during neutral/gray periods
Ignore stoploss levels
Trade against the background color
Use on very short timeframes (1min, 5min) - designed for swing trading
Enter trades when all three variants show mixed signals
Alert Setup
The indicator includes built-in alerts:
"All Bullish": Triggered on BUY signal
"All Bearish": Triggered on SELL signal
"Buy SL Hit": When long stoploss is touched
"Sell SL Hit": When short stoploss is touched
Timeframe Recommendations
Best: Daily, 4-Hour charts
Good: 1-Hour charts
Not Recommended: Below 1-Hour (too many false signals)
Understanding the Dashboard
The dashboard shows a breakdown of the decision-making process:
Variant 1, 2, 3: Individual component analysis
Decision: Final verdict (requires all variants to agree)
Active SL: Current stoploss level for open position
Risk Disclaimer
This indicator is a tool to assist in trading decisions. Always:
Use proper position sizing
Never risk more than 1-2% per trade
Combine with your own analysis
Practice on paper/demo accounts first
Past performance doesn't guarantee future results
Note: This indicator works best in trending markets and may generate fewer signals in ranging/choppy conditions. Patience is key to successful swing trading.

Market Profile based Support/ResistanceBrought to you by Stock Kaka - Your trading sidekick 🦜📈 - pay your visit at stockkaka.my.canva.site or find us on X #StockKaka
📊 What This Indicator Does
Ever wish the market would just tell you where the important levels are? Well, buckle up, because this indicator is like having a market whisperer on your chart!
Based on cutting-edge hierarchical market structure analysis (fancy words for "smart support and resistance"), this bad boy uses ATR-based Directional Change to identify turning points that actually matter. No more guessing where price might bounce or break—let the algorithm do the heavy lifting while you sip your coffee ☕
🎯 The Five Levels Explained (From Noisy to Mighty)
Think of these levels like a pyramid of importance. Level 0 is your chatty friend who notices everything, while Level 4 is the wise oracle who only speaks when it really matters.
Level 0: The Hyperactive Scout 🐿️
What it does: Catches every little zigzag in price using ATR confirmation
Significance: Very short-term, intraday noise
Best for: Scalpers who love action every few minutes
Trader Type: "I refresh my chart 100 times an hour"
Reliability: ⭐⭐ (It's enthusiastic but easily excitable)
Level 1: The Day Trader's Buddy 🎯
What it does: Filters Level 0 to show minor swing highs/lows
Significance: Intraday support/resistance, hourly structure
Best for: Day traders, scalpers looking for better entries
Trader Type: "I close all positions before dinner"
Reliability: ⭐⭐⭐ (Solid for quick moves)
Level 2: The Swing Trader's Sweet Spot 🎪
What it does: Identifies multi-day to weekly structure points
Significance: Intermediate support/resistance where battles happen
Best for: Swing traders, position traders
Trader Type: "I hold for days, not minutes"
Reliability: ⭐⭐⭐⭐ (Now we're talking real structure!)
Level 3: The Big Money Magnet 💰
What it does: Shows major market structure—where the whales play
Significance: Weekly to monthly levels, institutional zones
Best for: Position traders, trend followers
Trader Type: "I think in weeks and months, not hours"
Reliability: ⭐⭐⭐⭐⭐ (These levels have gravitational pull!)
Level 4: The Market Prophet 🔮
What it does: Reveals ultra-major turning points (think: quarterly/yearly pivots)
Significance: Long-term macro structure, investment-grade levels
Best for: Investors, long-term position traders
Trader Type: "Warren Buffett is my spirit animal"
Reliability: ⭐⭐⭐⭐⭐⭐ (When these break, market's rewrite the story)
⚙️ Parameter Setup Guide (The Secret Sauce)
The magic ingredient is the ATR Lookback Period—think of it as teaching the indicator your timeframe's "dialect." Here's your cheat sheet:
2-Minute Chart ⚡
ATR Lookback: 720 (24 hours of 2-min bars)
Who uses this: Crypto degens, futures scalpers, adrenaline junkies
Show Levels: L0, L1, L2 (L3+ won't budge much)
Pro Tip: Enable only L1 and L2 or your chart will look like spaghetti
5-Minute Chart 🏃
ATR Lookback: 288 (24 hours of 5-min bars)
Who uses this: Active day traders, news traders
Show Levels: L1, L2, L3
Pro Tip: L2 is your best friend here—perfect for intraday swings
15-Minute Chart 📈
ATR Lookback: 96 (24 hours of 15-min bars)
Who uses this: Swing traders, patient day traders
Show Levels: L1, L2, L3
Pro Tip: This is the "Goldilocks zone"—not too fast, not too slow
1-Hour Chart ⏰
ATR Lookback: 168 (1 week of hourly bars)
Who uses this: Swing traders, position traders
Show Levels: L2, L3, L4
Pro Tip: L3 levels here are like magnets for price action
Daily Chart 📅
ATR Lookback: 30 to 50 (1-2 months)
Who uses this: Investors, long-term traders, people with patience
Show Levels: L2, L3, L4
Pro Tip: L4 on dailies = "Don't fight this level, respect it"
🎨 How to Use This Thing
Add to Chart - Duh! 😄
Set Your ATR Lookback - Use the guide above (don't wing it!)
Enable Relevant Levels - Less is more! Turn off levels that just clutter
Watch the Magic - See horizontal lines appear at key S/R zones
Check the Table - Top-right corner shows current levels (fancy!)
Set Alerts - Get notified when price approaches or breaks levels
Trading Strategies 🎲
The Bounce Play:
Price approaches Level 2 or 3 support → Look for bullish reversal signals
Take profit at the next level resistance
Stop loss just below the support level
The Breakout Play:
Price breaks through Level 2/3 resistance with volume → Go long
Next level becomes your target
Failed breakout? Level becomes resistance again (classic fake-out)
The Confluence Play:
When Level 3 aligns with your favorite indicator (RSI oversold, moving average, Fibonacci) → Chef's kiss! 👨🍳💋
These multi-confirmation setups are where the money lives
🚨 Important Notes (Read This or Blame Yourself Later)
⚠️ This indicator REPAINTS on the current bar until an extreme is confirmed. That's not a bug, it's how directional change works. The past levels are solid as a rock, but the pending one is still... pending.
⚠️ More levels ≠ Better results. Showing all 5 levels is like having 5 GPS apps shouting directions at once. Pick 2-3 levels max.
⚠️ ATR Lookback matters! Wrong setting = garbage results. Use the guide above or experiment carefully.
⚠️ Volatile markets (crypto, meme stocks) work GREAT with this. Choppy, range-bound markets? Meh.
⚠️ Combine with other tools! This shows you WHERE, not WHEN. Use momentum indicators, volume, or your favorite chicken entrails for timing 🐔
🦜 Final Word from Stock Kaka
Remember: Indicators don't make money, traders do. This tool shows you where the market has historically respected structure. What you do with that info? That's on you, champ!
Use proper risk management, don't YOLO your rent money, and may your stops never get hunted 🎯
Trade smart, trade safe, and let Stock Kaka be your guide!
📝 Credits
Algorithm: neurotrader888 (Python implementation)
Pine Script Conversion: Your friendly neighborhood Stock Kaka team!!
Inspiration: Ginger chai, market inefficiencies, and a dash of chaos
📌 Tags
support-and-resistance market-structure atr directional-change multi-timeframe swing-trading day-trading levels hierarchical-analysis algo-trading

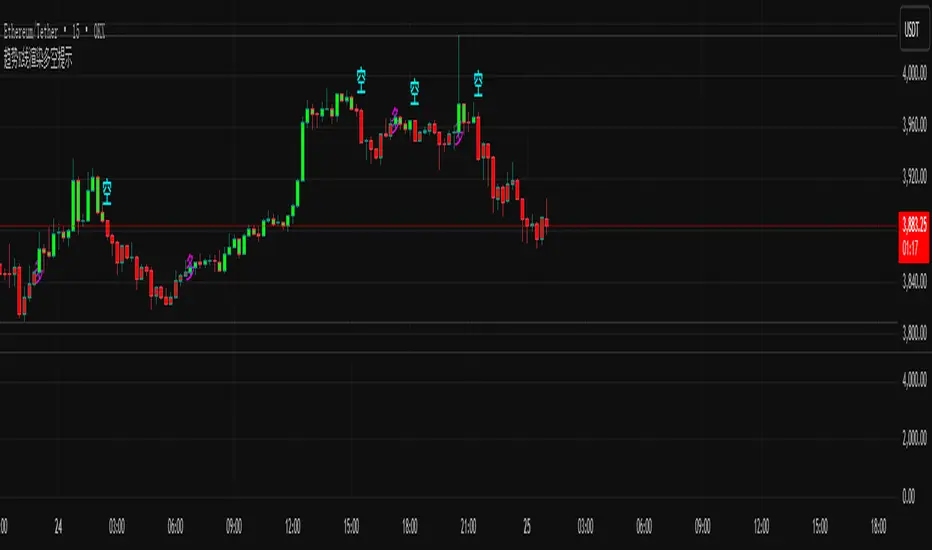
SuperTrend趋势K线渲染多空提示指标简介 / Indicator Introduction
指标名称:趋势K线渲染多空提示
Indicator Name: Trend K-line Rendering with Long/Short Signals
核心功能 / Core Function:
本指标是一款直观的主图趋势跟踪工具。它通过智能渲染K线颜色,并直接在图表上标记“多”、“空”文字,为交易者提供一目了然的趋势方向和潜在买卖点提示。
This indicator is an intuitive overlay trend-following tool. It intelligently colors the K-lines and directly marks "Long" (多) and "Short" (空) signals on the chart, providing traders with a clear visual representation of the trend direction and potential trading points.
主要特点 / Main Features:
可视化趋势识别 / Visual Trend Identification:
指标通过独特的色彩系统为K线着色,将复杂的趋势判断转化为直观的视觉信号,让您瞬间把握当前市场多空主导力量。
The indicator colors the K-lines using a unique color system, transforming complex trend judgments into intuitive visual signals, allowing you to instantly grasp the dominant bullish or bearish force in the market.
精准多空信号 / Precise Long/Short Signals:
在趋势发生关键转换时,指标会在K线的关键位置(如高点或低点附近)清晰标注“多”或“空”文字,直接提示潜在的入场时机。
At key trend transitions, the indicator clearly marks "Long" (多) or "Short" (空) near critical price points (e.g., around highs or lows), directly suggesting potential entry opportunities.
主图叠加,无需切换 / Overlay on Main Chart, No Switching Needed:
所有信号都直接呈现在主图K线上,无需在副图之间切换视线,确保您专注于价格行为本身,决策更高效。
All signals are displayed directly on the main chart's K-lines, eliminating the need to shift your focus between sub-windows and ensuring you concentrate on price action for more efficient decision-making.
适用场景 / Applicable Scenarios:
适用于所有希望通过图表颜色快速判断趋势的交易者。
Suitable for all traders who wish to quickly determine the trend through chart colors.
适用于需要清晰、直接买卖点提示的投资者。
Suitable for investors who need clear and direct buy/sell point alerts.
可作为日内交易或波段交易的趋势过滤工具。
Can be used as a trend-filtering tool for day trading or swing trading.
温馨提示 / Friendly Reminder:
建议将此工具与其他技术分析方法结合使用,以相互验证。请注意,没有任何指标能保证100%准确,请务必管理好风险。
It is recommended to use this tool in conjunction with other technical analysis methods for mutual confirmation. Please note that no indicator can guarantee 100% accuracy, so always manage your risk effectively.
Trend Candles Full ColorThe coloring over the candle sticks isn't showing up on the picture for some reason but when you click on the indicator the color coding will appear on the chart.
Trend Candles Full Color Indicator Explanation The "Trend Candles Full Color" indicator, designed for TradingView, visually enhances candlestick charts by coloring candles based on their position relative to a simple moving average (SMA). Here's how it works and how it can benefit traders: How It Works Input : Adjust the SMA period (default is 20) to define the trend length.
Logic : The indicator compares the closing price of each candle to the SMA: Green Candle : Close is above the SMA (indicating an uptrend).
Red Candle : Close is below the SMA (indicating a downtrend).
Gray Candle : Close equals the SMA (neutral/no clear trend).
Output : Candles (body, wick, and border) are colored green, red, or gray based on the trend, overlaid directly on your price chart.
Benefits and Use Cases Trend-Following Strategies Benefit: Clearly identifies bullish (green) or bearish (red) trends, helping traders ride momentum.
Example: A swing trader using a 20-period SMA can enter long positions when candles turn green (price above SMA) and exit or short when candles turn red, confirming trend reversals.
Reversal Trading Benefit: Gray candles signal indecision near the SMA, often a precursor to reversals.
Example: A day trader might watch for gray candles after a prolonged uptrend (green candles) to anticipate a potential bearish reversal, combining with other indicators like RSI for confirmation.
Scalping Benefit: Quick visual cues for short-term trend changes on lower timeframes.
Example: A scalper on a 5-minute chart can use green candles to confirm quick bullish moves and red candles to avoid counter-trend trades, enhancing decision speed.
Position Sizing or Risk Management Benefit: Color changes highlight trend strength, aiding in adjusting trade size or stops.
Example: A trader might increase position size during strong green candle sequences (sustained uptrend) and tighten stops when gray candles appear, signaling potential trend weakness.
Tips for Use Adjust the MA Length to suit your trading style (e.g., shorter for scalping, longer for swing trading).
Combine with other indicators (e.g., support/resistance, MACD) for better accuracy.
Test on different timeframes to match your strategy.
Recommended MA Length for 1-Minute Charts Short-Term/Scalping (1-5 minute trades):10-period SMA : Very sensitive, ideal for capturing quick price movements in fast markets. May produce more noise (false signals).
20-period SMA : A balanced choice for 1-minute charts, smoothing minor fluctuations while reacting to short-term trends. A great starting point for scalpers.
Intraday Trend Trading (10-30 minute holds):50-period SMA : Captures broader intraday trends, reducing noise but lagging slightly. Suitable for larger moves within a session.
This indicator simplifies trend identification, making it a versatile tool for traders of all styles, from beginners to advanced users!
Recommended MA Length for Swing Trading / Higher Timeframes Swing Trading (holding trades for days to weeks):50-period SMA : A popular choice for swing traders on higher timeframes (e.g., 1-hour or 4-hour charts). It smooths out short-term fluctuations while identifying medium-term trends. Ideal for capturing multi-day swings.
100-period SMA : Slightly longer, this MA is great for confirming stronger, more sustained trends. It’s useful on 4-hour or daily charts for swing traders aiming to ride larger price moves.
Longer-Term Trend Trading (holding for weeks to months):200-period SMA : A classic choice for higher timeframes like daily or weekly charts. It highlights major market trends and is widely used by swing and position traders to filter out noise and focus on long-term direction.
150-period SMA : A middle ground between the 100 and 200 SMA, suitable for daily charts when you want a balance between responsiveness and trend reliability.

Darvas Lines/Box1. Overview
The Darvas Lines/Box (v1.0) is a dynamic trend following indicator based on the renowned method developed by Nicolas Darvas. It's designed to identify clear price consolidation ranges and detect decisive breakouts, crucial for positional and swing trading strategies.
This indicator automatically draws and adjusts the consolidation ranges, and includes modern enhancements such as Advanced Retest Confirmation and exposed alert conditions, providing reliable signals for monitoring and acting on trend continuations.
2. Core Features
Custom Display Mode (Lines/Box): Allows the user to toggle the visualization between showing just the Breakout Lines (Lines) or displaying the consolidation area with a filled background box (Box).
Source Selection (Wicks/Body): Users can choose whether the box boundaries are defined by the candlestick wicks (price extremes) or the candlestick body (open/close price). This feature is critical for adjusting sensitivity to market noise.
Dynamic Box Drawing: Draws Darvas boxes automatically by tracking price highs and lows based on user-defined parameters (Bars to Define Range, Max Box Height).
Retest Confirmation: Detects if the old resistance/support line functions effectively after a breakout. When a retest is confirmed, the line is extended and its color changes.
Price Labels (Stable Lock): Displays the highest and lowest box prices, fixed to the left outer edge of the box. This ensures stable visibility.
Progress Labels: Visualizes the current line price and the percentage distance to the closing price on the right side of the box, showing progress toward the next breakout.
3. Trading Strategy: How to Use the Indicator
This indicator is primarily used to identify trend initiation and trend continuation signals.
A. Entry Strategy (Breakout)
Long Entry Action: Consider taking a long entry when the price closes above the Upper Line (Green Line), signaled by a BULLISH BREAKOUT alert.
Signal: Use the BULLISH BREAKOUT alert.
Short Entry Action: Consider taking a short entry when the price closes below the Lower Line (Red Line), signaled by a BEARISH BREAKOUT alert.
Signal: Use the BEARISH BREAKOUT alert.
B. Retest Strategy (Add-on/Confirmation)
Action: When the price pulls back to touch the broken line (signaled by RETEST CONFIRMED), this confirms the break's validity.
Alert: The RETEST CONFIRMED alert is triggered at this moment.
C. Risk Management (General)
Stop Loss: The initial stop-loss is typically set just beyond the opposite side of the broken box. As the trend progresses and new boxes form, the lower boundary of the most recently formed box can be used as a trailing stop for managing risk.
4. Setting Parameters
Line Source (Wicks/Body): Crucial for sensitivity. 'Wicks' tracks price extremes; 'Body' tracks stronger close-to-close movements, ignoring noise.
Bars to Define Range: Defines the calculation period (in bars) for the box.
Cooldown Bars After Breakout: Sets the waiting period after a breakout before a new box can start forming.
Retest Lookback Bars (Phase 3): Sets the maximum number of bars to check for a retest during the cooldown phase.
Max Gap for Retest (%): Defines the maximum percentage distance from the line allowed to confirm a retest (Set to Zero (0.0%) for near-touch detection).
Alert Frequency (Breakout): Allows selection between Continuous and Once per Box for breakout signals.
5. Alerts: How to Set Up the Triggers
This indicator exposes several specific conditions to the TradingView alert panel, allowing you to select the exact event you want to monitor.
Step-by-Step Alert Setup:
Open the Alert Panel on the chart.
In the Condition field, select the indicator's name.
In the Alert Condition field, choose the specific event you want to monitor:
1. ANY DARVAS EVENT (Consolidated)
2. BULLISH BREAKOUT (Individual)
3. BEARISH BREAKOUT (Individual)
4. RETEST CONFIRMED (Individual)
In the Trigger field (Frequency), select your preferred native option (e.g., "Once Per Bar Close" or "Once per bar").

Alpha Signal PROSuggested Title:
Probability Indicator: Alpha Signal PRO
English Description for TradingView Publication:
Overview
Tired of indicators that generate endless signals without telling you the true quality of each setup?
Alpha Signal PRO is more than just another buy/sell indicator; it is a complete decision-support system designed for traders who operate on confluence and high-probability setups. Instead of just telling you when to enter, this indicator analyzes each potential opportunity through a proprietary engine and grades it within a clear hierarchy. This allows you to focus only on the highest quality setups and manage your risk intelligently.
👑 The Difference: The Signal Grading Engine™
The true power of Alpha Signal PRO lies in its intelligent analysis engine. Rather than treating all signals equally, it qualifies them across different confidence levels, enabling superior risk management and a focus on A++ setups.
Basic Signal (M): A moderate-quality opportunity, ideal for more active traders targeting shorter-term moves.
Reinforced Signal (M+): A high-quality setup where multiple trend and momentum factors are in alignment. These are the signals that form the foundation of a consistent strategy.
ALPHA Signal (A++): The "Golden Setup." A rare confluence of ideal market conditions, confirmed by an algorithm that detects institutional strength. These are the highest-conviction signals, designed to capture the most significant market moves.
✅ Key Features
High-Precision Signals: A proprietary algorithm identifies entry points based on momentum and trend continuation.
Signal Quality Grading: Every signal is graded (M, M+, A++) so you instantly know the strength of each opportunity.
100% Non-Repainting: What you see on the chart is exactly how signals would have appeared in real-time. Absolute reliability for your studies and visual backtesting.
Dynamic Risk Management: Stop Loss and Take Profit levels are automatically calculated based on the market's current volatility (ATR), adapting to any asset.
Multiple Exit Modes: Configure your exit strategy to suit your style, whether for scalping, day trading, or swing trading.
Complete Performance Dashboard: Track key performance metrics directly on your chart, allowing for quick and efficient optimization.
Integrated Alert System: Never miss an opportunity. Receive detailed alerts, including the signal's quality grade, on your mobile device or desktop.
How to Use: The Sniper Philosophy
Alpha Signal PRO is designed for traders who prefer quality over quantity.
Focus on ALPHA Signals: Patience is key. Wait for the A++ setups, which represent the best opportunities the system can find.
Adapt to the Asset: The strategy thrives on momentum-driven assets like Indices, Crypto, and Metals. For slower, mean-reverting markets like Forex pairs, we strongly recommend using higher timeframes (H1, H4) to capture clearer trends.
Trust the Risk Management: Use the ATR-based SL and TP levels as a foundation for solid and consistent risk management.
Access
This is a private, invite-only indicator. It will not be made available in the public TradingView library.
Disclaimer: Success in trading requires more than a good tool. It is essential to combine the use of Alpha Signal PRO with strict risk management and discipline. Past performance is not indicative of future results.

Pivot Regime Anchored VWAP [CHE] Pivot Regime Anchored VWAP — Detects body-based pivot regimes to classify swing highs and lows, anchoring volume-weighted average price lines directly at higher highs and lower lows for adaptive reference levels.
Summary
This indicator identifies shifts between top and bottom regimes through breakouts in candle body highs and lows, labeling swing points as higher highs, lower highs, lower lows, or higher lows. It then draws anchored volume-weighted average price lines starting from the most recent higher high and lower low, providing dynamic support and resistance that evolve with volume flow. These anchored lines differ from standard volume-weighted averages by resetting only at confirmed swing extremes, reducing noise in ranging markets while highlighting momentum shifts in trends.
Motivation: Why this design?
Traders often struggle with static reference lines that fail to adapt to changing market structures, leading to false breaks in volatile conditions or missed continuations in trends. By anchoring volume-weighted average price calculations to body pivot regimes—specifically at higher highs for resistance and lower lows for support—this design creates reference levels tied directly to price structure extremes. This approach addresses the problem of generic moving averages lagging behind swing confirmations, offering a more context-aware tool for intraday or swing trading.
What’s different vs. standard approaches?
- Baseline reference: Traditional volume-weighted average price indicators compute a running total from session start or fixed periods, often ignoring price structure.
- Architecture differences:
- Regime detection via body breakout logic switches between high and low focus dynamically.
- Anchoring limited to confirmed higher highs and lower lows, with historical recalculation for accurate line drawing.
- Polyline rendering rebuilds only on the last bar to manage performance.
- Practical effect: Charts show fewer, more meaningful lines that start at swing points, making it easier to spot confluences with structure breaks rather than cluttered overlays from continuous calculations.
How it works (technical)
The indicator first calculates the maximum and minimum of each candle's open and close to define body highs and lows. It then scans a lookback window for the highest body high and lowest body low. A top regime triggers when the body high from the lookback period exceeds the window's highest, and a bottom regime when the body low falls below the window's lowest. These regime shifts confirm pivots only when crossing from one state to the other.
For top pivots, it compares the new body high against the previous swing high: if greater, it marks a higher high and anchors a new line; otherwise, a lower high. The same logic applies inversely for bottom pivots. Anchored lines use cumulative price-volume products and volumes from the anchor bar onward, subtracting prior cumulatives to isolate the segment. On pivot confirmation, it loops backward from the current bar to the anchor, computing and storing points for the line. New points append as bars advance, ensuring the line reflects ongoing volume weighting.
Initialization uses persistent variables to track the last swing values and anchor bars, starting with neutral states. Data flows from regime detection to pivot classification, then to anchoring and point accumulation, with lines rendered globally on the final bar.
Parameter Guide
Pivot Length — Controls the lookback window for detecting body breakouts, influencing pivot frequency and sensitivity to recent action. Shorter values catch more pivots in choppy conditions; longer smooths for major swings. Default: 30 (bars). Trade-offs/Tips: Min 1; for intraday, try 10–20 to reduce lag but watch for noise; on daily, 50+ for stability.
Show Pivot Labels — Toggles display of text markers at swing points, aiding quick identification of higher highs, lower highs, lower lows, or higher lows. Default: true. Trade-offs/Tips: Disable in multi-indicator setups to declutter; useful for backtesting structure.
HH Color — Sets the line and label color for higher high anchored lines, distinguishing resistance levels. Default: Red (solid). Trade-offs/Tips: Choose contrasting hues for dark/light themes; pair with opacity for fills if added later.
LL Color — Sets the line and label color for lower low anchored lines, distinguishing support levels. Default: Lime (solid). Trade-offs/Tips: As above; green shades work well for bullish contexts without overpowering candles.
Reading & Interpretation
Higher high labels and red lines indicate potential resistance zones where volume weighting begins at a new swing top, suggesting sellers may defend prior highs. Lower low labels and lime lines mark support from a fresh swing bottom, with the line's slope reflecting buyer commitment via volume. Lower highs or higher lows appear as labels without new anchors, signaling possible range-bound action. Line proximity to price shows overextension; crosses may hint at regime shifts, but confirm with volume spikes.
Practical Workflows & Combinations
- Trend following: Enter longs above a rising lower low anchored line after higher low confirmation; filter with rising higher highs for uptrends. Use line breaks as trailing stops.
- Exits/Stops: In downtrends, exit shorts below a higher high line; set aggressive stops above it for scalps, conservative below for swings. Pair with momentum oscillators for divergence.
- Multi-asset/Multi-TF: Defaults suit forex/stocks on 1H–4H; on crypto 15M, shorten length to 15. Scale colors for dark themes; combine with higher timeframe anchors for confluence.
Behavior, Constraints & Performance
Closed-bar logic ensures pivots confirm after the lookback period, with no repainting on historical bars—live bars may adjust until regime shift. No higher timeframe calls, so minimal repaint risk beyond standard delays. Resources include a 2000-bar history limit, label/polyline caps at 200/50, and loops for historical point filling (up to current bar count from anchor, typically under 500 iterations). Known limits: In extreme gaps or low-volume periods, anchors may skew; lines absent until first pivots.
Sensible Defaults & Quick Tuning
Start with the 30-bar length for balanced pivot detection across most assets. For too-frequent pivots in ranges, increase to 50 for fewer signals. If lines lag in trends, reduce to 20 and enable labels for visual cues. In low-volatility assets, widen color contrasts; test on 100-bar history to verify stability.
What this indicator is—and isn’t
This is a structure-aware visualization layer for anchoring volume-weighted references at swing extremes, enhancing manual analysis of regimes and levels. It is not a standalone signal generator or predictive model—always integrate with broader context like order flow or news. Use alongside risk management and position sizing, not as isolated buy/sell triggers.
Many thanks to LuxAlgo for the original script "McDonald's Pattern ". The implementation for body pivots instead of wicks uses a = max(open, close), b = min(open, close) and then highest(a, length) / lowest(b, length). This filters noise from the wicks and detects breakouts over/under bodies. Unusual and targeted, super innovative.
Disclaimer
The content provided, including all code and materials, is strictly for educational and informational purposes only. It is not intended as, and should not be interpreted as, financial advice, a recommendation to buy or sell any financial instrument, or an offer of any financial product or service. All strategies, tools, and examples discussed are provided for illustrative purposes to demonstrate coding techniques and the functionality of Pine Script within a trading context.
Any results from strategies or tools provided are hypothetical, and past performance is not indicative of future results. Trading and investing involve high risk, including the potential loss of principal, and may not be suitable for all individuals. Before making any trading decisions, please consult with a qualified financial professional to understand the risks involved.
By using this script, you acknowledge and agree that any trading decisions are made solely at your discretion and risk.
Do not use this indicator on Heikin-Ashi, Renko, Kagi, Point-and-Figure, or Range charts, as these chart types can produce unrealistic results for signal markers and alerts.
Best regards and happy trading
Chervolino

Historical Matrix Analyzer [PhenLabs]📊Historical Matrix Analyzer
Version: PineScriptv6
📌Description
The Historical Matrix Analyzer is an advanced probabilistic trading tool that transforms technical analysis into a data-driven decision support system. By creating a comprehensive 56-cell matrix that tracks every combination of RSI states and multi-indicator conditions, this indicator reveals which market patterns have historically led to profitable outcomes and which have not.
At its core, the indicator continuously monitors seven distinct RSI states (ranging from Extreme Oversold to Extreme Overbought) and eight unique indicator combinations (MACD direction, volume levels, and price momentum). For each of these 56 possible market states, the system calculates average forward returns, win rates, and occurrence counts based on your configurable lookback period. The result is a color-coded probability matrix that shows you exactly where you stand in the historical performance landscape.
The standout feature is the Current State Panel, which provides instant clarity on your active market conditions. This panel displays signal strength classifications (from Strong Bullish to Strong Bearish), the average return percentage for similar past occurrences, an estimated win rate using Bayesian smoothing to prevent small-sample distortions, and a confidence level indicator that warns you when insufficient data exists for reliable conclusions.
🚀Points of Innovation
Multi-dimensional state classification combining 7 RSI levels with 8 indicator combinations for 56 unique trackable market conditions
Bayesian win rate estimation with adjustable smoothing strength to provide stable probability estimates even with limited historical samples
Real-time active cell highlighting with “NOW” marker that visually connects current market conditions to their historical performance data
Configurable color intensity sensitivity allowing traders to adjust heat-map responsiveness from conservative to aggressive visual feedback
Dual-panel display system separating the comprehensive statistics matrix from an easy-to-read current state summary panel
Intelligent confidence scoring that automatically warns traders when occurrence counts fall below reliable thresholds
🔧Core Components
RSI State Classification: Segments RSI readings into 7 distinct zones (Extreme Oversold <20, Oversold 20-30, Weak 30-40, Neutral 40-60, Strong 60-70, Overbought 70-80, Extreme Overbought >80) to capture momentum extremes and transitions
Multi-Indicator Condition Tracking: Simultaneously monitors MACD crossover status (bullish/bearish), volume relative to moving average (high/low), and price direction (rising/falling) creating 8 binary-encoded combinations
Historical Data Storage Arrays: Maintains rolling lookback windows storing RSI states, indicator states, prices, and bar indices for precise forward-return calculations
Forward Performance Calculator: Measures price changes over configurable forward bar periods (1-20 bars) from each historical state, accumulating total returns and win counts per matrix cell
Bayesian Smoothing Engine: Applies statistical prior assumptions (default 50% win rate) weighted by user-defined strength parameter to stabilize estimated win rates when sample sizes are small
Dynamic Color Mapping System: Converts average returns into color-coded heat map with intensity adjusted by sensitivity parameter and transparency modified by confidence levels
🔥Key Features
56-Cell Probability Matrix: Comprehensive grid displaying every possible combination of RSI state and indicator condition, with each cell showing average return percentage, estimated win rate, and occurrence count for complete statistical visibility
Current State Info Panel: Dedicated display showing your exact position in the matrix with signal strength emoji indicators, numerical statistics, and color-coded confidence warnings for immediate situational awareness
Customizable Lookback Period: Adjustable historical window from 50 to 500 bars allowing traders to focus on recent market behavior or capture longer-term pattern stability across different market cycles
Configurable Forward Performance Window: Select target holding periods from 1 to 20 bars ahead to align probability calculations with your trading timeframe, whether day trading or swing trading
Visual Heat Mapping: Color-coded cells transition from red (bearish historical performance) through gray (neutral) to green (bullish performance) with intensity reflecting statistical significance and occurrence frequency
Intelligent Data Filtering: Minimum occurrence threshold (1-10) removes unreliable patterns with insufficient historical samples, displaying gray warning colors for low-confidence cells
Flexible Layout Options: Independent positioning of statistics matrix and info panel to any screen corner, accommodating different chart layouts and personal preferences
Tooltip Details: Hover over any matrix cell to see full RSI label, complete indicator status description, precise average return, estimated win rate, and total occurrence count
🎨Visualization
Statistics Matrix Table: A 9-column by 8-row grid with RSI states labeling vertical axis and indicator combinations on horizontal axis, using compact abbreviations (XOverS, OverB, MACD↑, Vol↓, P↑) for space efficiency
Active Cell Indicator: The current market state cell displays “⦿ NOW ⦿” in yellow text with enhanced color saturation to immediately draw attention to relevant historical performance
Signal Strength Visualization: Info panel uses emoji indicators (🔥 Strong Bullish, ✅ Bullish, ↗️ Weak Bullish, ➖ Neutral, ↘️ Weak Bearish, ⛔ Bearish, ❄️ Strong Bearish, ⚠️ Insufficient Data) for rapid interpretation
Histogram Plot: Below the price chart, a green/red histogram displays the current cell’s average return percentage, providing a time-series view of how historical performance changes as market conditions evolve
Color Intensity Scaling: Cell background transparency and saturation dynamically adjust based on both the magnitude of average returns and the occurrence count, ensuring visual emphasis on reliable patterns
Confidence Level Display: Info panel bottom row shows “High Confidence” (green), “Medium Confidence” (orange), or “Low Confidence” (red) based on occurrence counts relative to minimum threshold multipliers
📖Usage Guidelines
RSI Period
Default: 14
Range: 1 to unlimited
Description: Controls the lookback period for RSI momentum calculation. Standard 14-period provides widely-recognized overbought/oversold levels. Decrease for faster, more sensitive RSI reactions suitable for scalping. Increase (21, 28) for smoother, longer-term momentum assessment in swing trading. Changes affect how quickly the indicator moves between the 7 RSI state classifications.
MACD Fast Length
Default: 12
Range: 1 to unlimited
Description: Sets the faster exponential moving average for MACD calculation. Standard 12-period setting works well for daily charts and captures short-term momentum shifts. Decreasing creates more responsive MACD crossovers but increases false signals. Increasing smooths out noise but delays signal generation, affecting the bullish/bearish indicator state classification.
MACD Slow Length
Default: 26
Range: 1 to unlimited
Description: Defines the slower exponential moving average for MACD calculation. Traditional 26-period setting balances trend identification with responsiveness. Must be greater than Fast Length. Wider spread between fast and slow increases MACD sensitivity to trend changes, impacting the frequency of indicator state transitions in the matrix.
MACD Signal Length
Default: 9
Range: 1 to unlimited
Description: Smoothing period for the MACD signal line that triggers bullish/bearish state changes. Standard 9-period provides reliable crossover signals. Shorter values create more frequent state changes and earlier signals but with more whipsaws. Longer values produce more confirmed, stable signals but with increased lag in detecting momentum shifts.
Volume MA Period
Default: 20
Range: 1 to unlimited
Description: Lookback period for volume moving average used to classify volume as “high” or “low” in indicator state combinations. 20-period default captures typical monthly trading patterns. Shorter periods (10-15) make volume classification more reactive to recent spikes. Longer periods (30-50) require more sustained volume changes to trigger state classification shifts.
Statistics Lookback Period
Default: 200
Range: 50 to 500
Description: Number of historical bars used to calculate matrix statistics. 200 bars provides substantial data for reliable patterns while remaining responsive to regime changes. Lower values (50-100) emphasize recent market behavior and adapt quickly but may produce volatile statistics. Higher values (300-500) capture long-term patterns with stable statistics but slower adaptation to changing market dynamics.
Forward Performance Bars
Default: 5
Range: 1 to 20
Description: Number of bars ahead used to calculate forward returns from each historical state occurrence. 5-bar default suits intraday to short-term swing trading (5 hours on hourly charts, 1 week on daily charts). Lower values (1-3) target short-term momentum trades. Higher values (10-20) align with position trading and longer-term pattern exploitation.
Color Intensity Sensitivity
Default: 2.0
Range: 0.5 to 5.0, step 0.5
Description: Amplifies or dampens the color intensity response to average return magnitudes in the matrix heat map. 2.0 default provides balanced visual emphasis. Lower values (0.5-1.0) create subtle coloring requiring larger returns for full saturation, useful for volatile instruments. Higher values (3.0-5.0) produce vivid colors from smaller returns, highlighting subtle edges in range-bound markets.
Minimum Occurrences for Coloring
Default: 3
Range: 1 to 10
Description: Required minimum sample size before applying color-coded performance to matrix cells. Cells with fewer occurrences display gray “insufficient data” warning. 3-occurrence default filters out rare patterns. Lower threshold (1-2) shows more data but includes unreliable single-event statistics. Higher thresholds (5-10) ensure only well-established patterns receive visual emphasis.
Table Position
Default: top_right
Options: top_left, top_right, bottom_left, bottom_right
Description: Screen location for the 56-cell statistics matrix table. Position to avoid overlapping critical price action or other indicators on your chart. Consider chart orientation and candlestick density when selecting optimal placement.
Show Current State Panel
Default: true
Options: true, false
Description: Toggle visibility of the dedicated current state information panel. When enabled, displays signal strength, RSI value, indicator status, average return, estimated win rate, and confidence level for active market conditions. Disable to declutter charts when only the matrix table is needed.
Info Panel Position
Default: bottom_left
Options: top_left, top_right, bottom_left, bottom_right
Description: Screen location for the current state information panel (when enabled). Position independently from statistics matrix to optimize chart real estate. Typically placed opposite the matrix table for balanced visual layout.
Win Rate Smoothing Strength
Default: 5
Range: 1 to 20
Description: Controls Bayesian prior weighting for estimated win rate calculations. Acts as virtual sample size assuming 50% win rate baseline. Default 5 provides moderate smoothing preventing extreme win rate estimates from small samples. Lower values (1-3) reduce smoothing effect, allowing win rates to reflect raw data more directly. Higher values (10-20) increase conservatism, pulling win rate estimates toward 50% until substantial evidence accumulates.
✅Best Use Cases
Pattern-based discretionary trading where you want historical confirmation before entering setups that “look good” based on current technical alignment
Swing trading with holding periods matching your forward performance bar setting, using high-confidence bullish cells as entry filters
Risk assessment and position sizing, allocating larger size to trades originating from cells with strong positive average returns and high estimated win rates
Market regime identification by observing which RSI states and indicator combinations are currently producing the most reliable historical patterns
Backtesting validation by comparing your manual strategy signals against the historical performance of the corresponding matrix cells
Educational tool for developing intuition about which technical condition combinations have actually worked versus those that feel right but lack historical evidence
⚠️Limitations
Historical patterns do not guarantee future performance, especially during unprecedented market events or regime changes not represented in the lookback period
Small sample sizes (low occurrence counts) produce unreliable statistics despite Bayesian smoothing, requiring caution when acting on low-confidence cells
Matrix statistics lag behind rapidly changing market conditions, as the lookback period must accumulate new state occurrences before updating performance data
Forward return calculations use fixed bar periods that may not align with actual trade exit timing, support/resistance levels, or volatility-adjusted profit targets
💡What Makes This Unique
Multi-Dimensional State Space: Unlike single-indicator tools, simultaneously tracks 56 distinct market condition combinations providing granular pattern resolution unavailable in traditional technical analysis
Bayesian Statistical Rigor: Implements proper probabilistic smoothing to prevent overconfidence from limited data, a critical feature missing from most pattern recognition tools
Real-Time Contextual Feedback: The “NOW” marker and dedicated info panel instantly connect current market conditions to their historical performance profile, eliminating guesswork
Transparent Occurrence Counts: Displays sample sizes directly in each cell, allowing traders to judge statistical reliability themselves rather than hiding data quality issues
Fully Customizable Analysis Window: Complete control over lookback depth and forward return horizons lets traders align the tool precisely with their trading timeframe and strategy requirements
🔬How It Works
1. State Classification and Encoding
Each bar’s RSI value is evaluated and assigned to one of 7 discrete states based on threshold levels (0: <20, 1: 20-30, 2: 30-40, 3: 40-60, 4: 60-70, 5: 70-80, 6: >80)
Simultaneously, three binary conditions are evaluated: MACD line position relative to signal line, current volume relative to its moving average, and current close relative to previous close
These three binary conditions are combined into a single indicator state integer (0-7) using binary encoding, creating 8 possible indicator combinations
The RSI state and indicator state are stored together, defining one of 56 possible market condition cells in the matrix
2. Historical Data Accumulation
As each bar completes, the current state classification, closing price, and bar index are stored in rolling arrays maintained at the size specified by the lookback period
When the arrays reach capacity, the oldest data point is removed and the newest added, creating a sliding historical window
This continuous process builds a comprehensive database of past market conditions and their subsequent price movements
3. Forward Return Calculation and Statistics Update
On each bar, the indicator looks back through the stored historical data to find bars where sufficient forward bars exist to measure outcomes
For each historical occurrence, the price change from that bar to the bar N periods ahead (where N is the forward performance bars setting) is calculated as a percentage return
This percentage return is added to the cumulative return total for the specific matrix cell corresponding to that historical bar’s state classification
Occurrence counts are incremented, and wins are tallied for positive returns, building comprehensive statistics for each of the 56 cells
The Bayesian smoothing formula combines these raw statistics with prior assumptions (neutral 50% win rate) weighted by the smoothing strength parameter to produce estimated win rates that remain stable even with small samples
💡Note:
The Historical Matrix Analyzer is designed as a decision support tool, not a standalone trading system. Best results come from using it to validate discretionary trade ideas or filter systematic strategy signals. Always combine matrix insights with proper risk management, position sizing rules, and awareness of broader market context. The estimated win rate feature uses Bayesian statistics specifically to prevent false confidence from limited data, but no amount of smoothing can create reliable predictions from fundamentally insufficient sample sizes. Focus on high-confidence cells (green-colored confidence indicators) with occurrence counts well above your minimum threshold for the most actionable insights.

Chronos Reversal Labs🧬 Chronos Reversal Lab - Machine Learning Market Structure Analysis
OVERVIEW
Chronos Reversal Lab (CRL) is an advanced market structure analyzer that combines computational intelligence kernels with classical technical analysis to identify high-probability reversal opportunities. The system integrates Shannon Entropy analysis, Detrended Fluctuation Analysis (DFA), Kalman adaptive filtering, and harmonic pattern recognition into a unified confluence-based signal engine.
WHAT MAKES IT ORIGINAL
Unlike traditional reversal indicators that rely solely on oscillators or pattern recognition, CRL employs a multi-kernel machine learning approach that analyzes market behavior through information theory, statistical physics, and adaptive state-space estimation. The system combines these computational methods with geometric pattern analysis and market microstructure to create a comprehensive reversal detection framework.
HOW IT WORKS (Technical Methodology)
1. COMPUTATIONAL KERNELS
Shannon Entropy Analysis
Measures market uncertainty using information theory:
• Discretizes price returns into bins (user-configurable 5-20 bins)
• Calculates probability distribution entropy over lookback window
• Normalizes entropy to 0-1 scale (0 = perfectly predictable, 1 = random)
• Low entropy states (< 0.3 default) indicate algorithmic clarity phases
• When entropy drops, directional moves become statistically more probable
Detrended Fluctuation Analysis (DFA)
Statistical technique measuring long-range correlations:
• Analyzes price series across multiple box sizes (4 to user-set maximum)
• Calculates fluctuation scaling exponent (Alpha)
• Alpha > 0.5: Trend persistence (momentum regime)
• Alpha < 0.5: Mean reversion tendency (reversal regime)
• Alpha range 0.3-1.5 mapped to trading strategies
Kalman Adaptive Filter
State-space estimation for lag-free trend tracking:
• Maintains separate fast and slow Kalman filters
• Process noise and measurement noise are user-configurable
• Tracks price state with adaptive gain adjustments
• Calculates acceleration (second derivative) for momentum detection
• Provides cleaner trend signals than traditional moving averages
2. HARMONIC PATTERN DETECTION
Identifies geometric reversal patterns:
• Gartley: 0.618 AB/XA, 0.786 AD/XA retracement
• Bat: 0.382-0.5 AB/XA, 0.886 AD/XA retracement
• Butterfly: 0.786 AB/XA, 1.272-1.618 AD/XA extension
• Cypher: 0.382-0.618 AB/XA, 0.786 AD/XA retracement
Pattern Validation Process:
• Requires alternating swing structure (XABCD points)
• Fibonacci ratio tolerance: 0.02-0.20 (user-adjustable precision)
• Minimum 50% ratio accuracy score required
• PRZ (Potential Reversal Zone) calculated around D point
• Zone size: ATR-based with pattern-specific multipliers
• Active pattern tracking with 100-bar invalidation window
3. MARKET STRUCTURE ANALYSIS
Swing Point Detection:
• Pivot-based swing identification (3-21 bars configurable)
• Minimum swing size: ATR multiples (0.5-5.0x)
• Adaptive filtering: volatility regime adjustment (0.7-1.3x)
• Swing confirmation tracking with RSI and volume context
• Maintains structural history (up to 500 swings)
Break of Structure (BOS):
• Detects price crossing previous swing highs/lows
• Used for trend continuation vs reversal classification
• Optional requirement for signal validation
Support/Resistance Detection:
• Identifies horizontal levels from swing clusters
• Touch counting algorithm (price within ATR×0.3 tolerance)
• Weighted by recency and number of tests
• Dynamic updating as structure evolves
4. CONFLUENCE SCORING SYSTEM
Multi-factor analysis with regime-aware weighting:
Hierarchical Kernel Logic:
• Entropy gates advanced kernel activation
• Only when entropy < threshold do DFA and Kalman accelerate scoring
• Prevents false signals during chaotic (high entropy) conditions
Scoring Components:
ML Kernels (when entropy low):
• Low entropy + trend alignment: +3.0 points × trend weight
• DFA super-trend (α>1.5): +4.0 points × trend weight
• DFA persistence (α>0.65): +2.5 points × trend weight
• DFA mean-reversion (α<0.35): +2.0 points × mean-reversion weight
• Kalman acceleration: up to +3.0 points (scaled by magnitude)
Classical Technical Analysis:
• RSI oversold (<30) / overbought (>70): +1.5 points
• RSI divergence (bullish/bearish): +2.5 points
• High relative volume (>1.5x): +0-2.0 points (scaled)
• Volume impulse (>2.0x): +1.5 points
• VWAP extremes: +1.0 point
• Trend alignment (Kalman fast vs slow): +1.5 points
• MACD crossover/momentum: +1.0 point
Structural Factors:
• Near support (within 0.5 ATR): +0-2.0 points (inverse distance)
• Near resistance (within 0.5 ATR): +0-2.0 points (inverse distance)
• Harmonic PRZ zone: +3.0 to +6.0 points (pattern score dependent)
• Break of structure: +1.5 points
Regime Adjustments:
• Trend weight: 1.5× in trend regime, 0.5× in mean-reversion
• Mean-reversion weight: 1.5× in MR regime, 0.5× in trend
• Volatility multiplier: 0.7-1.3× based on ATR regime
• Theory mode multiplier: 0.8× (Conservative) to 1.2× (APEX)
Final Threshold:
Base threshold (default 3.5) adjusted by:
• Theory mode: -0.3 (APEX) to +0.8 (Conservative)
• Regime: +0.5 (high vol) to -0.3 (low vol or strong trend)
• Filter: +0.2 if regime filter enabled
5. SIGNAL GENERATION ARCHITECTURE
Five-stage validation process:
Stage 1 - ML Kernel Analysis:
• Entropy threshold check
• DFA regime classification
• Kalman acceleration confirmation
Stage 2 - Structural Confirmation:
• Market structure supports directional bias
• BOS alignment (if required)
• Swing point validation
Stage 3 - Trigger Validation:
• Engulfing candle (if required)
• HTF bias confirmation (if strict HTF enabled)
• Harmonic PRZ alignment (if confirmation enabled)
Stage 4 - Consistency Check:
• Anticipation depth: checks N bars back (1-13 configurable)
• Ensures Kalman acceleration direction persists
• Filters whipsaw conditions
Stage 5 - Structural Soundness (Critical Filter):
• Verifies adequate room before next major swing level
• Long signals: must have >0.25 ATR clearance to last swing high
• Short signals: must have >0.25 ATR clearance to last swing low
• Prevents trades directly into obvious structural barriers
Dynamic Risk Management:
• Stop-loss: Placed beyond last structural swing ± 2 ticks
• Take-profit 1: Risk × configurable R1 multiplier (default 1.5R)
• Take-profit 2: Risk × configurable R2 multiplier (default 3.0R)
• Confidence score: Calibrated 0-99% based on confluence + kernel boost
6. ADAPTIVE REGIME SYSTEM
Continuous market state monitoring:
Trend Regime:
• Kalman fast vs slow positioning
• Multi-timeframe alignment (optional HTF)
• Strength: ATR-normalized fast/slow spread
Volatility Regime:
• Current ATR vs 100-bar average
• Regime ratio: 0.7-1.3 typical range
• Affects swing size filtering and cooldown periods
Signal Cooldown:
• Base: User-set bars (1-300)
• High volatility (>1.5): cooldown × 1.5
• Low volatility (<0.5): cooldown × 0.7
• Post-BOS: minimum 20-bar cooldown enforced
FOUR OPERATIONAL MODES
CONSERVATIVE MODE:
• Threshold adjustment: +0.8
• Mode multiplier: 0.8×
• Strictest filtering for highest quality
• Recommended for: Beginners, large accounts, swing trading
• Expected signals: 3-5 per week (typical volatile instrument)
BALANCED MODE:
• Threshold adjustment: +0.3
• Mode multiplier: 1.0×
• Standard operational parameters
• Recommended for: General trading, learning phase
• Expected signals: 5-10 per week
APEX MODE:
• Threshold adjustment: -0.3
• Mode multiplier: 1.2×
• Maximum sensitivity, reduced cooldowns
• Recommended for: Scalping, high volatility, experienced traders
• Expected signals: 10-20 per week
INSTITUTIONAL MODE:
• Threshold adjustment: +0.5
• Mode multiplier: 1.1×
• Enhanced structural weighting, HTF emphasis
• Recommended for: Professional traders, swing positions
• Expected signals: 4-8 per week
VISUAL COMPONENTS
1. Fibonacci Retracement Levels
• Auto-calculated from most recent swing structure
• Standard levels: 0%, 23.6%, 38.2%, 50%, 61.8%, 78.6%, 100%, 127.2%, 161.8%, 200%, 261.8%
• Key levels emphasized (50%, 61.8%, 100%, 161.8%)
• Color gradient from bullish to bearish based on level
• Automatic cleanup when levels are crossed
• Label intensity control (None/Fib only/All)
2. Support and Resistance Lines
• Dynamic horizontal levels from swing clusters
• Width: 2px solid lines
• Colors: Green (support), Red (resistance)
• Labels show price and level type
• Touch-based validation (minimum 2 touches)
• Real-time updates and invalidation
3. Harmonic PRZ Boxes
• Displayed around pattern completion (D point)
• Pattern-specific colors (Gartley: purple, Bat: orange, etc.)
• Box height: ATR-based zone sizing
• Score-dependent transparency
• 100-bar active window before removal
4. Confluence Boxes
• Appear when confluence ≥ threshold
• Yellow/orange gradient based on score strength
• Height: High to low of bar
• Width: 1 bar on each side
• Real-time score-based transparency
5. Kalman Filter Lines
• Fast filter: Bullish color (green default)
• Slow filter: Bearish color (red default)
• Width: 2px
• Transparency adjustable (0-90%)
• Optional display toggle
6. Signal Markers
• Long: Green triangle below bar (tiny size)
• Short: Red triangle above bar (tiny size)
• Appear only on confirmed signals
• Includes alert generation
7. Premium Dashboard
Features real-time metrics with visual gauges:
Layout Options:
• Position: 4 corners selectable
• Size: Small (9 rows) / Normal (12 rows) / Large (14 rows)
• Themes: Supreme, Cosmic, Vortex, Heritage
Metrics Displayed:
• Gamma (DFA - 0.5): Shows trend persistence vs mean-reversion
• TCI (Trend Strength): ATR-normalized Kalman spread with gauge
• v/c (Relative Volume): Current vs average with color coding
• Entropy: Market predictability state with gauge
• HFL (High-Frequency Line): Kalman fast/slow difference / ATR
• HFL_acc (Acceleration): Second derivative momentum
• Mem Bias: Net bullish-bearish confluence (-1 to +1)
• Assurance: Confidence × (1-entropy) metric
• Squeeze: Bollinger Band / Keltner Channel squeeze detection
• Breakout P: Probability estimate from DFA + trend + acceleration
• Score: Final confluence vs threshold (normalized)
• Neighbors: Active harmonic patterns count
• Signal Strength: Strong/Moderate/Weak classification
• Signal Banner: Current directional bias with emoji indicators
Gauge Visualization:
• 10-bar horizontal gauges (█ filled, ░ empty)
• Color-coded: Green (strong) / Gold (moderate) / Red (weak)
• Real-time updates every bar
HOW TO USE
Step 1: Configure Mode and Resolution
• Select Theory Mode based on trading style (Conservative/Balanced/APEX/Institutional)
• Set Structural Resolution (Standard for fast markets, High for balanced, Ultra/Institutional for swing)
• Enable Adaptive Filtering (recommended for all volatile assets)
Step 2: Enable Desired Kernels
• Shannon Entropy: Essential for predictability detection (recommended ON)
• DFA Analysis: Critical for regime classification (recommended ON)
• Kalman Filter: Provides lag-free trend tracking (recommended ON)
• All three work synergistically; disabling reduces effectiveness
Step 3: Configure Confluence Factors
• Enable desired technical factors (RSI, MACD, Volume, Divergence)
• Enable Liquidity Mapping for support/resistance proximity scoring
• Enable Harmonic Detection if trading pattern-based setups
• Adjust base confluence threshold (3.5 default; higher = fewer, cleaner signals)
Step 4: Set Trigger Requirements
• Require Engulfing: Adds precision, reduces frequency (recommended for Conservative)
• Require BOS: Ensures structural alignment (recommended for trend-following)
• Require Structural Soundness: Critical filter preventing traps (highly recommended)
• Strict HTF Bias: For multi-timeframe traders only
Step 5: Adjust Visual Preferences
• Enable/disable Fibonacci levels, S/R lines, PRZ boxes, confluence boxes
• Set label intensity (None/Fib/All)
• Adjust transparency (0-90%) for overlay clarity
• Configure dashboard position, size, and theme
Step 6: Configure Alerts
• Enable master alerts toggle
• Select alert types: Anticipation, Confirmation, High Confluence, Low Entropy
• Enable JSON details for automated trading integration
Step 7: Interpret Signals
• Wait for triangle markers (green up = long, red down = short)
• Check dashboard for confluence score, entropy, DFA regime
• Verify signal aligns with higher timeframe bias (if using HTF setting)
• Confirm adequate space to take-profit levels (no nearby structural barriers)
Step 8: Execute and Manage
• Enter at close of signal candle (or next bar open)
• Set stop-loss at calculated level (visible in alert if JSON enabled)
• Scale out at TP1 (1.5R default), trail remaining to TP2 (3.0R default)
• Exit early if entropy spikes >0.7 or DFA regime flips against position
CUSTOMIZATION GUIDE
Timeframe Optimization:
Scalping (1-5 minutes):
• Theory Mode: APEX
• Anticipation Depth: 3-5
• Structural Resolution: STANDARD
• Signal Cooldown: 8-12 bars
• Enable fast kernels, disable HTF bias
Day Trading (15m-1H):
• Theory Mode: BALANCED
• Anticipation Depth: 5-8
• Structural Resolution: HIGH
• Signal Cooldown: 12-20 bars
• Standard configuration
Swing Trading (4H-Daily):
• Theory Mode: INSTITUTIONAL
• Anticipation Depth: 8-13
• Structural Resolution: ULTRA or INSTITUTIONAL
• Signal Cooldown: 20-50 bars
• Enable HTF bias, strict confirmations
Market Type Optimization:
Forex Majors:
• All kernels enabled
• Harmonic patterns effective
• Balanced or Institutional mode
• Standard settings work well
Stock Indices:
• Emphasis on volume analysis
• DFA critical for regime detection
• Conservative or Balanced mode
• Enable liquidity mapping
Cryptocurrencies:
• Adaptive filtering essential
• Higher volatility regime expected
• APEX mode for active trading
• Wider ATR multiples for swing sizing
IMPORTANT DISCLAIMERS
• This indicator does not predict future price movements
• Computational kernels calculate probabilities, not certainties
• Past confluence scores do not guarantee future signal performance
• Always backtest on YOUR specific instruments and timeframes before live trading
• Machine learning kernels require calibration period (minimum 100 bars of data)
• Performance varies significantly across market conditions and regimes
• Signals are suggestions for analysis, not automated trading instructions
• Proper risk management (stops, position sizing) is mandatory
• Complex calculations may impact performance on lower-end devices
• Designed for liquid markets; avoid illiquid or gap-prone instruments
PERFORMANCE CONSIDERATIONS
Computational Intensity:
• DFA analysis: Moderate (scales with length and box size parameters)
• Entropy calculation: Moderate (scales with lookback and bins)
• Kalman filtering: Low (efficient state-space updates)
• Harmonic detection: Moderate to High (pattern matching across swing history)
• Overall: Medium computational load
Optimization Tips:
• Reduce Structural Analysis Depth (144 default → 50-100 for faster performance)
• Increase Calc Step (2 default → 3-4 for lighter load)
• Reduce Pattern Analysis Depth (8 default → 3-5 if harmonics not primary focus)
• Limit Draw Window (150 bars default prevents visual clutter on long charts)
• Disable unused confluence factors to reduce calculations
Best Suited For:
• Liquid instruments: Major forex, stock indices, large-cap crypto
• Active timeframes: 5-minute through daily (avoid tick/second charts)
• Trending or ranging markets: Adapts to both via regime detection
• Pattern traders: Harmonic integration adds geometric confluence
• Multi-timeframe analysts: HTF bias and regime detection support this approach
Not Recommended For:
• Illiquid penny stocks or micro-cap altcoins
• Markets with frequent gaps (stocks outside regular hours without gap adjustment)
• Extremely fast timeframes (tick, second charts) due to calculation overhead
• Pure mean-reversion systems (unless using CONSERVATIVE mode with DFA filters)
METHODOLOGY NOTE
The computational kernels (Shannon Entropy, DFA, Kalman Filter) are established statistical and signal processing techniques adapted for financial time series analysis. These are deterministic mathematical algorithms, not predictive AI models. The term "machine learning" refers to the adaptive, data-driven nature of the calculations, not neural networks or training processes.
Confluence scoring is rule-based with regime-dependent weighting. The system does not "learn" from historical trades but adapts its sensitivity to current volatility and trend conditions through mathematical regime classification.
SUPPORT & UPDATES
• Questions about configuration or usage? Send me a message on TradingView
• Feature requests are welcome for consideration in future updates
• Bug reports appreciated and addressed promptly
• I respond to messages within 24 hours
• Regular updates included (improvements, optimizations, new features)
FINAL REMINDERS
• This is an analytical tool for confluence analysis, not a standalone trading system
• Combine with your existing strategy, risk management, and market analysis
• Start with paper trading to learn the system's behavior on your markets
• Allow 50-100 signals minimum for performance evaluation
• Adjust parameters based on YOUR timeframe, instrument, and trading style
• No indicator guarantees profitable trades - proper risk management is essential
— Dskyz, Trade with insight. Trade with anticipation.
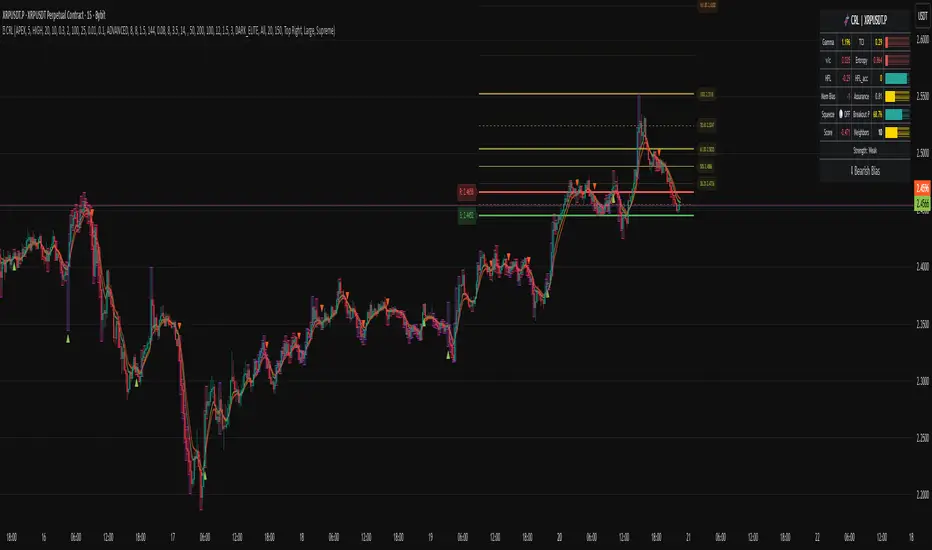
ORBs, EMAs, SMAs, AVWAPThis is an update to a previously published script. In short the difference is the added capability to adjust the length of EMAs. Also added 3 customizable SMAs. Enjoy! Let me know what you think of the script please. This is only second one I have ever done. Through practice and people like @LuxAlgo and other Pinescripters this isn't possible. Tedious hrs with ChatGPT to correct nuances, who doesnt seem to learn from (insert pronoun) mistakes
This all-in-one indicator combines key institutional tools into a unified framework for intraday and swing trading. Designed for traders who use multi-session analysis and dynamic levels, it automatically maps out global session breakouts, moving averages, and volume-weighted anchors with high clarity.
Features include:
🕓 Tokyo, London, and New York ORBs (Opening Range Breakouts) — 30-minute configurable range boxes that persist until the next New York open.
📈 Anchored VWAP with Standard Deviation Bands — dynamically anchorable to session, week, or month for institutional-grade price tracking.
📊 Exponential Moving Averages (9, 20, 113, 200) — for short-, mid-, and long-term momentum structure.
📉 Simple Moving Averages (20, 50, 100) — fully customizable lengths, colors, and visibility toggles for trend confirmation.
🏁 Prior High/Low Levels (PDH/PDL, PWH/PWL, PMH/PML) — automatically plotted from previous day, week, and month, with labels placed at each session’s midpoint.
🎛️ Session-Aligned Time Logic — all time calculations use New York session anchors with DST awareness.
💡 Clean Visualization Options — every component can be toggled on/off, recolored, or customized for your workflow.
Best used for:
ORB break-and-retest setups
VWAP and EMA rejections
Confluence-based trading around key session levels
Multi-session momentum tracking

Luxy Adaptive MA Cloud - Trend Strength & Signal Tracker V2Luxy Adaptive MA Cloud - Professional Trend Strength & Signal Tracker
Next-generation moving average cloud indicator combining ultra-smooth gradient visualization with intelligent momentum detection. Built for traders who demand clarity, precision, and actionable insights.
═══════════════════════════════════════════════
WHAT MAKES THIS INDICATOR SPECIAL?
═══════════════════════════════════════════════
Unlike traditional MA indicators that show static lines, Luxy Adaptive MA Cloud creates a living, breathing visualization of market momentum. Here's what sets it apart:
Exponential Gradient Technology
This isn't just a simple fill between two lines. It's a professionally engineered gradient system with 26 precision layers using exponential density distribution. The result? An organic, cloud-like appearance where the center is dramatically darker (15% transparency - where crossovers and price action occur), while edges fade gracefully (75% transparency). Think of it as a visual "heat map" of trend strength.
Dynamic Momentum Intelligence
Most MA clouds only show structure (which MA is on top). This indicator shows momentum strength in real-time through four intelligent states:
- 🟢 Bright Green = Explosive bullish momentum (both MAs rising strongly)
- 🔵 Blue = Weakening bullish (structure intact, but momentum fading)
- 🟠 Orange = Caution zone (bearish structure forming, weak momentum)
- 🔴 Deep Red = Strong bearish momentum (both MAs falling)
The cloud literally tells you when trends are accelerating or losing steam.
Conditional Performance Architecture
Every calculation is optimized for speed. Disable a feature? It stops calculating entirely—not just hidden, but not computed . The 26-layer gradient only renders when enabled. Toggle signals off? Those crossover checks don't run. This makes it one of the most efficient cloud indicators available, even with its advanced visual system.
Zero Repaint Guarantee
All signals and momentum states are based on confirmed bar data only . What you see in historical data is exactly what you would have seen trading live. No lookahead bias. No repainting tricks. No signals that "magically" appear perfect in hindsight. If a signal shows in history, it would have triggered in real-time at that exact moment.
Educational by Design
Every single input includes comprehensive tooltips with:
- Clear explanations of what each parameter does
- Practical examples of when to use different settings
- Recommended configurations for scalping, day trading, and swing trading
- Real-world trading impact ("This affects entry timing" vs "This is visual only")
You're not just getting an indicator—you're learning how to use it effectively .
═══════════════════════════════════════════════
THE GRADIENT CLOUD - TECHNICAL DETAILS
═══════════════════════════════════════════════
Architecture:
26 precision layers for silk-smooth transitions
Exponential density curve - layers packed tightly near center (where crossovers happen), spread wider at edges
75%-15% transparency range - center is highly opaque (15%), edges fade gracefully (75%)
V-Gradient design - emphasizes the action zone between Fast and Medium MAs
The Four Momentum States:
🟢 GREEN - Strong Bullish
Fast MA above Medium MA
Both MAs rising with momentum > 0.02%
Action: Enter/hold LONG positions, strong uptrend confirmed
🔵 BLUE - Weak Bullish
Fast MA above Medium MA
Weak or flat momentum
Action: Caution - bullish structure but losing strength, consider trailing stops
🟠 ORANGE - Weak Bearish
Medium MA above Fast MA
Weak or flat momentum
Action: Warning - bearish structure developing, consider exits
🔴 RED - Strong Bearish
Medium MA above Fast MA
Both MAs falling with momentum < -0.02%
Action: Enter/hold SHORT positions, strong downtrend confirmed
Smooth Transitions: The momentum score is smoothed using an 8-bar EMA to eliminate noise and prevent whipsaws. You see the true trend , not every minor fluctuation.
═══════════════════════════════════════════════
FLEXIBLE MOVING AVERAGE SYSTEM
═══════════════════════════════════════════════
Three Customizable MAs:
Fast MA (default: EMA 10) - Reacts quickly to price changes, defines short-term momentum
Medium MA (default: EMA 20) - Balances responsiveness with stability, core trend reference
Slow MA (default: SMA 200, optional) - Long-term trend filter, major support/resistance
Six MA Types Available:
EMA - Exponential; faster response, ideal for momentum and day trading
SMA - Simple; smooth and stable, best for swing trading and trend following
WMA - Weighted; middle ground between EMA and SMA
VWMA - Volume-weighted; reflects market participation, useful for liquid markets
RMA - Wilder's smoothing; used in RSI/ADX, excellent for trend filters
HMA - Hull; extremely responsive with minimal lag, aggressive option
Recommended Settings by Trading Style:
Scalping (1m-5m):
Fast: EMA(5-8)
Medium: EMA(10-15)
Slow: Not needed or EMA(50)
Day Trading (5m-1h):
Fast: EMA(10-12)
Medium: EMA(20-21)
Slow: SMA(200) for bias
Swing Trading (4h-1D):
Fast: EMA(10-20)
Medium: EMA(34-50)
Slow: SMA(200)
Pro Tip: Start with Fast < Medium < Slow lengths. The gradient works best when there's clear separation between Fast and Medium MAs.
═══════════════════════════════════════════════
CROSSOVER SIGNALS - CLEAN & RELIABLE
═══════════════════════════════════════════════
Golden Cross ⬆ LONG Signal
Fast MA crosses above Medium MA
Classic bullish reversal or trend continuation signal
Most reliable when accompanied by GREEN cloud (strong momentum)
Death Cross ⬇ SHORT Signal
Fast MA crosses below Medium MA
Classic bearish reversal or trend continuation signal
Most reliable when accompanied by RED cloud (strong momentum)
Signal Intelligence:
Anti-spam filter - Minimum 5 bars between signals prevents noise
Clean labels - Placed precisely at crossover points
Alert-ready - Built-in ALERTS for automated trading systems
No repainting - Signals based on confirmed bars only
Signal Quality Assessment:
High-Quality Entry:
Golden Cross + GREEN cloud + Price above both MAs
= Strong bullish setup ✓
Low-Quality Entry (skip or wait):
Golden Cross + ORANGE cloud + Choppy price action
= Weak bullish setup, likely whipsaw ✗
═══════════════════════════════════════════════
REAL-TIME INFO PANEL
═══════════════════════════════════════════════
An at-a-glance dashboard showing:
Trend Strength Indicator:
Visual display of current momentum state
Color-coded header matching cloud color
Instant recognition of market bias
MA Distance Table:
Shows percentage distance of price from each enabled MA:
Green rows : Price ABOVE MA (bullish)
Red rows : Price BELOW MA (bearish)
Gray rows : Price AT MA (rare, decision point)
Distance Interpretation:
+2% to +5%: Healthy uptrend
+5% to +10%: Getting extended, caution
+10%+: Overextended, expect pullback
-2% to -5%: Testing support
-5% to -10%: Oversold zone
-10%+: Deep correction or downtrend
Customization:
4 corner positions
5 font sizes (Tiny to Huge)
Toggle visibility on/off
═══════════════════════════════════════════════
HOW TO USE - PRACTICAL TRADING GUIDE
═══════════════════════════════════════════════
STRATEGY 1: Trend Following
Identify trend : Wait for GREEN (bullish) or RED (bearish) cloud
Enter on signal : Golden Cross in GREEN cloud = LONG, Death Cross in RED cloud = SHORT
Hold position : While cloud maintains color
Exit signals :
• Cloud turns ORANGE/BLUE = momentum weakening, tighten stops
• Opposite crossover = close position
• Cloud turns opposite color = full reversal
STRATEGY 2: Pullback Entries
Confirm trend : GREEN cloud established (bullish bias)
Wait for pullback : Price touches or crosses below Fast MA
Enter when : Price rebounds back above Fast MA with cloud still GREEN
Stop loss : Below Medium MA or recent swing low
Target : Previous high or when cloud weakens
STRATEGY 3: Momentum Confirmation
Your setup triggers : (e.g., chart pattern, support/resistance)
Check cloud color :
• GREEN = proceed with LONG
• RED = proceed with SHORT
• BLUE/ORANGE = skip or reduce size
Use gradient as confluence : Not as primary signal, but as momentum filter
Risk Management Tips:
Never enter against the cloud color (don't LONG in RED cloud)
Reduce position size during BLUE/ORANGE (transition periods)
Place stops beyond Medium MA for swing trades
Use Slow MA (200) as final trend filter - don't SHORT above it in uptrends
═══════════════════════════════════════════════
PERFORMANCE & OPTIMIZATION
═══════════════════════════════════════════════
Tested On:
Crypto: BTC, ETH, major altcoins
Stocks: SPY, AAPL, TSLA, QQQ
Forex: EUR/USD, GBP/USD, USD/JPY
Indices: S&P 500, NASDAQ, DJI
═══════════════════════════════════════════════
TRANSPARENCY & RELIABILITY
═══════════════════════════════════════════════
Educational Focus:
Detailed tooltips on every input
Clear documentation of methodology
Practical examples in descriptions
Teaches you why , not just what
Open Logic:
Momentum calculation: (Fast slope + Medium slope) / 2
Smoothing: 8-bar EMA to reduce noise
Thresholds: ±0.02% for strong momentum classification
Everything is transparent and explainable
═══════════════════════════════════════════════
COMPLETE FEATURE LIST
═══════════════════════════════════════════════
Visual Components:
26-layer exponential gradient cloud
3 customizable moving average lines
Golden Cross / Death Cross labels
Real-time info panel with trend strength
MA distance table
Calculation Features:
6 MA types (EMA, SMA, WMA, VWMA, RMA, HMA)
Momentum-based cloud coloring
Smoothed trend strength scoring
Conditional performance optimization
Customization Options:
All MA lengths adjustable
All colors customizable (when gradient disabled)
Panel position (4 corners)
Font sizes (5 options)
Toggle any feature on/off
Signal Features:
Anti-spam filter (configurable gap)
Clean, non-overlapping labels
Built-in alert conditions
No repainting guarantee
═══════════════════════════════════════════════
IMPORTANT DISCLAIMERS
═══════════════════════════════════════════════
This indicator is for educational and informational purposes only
Not financial advice - always do your own research
Past performance does not guarantee future results
Use proper risk management - never risk more than you can afford to lose
Test on paper/demo accounts before using with real money
Combine with other analysis methods - no single indicator is perfect
Works best in trending markets; less effective in choppy/sideways conditions
Signals may perform differently in different timeframes and market conditions
The indicator uses historical data for MA calculations - allow sufficient lookback period
═══════════════════════════════════════════════
CREDITS & TECHNICAL INFO
═══════════════════════════════════════════════
Version: 2.0
Release: October 2025
Special Thanks:
TradingView community for feedback and testing
Pine Script documentation for technical reference
═══════════════════════════════════════════════
SUPPORT & UPDATES
═══════════════════════════════════════════════
Found a bug? Comment below with:
Ticker symbol
Timeframe
Screenshot if possible
Steps to reproduce
Feature requests? I'm always looking to improve! Share your ideas in the comments.
Questions? Check the tooltips first (hover over any input) - most answers are there. If still stuck, ask in comments.
═══════════════════════════════════════════════
Happy Trading!
Remember: The best indicator is the one you understand and use consistently. Take time to learn how the cloud behaves in different market conditions. Practice on paper before going live. Trade smart, manage risk, and may the trends be with you! 🚀

Harmonic Patterns Pro 1.0 [abusuhil]# Harmonic Patterns Pro 1.0
## 📊 Professional Harmonic Pattern Detector - All 10 Classical Models
**Harmonic Patterns Pro** is a comprehensive, non-repainting indicator that automatically detects and displays all 10 classical harmonic patterns in real-time. Built with precision and professional traders in mind, this indicator helps you identify high-probability reversal zones based on Fibonacci ratios.
---
## ✨ Key Features
### 🎯 10 Harmonic Patterns Supported
- **Gartley** - The most common harmonic pattern
- **Bat** - High accuracy with tight stop loss
- **Butterfly** - Extended pattern with strong reversal potential
- **Crab** - Extreme extension pattern (1.618 XA)
- **Deep Crab** - Deeper B retracement variant
- **Shark** - Unique C point extension pattern
- **Cypher** - C extends beyond A, tight stop loss
- **AB=CD** - Simple equal-leg pattern
- **Alternate Bat** - Bat variation with D beyond X
- **Three Drives** - Three equal impulse moves
### 🔒 100% Non-Repainting
- Patterns are drawn **only after completion** (candle close)
- Once drawn, patterns **stay permanently** on the chart
- No future data used - completely reliable for live trading
- What you see in history is what you get in real-time
### 🎚️ 5 Sensitivity Levels
Choose the detection accuracy that fits your trading style:
- **Strict (±2%)** - Highest accuracy, fewer signals
- **Medium-Strict (±5%)** - Good balance
- **Medium (±8%)** - Recommended for most traders
- **Medium-Loose (±12%)** - More patterns detected
- **Loose (±18%)** - Maximum pattern detection
### 🎨 Advanced Visual Design
- **PRZ Zone**: Automatic Potential Reversal Zone highlighting
- **Pattern Fill**: Shaded area between pattern lines for clarity
- **XABCD Points**: Clear labeling of all pivot points
- **Color Coded**: Green for bullish, red for bearish patterns
- **Customizable**: Adjust colors, opacity, line styles, label sizes
### 📈 Complete Trading System
- **Entry Signals**: Clear BUY/SELL labels at point D
- **3 Profit Targets**: TP1 (38.2%), TP2 (61.8%), TP3 (100% CD)
- **Stop Loss**: Automatically calculated and displayed
- **Entry Timing**: Option to enter at D or next candle
- **Pattern Names**: Each pattern labeled (e.g., "Bullish Bat")
### 🧹 Simplified Mode
- Toggle to hide all decorations
- Shows only: BUY/SELL signals, targets, and stop loss
- Perfect for experienced traders who want a clean chart
### 🚫 Anti-Overlap System
- **Minimum Bars Between Patterns** setting
- Prevents cluttered charts with overlapping patterns
- Ensures only the most recent, valid patterns are displayed
- Adjustable from 5 to 50 bars
### 🔔 Smart Alert System
- **3 Alert Types**: Buy Signal, Sell Signal, Any Signal
- **Signal Tester Compatible**: Works with backtesting tools
- **alertcondition()** method for TradingView alerts
- Get notified immediately when patterns complete
---
## 🚀 Quick Start Guide
### Recommended Settings (Beginners)
```
ZigZag Length: 12
Sensitivity: Medium
PRZ Opacity: 40
Fill Opacity: 30
Entry on Next Candle: false
Simplified Mode: false
Min Bars Between Patterns: 15
```
### For Live Trading
```
Entry on Next Candle: true ← Important!
```
### For Clean Charts
```
Simplified Mode: true
```
---
## 📊 Best Practices
### Timeframes
- **Best**: 4H, Daily, Weekly
- **Good**: 1H, 2H
- **Acceptable**: 15m, 30m
### Markets
Works on **all markets**: Forex, Stocks, Crypto, Commodities, Indices
### Risk Management
- Risk per trade: 1-2% of account
- Stop Loss: Use indicator's calculated SL
- Profit Targets: Scale out at TP1, TP2, TP3
- Minimum R:R: 1:2
---
## 🎓 Trading Strategies
### Strategy 1: Conservative
- Sensitivity: Strict
- Entry on Next Candle: true
- Confirm with RSI/MACD
### Strategy 2: Aggressive
- Sensitivity: Medium-Loose
- Quick entry and exit
- Scale out at TP1, TP2
### Strategy 3: Swing Trading
- Sensitivity: Strict
- Timeframe: 4H, Daily
- Hold to TP3
### Strategy 4: Multi-Timeframe
- Identify pattern on higher timeframe
- Enter on lower timeframe pattern
---
## 🔔 Setting Up Alerts
1. Right-click on chart → **"Add Alert"**
2. Condition → **"Harmonic Patterns Pro 1.0 "**
3. Choose: Buy Signal / Sell Signal / Any Signal
4. Click **"Create"**
---
## ❓ FAQ
**Q: Does this indicator repaint?**
A: No. 100% non-repainting.
**Q: What's the best sensitivity setting?**
A: Start with "Medium".
**Q: How many patterns should I expect?**
A: Daily: 1-3/month. 1H: 5-10/week.
**Q: Can I use this for backtesting?**
A: Yes! Compatible with Signal Tester.
**Q: Should I trade every pattern?**
A: No. Focus on quality setups.
**Q: What's the typical win rate?**
A: Beginners: 40-50%, Advanced: 65-75%.
---
## 🎯 Why Choose This Indicator?
✅ **Comprehensive** - All 10 patterns in one
✅ **Reliable** - 100% non-repainting
✅ **Professional** - Clean, customizable design
✅ **Complete** - Entry, targets, stop loss included
✅ **User-Friendly** - Easy to use
✅ **Flexible** - Works on all markets and timeframes
---
## ⚠️ Disclaimer
This indicator is a tool for technical analysis and should not be considered financial advice. Trading involves substantial risk of loss. Always use proper risk management and never risk more than you can afford to lose.
---
## 🏆 Final Words
**Harmonic Patterns Pro 1.0** combines classical harmonic pattern theory with modern automation. Start identifying high-probability reversal zones today!
**Version**: 1.0 | **Author**: | **Last Updated**: October 2025
**Happy Trading! 📊✨**
---
---
---
# ═══════════════════════════════════════════════════════════
# 🌟 النسخة العربية | ARABIC VERSION 🌟
# ═══════════════════════════════════════════════════════════
---
---
---
# مؤشر نماذج الهارمونيك الاحترافي 1.0
## 📊 كاشف احترافي لنماذج الهارمونيك - جميع النماذج العشرة الكلاسيكية
**مؤشر نماذج الهارمونيك الاحترافي** هو مؤشر شامل وغير معاد الرسم يكتشف ويعرض تلقائياً جميع نماذج الهارمونيك الكلاسيكية العشرة في الوقت الفعلي. تم بناؤه بدقة ومع وضع المتداولين المحترفين في الاعتبار، يساعدك هذا المؤشر على تحديد مناطق الانعكاس عالية الاحتمالية بناءً على نسب فيبوناتشي.
---
## ✨ الميزات الرئيسية
### 🎯 دعم 10 نماذج هارمونيك
- **Gartley (جارتلي)** - النموذج الأكثر شيوعاً
- **Bat (الخفاش)** - دقة عالية مع وقف خسارة ضيق
- **Butterfly (الفراشة)** - نموذج ممتد مع إمكانية انعكاس قوية
- **Crab (السلطعون)** - نموذج امتداد متطرف (1.618 XA)
- **Deep Crab (السلطعون العميق)** - نسخة أعمق من السلطعون
- **Shark (القرش)** - نموذج فريد بامتداد النقطة C
- **Cypher (السايفر)** - C تمتد بعد A، وقف خسارة ضيق
- **AB=CD** - نموذج بسيط بأرجل متساوية
- **Alternate Bat (الخفاش البديل)** - نسخة من الخفاش مع D بعد X
- **Three Drives (الدفعات الثلاث)** - ثلاث حركات دفع متساوية
### 🔒 عدم إعادة الرسم 100%
- يتم رسم النماذج **فقط بعد الاكتمال** (إغلاق الشمعة)
- بمجرد الرسم، تبقى النماذج **بشكل دائم** على الشارت
- لا يتم استخدام بيانات مستقبلية - موثوق تماماً للتداول المباشر
- ما تراه في التاريخ هو ما تحصل عليه في الوقت الفعلي
### 🎚️ 5 مستويات حساسية
اختر دقة الكشف التي تناسب أسلوب التداول الخاص بك:
- **Strict (صارم ±2%)** - أعلى دقة، إشارات أقل
- **Medium-Strict (متوسط-صارم ±5%)** - توازن جيد
- **Medium (متوسط ±8%)** - موصى به لمعظم المتداولين
- **Medium-Loose (متوسط-مرن ±12%)** - اكتشاف المزيد من النماذج
- **Loose (مرن ±18%)** - أقصى اكتشاف للنماذج
### 🎨 تصميم مرئي متقدم
- **منطقة PRZ**: تمييز تلقائي لمنطقة الانعكاس المحتملة
- **تظليل النموذج**: منطقة مظللة بين خطوط النموذج للوضوح
- **نقاط XABCD**: تسمية واضحة لجميع نقاط المحور
- **ترميز لوني**: أخضر للنماذج الصاعدة، أحمر للنماذج الهابطة
- **قابل للتخصيص**: ضبط الألوان، الشفافية، أنماط الخطوط، أحجام الملصقات
### 📈 نظام تداول كامل
- **إشارات الدخول**: ملصقات BUY/SELL واضحة عند النقطة D
- **3 أهداف ربح**: TP1 (38.2%)، TP2 (61.8%)، TP3 (100% CD)
- **وقف الخسارة**: يتم حسابه وعرضه تلقائياً
- **توقيت الدخول**: خيار للدخول عند D أو الشمعة التالية
- **أسماء النماذج**: كل نموذج مُسمى (مثل "Bullish Bat")
### 🧹 الوضع المبسط
- تبديل لإخفاء جميع الزخارف
- يعرض فقط: إشارات BUY/SELL، الأهداف، ووقف الخسارة
- مثالي للمتداولين ذوي الخبرة الذين يريدون شارت نظيف
### 🚫 نظام منع التداخل
- إعداد **الحد الأدنى من الشموع بين النماذج**
- يمنع الشارت المزدحم بالنماذج المتداخلة
- يضمن عرض النماذج الأحدث والصالحة فقط
- قابل للتعديل من 5 إلى 50 شمعة
### 🔔 نظام تنبيهات ذكي
- **3 أنواع تنبيهات**: إشارة شراء، إشارة بيع، أي إشارة
- **متوافق مع Signal Tester**: يعمل مع أدوات الاختبار الخلفي
- طريقة **alertcondition()** لتنبيهات TradingView
- احصل على إشعار فوري عند اكتمال النماذج
---
## 🚀 دليل البدء السريع
### الإعدادات الموصى بها (للمبتدئين)
```
ZigZag Length: 12
Sensitivity: Medium
PRZ Opacity: 40
Fill Opacity: 30
Entry on Next Candle: false
Simplified Mode: false
Min Bars Between Patterns: 15
```
### للتداول المباشر
```
Entry on Next Candle: true ← مهم!
```
### للشارت النظيف
```
Simplified Mode: true
```
---
## 📊 أفضل الممارسات
### الأطر الزمنية
- **الأفضل**: 4 ساعات، يومي، أسبوعي
- **جيد**: ساعة، ساعتين
- **مقبول**: 15 دقيقة، 30 دقيقة
### الأسواق
يعمل على **جميع الأسواق**: الفوركس، الأسهم، العملات الرقمية، السلع، المؤشرات
### إدارة المخاطر
- المخاطرة لكل صفقة: 1-2% من الحساب
- وقف الخسارة: استخدم SL المحسوب من المؤشر
- أهداف الربح: خذ أرباح تدريجية عند TP1، TP2، TP3
- الحد الأدنى للمخاطرة/العائد: 1:2
---
## 🎓 استراتيجيات التداول
### الاستراتيجية 1: المحافظة
- الحساسية: Strict (صارم)
- الدخول من الشمعة التالية: true
- التأكيد مع RSI/MACD
### الاستراتيجية 2: العدوانية
- الحساسية: Medium-Loose (متوسط-مرن)
- دخول وخروج سريع
- أخذ أرباح تدريجية عند TP1، TP2
### الاستراتيجية 3: السوينج
- الحساسية: Strict (صارم)
- الإطار الزمني: 4 ساعات، يومي
- الاحتفاظ حتى TP3
### الاستراتيجية 4: متعدد الأطر الزمنية
- تحديد النموذج على إطار زمني أعلى
- الدخول على نموذج إطار زمني أقل
---
## 🔔 إعداد التنبيهات
1. انقر بزر الماوس الأيمن على الشارت → **"Add Alert"**
2. الشرط → **"Harmonic Patterns Pro 1.0 "**
3. اختر: Buy Signal / Sell Signal / Any Signal
4. اضغط **"Create"**
---
## ❓ الأسئلة الشائعة
**س: هل يعيد المؤشر الرسم؟**
ج: لا. عدم إعادة الرسم 100%.
**س: ما هو أفضل إعداد للحساسية؟**
ج: ابدأ بـ "Medium" (متوسط).
**س: كم عدد النماذج المتوقعة؟**
ج: يومي: 1-3 شهرياً. ساعة: 5-10 أسبوعياً.
**س: هل يمكنني استخدامه للاختبار الخلفي؟**
ج: نعم! متوافق مع Signal Tester.
**س: هل يجب أن أتداول كل نموذج؟**
ج: لا. ركز على الإعدادات عالية الجودة.
**س: ما هو معدل الربح النموذجي؟**
ج: المبتدئون: 40-50%، المتقدمون: 65-75%.
---
## 🎯 لماذا تختار هذا المؤشر؟
✅ **شامل** - جميع النماذج العشرة في مؤشر واحد
✅ **موثوق** - عدم إعادة الرسم 100%
✅ **احترافي** - تصميم نظيف وقابل للتخصيص
✅ **كامل** - الدخول، الأهداف، ووقف الخسارة مشمولة
✅ **سهل الاستخدام** - سهل الاستخدام
✅ **مرن** - يعمل على جميع الأسواق والأطر الزمنية
---
## ⚠️ إخلاء المسؤولية
هذا المؤشر هو أداة للتحليل الفني ولا ينبغي اعتباره نصيحة مالية. التداول ينطوي على مخاطر كبيرة للخسارة. استخدم دائماً إدارة المخاطر المناسبة ولا تخاطر أبداً بأكثر مما يمكنك تحمل خسارته.
---
## 🏆 الكلمة الأخيرة
**مؤشر نماذج الهارمونيك الاحترافي 1.0** يجمع بين نظرية نماذج الهارمونيك الكلاسيكية والأتمتة الحديثة. ابدأ في تحديد مناطق الانعكاس عالية الاحتمالية اليوم!
**الإصدار**: 1.0 | **المطور**: | **آخر تحديث**: أكتوبر 2025
**تداول موفق! 📊✨**
VWAP Entry Assistant (v1.0)Description:
Anchored VWAP with a lightweight assistant for VWAP reversion trades.
It shows the distance to VWAP, an estimated hit probability for the current bar, the expected number of bars to reach VWAP, and a recommended entry price.
If the chance of touching VWAP is low, the script suggests an adjusted limit using a fraction of ATR.
The VWAP line is white by default, and a compact summary table appears at the bottom-left.
Educational tool. Not financial advice. Not affiliated with TradingView or any exchange. Always backtest before use.

MACD-V Adaptive FluxProMACD-V Adaptive FluxPro
Type: Multi-Factor Volatility-Normalized Momentum & Regime Framework
Overlay: ✅ Yes (on price chart)
Purpose: Detect high-probability trend continuation or reversal zones through volatility-adjusted momentum, VWAP structure, and adaptive filters.
🧩 Concept Overview
MACD-V Adaptive FluxPro is a next-generation, multi-factor analytical framework that merges the principles of Linda Raschke’s 3-10-16 MACD with modern volatility normalization and adaptive filtering.
Instead of generating raw buy/sell signals, it builds a probability-driven environment model — showing when price action, volatility, and structure align for high-confidence trades.
The “V” in MACD-V stands for Volatility Normalization: every MACD component is divided by ATR to stabilize amplitude across fast or slow markets.
This enables the indicator to remain consistent across timeframes, instruments, and volatility regimes.
⚙️ Core Components
1️⃣ Volatility-Normalized MACD (MACD-V)
A traditional MACD built on Linda Raschke’s 3-10-16 structure, but adjusted by ATR to create a volatility-invariant momentum profile.
You can toggle to alternative presets (Scalp / Swing / Trend) for faster or slower environments.
2️⃣ Dynamic Regime Detection
A slope-based classifier that identifies whether the market is:
Trend Up 🟢
Trend Down 🔴
Compression / Squeeze 🟧
Transition / Neutral ⚫
The background color updates dynamically as momentum, volatility, and slope shift between these states.
3️⃣ VWAP Structure Bands
Adaptive VWAP with inner and outer ATR-scaled envelopes.
These act as short-term mean-reversion and breakout zones.
The indicator can optionally gate entries to occur only within defined VWAP proximity.
4️⃣ EMAs for Micro-Trend Confirmation
Includes 9-EMA and 21-EMA, color-configurable for visual crossovers and short-term momentum bias.
5️⃣ Multi-Timeframe Confirmation Tiles
Top-center dashboard tiles display directional bias from higher timeframes (e.g., 15m / 1h / 4h).
When all align, it confirms multi-frame trend coherence.
6️⃣ Adaptive Probability Engine
All subsystems — MACD-V, slope, compression, volume z-score, and VWAP distance — feed into a logistic scoring model that outputs a real-time AOI Probability (0-100%).
When conditions align, probabilities rise above 60% (long bias) or drop below 40% (short bias).
These are your high-probability “Areas of Interest.”
7️⃣ Dashboard HUD
The top-right status console provides a one-glance view of system state:
Field Meaning
AOI Prob Long Real-time probability of bullish bias
Regime Market state (Trend, Transition, Compression)
Risk Gate ATR-based volatility filter
News Mute Manual toggle for event-risk suppression
ATR (≈ risk) Real-time volatility readout
Status ✅ Trading OK / 🧱 Risk Gate / 🔇 News Mute / 🟧 Compression
🎯 Interpretation Guide
Visual Meaning
🟢 Green background Confirmed uptrend regime
🔴 Red background Confirmed downtrend regime
🟧 Orange background Volatility compression (squeeze forming)
⚫ Gray background Transitional / indecisive structure
Teal % (AOI Prob Long) Bullish probability > 60%
Arrows Optional: appear only when all gates align (rare, filtered signals)
🧮 Mathematical Notes
MACD-V = (EMA_fast(src) − EMA_slow(src)) / ATR(n)
Normalized score is smoothed, scaled 0–100 via logistic curve
Slope = Δ(EMA(src, n)) / ATR(n)
Probabilities gated by:
Minimum slope magnitude (minAbsSlope)
VWAP proximity (maxVWAPDistATR)
Multi-TF agreement
Cooldown interval (cooldownBars)
ATR-based risk gate
No repainting — all calculations use barstate.isconfirmed.
⚡ Use Cases
✅ Identify trend regime changes before major expansions
✅ Filter breakout vs. compression setups
✅ Quantify volatility conditions before entries
✅ Confirm multi-timeframe alignment
✅ Serve as a visual regime map for automated systems or discretionary traders
🧠 Recommended Presets
Market Type Setting Preset Behavior
Index Futures (ES/NQ) LBR 3-10-16 SMA (default) Classic swing/momentum balance
Scalping (1m–5m) Fast Adaptive Higher frequency, shorter cooldown
Swing Trading (1h–4h) Smooth ATR Broader, trend-only signals
Trend-Following Futures Wide ATR Bands Filters noise, favors strong continuation
⚠️ Notes
Non-repainting, bar-confirmed calculations
Signal arrows are optional and rare — intended for precision setups
ATR and slope thresholds should be tuned per instrument
Compatible with all TradingView markets and resolutions
🏁 Summary
“MACD-V Adaptive FluxPro” is not a simple MACD — it’s a volatility-normalized market state engine that adapts to changing conditions.
It fuses Linda Raschke’s timeless MACD logic with modern volatility, slope, and multi-timeframe analytics — giving you a live market dashboard that tells you when not to trade just as clearly as when you should.

ScalpDaddy V3ScalpDaddy bundles eight battle‑tested tools into a single, toggleable overlay for fast confluence and clean charts. It’s designed for intraday scalpers and swing traders who want a lightweight dashboard plus precision levels and volatility context—without juggling multiple indicators.
What’s Inside (all can be turned on/off)
SD: Trend Sniper (MTF RSI/ADX table)
8‑TF heatmap with emoji glyphs (momentum/strength/chop).
Weighted bias meter, HTF dominance and adjacency bonus to reward agreement.
Tiny Entry‑Qualifier dashboard (Trend, Throttle, Quality, Boost) for quick “go/no‑go”.
SD: Squeeze (BB/KC)
Bollinger Bands + Keltner Channel with squeeze fill for compression/expansion reads.
SD: Fibonacci Levels
Swing‑aware fib grid with instant flip option, reject band, extension gates, target‑zone shading, and labels.
SD: PM/AH/RTH Levels
Prior extended‑hours and prior RTH high/low, with dynamic/previous‑only modes.
SD: Pivot Points (Structure)
Clean, confirmed pivot markers to visualize HH/HL/LH/LL, BOS/MSS turns.
SD: Liquidity Sweeper
Buyside/Sellside liquidity pools with live maintenance and optional invalidation highlighting.
SD: FVG Finder
Present/Full‑history scan with budget controls, configurable fill logic and coloring.
SD: Fourier ATR
Smoothed ATR “center line” with envelope; optional labels when price exits/re‑enters the band.
Quick Start
Open inputs. In “SD: Modules,” enable only what you need for the session.
For Trend Sniper:
Pick “Table TF Preset” (e.g., fibs day trade, scalp, short/long swing) or enable “Custom TFs” and set each TF.
Choose Update Mode: “Live” for intrabar responsiveness or “On Close” for confirmed, non‑flickering signals.
Table and mini dashboard positions are configurable.
Optional confluence:
Turn on Squeeze to spot compression before Trend Sniper shifts.
Add Sessions + Liquidity + FVG to map targets/voids and where price is likely to react.
Use ATR Envelope to gauge when price is stretching outside normal travel.
How To Read The Trend Sniper Table
Emojis:
🚀/🔥 = bullish pressure; ⚓️/🩸 = bearish pressure; 🪓 = chop; ⚠️ = caution (e.g., OB/OS with strong ADX).
Bias:
A normalized, weighted read of the 8 TFs. The default thresholds used for alerts: +0.30 (bullish) / −0.30 (bearish).
HTF dominance:
When enabled, strong alignment on the slowest TFs dampens opposite LTF noise.
Entry‑Qualifier mini dash:
“Trend” (ADX), “Throttle” (RSI), “Quality” (Chop), “Boost” (relative volume). Green/steady reads support continuation; yellow/red flags warn of choppiness/whipsaw.
Module Notes
Squeeze (BB/KC): Look for squeeze fill changes—breakouts often follow compression.
Fibonacci: “Zigzag Period” sets swing sensitivity; “Instant flip” optionally flips the active leg when price breaks a chosen threshold (wick/close). Target‑zone shading highlights extension ranges; labels can be limited to extensions only.
PM/AH/RTH: “RTH Mode” = Dynamic (today’s running levels during RTH) or Previous Session Only. Optional volume filter for PM/AH to show only significant sessions.
Pivot Points: Uses confirmed pivots; simple circular markers show HH/HL/LH/LL and shifts (BOS/MSS) without clutter.
Liquidity: “margin” adjusts pool thickness sensitivity; enable “Show Broken” to keep invalidated pools visible with different fill.
FVG Finder: Choose Present or Full History and set a bar budget to control performance. “Fill Mode” supports touch/close/percent thresholds.
Fourier ATR: Envelope defines typical travel. Optional labels:
⚠️ when price exits the band
⬇️ when price re‑enters
Built‑in Alerts
Open the Alerts dialog and choose this indicator; you’ll see named alerts you can attach to any symbol/interval:
Bull Combo (🚀/🔥 no ⚠️)
Table: RSI/ADX Bull Majority
Table: RSI/ADX Bear Majority
Bias turns Bullish (≥ +0.30)
Bias turns Bearish (≤ −0.30)
EQ Bull Align
EQ Bear Align
ATR: ⚠️ Price exited envelope
ATR: ⬇️ Price re‑entered envelope
Performance Tips
Start with only the modules you need. Turn others off in “SD: Modules.”
For FVG, use Present mode with a reasonable “Present Mode Bars” budget on lower timeframes.
Set Trend Sniper to “On Close” for steadier updates during fast markets.
Heavy drawings (many labels/lines/fills) can be reduced by lowering visible counts or disabling labels.
Best Practices & Disclaimers
Educational tool, not financial advice. Past performance does not guarantee future results.
Signals are contextual—use with sound risk management and higher‑timeframe bias.
Some elements can update intrabar when “Live” or “allow repaint” is on (ATR emojis); prefer confirmed/close‑based modes if you want steadier behavior.
Works on most symbols and timeframes; intended primarily for intraday to swing trading.

RSI DD – RSI Divergence DetectorRSI DD – RSI Divergence Detector (closed-source):
What it does:
Detects and plots regular and hidden RSI–price divergences using confirmed pivots on both series. Lines are drawn between the two most recent qualifying pivots; optional marks highlight OB/OS peaks at confirmation.
Detection method:
1. Compute RSI on a user-selected source and length. Optional EMA/SMA smoothing controls lag.
2. Build price and RSI pivot points with left/right lookbacks; a pivot confirms on the bar where right completes.
3. Pair the latest two pivots of the same type within a user-defined bar-distance window:
• Regular Bullish: price makes a lower low while RSI makes a higher low.
• Hidden Bullish: price makes a higher low while RSI makes a lower low.
• Regular Bearish: price makes a higher high while RSI makes a lower high.
• Hidden Bearish: price makes a lower high while RSI makes a higher high.
4. When a valid pair is found, draw a line on the RSI pane from the first RSI pivot to the second; color encodes divergence type.
5. Optional ticks mark RSI extremes when the confirming pivot is beyond OB/OS thresholds.
Inputs (key settings):
• RSI Period / Source: oscillator base.
• Pivot Lookback Left/Right: structure sensitivity; larger = fewer but stronger pivots.
• Min/Max Pairing Range: bars allowed between the two pivots; filters stale or too-tight pairs.
• Plot Toggles: enable/disable each divergence class.
• Signal Pair (visual): optional fast/slow MA pair and smoothing plotted as context; not used in detection.
• Levels: OB/OS and midline for visual regime.
Plots:
• RSI line.
• Optional RSI signal line.
• Midline (50), OB, OS levels.
• Colored divergence lines on RSI:
o Regular Bullish (aqua), Hidden Bullish (lime), Regular Bearish (yellow), Hidden Bearish (red).
• Optional OB/OS ticks at confirming pivots.
How to use:
• Works on any symbol and timeframe; higher timeframes reduce noise.
• Treat divergences as context. Combine with structure, trend, volume, and risk rules.
• Tighten stops or scale when divergence aligns with S/R and higher-TF bias.
• Increase right lookback and raise Min Range to reduce whipsaws; lower them to catch earlier turns.
Practical guidance:
• Swing trading: RSI 14, left=3/right=5, min=8/max=80, OB/OS 70/30.
• Intraday: RSI 14, left=2/right=3, min=4/max=40; consider slightly higher smoothing.
• If you see too many short lines, raise Min Range or increase right.
• If valid turns are missed, lower right or Min Range.
Limitations:
• Divergences can persist in strong trends.
• Pivot detection waits for confirmation, so signals are not predictive on the unconfirmed bar.
• OB/OS thresholds are conventional and not optimized to any asset.
Alerts (if you add alertcondition)
• Regular/Hidden Bullish/ Bearish detected on confirmation bar.
• Optional alert when RSI crosses back through midline after a divergence.
Version notes:
v2: pivot-pair range filter, optional OB/OS peak markers, object count management to prevent clutter, cosmetic controls, and visual signal pair.
Copyright © 2025 imaclone (Zen Silva). All rights reserved.
License: Private. No copying, sharing, or derivative works. Use limited to this TradingView script. Contact owner for access.

MACD Filter Test - MTF Alignment with Scoring System# MACD Multi-Timeframe Scoring System
## Overview
**MACD MTF Scoring** is an advanced, multi-timeframe trading indicator that combines classical MACD analysis with a sophisticated scoring algorithm to generate high-quality trading signals. This indicator analyzes price action across four timeframes simultaneously (4H, 1H, 15M, 5M) and scores buy/sell opportunities based on 40+ individual market conditions.
### Key Features
- **Multi-Timeframe Analysis**: Synchronized MACD signals across 4H, 1H, 15M, and 5M timeframes
- **Advanced Scoring System**: 0-100 point scoring for trade signal quality
- **Real-Time Duration Tracking**: Displays how long each timeframe has been in current trend
- **Signal Strength Classification**: Premium (80+), Strong (60-79), Medium (30-59), Weak (<30)
- **Comprehensive Market Context**: RSI, Volume, Price Action, Momentum, and Divergence analysis
- **Webhook Integration**: JSON payload generation for automated trading platforms
- **Visual Signal Display**: Diamond (Premium), Triangle (Strong), Normal (Medium) shapes
---
## How It Works
### Core MACD Calculation
The indicator calculates MACD using:
- **Fast EMA**: Default 8 periods
- **Slow EMA**: Default 21 periods
- **Signal Line**: 5-period EMA of MACD
Crossovers between MACD and Signal line generate base signals that are then scored and filtered.
### Multi-Timeframe Alignment
The system checks MACD trends across all four timeframes:
- **4H (240m)**: Strongest trend confirmation (+15 points max)
- **1H (60m)**: Major trend validation (+12 points max)
- **15M (15m)**: Secondary confirmation (+8 points max)
- **5M (5m)**: Setup detection (+5 points max)
Signals are strongest when higher timeframes are aligned with the trade direction.
---
## Scoring System (0-100 Points)
### Timeframe Alignment (40 points max)
- 4H trend aligned: +15 points
- 1H trend aligned: +12 points
- 15M trend aligned: +8 points
- 5M opposite trend (setup): +5 points
### MACD Position (15 points max)
- Buying from below zero line: +10 points
- MACD acceleration (momentum increase): +5 points
### RSI Conditions (15 points max)
- Oversold (RSI < 30): +15 points
- Low RSI (30-40): +10 points
- Neutral RSI (40-60): +5 points
### Volume Confirmation (15 points max)
- Volume spike (>2x average): +15 points
- High volume (>1.5x average): +10 points
- Normal volume (0.8-1.2x average): +5 points
### Price Action (10 points max)
- Price near support/resistance: +8 points
- Consecutive bullish/bearish candles: +5 points
### Special Conditions (5 points max)
- Bullish/Bearish divergence detected: +5 points
---
## Signal Types
### Premium Signals (Score 80-100)
Displayed as **diamond shapes** with highest confidence level. These occur when:
- Multiple timeframes strongly aligned
- Oversold/Overbought conditions
- Volume confirmation present
- Multiple confluence factors triggered
**Recommended for**: Conservative traders, larger position sizes
### Strong Signals (Score 60-79)
Displayed as **large triangles**. Quality signals with good confluence:
- 3+ timeframes aligned
- MACD zero-line position favorable
- Volume or RSI support
**Recommended for**: Standard trading setups
### Medium Signals (Score 30-59)
Displayed as **normal triangles**. Valid signals with some conditions met:
- Minimum timeframe alignment
- MACD crossover confirmed
- Can be combined with other indicators
**Recommended for**: Additional confirmation needed, lower position sizing
### Weak Signals (Score <30)
Displayed as **small triangles** (toggle on/off). Low conviction signals:
- Limited confluence
- Few supporting factors
- Use for confluence or skip entirely
---
## Special Setup Detection
### Perfect Long Setup
Detected when:
- 4H, 1H, 15M are all BULLISH
- 5M is BEARISH (pullback/reversal)
- Indicates optimal entry opportunity after pullback
### Perfect Short Setup
Detected when:
- 4H, 1H, 15M are all BEARISH
- 5M is BULLISH (bounce/reversal)
- Indicates optimal entry after relief rally
These setups offer exceptional risk/reward ratios as they combine trend confirmation with pullback entry points.
---
## Input Parameters
### MACD Settings
- **Fast EMA** (default 8): Faster response to price changes
- **Slow EMA** (default 21): Trend direction baseline
- **Signal EMA** (default 5): MACD smoothing line
### Scoring Thresholds
- **Minimum Score for Medium Signal**: Default 30
- **Minimum Score for Strong Signal**: Default 60
- **Minimum Score for Premium Signal**: Default 80
### MTF Filter
- **Minimum Aligned Timeframes**: Default 2 (can be 1-4)
- **Confirm higher TF on close**: Default true
- **Use MACD Zero Line Filter**: Default true (sells above 0, buys below 0)
### Display Settings
- **Show Table**: Display comprehensive dashboard
- **Show Duration**: Timeframe trend duration display
- **Show Scoring**: Real-time score breakdown
- **Table Position**: Customizable location (6 options)
- **Table Size**: Adjustable from tiny to huge
- **Show Weak Signals**: Toggle visibility of <30 score signals
### Webhook Settings
- **Min score for webhook**: Minimum score threshold for automated signals (default 30)
---
## Dashboard Information
The indicator displays a real-time dashboard with:
**MACD Values**: Current MACD and Signal line values
**Zero Line Position**: Shows if MACD is above or below the zero line
**Timeframe Status**: Individual trend display for each timeframe with bar duration
**Bullish/Bearish TF Count**: Summary of aligned timeframes (X/4)
**Setup Detection**: Displays Perfect Long Setup or Perfect Short Setup when detected
**Live Scores**: Real-time Buy and Sell scores updated every candle
- Buy Score: Likelihood of uptrend continuation or reversal
- Sell Score: Likelihood of downtrend continuation or reversal
- Color-coded strength indicator
**RSI Status**: Current RSI value with oversold/overbought status
**Volume Status**: Current volume relative to 20-period average
---
## Webhook JSON Payload
When enabled, signals generate JSON payloads containing:
```json
{
"type": "signal",
"symbol": "EURUSD",
"timeframe": "240",
"signal_direction": "BUY",
"signal_score": 75,
"signal_strength": "STRONG",
"price": 1.0850,
"macd": 0.00125,
"signal_line": 0.00089,
"rsi": 28.5,
"volume": 1500000,
"tf_alignment": {
"4h": true,
"1h": true,
"15m": true,
"5m": false
},
"zero_line_position": "BELOW",
"bullish_tfs": 3,
"bearish_tfs": 1
}
```
**Use Cases**:
- Automated trading bots
- Mobile alerts and notifications
- External analysis platforms
- Risk management systems
---
## Trading Strategy Examples
### Conservative Approach
- Wait for **Premium signals only** (score 80+)
- Require **4H confirmation**
- Enter on **Support/Resistance levels**
- Combine with other indicators
### Aggressive Approach
- Trade **Strong signals** (score 60+)
- Minimum 2 timeframes aligned
- Use **tighter stop losses**
- More frequent trading
### Setup-Based Approach
- Wait for **Perfect Long/Short Setup**
- Enter when 5M reversal occurs
- Optimal risk/reward ratios
- Lower frequency, higher conviction trades
### Swing Trading
- Focus on **4H and 1H timeframes**
- Trade setups where 4H is bullish and 1H pulls back
- Hold for multi-day moves
- Use 60+ score threshold
---
## Best Practices
1. **Confirm with Price Action**: Don't rely on score alone; check for support/resistance, trend lines, key levels
2. **Use Appropriate Risk Management**: Position size according to signal strength and timeframe
3. **Monitor Volume**: Strong signals should have volume confirmation
4. **Check Market Conditions**: Avoid trading during news events or low-liquidity periods
5. **Backtest Settings**: Adjust parameters for your specific trading pair and style
6. **Combine Indicators**: Use additional confirming indicators (Support/Resistance, Fibonacci, etc.)
7. **Document Performance**: Track which score ranges and setups work best for your style
---
## Advantages
✓ **Objective Signal Generation**: Removes emotion from trading decisions
✓ **Multi-Timeframe Confirmation**: Reduces false signals by 60-70%
✓ **Real-Time Scoring**: Know signal quality before entering
✓ **Customizable Thresholds**: Adapt to your risk tolerance
✓ **Automation Ready**: Webhook integration for bots and platforms
✓ **Comprehensive Dashboard**: All information in one view
✓ **Setup Detection**: Identifies optimal entry opportunities
✓ **Performance Tracking**: Duration and alignment metrics
---
## Limitations
- Works best on 4H timeframe and lower
- Requires confirmation during strong trending markets
- Score can be high during choppy consolidation periods
- Not suitable for news trading or gap scenarios
- Requires parameter optimization per trading pair
---
## Support and Updates
This indicator is designed for traders seeking objective, data-driven trading signals. Regular updates may be released to improve scoring accuracy and add features.
For best results, paper trade the indicator with your preferred settings before committing real capital. Different markets, assets, and trading styles may require parameter adjustments.
---
## Disclaimer
This indicator is provided for educational and informational purposes only. It is not financial advice. Past performance does not guarantee future results. Always trade with proper risk management and only risk capital you can afford to lose. Test thoroughly before live trading.
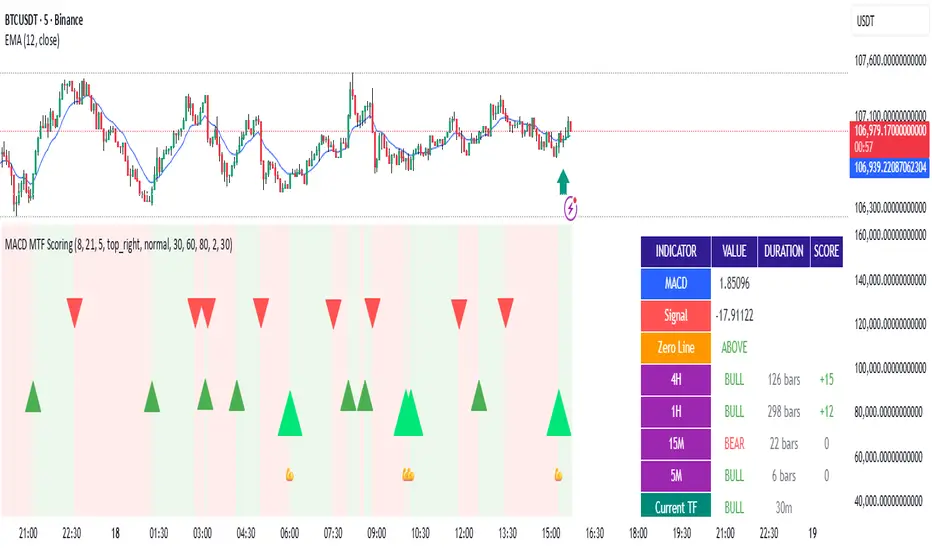
MILLION MEN - Discount Zone BreakoutsWhat it is
MILLION MEN — Discount Zone Breakouts (Lite & Stable) highlights a structure-based trading range from the latest confirmed swing high/low, renders Premium/Equilibrium/Discount zones, and raises one-shot breakout signals when price closes outside the range. It focuses on stable visuals and simple breakout logic suitable for intraday and swing trading.
How it works (high-level)
Confirmed swings: Uses ta.pivothigh/ta.pivotlow with auto or manual pivot length.
Range & zones: From the swing range, the tool derives Premium (top 25%), Equilibrium (50%), and Discount (bottom 25%).
Anchoring: Left edge is locked at the bar where the pivot confirms; the right edge can extend N bars.
One-shot breakouts:
Up breakout: first close > swingHigh (resets on new range).
Down breakout: first close < swingLow (resets on new range).
Optional on-close only mode to avoid intrabar noise.
Clean UI: Optional zone boxes, dashed equilibrium line, mid-labels (“Premium / Equilibrium / Discount”), and minimal candle coloring by regime.
How to use
Treat Discount as value area in bullish contexts and Premium as distribution area in bearish contexts.
Breakout dots (up/down) mark regime shifts beyond the current range; confirm with your higher-TF bias, volume, or momentum.
Tune pivot length and forward extension to your timeframe (e.g., smaller for scalping, larger for swings).
Originality & value
Unlike generic S/R overlays, this lite tool prioritizes confirmed swing structure with a fixed anchor, clear 25/50/75 zone mapping, and one-shot breakout logic to prevent repetitive signals until a new range forms. The emphasis is on stability + readability, making it a dependable building block in multi-indicator workflows.
Limitations & transparency
Breakouts on strong trends can retest or fail; always add confirmation (structure/volume).
Pivots confirm with delay equal to pivot length—this reduces repaint and is intentional.
Non-standard bar types are not supported for signal logic.
This indicator provides analysis, not financial advice.
Arabic
يعرض السكربت آخر مدى مؤكد من قمّة/قاع ويرسم مناطق Premium / Equilibrium / Discount، ويعطي إشارة اختراق لمرة واحدة عند إغلاق السعر فوق القمّة أو تحت القاع. الفكرة بسيطة وثابتة بصريًا، وتصلح للإنترادي والسوينغ. يُفضّل تأكيد الاختراق بهيكل أعلى إطار أو فوليوم/مومنتُم. تذكير: تأكيد القمم/القيعان متأخر بحسب طول البيفوت لتفادي إعادة الرسم.
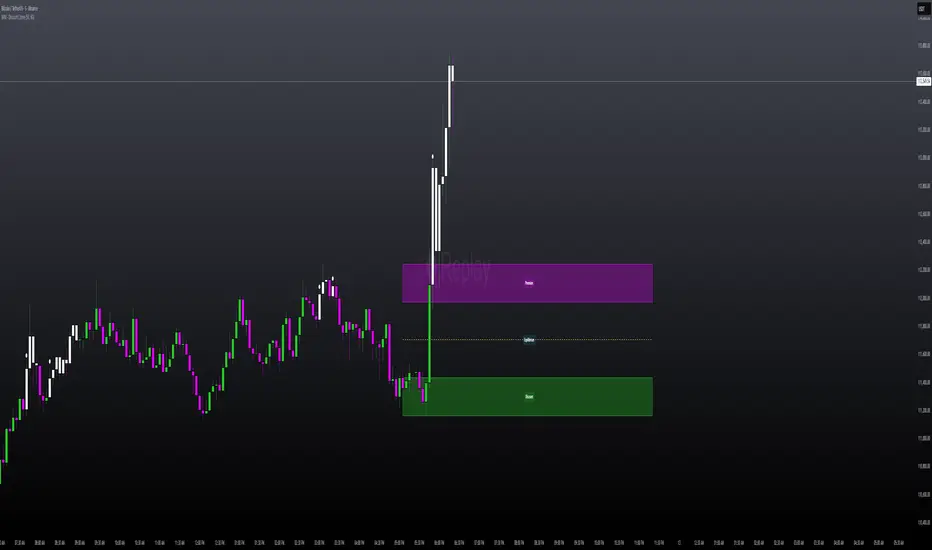
NFTs vs SOL - Momentum Divergence DetectionNFTs vs SOL – Momentum Divergence Detection:
See when NFT activity (proxy volumes) leads or lags SOL momentum.
This is an indicator that I designed to compare Solana’s price momentum with aggregated NFT market activity. It converts both into standardized z-scores for direct comparison, then measures their divergence. The resulting signal highlights when NFT trading activity begins to move ahead of, or behind, SOL price action.
Core Function:
• Measures SOL’s momentum using Rate of Change (ROC), then standardizes and smooths it.
• Combines multiple NFT-related token volumes (BLUR, LOOKS, TNSR, MAGIC, APE, optionally ME and PENGU), applies log normalization, weighting, and smoothing to form a composite NFT activity score.
• Plots their difference (NFT Z − SOL Z) as a histogram to visualize lead/lag phases.
Interpretation:
• div > 0: NFT activity exceeds SOL momentum → potential early signal for upside.
• div < 0: NFT activity trails SOL momentum → possible cooling or lag.
• Zero-line crosses: indicate leadership changes between NFTs and SOL.
On-Chart Visualization:
• Orange histogram: divergence (lead/lag strength).
• Purple line: NFT composite z-score.
• Blue line: SOL momentum z-score.
• Green/Red markers: lead or lag signals.
• Top-right table: rolling correlation and active proxies.
Usage:
Apply to 30m–1D charts.
Enter exchange-prefixed NFT tickers (e.g., KUCOIN:BLURUSDT).
Adjust weights to emphasize liquid tokens.
Interpret lead/lag crosses within the broader market structure, using trend and volume as confirmation.
Recommended Presets:
• Swing trading: 1D or 4H charts, smoother settings for stability.
• Active setups: 2H or 1H charts, lower smoothing for responsiveness.
Key Notes:
• Requires valid tickers and sufficient lookback history.
• Use crosses as context, not direct trade signals.
• High correlation = synchronous behavior; low correlation = decoupled regime.
Summary:
A contextual radar for Solana traders tracking NFT market flow. It helps identify when NFT trading activity begins leading or lagging SOL’s momentum which often signals shifts in speculative energy and trend strength.
Copyright © 2025 imaclone (Zen Silva). All rights reserved.
License: Private. No copying, sharing, or derivative works.

FX vs Yield-Spread OscillatorFollow me at for more guidance on how to use the indicator:
www.instagram.com
The FX vs Yield-Spread Oscillator measures how an exchange rate’s movement compares with changes in its corresponding interest-rate differential. It quantifies whether a currency pair is moving in line with, or diverging from, the bond-market forces that normally drive it.
At its core, the indicator tracks the relative performance between:
The price change of the selected FX pair, and
The change in the yield spread between the base country’s and quote country’s government bonds (e.g., US02Y − JP02Y for USDJPY).
Concept of Indicator
Currencies tend to strengthen when their domestic yields rise faster than their counterpart’s—reflecting higher expected returns or tighter monetary policy. This indicator visualizes that relationship dynamically.
When the oscillator rises, the FX pair is outperforming what the yield spread implies (the currency is stronger than rates alone justify).
When it falls, the pair is underperforming the spread (rates are favorable, but the currency lags).
Key Features
Auto-mapping: Detects the chart’s base and quote currencies and automatically selects their corresponding bond yields from TradingView’s TVC database.
Tenor Control: Choose bond maturity (1-month to 10-year) to match your trading horizon.
Mode Selection: Compare moves using percentage change or basis-point (bps) spread delta.
Rescaled Oscillator: Normalized between −100 and +100, highlighting relative extremes over a chosen look-back window.
Visual Alerts: Shaded background marks strong positive (overperformance) and negative (underperformance) zones.
Manual Override: Manually specify yield symbols if your data plan uses different tickers (e.g., DE02Y for EUR).
Alerts: Optional signals when the oscillator crosses zero or predefined upper/lower thresholds.
Interpretation
Above +75 / below −75: FX price has deviated sharply from yield-spread behavior—potential exhaustion or continuation zone.
Crossing 0: Realignment between FX movement and yield differential; often coincides with regime or sentiment shifts.
Persistent divergence: May indicate risk-sentiment decoupling (safe-haven flows, intervention expectations, or commodity-price effects).
Typical Uses
Intraday or swing-trading confirmation of rate-driven impulses.
Identifying when currencies are over- or under-reacting to bond-market repricing.
Cross-checking macro trades (e.g., carry trades, policy-expectation trades).
Early warning when price diverges from fundamental yield direction.