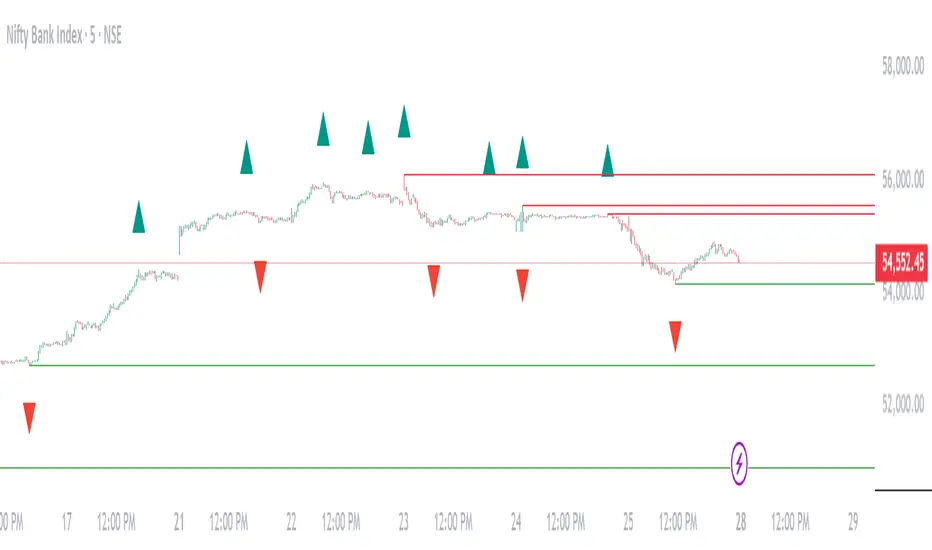
C&B Auto MK5C&B Auto MK5.2ema BullBear
Overview
The C&B Auto MK5.2ema BullBear is a versatile Pine Script indicator designed to help traders identify bullish and bearish market conditions across various timeframes. It combines Exponential Moving Averages (EMAs), Relative Strength Index (RSI), Average True Range (ATR), and customizable time filters to generate actionable signals. The indicator overlays on the price chart, displaying EMAs, a dynamic cloud, scaled RSI levels, bull/bear signals, and market condition labels, making it suitable for swing trading, day trading, or scalping in trending or volatile markets.
What It Does
This indicator generates bull and bear signals based on the interaction of two EMAs, filtered by RSI thresholds, ATR-based volatility, a 50/200 EMA trend filter, and user-defined time windows. It adapts to market volatility by adjusting EMA lengths and RSI thresholds. A dynamic cloud highlights trend direction or neutral zones, with candlestick coloring in neutral conditions. Market condition labels (current and historical) provide real-time trend and volatility context, displayed above the chart.
How It Works
The indicator uses the following components:
EMAs: Two EMAs (short and long) are calculated on a user-selected timeframe (1, 5, 15, 30, or 60 minutes). Their crossover or crossunder triggers potential bull/bear signals. EMA lengths adjust based on volatility (e.g., 10/20 for volatile markets, 5/10 for non-volatile).
Dynamic Cloud: The area between the EMAs forms a cloud, colored green for bullish trends, red for bearish trends, or a user-defined color (default yellow) for neutral zones (when EMAs are close, determined by an ATR-based threshold). Users can widen the cloud for visibility.
RSI Filter: RSI is scaled to price levels and plotted on the chart (optional). Signals are filtered to ensure RSI is within volatility-adjusted bull/bear thresholds and not in overbought/oversold zones.
ATR Volatility Filter: An optional filter ensures signals occur during sufficient volatility (ATR(14) > SMA(ATR, 20)).
50/200 EMA Trend Filter: An optional filter restricts bull signals to bullish trends (50 EMA > 200 EMA) and bear signals to bearish trends (50 EMA < 200 EMA).
Time Filter: Signals are restricted to a user-defined UTC time window (default 9:00–15:00), aligning with active trading sessions.
Market Condition Labels: Labels above the chart display the current trend (Bullish, Bearish, Neutral) and optionally volatility (e.g., “Bullish Volatile”). Up to two historical labels persist for a user-defined number of bars (default 5) to show recent trend changes.
Visual Aids: Bull signals appear as green triangles/labels below the bar, bear signals as red triangles/labels above. Candlesticks in neutral zones are colored (default yellow).
The indicator ensures compatibility with standard chart types (e.g., candlestick or bar charts) to produce realistic signals, avoiding non-standard types like Heikin Ashi or Renko.
How to Use It
Add to Chart: Apply the indicator to a candlestick or bar chart on TradingView.
Configure Settings:
Timeframe: Choose a timeframe (1, 5, 15, 30, or 60 minutes) to match your trading style.
Filters:
Enable/disable the ATR volatility filter to focus on high-volatility periods.
Enable/disable the 50/200 EMA trend filter to align signals with the broader trend.
Enable the time filter and set custom UTC hours/minutes (default 9:00–15:00).
Cloud Settings: Adjust the cloud width, neutral zone threshold, color, and transparency.
EMA Colors: Use default trend-based colors or set custom colors for short/long EMAs.
RSI Display: Toggle the scaled RSI and its thresholds, with customizable colors.
Signal Settings: Toggle bull/bear labels and set signal colors.
Market Condition Labels: Toggle current/historical labels, include/exclude volatility, and adjust decay period.
Interpret Signals:
Bull Signal: A green triangle or “Bull” label below the bar indicates potential bullish momentum (EMA crossover, RSI above bull threshold, within time window, passing filters).
Bear Signal: A red triangle or “Bear” label above the bar indicates potential bearish momentum (EMA crossunder, RSI below bear threshold, within time window, passing filters).
Neutral Zone: Yellow candlesticks and cloud (if enabled) suggest a lack of clear trend; consider range-bound strategies or avoid trading.
Market Condition Labels: Check labels above the chart for real-time trend (Bullish, Bearish, Neutral) and volatility status to confirm market context.
Monitor Context: Use the cloud, RSI, and labels to assess trend strength and volatility before acting on signals.
Unique Features
Volatility-Adaptive EMAs: Automatically adjusts EMA lengths based on ATR to suit volatile or non-volatile markets, reducing manual configuration.
Neutral Zone Detection: Uses an ATR-based threshold to identify low-trend periods, helping traders avoid choppy markets.
Scaled RSI Visualization: Plots RSI and thresholds directly on the price chart, simplifying momentum analysis relative to price.
Flexible Time Filtering: Supports precise UTC-based trading windows, ideal for day traders targeting specific sessions.
Historical Market Labels: Displays recent trend changes (up to two) with a decay period, providing context for market shifts.
50/200 EMA Trend Filter: Aligns signals with the broader market trend, enhancing signal reliability.
Notes
Use on standard candlestick or bar charts to ensure accurate signals.
Test the indicator on a demo account to optimize settings for your market and timeframe.
Combine with other analysis (e.g., support/resistance, volume) for better decision-making.
The indicator is not a standalone system; use it as part of a broader trading strategy.
Limitations
Signals may lag in fast-moving markets due to EMA-based calculations.
Neutral zone detection may vary in extremely volatile or illiquid markets.
Time filters are UTC-based; ensure your platform’s timezone settings align.
This indicator is designed for traders seeking a customizable, trend-following tool that adapts to volatility and provides clear visual cues with robust filtering for bullish and bearish market conditions.
Cari dalam skrip untuk "swing trading"

AlphaTrend++AlphaTrend++
Overview
The AlphaTrend++ is an advanced Pine Script indicator designed to help traders identify buy and sell opportunities in trending and volatile markets. Building on trend-following principles, it uses a modified Average True Range (ATR) calculation combined with volume or momentum data to plot a dynamic trend line. The indicator overlays on the price chart, displaying a colored trend line, a filled trend zone, buy/sell signals, and optional stop-loss tick labels, making it ideal for day trading or swing trading, particularly in markets like futures (e.g., MES).
What It Does
This indicator generates buy and sell signals based on the direction and momentum of a custom trend line, filtered by optional time restrictions and signal frequency logic. The trend line adapts to price action and volatility, with a filled zone highlighting trend strength. Buy/sell signals are plotted as labels, and stop-loss distances are displayed in ticks (customizable for instruments like MES). The indicator supports standard chart types for realistic signal generation.
How It Works
The indicator employs the following components:
Trend Line Calculation: A dynamic trend line is calculated using ATR adjusted by a user-defined multiplier, combined with either Money Flow Index (MFI) or Relative Strength Index (RSI) depending on volume availability. The line tracks price movements, adjusting upward or downward based on trend direction and volatility.
Trend Zone: The area between the current trend line and its value two bars prior is filled, colored green for bullish trends (upward movement) or red for bearish trends (downward movement), providing a visual cue of trend strength.
Signal Generation: Buy signals occur when the trend line crosses above its value two bars ago, and sell signals occur when it crosses below, with optional filtering to reduce signal noise (based on bar timing logic). Signals can be restricted to a 9:00–15:00 UTC trading window.
Stop-Loss Ticks: For each signal, the indicator calculates the distance to the trend line (acting as a stop-loss level) in ticks, using a user-defined tick size (default 0.25 for MES). These are displayed as labels below/above the signal.
Time Filter: An optional filter limits signals to 9:00–15:00 UTC, aligning with active trading sessions like the US market open.
The indicator ensures compatibility with standard chart types (e.g., candlestick or bar charts) to avoid unrealistic results associated with non-standard types like Heikin Ashi or Renko.
How to Use It
Add to Chart: Apply the indicator to a candlestick or bar chart on TradingView.
Configure Settings:
Multiplier: Adjust the ATR multiplier (default 1.0) to control trend line sensitivity. Higher values widen the stop-loss distance.
Common Period: Set the ATR and MFI/RSI period (default 14) for trend calculations.
No Volume Data: Enable if volume data is unavailable (e.g., for certain forex pairs), switching from MFI to RSI.
Tick Size: Set the tick size for stop-loss calculations (default 0.25 for MES futures).
Show Buy/Sell Signals: Toggle signal labels (default enabled).
Show Stop Loss Ticks: Toggle stop-loss tick labels (default enabled).
Use Time Filter: Restrict signals to 9:00–15:00 UTC (default disabled).
Use Filtered Signals: Enable to reduce signal frequency using bar timing logic (default enabled).
Interpret Signals:
Buy Signal: A blue “BUY” label below the bar indicates a potential long entry (trend line crossover, passing filters).
Sell Signal: A red “SELL” label above the bar indicates a potential short entry (trend line crossunder, passing filters).
Trend Zone: Green fill suggests bullish momentum; red fill suggests bearish momentum.
Stop-Loss Ticks: Gray labels show the stop-loss distance in ticks, helping with risk management.
Monitor Context: Use the trend line and filled zone to confirm the market’s direction before acting on signals.
Unique Features
Adaptive Trend Line: Combines ATR with MFI or RSI to create a responsive trend line that adjusts to volatility and market conditions.
Tick-Based Stop-Loss: Displays stop-loss distances in ticks, customizable for specific instruments, aiding precise risk management.
Signal Filtering: Optional bar timing logic reduces false signals, improving reliability in choppy markets.
Trend Zone Visualization: The filled zone between trend line values enhances trend clarity, making it easier to assess momentum.
Time-Restricted Trading: Optional 9:00–15:00 UTC filter aligns signals with high-liquidity sessions.
Notes
Use on standard candlestick or bar charts to ensure accurate signals.
Test the indicator on a demo account to optimize settings for your market and timeframe.
Combine with other analysis (e.g., support/resistance, volume spikes) for better decision-making.
The indicator is not a standalone system; use it as part of a broader trading strategy.
Limitations
Signals may lag in highly volatile or low-liquidity markets due to ATR-based calculations.
The 9:00–15:00 UTC time filter may not suit all markets; disable it for 24-hour assets like forex or crypto.
Stop-loss tick calculations assume consistent tick sizes; verify compatibility with your instrument.
This indicator is designed for traders seeking a robust, trend-following tool with customizable risk management and signal filtering, optimized for active trading sessions.

PowerHouse SwiftEdge AI v2.10 with Custom Filters & AI AnalysisPowerHouse SwiftEdge AI v2.10 with Custom Filters & AI Analysis
Overview
PowerHouse SwiftEdge AI v2.10 is an advanced TradingView Pine Script indicator designed to identify high-probability trading setups by combining pivot-based structure analysis, multi-timeframe trend detection, and adaptive AI-driven signal filtering. The script integrates Change of Character (CHoCH) and Break of Structure (BOS) signals with customizable momentum, volume, breakout, and trend filters to enhance trade precision. Additionally, it offers an optional AI Market Analysis module that predicts future price trends across multiple timeframes, providing traders with a comprehensive market outlook.
The script is highly customizable, allowing users to tailor inputs to their trading style, whether for scalping, swing trading, or long-term strategies. It is suitable for all asset classes, including stocks, forex, crypto, and commodities, and performs optimally on timeframes ranging from 1-minute to daily charts.
Key Features
Pivot-Based Signal Generation:
Identifies pivot highs and lows to detect CHoCH (reversal patterns) and BOS (continuation patterns).
Signals are plotted as "Buy" or "Sell" labels with optional "Get Ready" pre-signals to prepare traders for potential setups.
Take-profit (TP) levels are automatically calculated based on user-defined points, with optional TP box visualization.
Multi-Timeframe Trend Analysis:
Analyzes trends across seven timeframes (1M, 5M, 15M, 30M, 1H, 4H, D) using EMA and VWAP to determine bullish, bearish, or neutral conditions.
Displays a futuristic AI-Trend Matrix dashboard showing trend direction, strength, and confidence levels for quick decision-making.
Customizable Signal Filters:
Momentum Filter: Ensures signals align with significant price changes, adjusted dynamically using ATR-based volatility.
Higher Timeframe Trend Filter: Requires signals to align with the trend of a user-selected higher timeframe (e.g., 1H).
Lower Timeframe Trend Filter: Prevents signals that conflict with the trend of a user-selected lower timeframe (e.g., 5M).
Volume Filter: Optionally requires above-average volume to confirm signals.
Breakout Filter: Optionally requires price to break previous highs/lows for signal validation.
Repeated Signal Restriction: Prevents consecutive signals in the same trend direction until the trend changes on a user-defined timeframe.
AI-Driven Adaptivity:
Incorporates Cumulative Volume Delta (CVD) to assess buying/selling pressure and classify market volatility (Low, Medium, High).
Uses ATR to dynamically adjust momentum thresholds, ensuring signals adapt to current market conditions.
Optional AI Market Analysis module predicts trends across multiple timeframes by combining trend, momentum, and volatility scores.
Visual Elements:
Plots CHoCH and BOS levels as horizontal lines with distinct colors (aqua for CHoCH sell, lime for CHoCH buy, fuchsia for BOS sell, teal for BOS buy).
Draws dynamic support and resistance trendlines based on short and long-term price action, colored by trend strength.
Displays TP levels and pivot highs/lows for easy reference.
How It Works
The script combines several technical analysis concepts to create a robust trading system:
Market Structure Analysis:
Pivot highs and lows are identified using a user-defined lookback period (Pivot Length).
CHoCH occurs when price crosses below a pivot high (bearish reversal) or above a pivot low (bullish reversal).
BOS occurs when price breaks a previous pivot low (bearish continuation) or pivot high (bullish continuation).
Trend and Momentum Integration:
Trends are determined by comparing price to EMA and VWAP on multiple timeframes.
Momentum is calculated as the percentage price change, with thresholds adjusted by ATR to account for volatility.
"Get Ready" signals appear when momentum approaches the threshold, preparing traders for potential CHoCH or BOS signals.
Signal Filtering:
Filters ensure signals align with user-defined criteria (e.g., trend direction, volume, breakouts).
The Restrict Repeated Signals option prevents over-signaling by requiring a trend change on a specified timeframe before generating a new signal in the same direction.
AI Market Analysis:
The optional AI module calculates a score for each timeframe based on trend direction, momentum, and volatility (ATR compared to its SMA).
Scores are translated into predictions (▲ for bullish, ▼ for bearish, — for neutral), displayed in a dedicated table.
CVD and Volatility Context:
CVD tracks buying vs. selling pressure by accumulating volume based on price direction.
Volatility is classified using CVD magnitude, influencing the script’s visual cues and signal sensitivity.
Why This Combination?
The integration of pivot-based structure analysis, multi-timeframe trend filtering, and AI-driven adaptivity addresses common trading challenges:
Precision: CHoCH and BOS signals focus on key market turning points, reducing noise from minor price fluctuations.
Context: Multi-timeframe analysis ensures trades align with broader market trends, improving win rates.
Adaptivity: ATR and CVD adjustments make the script responsive to changing market conditions, avoiding static thresholds that fail in volatile or quiet markets.
Customization: Extensive input options allow traders to adapt the script to their preferred markets, timeframes, and risk profiles.
Predictive Insight: The AI Market Analysis module provides forward-looking trend predictions, helping traders anticipate market moves.
This combination creates a self-contained system that balances responsiveness with reliability, making it suitable for both novice and experienced traders.
How to Use
Add to Chart:
Apply the indicator to your TradingView chart for any asset and timeframe.
Recommended timeframes: 5M to 1H for scalping/day trading, 4H to D for swing trading.
Configure Inputs:
Pivot Length: Adjust (default 5) to control sensitivity to pivot highs/lows. Lower values for faster signals, higher for stronger confirmations.
Momentum Threshold: Set the minimum price change (default 0.01%) for signals. Increase for stricter conditions.
Take Profit Points: Define TP distance (default 10 points). Adjust based on asset volatility.
Signal Filters: Enable/disable filters (momentum, trend, volume, breakout) to match your strategy.
Higher/Lower Timeframe: Select timeframes for trend alignment (e.g., 1H for higher, 5M for lower).
AI Market Analysis: Enable for predictive trend insights across timeframes.
Get Ready Signals: Enable to see pre-signals for potential setups.
Interpret Signals:
Buy/Sell Labels: Act on green "Buy" or red "Sell" labels, confirming with TP levels and trend direction.
Get Ready Labels: Yellow "Get Ready BUY" or orange "Get Ready SELL" indicate potential setups; prepare but wait for confirmation.
CHoCH/BOS Lines: Use aqua/lime (CHoCH) and fuchsia/teal (BOS) lines as key support/resistance levels.
AI-Trend Matrix: Check the top-right dashboard for trend strength (%), confidence (%), and timeframe-specific trends.
AI Market Analysis Table: If enabled, view predictions (▲/▼/—) for each timeframe to anticipate market direction.
Trading Tips:
Combine signals with other indicators (e.g., RSI, MACD) for additional confirmation.
Use higher timeframe trend alignment for higher-probability trades.
Adjust TP and signal distance based on asset volatility and trading style.
Monitor the AI-Trend Matrix for trend strength; values above 50% or below -50% indicate strong directional bias.
Originality
PowerHouse SwiftEdge AI v2.10 stands out due to its unique blend of:
Adaptive Signal Generation: ATR-based momentum thresholds and CVD-driven volatility context ensure signals remain relevant across market conditions.
Multi-Timeframe Synergy: The script’s ability to filter signals based on both higher and lower timeframe trends provides a rare balance of precision and context.
AI-Powered Insights: The AI Market Analysis module offers predictive capabilities not commonly found in traditional indicators, simulating institutional-grade analysis.
Visual Clarity: The futuristic dashboard and color-coded trendlines make complex data accessible, enhancing usability for all trader levels.
Unlike standalone pivot or trend indicators, this script integrates multiple layers of analysis into a cohesive system, reducing false signals and providing actionable insights without requiring external tools or research.
Limitations
False Signals: No indicator is foolproof; signals may fail in choppy or low-volume markets. Use filters to mitigate.
Timeframe Sensitivity: Performance varies by timeframe and asset. Test settings thoroughly.
AI Predictions: The AI Market Analysis is based on historical data and simplified scoring; it’s not a guaranteed forecast.
Resource Usage: Enabling all filters and AI analysis may slow performance on lower-end devices.

Williams Fractals Dynamic Horizontal LinesWilliams Fractals with Dynamic Horizontal Lines
Overview
This script identifies Williams Fractals (support and resistance points) on any chart and automatically draws horizontal lines at those fractal levels.
The lines extend right and disappear when price breaks them — giving a clean and real-time view of key support and resistance levels.
Features
Detects upward fractals (potential resistances).
Detects downward fractals (potential supports).
Draws horizontal lines at each fractal point.
Automatically deletes a line when:
Price closes above a resistance.
Price closes below a support.
Clean and lightweight — minimal performance impact.
Inputs
Setting Description Default
Periods (n) Number of candles on each side required to confirm a fractal (minimum 2). 2
How It Works
Fractal Detection:
An up fractal is confirmed when a candle has the highest high compared to its neighbors.
A down fractal is confirmed when a candle has the lowest low compared to its neighbors.
Custom logic supports different "ties" — not just strict greater-than or less-than comparisons.
Drawing Lines:
When an up fractal is detected → a red horizontal resistance line is drawn.
When a down fractal is detected → a green horizontal support line is drawn.
Lines are drawn starting at the fractal candle and extend right across the chart.
Dynamic Line Deletion:
Every new candle is checked:
If high > resistance line → delete that resistance line.
If low < support line → delete that support line.
Only unbroken lines are kept on the chart, providing live, updated support/resistance zones.
Visual Elements
Up Fractal: 🡅 Triangular marker (teal color) above the fractal candle.
Down Fractal: 🡇 Triangular marker (red color) below the fractal candle.
Resistance Line: Red horizontal line.
Support Line: Green horizontal line.
Technical Details
Version: Pine Script v6
Arrays Used:
To store and manage active lines (line arrays).
To track the price associated with each line (float arrays).
Error Handling:
Backward iteration is handled using a while loop instead of a for loop to comply with Pine Script restrictions.
Offset Handling:
Fractal markers are plotted with an offset of -n bars for visual alignment.
Possible Enhancements (Future Ideas)
Sensitivity Settings: Allow a small margin (buffer) to define breakouts.
Extend Options: Let users choose between extending "infinite" or "limited" bars.
Custom Alerts: Generate alerts when fractal levels are broken.
Multi-timeframe Support: Detect fractals from higher timeframes on lower timeframe charts.
Example Usage
Swing Trading:
Use the fractal lines to identify and react to key breakouts or breakdowns dynamically.
Intraday Trading:
Spot live support/resistance on smaller timeframes for quick trades.
Trend Reversal Spotting:
Notice when a major fractal level is broken, possibly indicating trend changes.
Example Visual — Williams Fractals Dynamic Lines
Price Chart View:
What This Diagram Shows:
▲ Up Fractals:
Form resistance lines.
Line extends until price breaks above it.
▼ Down Fractals:
Form support lines.
Line extends until price breaks below it.
Lines are removed from the chart as soon as broken.
📈 Real Chart Example
Here's a rough idea how it will look live on your TradingView chart:
Feature Visual
Up Fractal 🔺 Green triangle above bar
Resistance Line ➖ Horizontal red line across the chart
Down Fractal 🔻 Red triangle below bar
Support Line ➖ Horizontal green line across the chart
Line Break 🚫 Line disappears when price crosses
ICT Swiftedge# ICT SwiftEdge: Advanced Market Structure Trading System
**Overview**
ICT SwiftEdge is a powerful trading system built upon the foundation of ICTProTools' ICT Breakers, licensed under the Mozilla Public License 2.0 (mozilla.org). This script has been significantly enhanced by to combine market structure analysis with modern technical indicators and a sleek, AI-inspired statistics dashboard. The goal is to provide traders with a comprehensive tool for identifying high-probability trade setups, managing exits, and tracking performance in a visually intuitive way.
**Credits**
This script is a derivative work based on the original "ICT Breakers" by ICTProTools, used with permission under the Mozilla Public License 2.0. Significant enhancements, including RSI-MA signals, trend filtering, dynamic timeframe adjustments, dual exit strategies, and an AI-style statistics dashboard, were developed by . We express our gratitude to ICTProTools for their foundational work in market structure analysis.
**What It Does**
ICT SwiftEdge integrates multiple trading concepts to help traders identify and manage trades based on market structure and momentum:
- **Market Structure Analysis**: Identifies Break of Structure (BOS) and Market Structure Shift (MSS) patterns, which signal potential trend continuations or reversals. BOS indicates a continuation of the current trend, while MSS highlights a shift in market direction, providing key entry points.
- **RSI-MA Signals**: Generates "BUY" and "SELL" signals when BOS or MSS patterns align with the Relative Strength Index (RSI) smoothed by a Moving Average (RSI-MA). Signals are filtered to occur only when RSI-MA is above 50 (for buys) or below 50 (for sells), ensuring momentum supports the trade direction.
- **Trend Filtering**: Prevents multiple signals in the same trend, ensuring only one buy or sell signal per trend direction, reducing noise and improving trade clarity.
- **Dynamic Timeframe Adjustment**: Automatically adjusts pivot points, RSI, and MA parameters based on the selected chart timeframe (1M to 1D), optimizing performance across different market conditions.
- **Flexible Exit Strategies**: Offers two user-selectable exit methods:
- **Trailing Stop-Loss (TSL)**: Exits trades when price moves against the position by a user-defined distance (in points), locking in profits or limiting losses.
- **RSI-MA Exit**: Exits trades when RSI-MA crosses the 50 level, signaling a potential loss of momentum.
- Users can enable either or both strategies, providing flexibility to adapt to different trading styles.
- **AI-Style Statistics Dashboard**: Displays real-time trade performance metrics in a futuristic, neon-colored interface, including total trades, wins, losses, win/loss ratio, and win percentage. This helps traders evaluate the system's effectiveness without external tools.
**Why This Combination?**
The integration of these components creates a synergistic trading system:
- **BOS/MSS and RSI-MA**: Combining market structure breaks with RSI-MA ensures entries are based on both price action (structure) and momentum (RSI-MA), increasing the likelihood of high-probability trades.
- **Trend Filtering**: By limiting signals to one per trend, the system avoids overtrading and focuses on significant market moves.
- **Dynamic Adjustments**: Timeframe-specific parameters make the system versatile, suitable for scalping (1M, 5M) or swing trading (4H, 1D).
- **Dual Exit Strategies**: TSL protects profits during trending markets, while RSI-MA exits are ideal for range-bound or reversing markets, catering to diverse market conditions.
- **Statistics Dashboard**: Provides immediate feedback on trade performance, enabling data-driven decision-making without manual tracking.
This combination balances technical precision with user-friendly visuals, making it accessible to both novice and experienced traders.
**How to Use**
1. **Add to Chart**: Apply the script to any TradingView chart.
2. **Configure Settings**:
- **Chart Timeframe**: Select your chart's timeframe (1M to 1D) to optimize parameters.
- **Structure Timeframe**: Choose a timeframe for market structure analysis (leave blank for chart timeframe).
- **Exit Strategy**: Enable Trailing Stop-Loss (`useTslExit`), RSI-MA Exit (`useRsiMaExit`), or both. Adjust `tslPoints` for TSL distance.
- **Show Signals/Labels**: Toggle `showSignals` and `showExit` to display "BUY", "SELL", and "EXIT" labels.
- **Dashboard**: Enable `showDashboard` to view trade statistics. Customize colors with `dashboardBgColor` and `dashboardTextColor`.
3. **Trading**:
- Look for "BUY" or "SELL" labels to enter trades when BOS/MSS aligns with RSI-MA.
- Exit trades at "EXIT" labels based on your chosen strategy.
- Monitor the statistics dashboard to track performance (total trades, win/loss ratio, win percentage).
4. **Alerts**: Set up alerts for BOS, MSS, buy, sell, or exit signals using the provided alert conditions.
**License**
This script is licensed under the Mozilla Public License 2.0 (mozilla.org). The source code is available for review and modification under the terms of this license.
**Compliance with TradingView House Rules**
This publication adheres to TradingView's House Rules and Scripts Publication Rules. It provides a clear, self-contained description of the script's functionality, credits the original author (ICTProTools), and explains the rationale for combining indicators. The script contains no promotional content, offensive language, or proprietary restrictions beyond MPL 2.0.
**Note**
Trading involves risk, and past performance is not indicative of future results. Always backtest and validate the system on your preferred markets and timeframes before live trading.
Enjoy trading with ICT SwiftEdge, and let data-driven insights guide your decisions!

Aurora Flow Oscillator [QuantAlgo]The Aurora Flow Oscillator is an advanced momentum-based technical indicator designed to identify market direction, momentum shifts, and potential reversal zones using adaptive filtering techniques. It visualizes price momentum through a dynamic oscillator that quantifies trend strength and direction, helping traders and investors recognize momentum shifts and trading opportunities across various timeframes and asset class.
🟢 Technical Foundation
The Aurora Flow Oscillator employs a sophisticated mathematical approach with adaptive momentum filtering to analyze market conditions, including:
Price-Based Momentum Calculation: Calculates logarithmic price changes to measure the rate and magnitude of market movement
Adaptive Momentum Filtering: Applies an advanced filtering algorithm to smooth momentum calculations while preserving important signals
Acceleration Analysis: Incorporates momentum acceleration to identify shifts in market direction before they become obvious
Signal Normalization: Automatically scales the oscillator output to a range between -100 and 100 for consistent interpretation across different market conditions
The indicator processes price data through multiple filtering stages, applying mathematical principles including exponential smoothing with adaptive coefficients. This creates an oscillator that dynamically adjusts to market volatility while maintaining responsiveness to genuine trend changes.
🟢 Key Features & Signals
1. Momentum Flow and Extreme Zone Identification
The oscillator presents market momentum through an intuitive visual display that clearly indicates both direction and strength:
Above Zero: Indicates positive momentum and potential bullish conditions
Below Zero: Indicates negative momentum and potential bearish conditions
Slope Direction: The angle and direction of the oscillator provide immediate insight into momentum strength
Zero Line Crossings: Signal potential trend changes and new directional momentum
The indicator also identifies potential overbought and oversold market conditions through extreme zone markings:
Upper Zone (>50): Indicates strong bullish momentum that may be approaching exhaustion
Lower Zone (<-50): Indicates strong bearish momentum that may be approaching exhaustion
Extreme Boundaries (±95): Mark potentially unsustainable momentum levels where reversals become increasingly likely
These zones are displayed with gradient intensity that increases as the oscillator moves toward extremes, helping traders and investors:
→ Identify potential reversal zones
→ Determine appropriate entry and exit points
→ Gauge overall market sentiment strength
2. Customizable Trading Style Presets
The Aurora Flow Oscillator offers pre-configured settings for different trading approaches:
Default (80,150): Balanced configuration suitable for most trading and investing situations.
Scalping (5,80): Highly responsive settings for ultra-short-term trades. Generates frequent signals and catches quick price movements. Best for 1-15min charts when making many trades per day.
Day Trading (8,120): Optimized for intraday movements with faster response than default settings while maintaining reasonable signal quality. Ideal for 5-60min or 4h-12h timeframes.
Swing Trading (10,200): Designed for multi-day positions with stronger noise filtering. Focuses on capturing larger price swings while avoiding minor fluctuations. Works best on 1-4h and daily charts.
Position Trading (14,250): For longer-term position traders/investors seeking significant market trends. Reduces false signals by heavily filtering market noise. Ideal for daily or even weekly charts.
Trend Following (16,300): Maximum smoothing that prioritizes established directional movements over short-term fluctuations. Best used on daily and weekly charts, but can also be used for lower timeframe trading.
Countertrend (7,100): Tuned to detect potential reversals and exhaustion points in trends. More sensitive to momentum shifts than other presets. Effective on 15min-4h charts, as well as daily and weekly charts.
Each preset automatically adjusts internal parameters for optimal performance in the selected trading context, providing flexibility across different market approaches without requiring complex manual configuration.
🟢 Practical Usage Tips
1/ Trend Analysis and Interpretation
→ Direction Assessment: Evaluate the oscillator's position relative to zero to determine underlying momentum bias
→ Momentum Strength: Measure the oscillator's distance from zero within the -100 to +100 range to quantify momentum magnitude
→ Trend Consistency: Monitor the oscillator's path for sustained directional movement without frequent zero-line crossings
→ Reversal Detection: Watch for oscillator divergence from price and deceleration of movement when approaching extreme zones
2/ Signal Generation Strategies
Depending on your trading approach, multiple signal strategies can be employed:
Trend Following Signals:
Enter long positions when the oscillator crosses above zero
Enter short positions when the oscillator crosses below zero
Add to positions on pullbacks while maintaining the overall trend direction
Countertrend Signals:
Look for potential reversals when the oscillator reaches extreme zones (±95)
Enter contrary positions when momentum shows signs of exhaustion
Use oscillator divergence with price as additional confirmation
Momentum Shift Signals:
Enter positions when oscillator changes direction after establishing a trend
Exit positions when oscillator direction reverses against your position
Scale position size based on oscillator strength percentage
3/ Timeframe Optimization
The indicator can be effectively applied across different timeframes with these considerations:
Lower Timeframes (1-15min):
Use Scalping or Day Trading presets
Focus on quick momentum shifts and zero-line crossings
Be cautious of noise in extreme market conditions
Medium Timeframes (30min-4h):
Use Default or Swing Trading presets
Look for established trends and potential reversal zones
Combine with support/resistance analysis for entry/exit precision
Higher Timeframes (Daily+):
Use Position Trading or Trend Following presets
Focus on major trend identification and long-term positioning
Use extreme zones for position management rather than immediate reversals
🟢 Pro Tips
Price Momentum Period:
→ Lower values (5-7) increase sensitivity to minor price fluctuations but capture more market noise
→ Higher values (10-16) emphasize sustained momentum shifts at the cost of delayed response
→ Adjust based on your timeframe (lower for shorter timeframes, higher for longer timeframes)
Oscillator Filter Period:
→ Lower values (80-120) produce more frequent directional changes and earlier response to momentum shifts
→ Higher values (200-300) filter out shorter-term fluctuations to highlight dominant market cycles
→ Match to your typical holding period (shorter holding time = lower filter values)
Multi-Timeframe Analysis:
→ Compare oscillator readings across different timeframes for confluence
→ Look for alignment between higher and lower timeframe signals
→ Use higher timeframe for trend direction, lower for earlier entries
Volatility-Adaptive Trading:
→ Use oscillator strength to adjust position sizing (stronger = larger)
→ Consider reducing exposure when oscillator reaches extreme zones
→ Implement tighter stops during periods of oscillator acceleration
Combination Strategies:
→ Pair with volume indicators for confirmation of momentum shifts
→ Use with support/resistance levels for strategic entry and exit points
→ Combine with volatility indicators for comprehensive market context

Moving Average Trend ToolsI. How M.A.T.T. Adds Value to the TradingView Community:
The "Moving Average Trend Tools" (M.A.T.T.) is a versatile Pine Script v6 indicator that empowers traders with clear trend analysis, reliable trade signals, and real-time insights. Its intuitive design and robust features make it a valuable addition to the TradingView Community Scripts by catering to traders of all levels. Here’s why it stands out:
Clear Trend Visualization: M.A.T.T. plots a moving average (MA) with dynamic coloring—green for rising, red for falling, and gray for flat—based on a user-defined lookback period. This simplifies trend interpretation, helping traders quickly assess market momentum.
Reliable Trade Signals : The script identifies price crossovers above or below the MA, plotting green circles for bullish crosses and red for bearish, confirmed on closed bars to prevent repainting. These signals guide entry and exit points for trend-following or reversal strategies.
Real-Time Extension Detection : M.A.T.T. calculates percentage price deviations from the MA, displaying real-time labels when thresholds (e.g., 6%) are exceeded. This highlights overextended moves, ideal for spotting reversals or pullbacks, with alerts to keep traders informed.
Extensive Customization : Traders can tailor the MA type (SMA, EMA, WMA, HMA), length, colors, line width, and label sizes. This flexibility supports diverse strategies across markets like stocks, forex, and crypto, from scalping to swing trading.
Automated Alerts : Alert conditions for crossovers and extensions integrate seamlessly with TradingView’s system, enabling traders to stay updated without constant chart monitoring.
M.A.T.T. combines trend analysis, signal generation, and overextension detection into a single, user-friendly tool. Its accessibility, reliability, and educational value for Pine Script learners make it a compelling contribution to the community.
II. What M.A.T.T. Does, How It Works, and Its Originality:
What It Does :
M.A.T.T. enhances trend analysis and trade decision-making through three core features:
Dynamic MA Visualization: Plots a customizable MA (SMA, EMA, WMA, or HMA) with trend-based coloring to reflect rising, falling, or flat market conditions.
Price Crossover Signals : Marks bullish (green circles) and bearish (red circles) crossovers, confirmed on closed bars, with alerts for trade opportunities.
Price Extension Labels : Displays real-time percentage deviations of price from the MA, with alerts when user-defined thresholds are breached, signaling potential reversals.
How It Works :
M.A.T.T. leverages Pine Script v6 for precise calculations and user-friendly outputs:
Inputs: Users select MA type, length, lookback period, colors, and thresholds for extensions, plus label styles and sizes for customization.
MA Calculation : A switch function computes the chosen MA (e.g., ta.ema(close, 21) for EMA). Trend direction is determined using ta.rising or ta.falling over the lookback period, coloring the MA accordingly.
Crossover Logic : Bullish crossovers (close > ma and close < ma ) and bearish crossovers (close < ma and close > ma ) are plotted as circles on confirmed bars (barstate.isconfirmed) to ensure reliability. Alerts trigger only on the first bar of a crossover.
Extension Logic : Percentage deviations are calculated as ((price - ma) / ma) * 100, using the high for above-MA extensions and low for below. Labels appear in real-time when thresholds are exceeded, with alerts on transitions to avoid noise.
Why It’s Original
M.A.T.T. distinguishes itself through a unique blend of features and thoughtful design:
All-in-One Design : It integrates dynamic MA coloring, non-repainting crossover signals, and real-time extension detection, addressing trend identification, trade signals, and overextension warnings in one tool—unlike most MA indicators that focus on a single aspect.
Real-Time Extension Labels : Displaying percentage deviations with customizable thresholds is a rare feature, ideal for volatile markets and not commonly found in standard scripts.
Non-Repainting Signals : Confirmed crossover signals enhance reliability for live trading, setting M.A.T.T. apart from less rigorous indicators.
Optimized Alert Condtions : Alerts trigger only on transitions (e.g., first bar of a crossover or extension), reducing noise and improving usability.
Visual and Functional Flexibility : Support for four MA types, extensive customization, and a clean interface (dynamic colors, tiny circles, clear labels) make it adaptable and user-friendly.
While MA plotting or crossovers exist elsewhere, M.A.T.T.’s seamless integration, real-time extension detection, alert conditions, and focus on reliability and customization create a distinctive, practical tool. Its balance of simplicity and sophistication makes it a unique asset for the TradingView community.

GranDoc - Week, Day, Month, and Session Separator5Indicator Name: GranDoc's - Week, Day, Month, and Session Separator
Version: Pine Script v5
Author: Jonpaul Nnamdi Opara (GranDoc )
Description
The "GranDoc - Week, Day, Month, and Session Separator" is a highly customizable TradingView indicator designed to enhance chart analysis by visually marking critical time-based transitions. Developed by Jonpaul Nnamdi Opara, this tool plots vertical lines with labels or background highlights to denote the start and end of weeks, days, months, and major trading sessions (Frankfurt, London, NY Morning, NY Afternoon, Sydney, and Tokyo). Traders can tailor colors, line styles, widths, transparency, and session times to align with their strategies and timezones.
Ideal for forex, stocks, futures, and crypto traders, this indicator simplifies the identification of key market periods—such as session openings/closings or new weeks—that often signal increased volatility or trend shifts. It’s optimized for intraday timeframes for session separators but supports all timeframes for week, day, and month markers, making it a versatile addition to any trader’s toolkit.
Features
Week Separators: Marks Monday starts with customizable lines and "Week Start" labels.
Day Separators: Highlights daily openings with lines and "Day Start" labels.
Month Separators: Indicates new months with lines and "Month Start" labels.
Session Separators: Plots lines and labels for major trading sessions’ start and end:
Frankfurt (default: 07:00–15:00 UTC)
London (default: 08:00–16:00 UTC)
NY Morning (default: 13:00–16:00 UTC)
NY Afternoon (default: 16:00–21:00 UTC)
Sydney (default: 22:00–06:00 UTC)
Tokyo (default: 00:00–08:00 UTC)
Timezone Support: Adjusts session times with a UTC offset (±12 hours).
Display Flexibility : Toggle between labeled vertical lines or background highlights.
Customization: Fine-tune colors, line styles (solid, dashed, dotted), widths, and transparency.
Background Mode: Highlights periods with translucent backgrounds for cleaner charts.
[ i]Labeled Lines: Each line includes descriptive labels (e.g., "London Open", "Tokyo Closed") when not in background mode.
How to Use
Add to Chart:
Copy the script into TradingView’s Pine Editor.
Click "Add to Chart" to apply the indicator.
Customize Settings:
Open settings via double-click or the "Settings" gear icon.
Timezone Offset: Set your UTC offset (e.g., -5 for EST) to align sessions.
Toggles: Enable/disable week, day, month, or session separators.
Appearance: Adjust colors, line styles, widths, and transparency for each separator.
Session Times: Modify start/end hours and minutes if defaults don’t suit your market.
Background Mode: Enable "Show as Background" for colored backgrounds instead of lines, and tweak "Session Background Transparency."
Labels: Labeled lines (e.g., "Sydney Open") appear automatically unless background mode is active.
Chart Compatibility:
Session separators require intraday timeframes (e.g., 1-minute to 4-hour).
Week, day, and month separators work across all timeframes.
Confirm your chart’s timezone aligns with your analysis.
Analyze:
Use separators to pinpoint session transitions, daily openings, or weekly shifts for trade planning.
Labels make it easy to spot key periods on busy charts.
Pair with indicators like RSI, volume, or support/resistance for deeper insights.
Example Use Cases
Forex Trading: Highlight London and NY session opens/closes for high-liquidity entries.
Day Trading: Reset strategies at daily separators and monitor intraday volatility.
Swing Trading: Use week/month separators to track longer-term trends.
Session Focus: Isolate sessions like Tokyo for regional market analysis.
Chart Clarity: Background mode declutters charts while marking key times.
Notes
Session separators are disabled on daily+ timeframes to prevent clutter.
Verify timezone offset for accurate session alignment.
Background mode suits lower timeframes for readability.
Labels are visible only when background mode is disabled.
Feedback
Share your thoughts or suggestions to make this indicator even better! Reach out via TradingView or connect with the author for insights. Happy trading!
About the Author
Dr. Jonpaul Nnamdi Opara, a PhD graduate from Ehime University, Japan, is a researcher and developer specializing in AI and machine learning. His work on automated landslide mapping and defect detection, published in journals like GEOMATE, showcases his precision-driven approach. With the "GranDoc" indicator, Jonpaul brings intuitive, data-driven clarity to financial markets, reflecting his expertise in creating impactful tools.

Pullback SARPullback SAR - Parabolic SAR with Pullback Detection
Description: The "Pullback SAR" is an advanced indicator built on the classic Parabolic SAR but with additional functionality for detecting pullbacks. It helps identify moments when the price pulls back from the main trend, offering potential entry signals. Perfect for traders looking to enter the market after a correction.
Key Features:
SAR (Parabolic SAR): The Parabolic SAR indicator is used to determine potential trend reversal points. It marks levels where the price could reverse its direction.
Pullback Detection: The indicator catches periods when the price moves away from the main trend and then returns, which may suggest a re-entry opportunity.
Long and Short Signals: Once a pullback in the direction of the main trend is identified, the indicator generates signals that could be used to open positions.
Simple and Clear Construction: The indicator is based on the classic SAR, with added pullback detection logic to enhance the accuracy of the signals.
Parameters:
Start (SAR Step): Determines the initial step for the SAR calculation, which controls the rate of change in the indicator at the beginning.
Increment (SAR Increment): Defines the maximum step size for SAR, allowing traders to adjust the indicator’s sensitivity to market volatility.
Max Value (SAR Max): Sets the upper limit for the SAR value, controlling its volatility.
Usage:
Swing Trading: Ideal for swing strategies, aiming to capture larger price moves while maintaining a safe margin.
Scalping: Due to its precise pullback detection, it can also be used in scalping, especially when the price quickly returns to the main trend.
Risk Management: The combination of SAR and pullback detection allows traders to adjust their positions according to changing market conditions.
Special Notes:
Adjusting Parameters: Depending on the market and trading style, users can adjust the SAR parameters (Start, Increment, Max Value) to fit their needs.
Combination with Other Indicators: It's recommended to use the indicator alongside other technical analysis tools (e.g., EMA, RSI) to enhance the accuracy of the signals.
Link to the script: This open-source version of the indicator is available on TradingView, enabling full customization and adjustments to meet your personal trading strategy. Share your experiences and suggestions!

Smart Dynamic Levels [ATR-Based]Smart Dynamic Levels
Automated Support & Resistance Levels Based on Market Volatility
Overview:
This advanced indicator automatically plots dynamic support and resistance levels based on the Average True Range (ATR), creating meaningful price zones that adapt to changing market conditions. Unlike static round-number levels, these volatility-adjusted zones provide more relevant technical reference points.
Key Features:
Volatility-Responsive: Levels automatically adjust based on the asset's ATR
Smart Visualization:
Color gradient shows strength of each level (darker = stronger)
Bullish (green) levels below price, bearish (red) levels above
Customizable Settings:
Adjust ATR length (14-period default)
Modify level sensitivity with ATR multiplier (1.5x default)
Choose number of levels to display (5 above/below default)
Toggle labels and line extensions
How It Works:
Calculates the asset's true volatility using ATR
Rounds to significant price intervals based on current volatility
Plots equidistant levels above and below current price
Colors levels based on their position relative to price
Automatically updates as market conditions change
Recommended Use:
Day Trading: Identify intraday support/resistance zones
Swing Trading: Spot potential reversal areas
Breakout Trading: Watch for moves beyond key levels
Works on all markets: Stocks, Forex, Crypto, Futures
Settings Guide:
ATR Length: Higher values for smoother levels (14-20)
Multiplier: Increase for wider levels (1.5-3x)
Levels Count: More levels for higher timeframes (3-10)
Pro Tips:
Combine with trend analysis - levels are more significant when aligned with trend
Watch for price reactions at these levels for confirmation
Use wider levels (higher multiplier) for volatile assets

Multiple MAsHere's a well-written description in English for your "Multiple MAs" indicator that you can use when publishing on TradingView. It’s concise, professional, and highlights the key features of the indicator while explaining its purpose for traders.
---
### Multiple MAs Indicator
#### Overview
The **Multiple MAs** indicator is a versatile and straightforward tool designed to help traders visualize price trends using multiple Simple Moving Averages (SMAs) on a single chart. By plotting six SMAs with customizable lengths (MA5, MA10, MA20, MA50, MA100, and MA200), this indicator provides a clear view of short-term, medium-term, and long-term trends, making it ideal for trend-following strategies, crossover analysis, and identifying potential support/resistance levels.
#### Features
- **Customizable MA Lengths**: Adjust the periods of all six moving averages (MA5, MA10, MA20, MA50, MA100, MA200) to suit your trading style and timeframe.
- **Distinct Visuals**: Each MA is plotted with a unique color and line width for easy identification:
- MA5 (Dodger Blue, 1px)
- MA10 (Green, 1px)
- MA20 (Red, 2px)
- MA50 (Purple, 3px)
- MA100 (Gray, 3px)
- MA200 (White, 3px)
- **Overlay on Price Chart**: The indicator overlays directly on the price chart, allowing for seamless integration with other technical analysis tools.
- **High Precision**: Displays values with 8-decimal precision, ensuring accuracy for assets with small price movements (e.g., forex pairs or cryptocurrencies).
#### How to Use
1. **Trend Identification**: Use the longer MAs (e.g., MA100, MA200) to determine the overall trend direction. If the price is above these MAs, the trend is likely bullish; if below, it’s likely bearish.
2. **Crossover Signals**: Look for crossovers between shorter MAs (e.g., MA5 crossing MA20) for potential entry or exit signals. For example:
- A bullish signal occurs when a shorter MA crosses above a longer MA.
- A bearish signal occurs when a shorter MA crosses below a longer MA.
3. **Support and Resistance**: MAs often act as dynamic support or resistance levels. Watch for price reactions around these lines, especially the MA50, MA100, and MA200.
4. **Divergence Analysis**: Compare the slope of different MAs to identify potential trend reversals or weakening momentum.
#### Settings
- **MA5 Length**: Default is 5 bars.
- **MA10 Length**: Default is 10 bars.
- **MA20 Length**: Default is 20 bars.
- **MA50 Length**: Default is 50 bars.
- **MA100 Length**: Default is 100 bars.
- **MA200 Length**: Default is 200 bars.
#### Best Practices
- **Timeframe**: This indicator works on any timeframe but is particularly effective on daily, 4-hour, and 1-hour charts for swing trading or trend-following strategies.
- **Combine with Other Tools**: Pair the Multiple MAs with other indicators like RSI, MACD, or volume analysis to confirm signals and avoid false breakouts.
- **Adjust for Volatility**: For highly volatile assets, consider increasing the MA lengths to reduce noise and focus on broader trends.
#### Notes
- The indicator is lightweight and optimized for performance, ensuring it runs smoothly even on lower timeframes.
- Colors and line widths are pre-set for clarity but can be customized in the indicator settings if needed.
#### Credits
Created by kosar_v. Feedback and suggestions are welcome to improve this tool for the TradingView community!

[TehThomas] - ICT Inversion Fair value Gap (IFVG) The Inversion Fair Value Gap (IFVG) indicator is a powerful tool designed for traders who utilize ICT (Inner Circle Trader) strategies. It focuses on identifying and displaying Inversion Fair Value Gaps, which are critical zones that emerge when traditional Fair Value Gaps (FVGs) are invalidated by price action. These gaps represent key areas where price often reacts, making them essential for identifying potential reversals, trend continuations, and liquidity zones.
What Are Inversion Fair Value Gaps?
Inversion Fair Value Gaps occur when price revisits a traditional FVG and breaks through it, effectively flipping its role in the market. For example:
A bullish FVG that is invalidated becomes a bearish zone, often acting as resistance.
A bearish FVG that is invalidated transforms into a bullish zone, serving as support.
These gaps are significant because they often align with institutional trading activity. They highlight areas where large orders have been executed or where liquidity has been targeted. Understanding these gaps provides traders with a deeper insight into market structure and helps them anticipate future price movements with greater accuracy.
Why This Strategy Works
The IFVG concept is rooted in ICT principles, which emphasize liquidity dynamics, market inefficiencies, and institutional order flow. Traditional FVGs represent imbalances in price action caused by gaps between candles. When these gaps are invalidated, they become inversion zones that can act as magnets for price. These zones frequently serve as high-probability areas for price reversals or trend continuations.
This strategy works because it aligns with how institutional traders operate. Inversion gaps often mark areas of interest for "smart money," making them reliable indicators of potential market turning points. By focusing on these zones, traders can align their strategies with institutional behavior and improve their overall trading edge.
How the Indicator Works
This indicator simplifies the process of identifying and tracking IFVGs by automating their detection and visualization on the chart. It scans the chart in real-time to identify bullish and bearish FVGs that meet user-defined thresholds for inversion. Once identified, these gaps are dynamically displayed on the chart with distinct colors for bullish and bearish zones.
The indicator also tracks whether these gaps are mitigated or broken by price action. When an IFVG is broken, it extends the zone for a user-defined number of bars to visualize its potential role as a new support or resistance level. Additionally, alerts can be enabled to notify traders when new IFVGs form or when existing ones are broken, ensuring timely decision-making in fast-moving markets.
Key Features
Automatic Detection: The indicator automatically identifies bullish and bearish IFVGs based on user-defined thresholds.
Dynamic Visualization: It displays IFVGs directly on the chart with customizable colors for easy differentiation.
Real-Time Updates: The status of each IFVG is updated dynamically based on price action.
Zone Extensions: Broken IFVGs are extended to visualize their potential as support or resistance levels.
Alerts: Notifications can be set up to alert traders when key events occur, such as the formation or breaking of an IFVG.
These features make the tool highly efficient and reduce the need for manual analysis, allowing traders to focus on execution rather than tedious chart work.
Benefits of Using This Indicator
The IFVG indicator offers several advantages that make it an indispensable tool for ICT traders. By automating the detection of inversion gaps, it saves time and reduces errors in analysis. The clearly defined zones improve risk management by providing precise entry points, stop-loss levels, and profit targets based on market structure.
This tool is also highly versatile and adapts seamlessly across different timeframes. Whether you’re scalping lower timeframes or swing trading higher ones, it provides actionable insights tailored to your trading style. Furthermore, by aligning your strategy with institutional logic, you gain a significant edge in anticipating market movements.
Practical Applications
This indicator can be used across various trading styles:
Scalping: Identify quick reversal points on lower timeframes using real-time alerts.
Day Trading: Use inversion gaps as key levels for intraday support/resistance or trend continuation setups.
Swing Trading: Analyse higher timeframes to identify major inversion zones that could act as critical turning points in larger trends.
By integrating this tool into your trading routine, you can streamline your analysis process and focus on executing high-probability setups.
Conclusion
The Inversion Fair Value Gap (IFVG) indicator is more than just a technical analysis tool—it’s a strategic ally for traders looking to refine their edge in the markets. By automating the detection and tracking of inversion gaps based on ICT principles, it simplifies complex market analysis while maintaining accuracy and depth. Whether you’re new to ICT strategies or an experienced trader seeking greater precision, this indicator will elevate your trading game by aligning your approach with institutional behavior.
If you’re serious about improving your trading results while saving time and effort, this tool is an essential addition to your toolkit. It provides clarity in chaotic markets, enhances precision in trade execution, and ensures you never miss critical opportunities in your trading journey.
__________________________________________
Thanks for your support!
If you found this idea helpful or learned something new, drop a like 👍 and leave a comment, I’d love to hear your thoughts! 🚀
Make sure to follow me for more price action insights, free indicators, and trading strategies. Let’s grow and trade smarter together! 📈

MTF Fibonacci Pivots with Mandelbrot FractalsMTF Fibonacci Pivots with Mandelbrot Fractals: Advanced Market Structure Analysis
Overview
The MTF Fibonacci Pivots with Mandelbrot Fractals indicator represents a significant advancement in technical analysis by combining multi-timeframe Fibonacci pivot levels with sophisticated fractal pattern recognition. This powerful tool identifies key support and resistance zones while predicting potential price reversals with remarkable accuracy.
Key Capabilities
This indicator provides traders with three distinct layers of market structure analysis:
Automatic Timeframe Adaptation: The primary pivot set automatically adjusts to your chart's timeframe, ensuring relevant support and resistance levels for your specific trading horizon.
1-Year Fibonacci Pivots: The second layer displays yearly pivots that reveal long-term market cycles and institutional price levels that often act as significant reversal points.
3-Year Fibonacci Pivots: The third layer unveils major market structure zones that typically remain relevant for extended periods, offering strategic context for position trading and long-term investment decisions.
Predictive Technology
What truly distinguishes this indicator is its advanced predictive capability powered by:
Mandelbrot Fractal Pattern Recognition: The indicator implements a sophisticated fractal detection algorithm that identifies recurring price patterns across multiple timeframes. Unlike conventional fractal indicators, it incorporates noise filtering and adaptive sensitivity to market volatility.
Tesla's 3-6-9 Principle Integration: The system incorporates Nikola Tesla's mathematical principle through a cubic Mandelbrot equation (Z_{n+1} = Z_n^3 + C where Z_0 = 0), creating a unique approach to pattern recognition that aligns with natural market rhythms.
Historical Pattern Matching: When a current price pattern exhibits strong similarity to historical formations, the indicator generates predictive targets with confidence ratings. Each prediction undergoes rigorous validation against multiple parameters including trend alignment, volatility context, and mathematical coherence.
Visual Intelligence System
The indicator's visual presentation enhances trading decision-making through:
Confidence-Based Visualization: Predictions display with intuitive star ratings, percentage confidence scores, and contextual information including price movement magnitude and estimated time to target.
Adaptive Color Harmonization: The color system intelligently adjusts to provide optimal visibility while maintaining a professional appearance suitable for any chart setup.
Trend Alignment Indicators: Each prediction includes references to the broader trend context, helping traders avoid counter-trend trades unless the reversal signal carries exceptional strength.
Strategic Applications
This indicator excels in multiple trading scenarios:
Intraday Trading: Identify high-probability reversal zones with precise timing
Swing Trading: Anticipate significant market turns at key structural levels
Position Trading: Recognize major cycle shifts for strategic entry and exit
The automatic 1-year and 3-year Fibonacci pivots provide institutional-grade reference points that typically define major market movements. These longer timeframes reveal critical zones that might be invisible on shorter-term analysis, giving you a significant edge in understanding where price is likely to encounter substantial buying or selling pressure.
This innovative approach to market analysis combines classical Fibonacci mathematics with cutting-edge fractal theory to create a comprehensive market structure visualization system that illuminates both present support/resistance levels and future price targets with exceptional clarity.
Setting Up MTF Fibonacci Pivots with Mandelbrot Fractals
Initial Setup
Adding this indicator to your TradingView charts is straightforward:
Navigate to the "Indicators" button on your chart toolbar
Search for "MTF Fibonacci Pivots with Mandelbrot Fractals"
Select the indicator to add it to your chart
A configuration panel will appear with various setting categories
Recommended Settings
The indicator comes pre-configured with optimal default settings, but you may want to adjust them based on your trading style:
For Day Trading (Timeframes 1-minute to 1-hour)
Pivots Timeframe 1: Auto (automatically adapts to your chart)
Pivots Timeframe 2: Daily
Pivots Timeframe 3: Weekly
Fractal Sensitivity: 2-3
Fractal Lookback Period: 20
Prediction Strength: 2
Color Theme: High Contrast or Dark Mode
For Swing Trading (Timeframes 4-hour to Daily)
Pivots Timeframe 1: Daily
Pivots Timeframe 2: Weekly
Pivots Timeframe 3: Monthly
Fractal Sensitivity: 1-2
Fractal Lookback Period: 30
Prediction Strength: 2-3
Color Theme: Default or Dimmed
For Position Trading (Timeframes Daily to Weekly)
Pivots Timeframe 1: Weekly
Pivots Timeframe 2: Monthly
Pivots Timeframe 3: Quarterly
Fractal Sensitivity: 1
Fractal Lookback Period: 50
Prediction Strength: 1
Color Theme: Monochrome or Pastel
Restoring Default Settings
If you've adjusted settings and wish to return to the defaults:
Right-click on the indicator name on your chart
Select "Settings" from the context menu
In the settings dialog, look for the "Reset All" button at the bottom
Confirm the reset when prompted
Alternatively, you can remove the indicator and add it again for a fresh start with default settings.
Advanced Settings Guidance
Visual Appearance
Use Gradient Colors: Enable for better visual differentiation between pivot levels
Color Transparency: 15% provides an optimal balance between visibility and chart clutter
Line Width: 1-2 for cleaner charts, 3+ for enhanced visibility
Fractal Analysis
Enable Fractal Analysis: Keep enabled for prediction capabilities
Fractal Box Spacing: Higher values (5-10) for cleaner displays, lower values (1-3) for more signals
Maximum Forecast Bars: 20 is optimal for most timeframes, adjust higher for longer predictions
Performance Considerations
Enable Self-Optimization: Keep enabled to maintain smooth chart performance
Resource Priority: Use "Balanced" for most computers, "Performance" for older systems
Force Pivot Display: Enable only when checking specific historical periods
Common Setup Mistakes to Avoid
Setting all timeframes too close together (e.g., Daily, Daily, Weekly) reduces the multi-timeframe advantage
Using high fractal sensitivity (4+) on noisy markets creates excessive signals
Setting fractal box spacing too low causes cluttered prediction boxes
Disabling self-optimization may cause performance issues on complex charts
Using incompatible color themes for your chart background reduces visibility
The indicator's power comes from its default 1-year and 3-year Fibonacci pivot settings, which highlight institutional levels while the auto-timeframe setting adapts to your trading horizon. These carefully balanced defaults provide an excellent starting point for most traders.
For optimal results, I recommend making minimal adjustments at first, then gradually customizing settings as you become familiar with the indicator's behavior in your specific markets and timeframes.
Screenshots:

EBP Candle Marker### **EBP Candle Marker – TradingView Indicator**
The **EBP Candle Marker** is a specialized TradingView indicator designed to identify and highlight potential liquidity sweep candles. This indicator visually emphasizes key price action patterns where the market sweeps previous highs or lows and closes in the opposite direction, often signaling potential reversals or liquidity grabs.
---
### 📊 **Indicator Logic:**
1. **Bullish Sweep:**
- The current candle’s **low** is lower than the previous candle’s **low** (indicating a liquidity sweep).
- The **close** is above both the **open** and **close** of the previous candle.
2. **Bearish Sweep:**
- The current candle’s **high** is higher than the previous candle’s **high** (indicating a liquidity sweep).
- The **close** is below both the **open** and **close** of the previous candle.
---
### 🎨 **Visual Representation:**
- **Yellow Candle Body:** Highlights any candle meeting the bullish or bearish sweep conditions.
---
### 🔔 **Alert Functionality:**
The indicator supports setting custom alerts in TradingView for:
- **Bullish Sweep Detected** – Notifies when a bullish sweep occurs.
- **Bearish Sweep Detected** – Notifies when a bearish sweep occurs.
These alerts are compatible across any timeframe, providing flexibility to monitor key market conditions.
---
### 📈 **Use Cases:**
- **Liquidity Sweep Detection:** Identify areas where the market may be triggering stop-loss orders or liquidity hunts.
- **Reversal Confirmation:** Enhance trade confirmation by identifying potential reversal zones.
- **Scalping & Swing Trading:** Suitable for both short-term and long-term trading strategies across multiple timeframes.

MTF Fractals [RunRox]🔽 MTF Fractals is a powerful indicator designed to visualize fractals from multiple timeframes directly on your chart, highlight liquidity sweeps at these fractal levels, and provide several additional features we’ll cover in detail below.
We created this indicator because we couldn’t find a suitable tool that met our specific needs on TradingView. Therefore, we decided to develop a valuable indicator for the entire TradingView community, combining simplicity and versatility.
⁉️ WHAT IS A FRACTALS?
In trading, a fractal is a technical analysis pattern composed of five consecutive candles, typically highlighting local market turning points. Specifically, a fractal high is formed when a candle’s high is higher than the highs of the two candles on either side, whereas a fractal low occurs when a candle’s low is lower than the lows of the two adjacent candles on both sides.
Traders use fractals as reference points for identifying significant support and resistance levels, potential reversal areas, and liquidity zones within price action analysis. Below is a screenshot illustrating clearly formed fractals on the chart.
📙 FRACTAL FORMATION
Here’s how fractals form depending on your chosen setting (3, 5, 7, or 9):
▶️ 3-bar fractal – forms when the central candle is higher (for highs) or lower (for lows) than one candle on each side.
▶️ 5-bar fractal – forms when the central candle is higher or lower than two candles on both sides.
▶️ 7-bar fractal – forms when the central candle is higher or lower compared to the three candles on each side.
▶️ 9-bar fractal – forms similarly but requires four candles on each side, making the fractal significantly more reliable and robust.
A higher number of bars ensures stronger fractal levels, highlighting more significant potential reversal points on the chart.
Now that we’ve covered the theory behind fractal formation, let’s explore the indicator’s functionality in more detail.
Below, I’ll explain each feature clearly and illustrate how you can effectively utilize this indicator in your trading.
🕐 MULTI-TIMEFRAME FRACTALS
We realized that displaying fractals only from the current timeframe isn’t always convenient, so we’ve introduced Multi-Timeframe Fractals into this indicator.
Now you can easily display fractals from higher timeframes directly on your current chart, providing you with broader market context and clearer trading signals.
Fractals from Current Timeframe – Fractals identified directly on the chart’s current timeframe.
Fractals from Higher Timeframes – Fractals sourced from higher timeframes and displayed clearly on your current chart for enhanced market perspective.
📈 FRACTAL LINES
Since fractals represent areas of high liquidity, we’ve added an option to extend fractal levels horizontally as Fractal Lines across your chart.
This feature allows you to clearly visualize critical liquidity areas from higher timeframes, directly on your current timeframe chart, as demonstrated in the screenshot below.
With this approach, you can clearly visualize significant fractal levels from higher timeframes directly on your current chart - for example, projecting fractals from the 1-hour (1H) timeframe onto a 3-minute (3m) chart. ✅ This helps you easily identify critical liquidity areas and potential reversal zones without the need to switch between multiple timeframes.
💰 LIQUDITY SWEEP (LIQUDITY GRAB)
To enhance your trading experience, we’ve introduced a feature that clearly identifies liquidity sweeps of fractal levels.
A Liquidity Sweep occurs when a candle closes beyond a fractal line, leaving a wick that pierces through it, signaling that liquidity has been collected at this level.
Below, you’ll find two examples illustrating this functionality:
▶️ Fractal lines from the current timeframe
▶️ Fractal lines projected from higher timeframes
The first example illustrates liquidity being swept from fractals on the current timeframe .
Here, the candle clearly closes beyond the fractal line, leaving a wick through it. This indicates a liquidity sweep at the fractal level, visually highlighting a potential reversal or continuation opportunity directly on your chart.
In the second example, fractals from the higher timeframe are projected onto your current chart.
When a candle on your current timeframe closes beyond an HTF fractal line - leaving a wick through this level - the indicator highlights it clearly. This signals to traders a potential reversal zone, indicating that liquidity has been swept, and price may reverse or significantly react from this area.
You can also enable the display of additional labels on the chart. These labels clearly mark liquidity sweeps at fractal levels, making it easier to visually identify potential reversal points directly on your chart.
⚙️ SETTINGS
Below are the indicator settings with detailed explanations for each parameter.
🔷 Bars in Fractal – Number of candles to the right and left required to form a fractal.
🔷 Fractal Timeframe – Select the timeframe from which you want to display fractals on the current chart.
🔷 Max Age, bars – Number of bars during which the fractal will remain active.
🔷 Show Fractal Line – Display or hide fractal lines.
🔷 Line Style – Choose the style of the line displayed on the chart.
🔷 Line Width – Thickness of the fractal line.
🔷 High Fractal – Style and color of bearish fractals.
🔷 Low Fractal – Style and color of bullish fractals.
🔷 Fractal Label Size – Select the size of fractal labels.
🔷 Show Sweep Labels – Option to display labels when a liquidity sweep occurs.
🔷 Label Color – Color and transparency of the area marked on the chart during a sweep.
🔷 Shade Sweep Area – Show or hide the sweep area shading.
🔷 Area Color – Color and transparency settings for the sweep area.
🔶 We’d love to hear your feedback and any suggestions for additional features you’d like to see in this indicator. We’ll be happy to consider your ideas and continue improving the indicator!

GRID EXTENSIONGRID EXTENSION
Overview
The GRID EXTENSION is a simple grid-based indicator for TradingView, built with Pine Script v6. It plots horizontal price levels starting from a user-defined anchor price, with spacing set by a tick increment. Use it to identify key support, resistance, or price zones on charts for Crypto, Forex, or Futures.
Key Features
Custom Grid Levels: Plot up to 22 levels (e.g., 0, 0.25, 1.25, -2.50) with options to show/hide, set values, and choose colors.
Market-Specific Tick Increments: Select your asset type (Crypto, Forex, Futures) and choose from a range of tick increments tailored for each market:
Crypto: 1 to 5000 ticks (e.g., 100 ticks = $0.001 on ADA/USD, 5000 ticks = $50 on BTC/USD).
Forex: 5 to 5000 ticks (e.g., 100 ticks = 1 pip on EUR/USD, 5000 ticks = 50 pips).
Futures: 1 to 2500 ticks (e.g., 25 ticks = 6.25 points on E-mini S&P 500, $312.50 per contract).
Visual Options:
Extend lines to the right.
Show price and level labels (as values or percentages).
Place labels on the left or right.
Adjust background transparency for filled areas between levels.
How to Use
Set Asset Type: Choose "Crypto," "Forex," or "Futures" to match your chart.
Set Anchor Price: Enter a starting price for the grid.
Pick Tick Increment: Select a tick increment from the dropdown, following the guidance for your asset type (see Key Features).
Customize Levels: Turn levels on/off, set values, and pick colors.
Add to Chart: Apply the indicator to see the grid on your chart.
Tips
Use levels to mark support/resistance zones for entries or exits.
Extend lines to project future price zones.
Choose smaller increments (e.g., 5 ticks) for scalping, or larger ones (e.g., 1000 ticks) for swing trading.
Combine with indicators like moving averages for better signals.
Settings
Asset Type: Select "Crypto," "Forex," or "Futures" (default: "Crypto").
Anchor Price: Starting price for the grid (default: 0.0).
Tick Increment: Space between levels (options: 1, 5, 10, 25, 50, 100, 250, 500, 1000, 2500, 5000). Choose based on asset type.
Extend Right: Extend lines to the right (default: true).
Show Prices: Show price labels (default: true).
Show Levels: Show level values or percentages (default: true).
Format: Display levels as "Values" or "Percent" (default: "Values").
Labels Position: Place labels on "Left" or "Right" (default: "Left").
Background Transparency: Set transparency for filled areas (default: 100, range 0-100).
Level Options: Enable/disable levels, set values, and choose colors.
Notes
Set the anchor price to a key level (like a recent high or low) for best results.
Check the tick increment tooltip to ensure the spacing suits your market type.
Works on any chart, best for clear price trends or ranges.
Acknowledgments
Made with Pine Script v6 for TradingView. This is v1.0—feedback welcome for future updates!

Vortex Sniper Elite @DaviddTechVortex Sniper Elite @DaviddTech
Vortex Sniper Elite @DaviddTech is a comprehensive trading system designed to deliver high-probability trade setups across all market conditions. By seamlessly integrating adaptive baseline detection, squeeze momentum analysis, and advanced vortex filtering, this indicator provides traders with a complete edge-based approach to market analysis.
🔥 Key Features:
Complete Model Integration:
Baseline: Advanced McGinley Dynamic indicator for superior trend detection
Confirmation #1: Enhanced TTM Squeeze for momentum and volatility analysis
Confirmation #2: Dual Tether Line system for dynamic market structure mapping
Volatility Filter: Specialized Vortex indicator for precision entry timing
Adaptive Stop Loss: Proprietary trailing stop system based on ATR calculations
Advanced Visual Dashboard:
Real-time component analysis with strength metrics
Color-coded signal status for immediate trade assessment
Squeeze state monitoring with visual confirmation
Vortex divergence strength percentage for optimal entries
Premium Signal Detection:
Multi-timeframe compatible system for scaling strategies
Automated buy/sell signals at optimal entry points
Clear exit signals for risk management
Squeeze momentum visualization for timing precision
DaviddTech Alpha Edge System:
Gradient transparency algorithm for visual trend strength confirmation
Bar coloring system based on momentum direction
Background highlighting for active signal states
Dashboard for ease of understanding
💰 Trading Applications:
Sniper Entries: Utilize the Vortex confirmation to pinpoint precise entry points
Trend Alignment: McGinley baseline establishes the primary market direction
Volatility Awareness: TTM Squeeze identifies optimal market conditions
Risk Management: Set stops based on the adaptive trailing stop system
Position Management: Monitor dashboard metrics for changing market conditions
Vortex Sniper Elite @DaviddTech represents the culmination of the DaviddTech methodology in one cohesive system. Whether you're a day trader seeking precise entries or a swing trader looking for significant market moves, this indicator delivers the structured approach needed to consistently extract profits from any market condition.
DaviddTech Trading System Explained:
The DaviddTech methodology follows a strict component-based approach:
The Baseline establishes the primary trend direction, acting as your first filter
Confirmation Indicators validate potential trade setups only when aligned with the baseline
The Volatility/Volume Indicator ensures you only enter trades with sufficient directional momentum
A Trailing Stop System provides mathematically optimized exit points
Vortex Sniper Elite integrates all these components into a visually intuitive system that eliminates guesswork and enforces disciplined trading decisions.
Recommended Settings:
This indicator comes pre-configured with optimized parameters, but feel free to adjust based on your timeframe:
For day trading: Reduce Baseline and TTM lengths by 30-40%
For swing trading: Consider increasing Tether and Trail Stop lengths by 25-50%
For scalping: Focus on Vortex confirmation with shorter timeframes
Best Practices:
Wait for all components to align before entering trades
Use the dashboard to evaluate the strength of each signal
Monitor squeeze states for potential volatility expansion
Let the trailing stop system handle your exits
Backtest across multiple timeframes to find your optimal settings
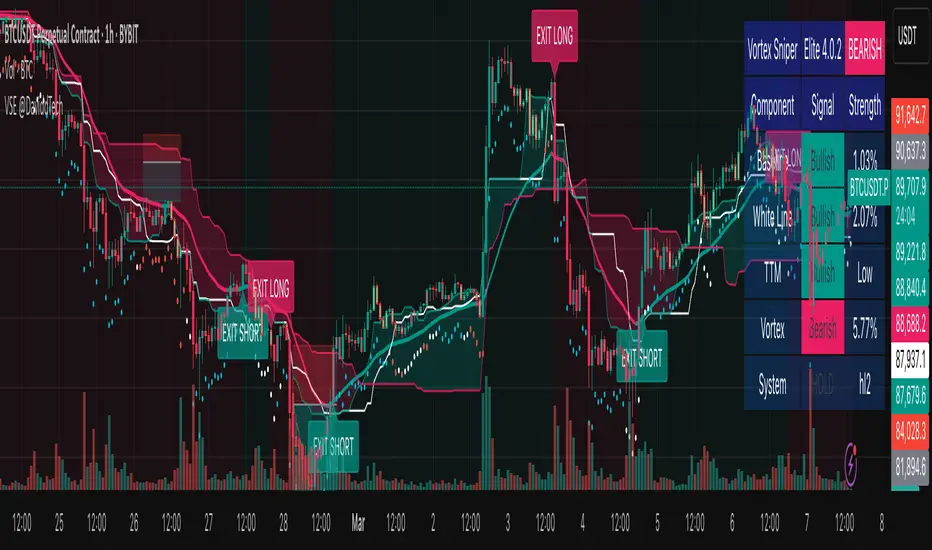
Advanced Support and Resistance Levels[MAP]Advanced Support and Resistance Levels Indicator
Author
Developed by:
Overview
The "Advanced Support and Resistance Levels" indicator, created, is a sophisticated tool designed for TradingView's Pine Script v6 platform. It identifies and plots key support and resistance levels on a price chart, enhancing technical analysis by incorporating pivot strength, volume weighting, and level decay. The indicator overlays lines, zones, and labels on the chart, providing a visual representation of significant price levels where the market has historically reversed or consolidated.
Purpose
This indicator, authored by , aims to:
Detect significant pivot points (highs and lows) with customizable strength requirements.
Track and rank support/resistance levels based on their recency, volume, and number of touches.
Display these levels as lines and optional zones, with strength-based visual cues (e.g., line thickness and opacity).
Offer flexibility through user-configurable settings to adapt to different trading styles and market conditions.
Features
Pivot Detection:
Identifies high and low pivots using a strength parameter, requiring a specified number of bars on either side where no higher highs or lower lows occur.
Incorporates closing price checks and SMA-based trend confirmation to filter out noise and ensure pivots align with the broader market direction.
Level Management:
Maintains a dynamic array of levels with attributes: price, type (support/resistance), bars since last touch, strength, and volume.
Merges nearby levels within a tolerance percentage, updating prices with a strength-weighted average.
Prunes weaker or older levels when exceeding the maximum allowed, prioritizing those with higher calculated strength.
Strength Calculation:
Combines the number of touches (strength), volume (if enabled), and age decay (if enabled) into a single metric.
Volume weighting uses a logarithmic scale to emphasize high-volume pivots without over-amplifying extreme values.
Age decay reduces the importance of older levels over time, ensuring relevance to current price action.
Visualization:
Draws horizontal lines at each level, with thickness reflecting the number of touches (up to a user-defined maximum).
Optional price zones around levels, sized as a percentage of the price, to indicate areas of influence.
Labels display the level type (S for support, R for resistance), price, and strength score, with position (left or right) customizable.
Line opacity varies with strength, providing a visual hierarchy of level significance.
Plots small triangles at detected pivot points for reference.
Inputs
Lookback Period (lookback, default: 20): Number of bars to consider for trend confirmation via SMA. Range: 5–100.
Pivot Strength (strength, default: 2): Number of bars required on each side of a pivot to confirm it. Range: 1–10.
Price Tolerance % (tolerance, default: 0.5): Percentage range for merging similar levels. Range: 0.1–5.
Max Levels to Show (maxLevels, default: 10): Maximum number of levels displayed. Range: 2–50.
Zone Size % (zoneSizePercent, default: 0.1): Size of the S/R zone as a percentage of the price. Range: 0–1.
Line Width (lineWidth, default: 1): Maximum thickness of level lines. Range: 1–5.
Show Labels (showLabels, default: true): Toggle visibility of level labels.
Label Position (labelPos, default: "Right"): Position of labels ("Left" or "Right").
Level Strength Decay (levelDecay, default: true): Enable gradual reduction in strength for older levels.
Volume Weighting (volumeWeight, default: true): Incorporate volume into level strength calculations.
Support Color (supportColor, default: green): Color for support levels.
Resistance Color (resistColor, default: red): Color for resistance levels.
How It Works
Pivot Detection:
Checks for pivots only after enough bars (2 * strength) have passed.
A high pivot requires strength bars before and after with no higher highs or closes, and a short-term SMA above a long-term SMA.
A low pivot requires strength bars before and after with no lower lows or closes, and a short-term SMA below a long-term SMA.
Level Tracking:
New pivots create levels with initial strength and volume.
Existing levels within tolerance are updated: strength increases, volume takes the maximum value, and price adjusts via a weighted average.
Levels older than lookback * 4 bars with strength below 0.5 are removed.
If the number of levels exceeds maxLevels, the weakest (by calculated strength) are pruned using a selection sort algorithm.
Drawing:
Updates on the last confirmed bar or in real-time.
Lines extend lookback bars left and right from the current bar, with thickness based on touches.
Zones (if enabled) are drawn symmetrically around the level price.
Labels show detailed info, with opacity tied to strength.
Usage
Add to Chart: Apply the indicator to any TradingView chart via the Pine Script editor, as designed by .
Adjust Settings: Customize inputs to match your trading strategy (e.g., increase strength for stronger pivots, adjust tolerance for tighter level merging).
Interpret Levels: Focus on thicker, less transparent lines for stronger levels; use zones to identify potential reversal areas.
Combine with Other Tools: Pair with trend indicators or oscillators for confluence in trading decisions.
Notes
Performance: The indicator uses arrays and sorting, which may slow down on very long charts with many levels. Keep maxLevels reasonable for efficiency.
Accuracy: Enhanced by trend confirmation and volume weighting, making it more reliable than basic S/R indicators, thanks to 's design.
Limitations: Real-time updates may shift levels as new pivots form; historical levels are more stable.
Example Settings
For day trading: lookback=10, strength=1, tolerance=0.3, maxLevels=5.
For swing trading: lookback=50, strength=3, tolerance=0.7, maxLevels=10.
Credits
Author: – Creator of this advanced support and resistance tool, blending precision and customization for traders.

Mile Runner - Swing Trade LONGMile Runner - Swing Trade LONG Indicator - By @jerolourenco
Overview
The Mile Runner - Swing Trade LONG indicator is designed for swing traders who focus on LONG positions in stocks, BDRs (Brazilian Depositary Receipts), and ETFs. It provides clear entry signals, stop loss, and take profit levels, helping traders identify optimal buying opportunities with a robust set of technical filters. The indicator is optimized for daily candlestick charts and combines multiple technical analysis tools to ensure high-probability trades.
Key Features
Entry Signals: Visualized as green triangles below the price bars, indicating a potential LONG entry.
Stop Loss and Take Profit Levels: Automatically plotted on the chart for easy reference.
Stop Loss: Based on the most recent pivot low (support level).
Take Profit: Calculated using a Fibonacci-based projection from the entry price to the stop loss.
Trend and Momentum Filters: Ensures trades align with the prevailing trend and have sufficient momentum.
Volume and Volatility Confirmation: Verifies market interest and price movement potential.
How It Works
The indicator uses a combination of technical tools to filter and confirm trade setups:
Exponential Moving Averages (EMAs):
A short EMA (default: 9 periods) and a long EMA (default: 21 periods) identify the trend.
A bullish crossover (EMA9 crosses above EMA21) signals a potential upward trend.
Money Flow Index (MFI):
Confirms buying pressure when MFI > 50.
Average True Range (ATR):
Ensures sufficient volatility by checking if ATR exceeds its 20-period moving average.
Volume:
Confirms market interest when volume exceeds its 20-period moving average.
Pivot Lows:
Identifies recent support levels (pivot lows) to set the stop loss.
Ensures the pivot low is recent (within the last 10 bars by default).
Additional Trend Filter:
Confirms the long EMA is rising, reinforcing the bullish trend.
Inputs and Customization
The indicator is highly customizable, allowing traders to tailor it to their strategies:
EMA Periods: Adjust the short and long EMA lengths.
ATR and MFI Periods: Modify lookback periods for volatility and momentum.
Pivot Lookback: Control the sensitivity of pivot low detection.
Fibonacci Level: Adjust the Fibonacci retracement level for take profit.
Take Profit Multiplier: Fine-tune the aggressiveness of the take profit target.
Max Pivot Age: Set the maximum bars since the last pivot low for relevance.
Usage Instructions
Apply the Indicator:
Add the "Mile Runner - Swing Trade LONG" indicator to your TradingView chart.
Best used on daily charts for swing trading.
Look for Entry Signals:
A green triangle below the price bar signals a potential LONG entry.
Set Stop Loss and Take Profit:
Stop Loss: Red dashed line indicating the stop loss level.
Take Profit: Purple dashed line showing the take profit level.
Monitor the Trade:
The entry price is marked with a green dashed line for reference.
Adjust trade management based on the plotted levels.
Set Alerts:
Use the built-in alert condition to get notified of new LONG entry signals.
Important Notes
For LONG Positions Only : Designed exclusively for swing trading LONG positions.
Timeframe: Optimized for daily charts but can be tested on other timeframes.
Asset Types: Works best with stocks, BDRs, and ETFs.
Risk Management: Always align stop loss and take profit levels with your risk tolerance.
Why Use Mile Runner?
The Mile Runner indicator simplifies swing trading by integrating trend, momentum, volume, and volatility filters into one user-friendly tool. It helps traders:
Identify high-probability entry points.
Establish clear stop loss and take profit levels.
Avoid low-volatility or low-volume markets.
Focus on assets with strong buying pressure and recent support.
By following its signals and levels, traders can make informed decisions and enhance their swing trading performance. Customize the inputs and test it on your favorite assets—happy trading!

Multi-Timeframe ATR Levels by Hitesh2603Description:
"Multi-Timeframe ATR Levels by Hitesh2603" is a versatile and adaptive indicator designed to help traders identify key price levels based on the Average True Range (ATR) from a higher timeframe. The script automatically adapts to the current chart’s timeframe and allows you to customize the higher timeframe for ATR calculations, making it ideal for intraday and swing trading strategies.
The indicator plots upper and lower price levels based on the ATR multiplier, providing clear visual cues for potential profit-taking or exit points. It also includes features like editable timeframe presets , historical level plotting , labels , and alerts , making it a powerful tool for traders of all experience levels.
---
Key Features:
1. Automatic Timeframe Adaptation : - The script automatically detects the current chart’s timeframe and selects the appropriate higher timeframe for ATR calculations.
2. Editable Preset Timeframe Pairs : - Customize the higher timeframe for each chart timeframe directly in the indicator settings.
3. Dynamic ATR-Based Levels :- Plots upper and lower price levels using the formula:
- Upper Level = Current Candle Open + (Previous Candle ATR * Multiplier)
- Lower Level = Current Candle Open - (Previous Candle ATR * Multiplier)
4. Customizable Inputs :
- Adjust ATR length, multiplier, line length, colors, and more.
5. Labels :
- Displays the exact values of the upper and lower levels for easy reference.
6. Historical Levels :
- Optionally plots historical levels for all candles.
7. Alerts :
- Get notified when the price crosses the upper or lower levels.
---
Use Cases:
1. Intraday Trading :
- Use the script on a 5-minute or 15-minute chart with a 1-hour higher timeframe to identify intraday profit-taking or exit points.
2. Swing Trading :
- Use the script on a 1-hour or 4-hour chart with a daily higher timeframe to identify swing trading opportunities.
3. Position Trading :
- Use the script on a daily chart with a weekly higher timeframe to identify key levels for position trading.
4. Breakout Confirmation :
- Use the upper and lower levels as confirmation points for breakouts or reversals.
5. Risk Management :
- Use the levels to set stop-loss or take-profit targets based on market volatility.
---
How to Use:
1. Add the Script to Your Chart :
- Search for "Multi-Timeframe ATR Levels by Hitesh2603" in the TradingView indicator library and add it to your chart.
2. Customize the Settings :
- Adjust the inputs (e.g., ATR length, multiplier, line length, colors, etc.) to suit your trading strategy.
3. Set the Higher Timeframe :
- The script will automatically display an input for the higher timeframe based on the current chart’s timeframe. Customize it as needed.
4. Interpret the Levels :
- The script will plot two horizontal lines (upper and lower levels) on the chart. Use these levels for profit-taking, exits, or breakout confirmation.
5. Enable Alerts :
- Set up alerts to get notified when the price crosses the upper or lower levels.
---
Input Parameters:
1. ATR Length :
- The period used to calculate the ATR (default: 14).
2. ATR Multiplier :
- The multiplier applied to the ATR to calculate the levels (default: 0.65).
3. Line Length :
- The number of candles to extend the lines (default: 10).
4. Show Labels :
- Toggle to display the exact values of the levels (default: true).
5. Show Historical Levels :
- Toggle to plot historical levels for all candles (default: false).
6. Line Colors :
- Customize the colors of the upper and lower levels.
7. Line Width :
- Adjust the thickness of the lines (default: 2).
---
Example:
- Current Chart : 5-minute
- Higher Timeframe : 1-hour
- Previous Hour’s ATR : 4.6
- Current Hour’s Open : 102
- Multiplier : 0.65
Levels :
- Upper Level = 102 + (4.6 * 0.65) = 105.0
- Lower Level = 102 - (4.6 * 0.65) = 99.0
The script will plot horizontal lines at 105.0 and 99.0 on the 5-minute chart.
---
Alerts:
- Price Crosses Upper Level :
- Triggered when the price crosses above the upper level.
- Price Crosses Lower Level :
- Triggered when the price crosses below the lower level.
---
Notes:
- The script is designed to be flexible and adaptable to various trading styles and timeframes.
- Always backtest and validate the indicator with your trading strategy before using it in live trading.
---
Credits:
- Developed by Hitesh2603 .
- Special thanks to the TradingView community for inspiration and support.

Crystal Order BlockThe Crystal Order Block Indicator is a powerful tool designed to help traders identify key institutional order blocks with high precision. This indicator is ideal for traders following Smart Money Concepts (SMC) and Institutional Trading Strategies, providing clear insights into potential high-probability trade setups.
🔹 Key Features:
✔ Automatic Order Block Detection: Identifies valid bullish & bearish order blocks.
✔ Unmitigated Order Blocks Highlighted: Focuses on fresh order blocks for improved trade opportunities.
✔ Trend-Focused Trading: Works best when combined with market structure analysis.
✔ Multi-Timeframe Support: Suitable for scalping, swing trading, and intraday trading.
✔ Risk Management Enhancement: Helps traders refine entries and exits based on institutional price movements.
📈 How to Use the Crystal Order Block Indicator:
🔹 Identifying Order Blocks:
➡ The indicator automatically detects order blocks formed by institutional trading activity.
➡ Unmitigated order blocks are highlighted, indicating areas where price may react.
🔹 High-Probability Trade Setups:
➡ Buy Setup: Look for a bullish order block in an uptrend, confirming strength.
➡ Sell Setup: Identify a bearish order block in a downtrend for potential short trades.
🔹 Order Block Mitigation:
➡ The updated version filters out mitigated order blocks, allowing traders to focus on fresh trading opportunities.
📊 Best Practices & Timeframes:
🔸 Works on all timeframes, but higher accuracy is observed on M30 and above.
🔸 Best suited for Smart Money Trading, Institutional Trading, and Price Action Strategies.
🔸 Should be used with liquidity concepts and market structure analysis for enhanced precision.
⚠ Important Note:
This indicator is a technical tool designed to assist traders in market analysis. It does not guarantee success and should be used alongside proper risk management and trading discipline.

kurd fx Dynamic EMA StrategyDynamic EMA Strategy Explanation
This TradingView Pine Script indicator, "Dynamic EMA Strategy," is designed to plot Exponential Moving Averages (EMAs) dynamically based on the selected timeframe. It adjusts the EMA periods depending on whether the trader is scalping, swing trading, or position trading.
Functionality
1. Defining EMA Periods Based on Timeframe
The script determines appropriate EMA values based on the selected chart timeframe:
Scalping (1m, 3m, 5m)
Uses EMA 9, EMA 21, and EMA 50 for fast-moving market conditions.
Swing Trading (15m, 30m, 45m)
Uses EMA 50 and EMA 100, suitable for medium-term trend identification.
EMA 3 is disabled (na) in this mode.
Position Trading (1H and higher)
Uses EMA 100 and EMA 200 to identify long-term trends.
EMA 3 is disabled (na) in this mode.
2. EMA Calculation
The script calculates EMA values dynamically:
emaLine1 = ta.ema(close, ema1): Computes the first EMA.
emaLine2 = ta.ema(close, ema2): Computes the second EMA.
emaLine3 = not na(ema3) ? ta.ema(close, ema3) : na: Computes the third EMA only if applicable.
3. Plotting the EMAs
The script overlays the EMAs on the chart:
Blue Line (EMA 1) → Represents the fastest EMA.
Orange Line (EMA 2) → Represents the medium EMA.
Red Line (EMA 3) → Represents the slowest EMA (if applicable).
Each EMA is plotted using plot() with a specific color, linewidth of 2, and plot.style_line for a clean visualization.
Use Case
Scalpers can identify short-term momentum changes.
Swing traders can detect medium-term trends.
Position traders can spot long-term market trends.
This strategy helps traders adjust their EMA settings dynamically without manually changing them for different timeframes.

Peak Reaction Zones [BigBeluga]Peak Reaction Zones is an advanced Smart Money Concept (SMC) indicator that identifies the most recent swing high and swing low zones, helping traders determine premium and discount areas for optimal trade positioning.
🔵 Key Features:
Swing High & Low Zones:
Automatically detects the latest swing high and swing low levels.
Helps traders identify key reaction points where price is likely to respond.
Premium & Discount Concept:
The high zone represents a premium area, where price is overextended and may reverse.
The low zone represents a discount area, where price is undervalued and may bounce.
The midline dynamically marks the equilibrium of the range.
Adjustable Zone Width:
Users can fine-tune the width of the zones to match their trading style.
Wider zones capture broader reaction ranges, while narrower zones focus on precise levels.
Zone Retest Signals:
Blue markers appear when price retests the lower reaction zone, signaling potential support.
Orange markers appear when price retests the upper reaction zone, indicating possible resistance.
Price Labels for Key Levels:
Displays the price value of the swing high, swing low, and midline for quick reference.
Helps traders recognize major reaction points at a glance.
🔵 Usage:
Smart Money Trading: Utilize the premium and discount concept to align trades with institutional order flow.
Zone Reactions: Watch for price tests of reaction zones and use the retest signals to confirm potential reversals.
Midline Confirmation: If price holds above or below the midline, it can indicate directional bias.
Scalping & Swing Trading: Short-term traders can look for zone rejections, while swing traders can use the levels for trend continuation setups.
Peak Reaction Zones is a must-have tool for traders looking to trade with Smart Money Concepts, allowing for precise entries and exits based on key liquidity areas and market structure.
