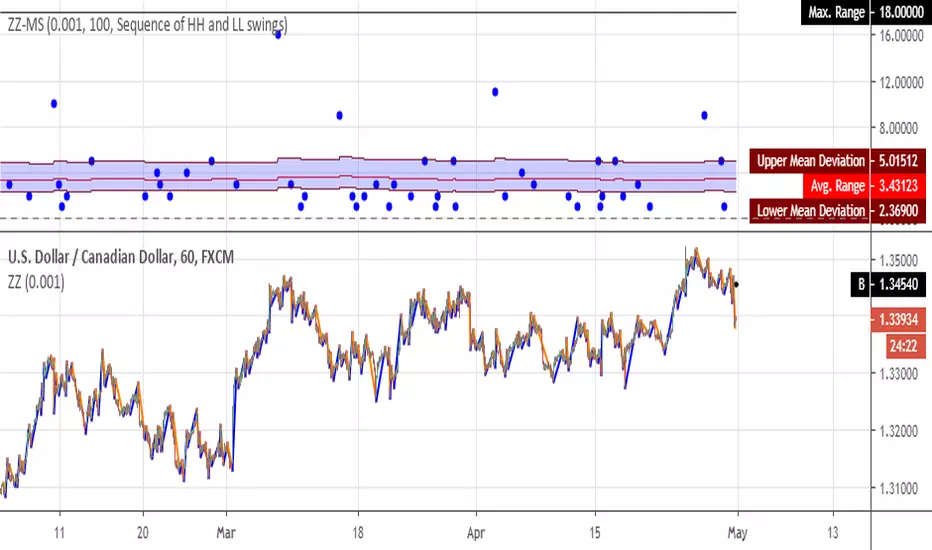
[RS]ZigZag Percent Reversal - Multiple StatisticsMultiple Statistics from zigzag:
• Price range between swings.
• Bar range between swings.
returns maximum value, avg value and mean deviation.
if you find something missing, please leave a message bellow.
Cari dalam skrip untuk "swing"
BTC Swinger v1Daily interval swing trading algorithm based on momentum techniques using ATR Stops. Made by Kory Hoang from Stably.
Shout out to the Advanced Crypto Asset Trading crew! ;)

Support & ResistanceThis indicator detects large swings/pivots in historical price action to highlight tops and bottoms which might act as future levels of support or resistance. The code by default detects the last 3 significant swing highs and the last 3 swing lows. It then places lines on the chart to highlight those levels.
For a full overview of the indicator and code commentary visit the backtest-rookies (.com) website.
Example

Gann Trend Oscillator Backtest The Gann Swing Oscillator has been adapted from Robert Krausz's book,
"A W.D. Gann Treasure Discovered". The Gann Swing Oscillator helps
define market swings.
You can change long to short in the Input Settings
Please, use it only for learning or paper trading. Do not for real trading.

Gann Trend Oscillator Strategy The Gann Swing Oscillator has been adapted from Robert Krausz's book,
"A W.D. Gann Treasure Discovered". The Gann Swing Oscillator helps
define market swings.

Structure Breakout - Buy Sell IndicatorStructure Breakout - Buy Sell Indicator
📈 OVERVIEW:
A minimalist indicator that identifies market structure breakouts using swing point analysis.
Displays clear blue buy arrows and red sell arrows when price breaks key swing levels.
🔧 HOW IT WORKS:
1. Identifies swing highs and lows using configurable lookback period
2. Triggers BUY signal (blue arrow) when price closes above previous swing high
3. Triggers SELL signal (red arrow) when price closes below previous swing low
4. Uses clean visual arrows without cluttering the chart
⚙️ KEY FEATURES:
• Clean, uncluttered visual signals
• Customizable sensitivity period
• Blue arrows for buy signals (below bars)
• Red arrows for sell signals (above bars)
• No lagging repainting
• Works on all timeframes
🎯 TRADING APPLICATIONS:
• Swing trading entries
• Breakout confirmation
• Trend continuation signals
• Support/resistance breaks
⚡ SETTINGS:
• Structure Detection Period (default: 20) - Adjust sensitivity of swing detection
⚠️ RISK DISCLAIMER:
This is an educational tool. Always use proper risk management.
Past performance does not guarantee future results.

FVG + Bollinger + Toggles + Swing H&L (Taken/Close modes)This indicator combines multiple advanced market-structure tools into one unified system.
It detects A–C Fair Value Gaps (FVG) and plots them as dynamic boxes projected a fixed number of bars forward.
Each bullish or bearish FVG updates in real time and “closes” once price breaks through the opposite boundary.
The indicator also includes Bollinger Bands based on EMA-50 with adjustable deviation settings for volatility context.
Swing Highs and Swing Lows are identified using pivot logic and are drawn as dynamic lines that change color once taken out.
You can choose whether swings end on a close break or on any touch/violation of the level.
All visual elements—FVGs, Bollinger Bands, and Swing Lines—can be individually toggled on or off from the settings panel.
A time-window session box is included, allowing you to highlight a custom intraday window based on your selected timezone.
The session box automatically tracks the high and low of the window and locks the final range once the window closes.
Overall, the tool is designed for traders who want a structured, multi-layered view of liquidity, volatility, and intraday timing.

VWAP TrendSignalVWAP TrendSignal
VWAP (Volume-Weighted Average Price) is the market’s true fair value — the benchmark institutions use to see when price is balanced, extended, or trending with real intent.
Price often snaps back when it moves too far (mean reversion), and only shows genuine strength when it holds above or below VWAP.
VWAP TrendSignal makes this insight effortless by color-coding VWAP direction:
Yellow = VWAP rising → bullish pressure
Red = VWAP falling → bearish pressure
No bands. No noise. Just pure directional clarity.
Anchor VWAP to the Session, Week, Month, Quarter, or Year, and tailor the Slope Smoothing Filter to your timeframe:
1–2 smoothing → fast & reactive (1–5m scalping)
3–5 smoothing → clean & stable (5–15m intraday)
6–10 smoothing → slow flips (1H–4H swings)
10–15 smoothing → macro bias only (Daily/Weekly)
The line adapts to how you trade.
How to Use It
Mean Reversion
When price stretches far from VWAP, expect pullbacks or snapbacks.
Trend Direction
Yellow supports long bias, red supports short bias.
Simple, reliable, instantly visible.
Balance Zones
Price sitting near VWAP = compression, buildup, or chop.
A perfect signal to wait or prepare for a breakout.
Why It Works
VWAP TrendSignal distills institutional logic into a clean, single-line tool.
It shows fair value, trend slope, and balance all at once — making your chart clearer and your decisions faster.
Once you get used to reading it, trading without it feels blind.

Luxy Sector & Industry RS AnalyzerEver wonder why some stocks soar while others in the same sector barely move? Or why your perfectly timed entry still loses money? Possibly the answer can be found in Relative Strength.
The Luxy Sector & Industry RS Analyzer solves a critical problem that most traders overlook: picking strong stocks in strong sectors AND strong industries . It's not enough for a stock to go up - you want stocks that are crushing their competition at both the sector AND industry level. This indicator does the heavy lifting by automatically comparing your stock against its sector ETF, industry ETF, the broader market, sector leader, and industry leader, giving you a complete multi-level picture of relative performance.
What makes this different?
- Automatic sector AND industry detection - no manual setup required
- Multi-level hierarchy analysis: Market → Sector → Industry → Stock
- Multi-timeframe analysis (1 month to 1 year) in one glance
- Industry ETF mapping (30+ industries covered)
- Clear 0-100 scoring system with letter grades (A+ to F)
- Works on stocks, crypto, forex, and commodities
- Real-time updates with anti-repaint protection
Think of it as your performance dashboard - instantly showing you if you're trading a champion or a laggard at every level of the market hierarchy.
METHODOLOGY & ATTRIBUTION
This indicator is based on classical Relative Strength (RS) analysis principles from technical analysis. RS methodology compares an asset's price performance against a benchmark to identify relative outperformance or underperformance. This concept has been used by professional traders and institutions for decades.
Key Concepts Used:
Relative Strength (RS) - Classical technical analysis concept measuring comparative performance
Multi-Level Hierarchy Analysis - Market → Sector → Industry → Stock comparison
Sector Rotation Analysis - Identifying which sectors are leading or lagging the market
Industry Rotation Analysis - Identifying which industries are leading within their sectors
Multi-period Performance Analysis - Evaluating strength across multiple timeframes
Beta Calculation - Standard statistical measure of volatility relative to a benchmark
DISCLAIMER: This indicator is for educational and informational purposes only. It should not be considered financial advice or a recommendation to buy or sell. Past performance does not guarantee future results. Trading involves risk and may not be suitable for all investors. Always do your own research and consult with a financial advisor before making investment decisions.
with all rows visible - capture when stock has strong RS score (70+) so users can see what a "good" setup looks like]
WHAT THE INDICATOR SHOWS
1. AUTOMATIC ASSET TYPE DETECTION
The indicator automatically identifies what you're analyzing and adjusts accordingly:
Stocks - Compares to sector ETF (XLK, XLF, XLV, etc.) and SPY
Crypto - Compares to Total Crypto Market Cap and Bitcoin
Forex - Compares to relevant currency index (DXY, EXY, etc.)
Commodities - Compares to Gold (GLD) as benchmark
Indices - Compares to broader market indices
How it works: The indicator reads your chart's asset type and ticker, then automatically maps it to the correct sector or benchmark. For stocks, it uses intelligent sector detection (looking at the sector field) to match you with the right sector ETF. For example:
- Technology stocks get compared to XLK (Technology Select Sector SPDR)
- Financial stocks get compared to XLF (Financial Select Sector SPDR)
- Healthcare stocks get compared to XLV (Health Care Select Sector SPDR)
This happens instantly when you add the indicator to any chart - no configuration needed.
2. SECTOR & MARKET BENCHMARKS
What is a Sector ETF?
A sector ETF is an exchange-traded fund that tracks a specific industry group. For example, XLK contains all major technology companies. By comparing your stock to its sector ETF, you can see if your stock is outperforming or underperforming its peers.
The indicator shows three key comparison points:
Stock vs Sector (Benchmark)
This tells you how your stock performs compared to companies in the same industry. Positive numbers mean your stock is beating the sector average. Negative numbers mean it's lagging behind.
Stock vs Market (SPY)
This shows performance against the broader S&P 500 index. This is important because even if a stock beats its sector, the entire sector might be weak. You want stocks that beat both their sector AND the market.
Sector vs Market
This reveals "sector rotation" - whether money is flowing into or out of this sector. When this number is positive, the whole sector is hot and leading the market. This is powerful because strong sectors tend to lift all boats, making it easier to find winners.
3. MULTI-PERIOD PERFORMANCE ANALYSIS
The indicator calculates performance across four timeframes simultaneously:
1 Month (1M) - Recent short-term momentum
3 Months (3M) - Medium-term trend strength
6 Months (6M) - Longer-term positioning
1 Year (1Y) - Full-cycle performance view
Why multiple periods matter:
A stock might look great over 1 month but terrible over 6 months - that's a red flag. The best stocks show consistent strength across all timeframes . When you see positive RS (Relative Strength) values across all four periods, you've found a stock with sustained outperformance.
Each row in the table shows:
- Raw performance percentage for that period
- RS value (the difference compared to benchmark)
- Color coding: Green for positive, red for negative, white for neutral
4. SECTOR LEADER COMPARISON
The indicator automatically identifies and compares your stock to the sector leader - the dominant stock in that industry.
Sector leaders by industry:
Technology: Apple (AAPL)
Healthcare: UnitedHealth (UNH)
Financial: JPMorgan Chase (JPM)
Energy: ExxonMobil (XOM)
Consumer Discretionary: Amazon (AMZN)
Consumer Staples: Walmart (WMT)
And more...
Why this matters:
Comparing to the leader shows you if you're trading a champion or a follower. If your stock consistently beats the sector leader, you've found something special. If it's lagging the leader, you might want to trade the leader instead.
Optional Custom Leader:
You can override the automatic leader and compare to any stock you choose. This is useful if you want to benchmark against a specific competitor or reference stock.
NEW! INDUSTRY ANALYSIS (STOCKS ONLY)
The indicator now provides multi-level analysis by automatically detecting and comparing your stock to its specific industry , not just the broad sector.
Why Industry matters:
Technology sector (XLK) contains many different industries: Software, Semiconductors, Hardware, etc. A software stock might beat the broad tech sector but lag behind other software companies. Industry analysis provides this granular view.
Industry ETF Mapping (30+ industries):
Software/Applications: IGV (iShares Software ETF)
Semiconductors: SMH (VanEck Semiconductor ETF)
Biotech: IBB (iShares Biotechnology ETF)
Pharmaceuticals: XPH (SPDR Pharmaceuticals ETF)
Banks: KBE (SPDR S&P Bank ETF)
Regional Banks: KRE (SPDR Regional Banking ETF)
Oil & Gas Exploration: XOP (SPDR Oil & Gas Exploration ETF)
Homebuilders: XHB (SPDR Homebuilders ETF)
Retail: XRT (SPDR S&P Retail ETF)
Aerospace & Defense: ITA (iShares U.S. Aerospace & Defense ETF)
And many more...
Industry Leader Mapping:
The indicator also identifies the leader within each industry:
Software: Microsoft (MSFT)
Semiconductors: NVIDIA (NVDA)
Biotech: Amgen (AMGN)
Pharmaceuticals: Eli Lilly (LLY)
Banks: JPMorgan (JPM)
Oil Exploration: ConocoPhillips (COP)
And more...
New Table Rows for Stocks:
Industry ETF Performance - How the specific industry performed (green background)
Industry Leader Performance - How the top stock in the industry performed
vs Industry RS - Your stock's outperformance vs its industry ETF
Industry vs Sector RS - Is this industry hot or cold within its sector?
vs Industry Leader RS - Your stock's performance vs the industry's best
Why this is powerful:
A stock that beats both its sector AND its industry is showing strength at every level. This indicates true relative strength, not just riding sector-wide momentum.
Optional Custom Industry:
You can override automatic detection for both Industry ETF and Industry Leader in settings.
5. RS SCORE & GRADING SYSTEM (0-100)
The heart of the indicator is the RS Score - a weighted calculation that distills all the performance data into one clear number from 0 to 100.
How the score is calculated:
FOR STOCKS (with Industry data):
The indicator splits the weight between Sector (60%) and Industry (40%):
SECTOR RS (60% of total weight):
1 Month RS: 24% weight (40% × 0.6)
3 Month RS: 18% weight (30% × 0.6)
6 Month RS: 12% weight (20% × 0.6)
1 Year RS: 6% weight (10% × 0.6)
INDUSTRY RS (40% of total weight):
1 Month RS: 16% weight (40% × 0.4)
3 Month RS: 12% weight (30% × 0.4)
6 Month RS: 8% weight (20% × 0.4)
1 Year RS: 4% weight (10% × 0.4)
FOR OTHER ASSETS (Crypto, Forex, Commodities):
Uses full 100% weight on benchmark:
1 Month RS: 40% weight
3 Month RS: 30% weight
6 Month RS: 20% weight
1 Year RS: 10% weight
It starts at 50 (neutral) and adds or subtracts points based on your asset's relative strength in each period.
Bonus points:
+5 points if the sector is outperforming the market (sector rotation is bullish)
+5 points if the industry is outperforming its sector (hot industry) - STOCKS ONLY
+5 points if RS momentum is improving (getting stronger over time)
-5 points if RS momentum is declining (getting weaker)
The final score is capped between 0-100.
Letter Grade System:
90-100: A+ - Elite performer, crushing the sector
85-89: A - Excellent, strong outperformer
80-84: A- - Very good, above average
75-79: B+ - Good, solid performer
70-74: B - Above average, decent strength
65-69: B- - Slightly above average
60-64: C+ - Average, neutral strength
55-59: C - Below average
50-54: C- - Weak, slight underperformance
45-49: D+ - Concerning weakness
40-44: D - Poor, significant underperformance
0-39: F - Failing, avoid this stock
What scores mean for trading:
- RS Score above 70: Strong stocks worth considering for long positions
- RS Score 50-70: Average stocks, better opportunities elsewhere
- RS Score below 50: Weak stocks, avoid or consider for shorts
6. CONSISTENCY SCORE
This metric shows what percentage of time periods show positive RS .
For STOCKS (with Industry data):
Counts both Sector RS periods AND Industry RS periods (up to 8 total periods):
- If a stock beats both sector and industry in all 4 periods each: Consistency = 100% (8/8)
- If it beats in 6 out of 8 total periods: Consistency = 75%
- If it beats in 4 out of 8 total periods: Consistency = 50%
For OTHER ASSETS:
Counts benchmark periods only (4 total):
- If it beats benchmark in all 4 periods (1M, 3M, 6M, 1Y): Consistency = 100%
- If it beats in 3 out of 4 periods: Consistency = 75%
- If it beats in 2 out of 4 periods: Consistency = 50%
Why consistency matters:
A high RS Score with low consistency might indicate a recent spike that could fade. The best stocks show both high RS Score AND high consistency - they're strong now AND have been strong historically at both the sector AND industry level.
Look for stocks with:
Consistency above 75%: Very reliable strength across all levels
Consistency 50-75%: Decent but check other metrics
Consistency below 50%: Weak or erratic, proceed with caution
7. BETA CALCULATION (Volatility Measure)
Beta measures how much more volatile your stock is compared to its sector.
Beta > 1.2 : High volatility - stock moves more aggressively than sector (marked as "High")
Beta 0.8-1.2 : Normal volatility - moves roughly in line with sector
Beta < 0.8 : Low volatility - stock is more stable than sector (marked as "Low")
Formula used:
Beta = Correlation(Stock, Sector) × (Standard Deviation of Stock / Standard Deviation of Sector)
This uses a 20-period calculation for reliability.
How to use Beta:
- High Beta stocks offer bigger gains but also bigger risks - good for aggressive traders
- Low Beta stocks are more defensive - good for conservative positions
- Match Beta to your risk tolerance and strategy
8. DAYS ABOVE/BELOW SECTOR
This tracks consecutive periods (bars) where your stock outperforms or underperforms its sector.
Days Above Sector:
Counts how many bars in a row your stock has beaten the sector.
10+ days: Strong sustained strength (shown in bright green)
5-9 days: Building momentum (shown in yellow)
1-4 days: Early strength (shown in white)
0 days: Not currently outperforming
Days Below Sector:
Counts how many bars in a row your stock has lagged the sector.
10+ days: Sustained weakness (shown in bright red)
5-9 days: Losing momentum (shown in orange)
1-4 days: Minor weakness (shown in white)
0 days: Not underperforming (this is good!)
Why this matters:
Long streaks show trend persistence. A stock with 15+ days above sector is riding strong momentum. A stock with 15+ days below sector is in a sustained downtrend relative to peers.
9. PRICE VS 52-WEEK HIGH
Shows where current price sits relative to its 52-week high (or equivalent for your timeframe).
95%+ (green) : Stock is near all-time highs - strong positioning
80-94% (yellow) : Stock is in a pullback but still relatively strong
Below 80% : Stock has pulled back significantly from highs
Why this matters:
The strongest stocks stay near their highs. When you see a stock with high RS Score AND price near 52W high, you've found a stock with institutional support and strong buying pressure.
10. RELATIVE VOLUME
Compares current volume to the 20-period average volume.
1.5x+ (green) : High volume - significant interest and participation
Around 1.0x : Average volume - normal trading activity
Below 1.0x : Low volume - less interest or inactive period
Why volume matters:
High relative volume confirms price moves. When a stock makes a strong move on 2x or 3x normal volume, it's more likely to sustain. Low volume moves are often just noise.
11. AVERAGE RS STRENGTH
This calculates the average absolute value of all RS readings across the four timeframes.
It shows the magnitude of divergence from the sector, regardless of direction. A high number means the stock moves very differently from its sector (could be much stronger or much weaker). A low number means it tracks closely with the sector.
High Average RS: Stock has strong character, moves independently
Low Average RS: Stock follows sector closely, lacks individual strength
12. SECTOR ROTATION SIGNAL
This indicator automatically detects when a sector is experiencing bullish rotation - meaning money is flowing into the sector and it's outperforming the broader market.
Condition for bullish rotation:
Sector must be beating SPY (market) in both 1-month AND 3-month periods.
Why this matters:
Stocks in hot sectors tend to perform better because they have tailwinds from sector-wide buying. When sector rotation is bullish and your stock has a high RS Score, you've found an ideal setup.
The indicator adds +5 bonus points to the RS Score when sector rotation is bullish.
13. MOMENTUM DETECTION
The indicator compares 1-month RS to 3-month RS to detect if momentum is improving or declining.
RS Momentum Improving: 1M RS is better than 3M RS - stock is getting stronger (adds +5 to score)
RS Momentum Declining: 1M RS is worse than 3M RS - stock is getting weaker (subtracts -5 from score)
Why momentum matters:
You want to catch stocks as momentum is building, not after it's already peaked. Improving momentum suggests the strength is accelerating, not fading.
14. OVERALL ASSESSMENT & RECOMMENDATION
The indicator provides two quick summary rows:
Overall Rating:
Based on grade and RS Score, you get an instant quality rating:
Strong Leader (A/A+) - Top tier stock, crushing it
Above Average (A-/B+) - Solid performer, better than most
Average (B/B-) - Middle of the pack
Below Average (C/C+) - Struggling, watch carefully
Underperformer (D/F) - Weak stock, underperforming badly
Trading Signal:
Combines multiple factors to give setup quality:
STRONG BUY SETUP - RS Score 70+, Consistency 75+, AND sector rotation bullish. This is the perfect storm - strong stock, consistent strength, hot sector.
BULLISH - RS Score 60+, Consistency 50+. Good quality stock worth considering.
NEUTRAL - RS Score 50+. Okay but not exciting, better opportunities exist.
WEAK - RS Score 40-49. Below average, risky.
AVOID - RS Score below 40. Stay away, too weak.
IMPORTANT: These are educational signals only, not financial advice. Always do your own analysis and risk management.
KEY FEATURES
1. AUTOMATIC EVERYTHING
- Auto-detects asset type (stock, crypto, forex, commodity, index)
- Auto-maps stocks to correct sector ETF (11 sectors covered)
- Auto-maps stocks to correct industry ETF (30+ industries covered)
- Auto-identifies sector leader AND industry leader
- Auto-selects appropriate market benchmark
- Zero configuration required - just add to chart
2. MULTI-ASSET SUPPORT
Works on all asset classes:
US Stocks - Compares to sector ETFs (XLK, XLF, XLV, etc.)
Crypto - Compares to Total Crypto Market Cap
Forex - Compares to currency indices (DXY, EXY, etc.)
Commodities - Compares to Gold (GLD)
Indices - Compares to broader market benchmarks
3. FLEXIBLE DISPLAY
9 table positions (top/middle/bottom, left/center/right)
4 size options (tiny, small, normal, large)
Show/hide table completely
Real-time indicator toggle
4. TIMEFRAME FLEXIBILITY
Choose your analysis timeframe:
Chart Timeframe (default) - Uses whatever timeframe your chart is on
Fixed: 1 Hour, 4 Hours, Daily, Weekly - Forces calculations to specific timeframe
This means you can be on a 5-minute chart but analyze RS on Daily timeframe if you prefer.
5. RS SCORE FILTERING
Set a minimum RS Score threshold to only see strong stocks:
Set to 0 - Shows all stocks
Set to 70 - Only displays stocks with RS Score 70+ (strong stocks only)
Warning message displays if stock doesn't meet threshold
Perfect for screening - quickly scan multiple charts and the indicator only shows tables for stocks that pass your quality filter.
6. CUSTOM LEADER COMPARISON
Override automatic leader detection:
Compare to any ticker you choose
Benchmark against specific competitors
Use your own reference stocks
7. COMPREHENSIVE TOOLTIPS
Every input parameter and every table row has detailed tooltips explaining:
What the metric measures
How to interpret the values
What thresholds indicate strength/weakness
Why it matters for trading
Hover over any element to learn - it's like having a trading coach built in.
8. SMART ALERTS
Built-in alert system for key events:
Divergence Alerts:
Get notified when your stock diverges significantly from its sector.
Bullish Divergence: Stock beating sector by threshold percentage
Bearish Divergence: Stock losing to sector by threshold percentage
Set your threshold (default 5%) - this determines how big a divergence triggers the alert.
RS Score Alerts:
Get notified when RS Score crosses your threshold:
Crossed Above: RS Score went from below to above your threshold (bullish)
Crossed Below: RS Score dropped from above to below threshold (bearish)
Set your threshold (default 70) to focus on strong stocks.
Sector Rotation Alert:
Fires when sector shows bullish rotation (outperforming market).
HOW TO USE THE INDICATOR
FOR SWING TRADERS:
1. Add indicator to your watchlist stocks
2. Look for RS Score 70+ with Consistency 75%+
3. Check if sector rotation is bullish (bonus!)
4. Verify price is near 52W high (95%+)
5. Wait for entry setup on your chart
6. Use stop loss below key support
Example Setup:
Stock shows:
- RS Score: 82 (Grade: A-)
- Consistency: 100% (strong across all periods)
- Sector Rotation: Bullish
- Price vs 52W High: 96%
- Days Above Sector: 12 days
- Relative Volume: 1.8x
This is a textbook strong stock in a hot sector near highs - ideal for swing long.
FOR POSITION TRADERS:
1. Focus on 6-month and 1-year RS values
2. Look for sustained outperformance (Consistency 75%+)
3. Prefer lower Beta stocks (less volatility)
4. Check Days Above Sector for trend persistence
5. Monitor RS Score monthly, exit if drops below 60
FOR ACTIVE TRADERS:
1. Use on intraday timeframes (1H or 4H)
2. Set RS Score filter to 60+ for quick screening
3. Enable Divergence Alerts
4. Watch for momentum improving signal
5. Higher Beta stocks offer more movement
FOR SHORT SELLERS:
1. Look for RS Score below 40 (Grade: D or F)
2. Check for declining momentum
3. Verify Days Below Sector is increasing (10+)
4. Sector rotation should be bearish
5. Price should be well off 52W high
WHAT MAKES A PERFECT SETUP:
The holy grail combination:
RS Score: 75+ (A- or better)
Consistency: 80%+ (strong across time - beats sector AND industry)
Sector Rotation: Bullish (hot sector)
Industry vs Sector: Positive (hot industry within sector)
Days Above Sector: 10+ (sustained strength)
Momentum: Improving (getting stronger)
Price vs 52W High: 90%+ (near highs)
Relative Volume: 1.5x+ (volume confirmation)
When you find this combination, you've located a stock with every advantage in its favor - strong at the stock level, industry level, AND sector level. That's multi-level confirmation of relative strength.
IMPORTANT NOTES
Data Reliability:
All calculations use lookahead=off for anti-repaint protection
Historical values will never change
Real-time indicator toggle only affects the visual clock icon, not data reliability
All security requests are properly configured to prevent future data leakage
Sector Mapping Notes:
Sector detection uses TradingView's sector field
Some stocks may not have sector data - indicator will adapt
Sector ETFs used: XLK, XLF, XLV, XLE, XLY, XLP, XLI, XLB, XLRE, XLU, XLC
Major market ETFs (SPY, QQQ, DIA) are treated as market benchmarks, not stocks
Multi-Asset Notes:
Crypto compares to CRYPTOCAP:TOTAL (total crypto market cap)
Forex compares to relevant currency index based on base currency
Commodities compare to Gold (GLD) as primary commodity benchmark
Custom leaders can be set for any asset type
FREQUENTLY ASKED QUESTIONS
Q: What does RS Score of 75 actually mean?
A: It means your stock is strongly outperforming its sector across multiple timeframes. The score is weighted toward recent performance (1-month gets 40% weight), so 75 indicates sustained relative strength with emphasis on current momentum.
Q: My stock has high RS Score but is going down. Why?
A: RS Score measures relative performance (vs sector/market), not absolute price direction. A stock can fall 5% while its sector falls 10% - that's still positive relative strength. In bear markets or sector corrections, high RS stocks often fall less than peers.
Q: Should I only trade stocks with RS Score above 70?
A: For long positions, yes - focus on 70+ scores. These stocks have proven they can beat their sector. However, for pairs trading or relative value plays, you might also short stocks with scores below 40 while longing stocks above 70.
Q: What if my stock doesn't have a sector?
A: The indicator handles this gracefully. If no sector is detected, it will compare directly to the market (SPY for stocks). Some rows may show N/A, but the indicator will still provide useful market-relative data.
Q: Why does the sector sometimes show N/A?
A: This happens when: 1) Your asset has no sector classification, 2) The stock IS the sector ETF itself, 3) You're analyzing a non-stock asset (crypto, forex, commodity). The indicator adapts by focusing on market-relative metrics instead.
Q: Can I use this on cryptocurrencies?
A: Yes! The indicator automatically detects crypto and compares to the Total Crypto Market Cap (CRYPTOCAP:TOTAL). You can also set a custom leader like Bitcoin (BTCUSD) to compare against the dominant crypto.
Q: What's the difference between RS Score and Consistency?
A: RS Score is the weighted average of how much you're beating the sector (magnitude). Consistency is what percentage of time periods show outperformance (reliability). You want both high - that means strong AND consistent.
Q: Do the alerts repaint?
A: No. All alerts fire only on bar close (barstate.isconfirmed) and use properly configured data with lookahead=off. Once an alert fires, it's final and won't change.
Q: What timeframe should I use?
A: For swing trading: Daily or Weekly. For day trading: 1H or 4H. For position trading: Weekly. Use "Chart Timeframe" mode and switch your chart timeframe to change the analysis period easily.
Q: Why is Days Above Sector showing 0?
A: This means your stock is not currently outperforming its sector. If Days Below Sector is also 0, it means the RS is exactly neutral (very rare). Check the actual RS values to see current standing.
Q: Can I compare to a different market benchmark than SPY?
A: Currently the indicator uses SPY (S&P 500) as the default US stock market benchmark. For crypto it uses CRYPTOCAP:TOTAL, for forex it uses currency indices, etc. The benchmark auto-adjusts based on asset type.
Q: What's a good Beta value?
A: It depends on your strategy. Aggressive traders prefer Beta above 1.2 (more volatility = bigger moves). Conservative traders prefer Beta 0.8-1.0 (more stable). Beta is neutral - it's about matching your risk tolerance.
Q: How often does the table update?
A: With Real-time Indicator enabled: Every tick (constant updates). With it disabled: Only on bar close. Either way, the underlying data is identical and non-repainting - the toggle only affects update frequency and the clock icon display.
Q: My stock is showing "AVOID" but it's up 50% this year. Is the indicator wrong?
A: Not necessarily. The indicator measures RELATIVE performance. If your stock is up 50% but the sector is up 100%, your stock is actually underperforming by 50%. The indicator helps you identify when you should switch to stronger stocks in the same sector.
Q: What does "Strong Buy Setup" really mean?
A: It means three things aligned: 1) RS Score above 70 (strong stock), 2) Consistency above 75% (reliable strength), 3) Sector rotation is bullish (hot sector). This combination historically correlates with stocks that continue outperforming. However, this is NOT financial advice - always do your own analysis.
Q: Can I use this for options trading?
A: Yes! High RS Score stocks make good candidates for call options (bullish bets) while low RS Score stocks may work for puts (bearish bets). Higher Beta stocks will have more volatile options (higher premiums but more movement).
Q: Why is my crypto showing N/A for sector?
A: Cryptocurrencies don't have "sectors" like stocks do. Instead, the indicator compares crypto to the total crypto market cap. This is normal and expected behavior.
Q: What happens if I'm analyzing an ETF?
A: If you're analyzing a sector ETF (like XLK), it will compare to SPY (market). If you're analyzing SPY itself, some comparisons won't be available (can't compare SPY to itself). The indicator intelligently adapts to avoid circular comparisons.
Q: What if my stock doesn't have industry data?
A: Not all stocks are mapped to specific industries (only 30+ major industries are covered). If no industry is detected, the indicator will still work using only sector analysis. The RS Score calculation will use 100% sector weight instead of the 60%/40% split.
Q: Why does Industry vs Sector matter?
A: Industry vs Sector shows if your specific industry is hot or cold within its broader sector. For example, Semiconductors (SMH) might be outperforming Technology sector (XLK) even though both are up. This helps you find not just strong sectors, but the strongest industries within those sectors.
Q: Can I disable Industry analysis?
A: Yes! In the "Industry Analysis" settings group, you can toggle off "Show Industry Analysis in Table" to hide all industry rows. However, even when hidden, industry data still contributes to the RS Score calculation for stocks.
Q: Why is my Consistency Score lower for stocks than other assets?
A: For stocks with industry data, Consistency counts 8 periods (4 Sector + 4 Industry periods) instead of just 4. This means the bar is higher - your stock needs to beat both sector AND industry consistently. A stock that beats sector in all 4 periods but lags industry in 2 periods will show 75% consistency (6/8), not 100%.
BEST PRACTICES
Use as a screening tool - Set RS Score filter to 70+ and quickly scan your watchlist. Only strong stocks will show the table.
Combine with technical analysis - RS Score tells you WHAT to trade, your chart tells you WHEN to enter.
Check multiple timeframes - Switch between Daily and Weekly to see if strength holds across different time horizons.
Monitor sector rotation - When sector goes from bearish to bullish rotation, it's often a great time to enter stocks in that sector.
Watch Industry vs Sector - Stocks in hot industries within hot sectors have double tailwinds. Prioritize Industry vs Sector positive values.
Pay attention to consistency - High RS Score with low consistency might be a spike that fades. Look for 70%+ consistency across BOTH sector and industry.
Use the leader comparison - If your stock consistently beats both sector leader AND industry leader, you may have found the next champion.
Watch days above/below sector - Long streaks (15+ days) indicate strong trends. Look for these in conjunction with high RS Score.
Set alerts on key stocks - Enable RS Score alerts at 70 threshold to get notified when watchlist stocks become strong.
Consider Beta for position sizing - Size smaller positions in high Beta stocks, larger in low Beta stocks for balanced risk.
Exit when RS Score drops - If a stock's RS Score falls below 60, consider reducing or exiting - the strength may be fading.
Leverage industry-level insight - If Industry ETF is weak but stock is strong, that's standout strength. If Industry is hot but stock is lagging, consider switching to the industry leader instead.
SETTINGS EXPLAINED
Display Settings:
Show Performance Table - Master on/off switch for the table
Table Position - 9 positions available (corners, edges, center)
Table Size - 4 sizes (tiny, small, normal, large) for different screen sizes
Timeframe Settings:
Chart Timeframe (recommended) - Dynamic, uses whatever chart TF you're on
Fixed Timeframes - Locks analysis to 1H, 4H, Daily, or Weekly regardless of chart
Filtering Settings:
Minimum RS Score - Set threshold (0-100) for displaying table
Show Warning - When enabled, displays message if stock doesn't meet filter
Alert Settings:
Divergence Alerts - Enable alerts when stock diverges from sector
Threshold (%) - How big a divergence triggers alert (default 5%)
RS Score Alerts - Enable alerts when RS Score crosses threshold
Threshold - What RS Score level triggers alert (default 70)
Sector Analysis Settings:
Use Custom Sector ETF - Override automatic sector ETF detection
Sector ETF Symbol - Enter any sector ETF to compare against
Use Custom Sector Leader - Override automatic sector leader detection
Sector Leader Symbol - Enter any ticker as sector leader
Industry Analysis Settings:
Use Custom Industry ETF - Override automatic industry ETF detection
Industry ETF Symbol - Enter specific industry ETF (e.g., IGV, SMH)
Use Custom Industry Leader - Override automatic industry leader detection
Industry Leader Symbol - Enter specific industry leader
Show Industry Analysis - Toggle all industry rows on/off
Display Settings:
Show Real-time Indicator - Toggle clock icon in header (doesn't affect data)
WHAT THIS INDICATOR DOESN'T DO
To set proper expectations:
Does NOT provide entry/exit signals - this is a strength analyzer, not a trading system
Does NOT predict future price movement - shows current and historical relative strength
Does NOT guarantee profits - strong RS stocks can still decline
Does NOT replace your own analysis - use as one tool among many
Does NOT work on stocks with no sector data - will adapt but some rows show N/A
This indicator is a decision support tool . It helps you identify which stocks are showing relative strength so you can make more informed trading decisions. You still need your own entry strategy, risk management, and position sizing rules.
SUPPORT & CONTACT
Questions or feedback? Use the comments section below or send me a message.
If you find this indicator useful, please give it a boost and share with other traders who might benefit from relative strength analysis.
FINAL REMINDER
This indicator is a tool for analyzing relative strength - it shows you which stocks are outperforming their sector and market. It does NOT provide financial advice or trade signals. Always conduct your own research, manage your risk appropriately, and consult with a financial advisor before making investment decisions.
Past performance of relative strength does not guarantee future results. Strong stocks can become weak, and sectors rotate in and out of favor. Use this indicator as part of a comprehensive trading strategy, not as a standalone decision-making system.
Trade smart, manage risk, and may your RS Scores stay high!
If you got till here and you like my work a BOOST and a COMMENT would make me happy

Previous and Penultimate Swings (Single Timeframe • 4 lines)Using chat GPT I've created a swing high and swing low horizontal indicator that helps me personally visualize significant levels.
In particular penultimate swing highs and penultimate swing lows. Hopefully this can help another trader or many! You can add or remove any of the 4 levels. Adjust the lookback period. And extend each line individually to the right of price action.

Premium/Discount Zones with Confirmation Signals📌 Indicator Description: Premium/Discount Zones with Confirmed Signals
This indicator identifies dynamic Premium, Discount, and Equilibrium zones based on recent swing highs and lows, helping traders visualize where price is considered expensive, cheap, or fair value. It’s designed for Smart Money Concepts (SMC), ICT-style trading, and anyone who values precision in zone-based analysis.
🔍 Key Features
Swing-Based Zones: Automatically detects swing highs/lows over a customizable lookback period (default: 48 bars — equivalent to 2 days on a 1-hour chart).
Premium & Discount Levels: Define overbought and oversold zones using percentage inputs (default: 25%).
Equilibrium Band (middle): Highlights the no-trade value zone with adjustable width (default: 5%).
Signal Engine: Generates trade signals based on two styles:
Bounce: Reversal signals when price reacts to a zone and confirms direction.
Breakout: Continuation signals when price breaks through a zone with momentum.
Trade Type Selector: Choose between Bounce, Breakout, or Both from the input menu.
Signal Filtering: Limits signals to one per direction at a time to reduce noise.
Visual Styling: Toggle between colored or monochrome themes for clean charting.
🧠 How It Works
Buy signals appear when price confirms strength from the discount zone or breaks above the premium zone.
Sell signals appear when price confirms weakness from the premium zone or breaks below the discount zone.
All signals include a built-in 3-bar confirmation delay to reduce false triggers.
🎯 Ideal For
Traders using SMC, ICT, or price action strategies
Zone-based scalping, swing trading, or intraday setups
Visualizing market structure and value areas with clarity
I hope you find this useful — and wish you Happy Trades!

Universal Breakout Strategy [KedArc Quant]Description:
A flexible breakout framework where you can test different logics (Prev Day, Bollinger, Volume, ATR, EMA Trend, RSI Confirm, Candle Confirm, Time Filter) under one system.
Choose your breakout mode, and the strategy will handle entries, exits, and optional risk management (ATR stops, take-profits, daily loss guard, cooldowns).
An on-chart info table shows live mode values (like Prev High/Low, Bollinger levels, RSI, etc.) plus P&L stats for quick analysis.
Use it to compare which breakout style works best on your instrument and timeframe, whether intraday, swing, or positional trading
🔑 Why it’s useful
* Flexibility: Switch between breakout strategies without loading different indicators.
* Clarity: On-chart info table displays current mode, relevant indicator levels, and live strategy P&L stats.
* Testing efficiency: Quickly A/B test different breakout styles under the same backtest environment.
* Transparency: Every trade is rule-based and displayed with entry/exit markers.
🚀 How it helps traders
* Lets you experiment with breakout strategies quickly without loading multiple scripts.
* Helps identify which breakout method fits your instrument & timeframe.
* Gives clear on-chart visual + statistical feedback for confident decision-making.
⚙️ Input Configuration
* Breakout Mode → choose which strategy to test:
* *Prev Day* → breakouts of yesterday’s High/Low.
* *Bollinger* → Upper/Lower BB pierce.
* *Volume* → Breakout confirmed with volume above average.
* *ATR Stop* → Wide range breakout using ATR filter.
* *Time Filter* → Breakouts inside defined session hours.
* *EMA Trend* → Breakouts only in EMA fast > slow alignment.
* *RSI Confirm* → Breakouts with RSI confirmation (e.g. >55 for longs).
* *Candle Confirm* → Breakouts validated by bullish/bearish candle.
* Lookback / ATR / Bollinger inputs → adjust sensitivity.
* Intrabar mode → option to evaluate breakouts using bar highs/lows instead of closes.
* Table options → show/hide info table, show/hide P&L stats, choose corner placement.
📈 Entry & Exit Logic
* Entry → occurs when breakout condition of chosen mode is met.
* Exit → default exits via opposite signals or optional stop/target if enabled.
* Session filter → optional auto-flat at session end.
* P&L management → optional daily loss guard, cooldown between trades, and ATR-based stop/take profit.
❓ FAQ — Choosing the best setup
Q: Which strategy should I use for which chart?
* *Prev Day Breakouts*: Best on indices, FX, and liquid futures with strong daily levels.
* *Bollinger*: Works well in range-bound environments, or crypto pairs with volatility compression.
* *Volume*: Good on equities where breakout strength is tied to volume spikes.
* *ATR Stop*: Suits volatile instruments (commodities, crypto).
* *EMA Trend*: Useful in trending markets (stocks, indices).
* *RSI Confirm*: Adds momentum filter, better for swing trades.
* *Candle Confirm*: Ideal for scalpers needing visual confirmation.
* *Time Filter*: For intraday traders who want signals only in high-liquidity sessions.
Q: What timeframe should I use?
* Intraday traders → 5m to 15m (Time Filter, Candle Confirm).
* Swing traders → 1H to 4H (EMA Trend, RSI Confirm, ATR Stop).
* Position traders → Daily (Prev Day, Bollinger).
* Breakout
A trade entry condition triggered when price crosses above a resistance level (for longs) or below a support level (for shorts).
* Prev Day High/Low
Formula:
Prev High = High of (Day )
Prev Low = Low of (Day )
* Bollinger Bands
Formula:
Basis = SMA(Close, Length)
Upper Band = Basis + (Multiplier × StdDev(Close, Length))
Lower Band = Basis – (Multiplier × StdDev(Close, Length))
* Volume Confirmation
A breakout is only valid if:
Volume > SMA(Volume, Length)
* ATR (Average True Range)
Measures volatility.
Formula:
ATR = SMA(True Range, Length)
where True Range = max(High–Low, |High–Close |, |Low–Close |)
* EMA (Exponential Moving Average)
Weighted moving average giving more weight to recent prices.
Formula:
EMA = (Price × α) + (EMA × (1–α))
with α = 2 / (Length + 1)
* RSI (Relative Strength Index)
Momentum oscillator scaled 0–100.
Formula:
RSI = 100 – (100 / (1 + RS))
where RS = Avg(Gain, Length) ÷ Avg(Loss, Length)
* Candle Confirmation
Bullish candle: Close > Open AND Close > Close
Bearish candle: Close < Open AND Close < Close
Win Rate (%)
Formula:
Win Rate = (Winning Trades ÷ Total Trades) × 100
* Average Trade P&L
Formula:
Avg Trade = Net Profit ÷ Total Trades
📊 Performance Notes
The Universal Breakout Strategy is designed as a framework rather than a single-asset optimized system. Results will vary depending on the chart, timeframe, and asset chosen.
On the current defaults (15-minute, INR-denominated example), the backtest produced 132 trades over the selected period. This provides a statistically sufficient sample size.
Win rate (~35%) is relatively low, but this is balanced by a positive reward-to-risk ratio (~1.8). In practice, a lower win rate with larger wins versus smaller losses is sustainable.
The average P&L per trade is close to breakeven under default settings. This is expected, as the strategy is not tuned for a single symbol but offered as a universal breakout framework.
Commissions (0.1%) and slippage (1 tick) are included in the simulation, ensuring realistic conditions.
Risk management is conservative, with order sizing set at 1 unit per trade. This avoids over-leveraging and keeps exposure well under the 5-10% equity risk guideline.
👉 Traders are encouraged to:
Experiment with inputs such as ATR period, breakout length, or Bollinger parameters.
Test across different timeframes and instruments (equities, futures, forex, crypto) to find optimal setups.
Combine with filters (trend direction, volatility regimes, or volume conditions) for further refinement.
⚠️ Disclaimer This script is provided for educational purposes only.
Past performance does not guarantee future results.
Trading involves risk, and users should exercise caution and use proper risk management when applying this strategy.

Smart Money Support/Resistance - LiteSmart Money Support/Resistance — Lite
Overview & Methodology
This indicator identifies support and resistance as zones derived from concentrated buying and selling pressure, rather than relying solely on traditional swing highs/lows. Its design focuses on transparency: how data is sourced, how zones are computed, and how the on‑chart display should be interpreted.
Lower‑Timeframe (LTF) Data
The script requests Up Volume, Down Volume, and Volume Delta from a lower timeframe to expose intrabar order‑flow structure that the chart’s native timeframe cannot show. In practical terms, this lets you see where buyers or sellers briefly dominated inside the body of a higher‑timeframe bar.
bool use_custom_tf_input = input.bool(true, title="Use custom lower timeframe", tooltip="Override the automatically chosen lower timeframe for volume calculations.", group=grpVolume)
string custom_tf_input = input. Timeframe("1", title="Lower timeframe", tooltip="Lower timeframe used for up/down volume calculations (default 5 seconds).", group=grpVolume)
import TradingView/ta/10 as tvta
resolve_lower_tf(useCustom, customTF) =>
useCustom ? customTF :
timeframe.isseconds ? "1S" :
timeframe.isintraday ? "1" :
timeframe.isdaily ? "5" : "60"
get_up_down_volume(lowerTf) =>
= tvta.requestUpAndDownVolume(lowerTf)
var float upVolume = na
var float downVolume = na
var float deltaVolume = na
string lower_tf = resolve_lower_tf(use_custom_tf_input, custom_tf_input)
= get_up_down_volume(lower_tf)
upVolume := u_tmp
downVolume := d_tmp
deltaVolume := dl_tmp
• Data source: TradingView’s ta.requestUpAndDownVolume(lowerTf) via the official TA library.
• Plan capabilities: higher‑tier subscriptions unlock seconds‑based charts and allow more historical bars per chart. This expands both the temporal depth of LTF data and the precision of short‑horizon analysis, while base tiers provide minute‑level data suitable for day/short‑swing studies.
• Coverage clarity: a small on‑chart Coverage Panel reports the active lower timeframe, the number of bars covered, and the latest computed support/resistance ranges so you always know the bounds of valid LTF input.
Core Method
1) Data acquisition (LTF)
The script retrieves three series from the chosen lower timeframe:
– Up Volume (buyers)
– Down Volume (sellers)
– Delta (Up – Down)
2) Rolling window & extrema
Over a user‑defined lookback (Global Volume Period), the algorithm builds rolling arrays of completed bars and scans for extrema:
– Buyers_max / Buyers_min from Up Volume
– Sellers_max / Sellers_min from Down Volume
Only completed bars are considered; the current bar is excluded for stability.
3) Price mapping
The extrema are mapped back to their source candles to obtain price bounds:
– For “maximum” roles the algorithm uses the relevant candle highs.
– For “minimum” roles it uses the relevant candle lows.
These pairs define candidate resistance (max‑based) and support (min‑based) zones or vice versa.
4) Zone construction & minimum width
To ensure practicality on all symbols, zones enforce a minimum vertical thickness of two ticks. This prevents visually invisible or overly thin ranges on instruments with tight ticks.
5) Vertical role resolution
When both max‑ and min‑based zones exist, the script compares their midpoints. If, due to local price structure, the min‑based zone sits above the max‑based zone, display roles are swapped so the higher zone is labeled Resistance and the lower zone Support. Colors/widths are updated accordingly to keep the visual legend consistent.
6) Rendering & panel
Two horizontal lines and a filled box represent each active zone. The Coverage Panel (bottom‑right by default) prints:
– Lower‑timeframe in use
– Number of bars covered by LTF data
– Current Support and Resistance ranges
If the two zones overlap, an additional “Range Market” note is shown.
Key Inputs
• Global Volume Period: shared lookback window for the extrema search.
• Lower timeframe: user‑selectable override of the automatically resolved lower timeframe.
• Visualization toggles: independent show/hide controls and colors for maximum (resistance) and minimum (support) zones.
• Coverage Panel: enable/disable the single‑cell table and its readout.
Operational Notes
• The algorithm aligns all lookups to completed bars (no peeking). Price references are shifted appropriately to avoid using the still‑forming bar in calculations.
• Second‑based lower timeframes improve granularity for scalping and very short‑term entries. Minute‑based lower timeframes provide broader coverage for intraday and short‑swing contexts.
• Use the Coverage Panel to confirm the true extent of available LTF history on your symbol/plan before drawing conclusions from very deep lookbacks.
Visual Walkthrough
A step‑by‑step image sequence accompanies this description. Each figure demonstrates how the indicator reads LTF volume, locates extrema, builds price‑mapped zones, and updates labels/colors when vertical order requires it.
Chart Interpretation
This chart illustrates two distinct perspectives of the Smart Money Support/Resistance — Lite indicator, each derived from different lookback horizons and lower-timeframe (LTF) resolutions.
1- Short-term view (43 bars, 10-second LTF)
Using the most recent 43 completed bars with 10-second intrabar data, the algorithm detects that both maximum and minimum volume extrema fall within a narrow range. The result is a clearly identified range market: resistance between 178.15–184.55 and support between 175.02–179.38.
The Coverage Panel (bottom-right) confirms the scope of valid input: the lower timeframe used, number of bars covered, and the resulting zones. This short-term scan highlights how the indicator adapts to limited data depth, flagging sideways structure where neither side dominates.
2 - Long-term view (120 bars, 30-second LTF)
Over a wider 120-bar lookback with higher-granularity 30-second data, broader supply and demand zones emerge.
– The long-term resistance zone captures the concentration of buyers and sellers at the upper boundary of recent price history.
– The long-term support zone anchors to the opposite side of the distribution, derived from maxima and minima of both buying and selling pressure.
These zones reflect deeper structural levels where market participants previously committed significant volume.
Combined Perspective
By aligning the short-term and long-term outputs, the chart shows how the indicator distinguishes immediate consolidation (range market) from more durable support and resistance levels derived from extended history. This dual resolution approach makes clear that support and resistance are not static lines but dynamic zones, dependent on both timeframe depth and the resolution of intrabar volume data.

Multipower Entry SecretMultipower Entry Secret indicator is designed to be the ultimate trading companion for traders of all skill levels—especially those who struggle with decision-making due to unclear or overwhelming signals. Unlike conventional trading systems cluttered with too many lines and confusing alerts, this indicator provides a clear, adaptive, and actionable guide for market entries and exits.
Key Points:
Clear Buy/Sell/Wait Signals:
The script dynamically analyzes price action, candle patterns, volume, trend strength, and higher time frame context. This means it gives you “Buy,” “Sell,” or “Wait” signals based on real, meaningful market information—filtering out the noise and weak trades.
Multi-Timeframe Adaptive Analysis:
It synchronizes signals between higher and current timeframes, ensuring you get the most reliable direction—reducing the risk of getting caught in fake moves or sudden reversals.
Automatic Support, Resistance & Liquidity Zones:
Key levels like support, resistance, and liquidity zones are auto-detected and displayed directly on the chart, helping you make precise decisions without manual drawing.
Real-Time Dashboard:
All relevant information, such as trend strength, market intent, volume sentiment, and the reason behind each signal, is neatly summarized in a dashboard—making monitoring effortless and intuitive.
Customizable & Beginner-Friendly:
Whether you’re a newcomer wanting straightforward guidance or a professional needing advanced customization, the indicator offers flexible options to adjust analysis depth, timeframes, sensitivity, and more.
Visual & Clutter-Free:
The design ensures that your chart remains clean and readable, showing only the most important information. This minimizes mental overload and allows for instant decision-making.
Who Will Benefit?
Beginners who want to learn trading logic, avoid common traps, and see the exact reason behind every signal.
Advanced traders who require adaptive multi-timeframe analytics, fast execution, and stress-free monitoring.
Anyone who wants to save screen time, reduce analysis paralysis, and have more confidence in every trade they take.
1. No Indicator Clutter
Intent:
Many traders get confused by charts filled with too many indicators and signals. This often leads to hesitation, missed trades, or taking random, risky trades.
In this Indicator:
You get a clean and clutter-free chart. Only the most important buy/sell/wait signals and relevant support/resistance/liquidity levels are shown. These update automatically, removing the “overload” and keeping your focus sharp, so your decision-making is faster and stress-free.
2. Exact Entry Guide
Intent:
Traders often struggle with entry timing, leading to FOMO (fear of missing out) or getting trapped in sudden market reversals.
In this Indicator:
The system uses powerful adaptive logic to filter out weak signals and only highlight the strongest market moves. This not only prevents you from entering late or on noise, but also helps avoid losses from false breakouts or whipsaws. You get actionable suggestions—when to enter, when to hold back—so your entries are high-conviction and disciplined.
3. HTF+LTF Logic: Multitimeframe Sync Analysis
Intent:
Most losing trades happen when you act only on the short-term chart, ignoring the bigger market trend.
In this Indicator:
Signals are based on both the current chart timeframe (LTF) and a higher (HTF, like hourly/daily) timeframe. The indicator synchronizes trend direction, momentum, and structure across both levels, quickly adapting to show you when both are aligned. This filtering results in “only trade with the bigger trend”—dramatically increasing your win rate and market confidence.
4. Auto Support/Resistance & Liquidity Zones
Intent:
Drawing support/resistance and liquidity zones manually is time-consuming and error-prone, especially for beginners.
In this Indicator:
The system automatically identifies and plots the most crucial support/resistance levels and liquidity zones on your chart. This is based on adaptive, real-time price and volume analysis. These zones highlight where major institutional activity, trap setups, or real breakouts/reversals are most likely, removing guesswork and giving you a clear reference for entries, exits, and stop placements.
5. Clear Action/Direction
Intent:
Traders need certainty—what does the market want right now? Most indicators are vague.
In this Indicator:
Your dashboard always displays in plain words (like “BUY”, “SELL”, or “WAIT”) what action makes sense in the current market phase. Whether it’s a bull trap, volume spike, wick reversal, or exhaustion—it’s interpreted and explained clearly. No more confusion—just direct, real-time advice.
6. For Everyone (Beginner to Pro)
Intent:
Most advanced indicators are overwhelming for new traders; simple ones lack depth for professionals.
In this Indicator:
It is simple enough for a beginner—just add it to the chart and instantly see what action to consider. At the same time, it includes advanced adaptive analysis, multi-timeframe logic, and customizable settings so professional traders can fine-tune it for their strategies.
7. Ideal Usage and User Benefits
Instant Decision Support:
Whenever you’re unsure about a trade, just look at the indicator’s suggestion for clarity.
Entry Learning:
Beginners get real-time “practice” by not only seeing signals, but also the reason behind them—improving your chart reading and market understanding.
Screen Time & Stress Reduction:
Clear, relevant information only; no noise, less fatigue, faster decisions.
Makes Trading Confident & Simple:
The smart dashboard splits actionable levels (HTF, LTF, action) so you never miss a move, avoid traps, and stay aligned with high-probability trades.
8. Advanced Input Settings (Smart Customization)
Explained with Examples:
Enable Wick Analysis:
Finds candles with strong upper/lower wicks (signs of rejection/buying/selling force), alerting you to hidden reversals and protecting from FOMO entries.
Enable Absorption:
Detects when heavy order flow from one side is “absorbed” by the other (shows where institutional buyers/sellers are likely active, helps spot fake breakouts).
Enable Unusual Breakout:
Highlights real breakouts—large volatility plus high volume—so you catch genuine moves and avoid random spikes.
Enable Range/Expansion:
Smartly flags sudden range expansions—when the market goes from quiet to volatile—so you can act at the start of real trends.
Trend Bar Lookback:
Adjusts how many bars/candles are used in trend calculations. Short (fast trades, more signals), long (more reliability, fewer whipsaws).
Bull/Bear Bars for Strong Trend Min:
Sets how many candles in a row must support a trend before calling it “strong”—prevents flipping signals, keeps you disciplined.
Volume MA Length:
Lets you adjust how many bars back volume is averaged—fine-tune for your asset and trading style for best volume signals.
Swing Lookback Bars:
Set how many bars to use for swing high/low detection—short (quick swing levels), long (stronger support/resistance).
HTF (Bias Window):
Decide which higher timeframe the indicator should use for big-picture market mood. Adjustable for any style (scalp, swing, position).
Adaptive Lookback (HTF):
Choose how much HTF history is used for detecting major extremes/zones. Quick adjust for more/less sensitivity.
Show Support/Resistance, Liquidity Zones, Trendlines:
Toggle them on/off instantly per your needs—keeps your chart relevant and tailored.
9. Live Dashboard Sections Explained
Intent HTF:
Shows if the bigger timeframe currently has a Bullish, Bearish, or Neutral (“Chop”) intent, based on strict volume/price body calculations. Instant clarity—no more guessing on trend bias.
HTF Bias:
Clear message about which side (buy/sell/sideways) controls the market on the higher timeframe, so you always trade with the “big money.”
Chart Action:
The central action for the current bar—Whether to Buy, Sell, or Wait—calculated from all indicator logic, not just one rule.
TrendScore Long/Short:
See how many candles in your chosen window were bullish or bearish, at a glance. Instantly gauge market momentum.
Reason (WHY):
Every time a signal appears, the “reason” cell tells you the primary logic (breakout, wick, strong trend, etc.) behind it. Full transparency and learning—never trade blindly.
Strong Trend:
Shows if the market is currently in a powerful trend or not—helping you avoid choppy, risky entries.
HTF Vol/Body:
Displays current higher timeframe volume and candle body %—helping spot when big players are active for higher probability trades.
Volume Sentiment:
A real-time analysis of market psychology (strong bullish/bearish, neutral)—making your decision-making much more confident.
10. Smart and User-Friendly Design
Multi-timeframe Adaptive:
All calculations can now be drawn from your choice of higher or current timeframe, ensuring signals are filtered by larger market context.
Flexible Table Position:
You can set the live dashboard/summary anywhere on the chart for best visibility.
Refined Zone Visualization:
Liquidity and order blocks are visually highlighted, auto-tuning for your settings and always cleaning up to stay clutter-free.
Multi-Lingual & Beginner Accessible:
With Hindi and simple English support, descriptions and settings are accessible for a wide audience—anyone can start using powerful trading logic with zero language barrier.
Efficient Labels & Clear Reasoning:
Signal labels and reasons are shown/removed dynamically so your chart stays informative, not messy.
Every detail of this indicator is designed to make trading both simpler and smarter—helping you avoid the common pitfalls, learn real price action, stay in sync with the market’s true mood, and act with discipline for higher consistency and confidence.
This indicator makes professional-grade market analysis accessible to everyone. It’s your trusted assistant for making smarter, faster, and more profitable trading decisions—providing not just signals, but also the “why” behind every action. With auto-adaptive logic, clear visuals, and strong focus on real trading needs, it lets you focus on capturing the moves that matter—every single time.

Gann Fan Strategy [KedarArc Quant]Description
A single-concept, rule-based strategy that trades around a programmatic Gann Fan.
It anchors to a swing (or a manual point), builds 1×1 and related fan lines numerically, and triggers entries when price interacts with the 1×1 (breakout or bounce). Management is done entirely with the fan structure (next/previous line) plus optional ATR trailing.
What TV indicators are used
* Pivots: `ta.pivothigh/ta.pivotlow` to confirm swing highs/lows for anchor selection.
* ATR: `ta.atr` only to scale the 1×1 slope (optional) and for an optional trailing stop.
* EMA: `ta.ema` as a trend filter (e.g., only long above the EMA, short below).
No RSI/MACD/Stoch/Heikin/etc. The logic is one coherent framework: Gann price–time geometry, with ATR as a scale and EMA as a risk filter.
How it works
1. Anchor
* Auto: chooses the most recent *confirmed* pivot (you control Left/Right).
* Manual: set a price and bar index and the fan will hold that point (no re-anchoring).
* Optional Re-anchor when a newer pivot confirms.
2. 1×1 Slope (numeric, not cosmetic)
* ATR mode: `1×1 = ATR(Length) × Multiplier` (adapts to volatility).
* Fixed mode: `ticks per bar` (constant slope).
Because slope is numeric, it doesn’t change with chart zoom, unlike the drawing tool.
3. Fan Lines
Builds classic ratios around the 1×1: 1/8, 1/4, 1/3, 1/2, 1/1, 2/1, 3/1, 4/1, 8/1.
4. Signals
* Breakout: cross of price over/under the 1×1 in the EMA-aligned direction.
* Bounce (optional): touch + reversal across the 1×1 to reduce whipsaw.
5. Exits & Risk
* Take-profit at the next fan line; Stop at the previous fan line.
* If a level is missing (right after re-anchor), a fallback Risk-Reward (RR) is used.
* Optional ATR trailing stop.
Why this is unique
* True numeric fan: The 1×1 slope is calculated from ATR or fixed ticks—not from screen geometry—so it is scale-invariant and reproducible across users/timeframes.
* Deterministic anchor logic: Uses confirmed pivots (with your L/R settings). No look-ahead; anchors update only when the right bars complete.
* Fan-native trade management: Both entries and exits come from the fan structure itself (with a minimal ATR/EMA assist), keeping the method pure.
* Two entry archetypes: Breakout for momentum days; Bounce for range days—switchable without changing the core model.
* Manual mode: Lock a session’s bias by anchoring to a chosen swing (e.g., day’s first major low/high) and keep the fan constant all day.
Inputs (quick guide)
* Auto Anchor (Left/Right): pivot sensitivity. Higher values = fewer, stronger anchors.
* Re-anchor: refresh to newer pivots as they confirm.
* Manual Anchor Price / Bar Index: fixes the fan (turn Auto off).
* Scale 1×1 by ATR: on = adaptive; off = use ticks per bar.
* ATR Length / ATR Multiplier: controls adaptive slope; start around 14 / 0.25–0.35.
* Ticks per bar: exact fixed slope (match a hand-drawn fan by computing slope ÷ mintick).
* EMA Trend Filter: e.g., 50–100; trades only in EMA direction.
* Use Bounce: require touch + reverse across 1×1 (helps in chop).
* TP/SL at fan lines; Fallback RR for missing levels; ATR Trailing Stop optional.
* Transparency/Plot EMA: visual preferences.
Tips
* Range days: larger pivots (L/R 8–12), Bounce ON, ATR Multiplier \~0.30–0.40, EMA 100.
* Trend days: L/R 5–6, Breakout, Multiplier \~0.20–0.30, EMA 50, ATR trail 1.0–1.5.
* Match the TV Gann Fan drawing: turn ATR scale OFF, set ticks per bar = `(Δprice between anchor and 1×1 target) / (bars) / mintick`.
Repainting & testing notes
* Pivots require Right bars to confirm; anchors are set after confirmation (no look-ahead).
* Signals use the current bar close with TradingView strategy mechanics; real-time vs. bar-close can differ slightly, as with any strategy.
* Re-anchoring legitimately moves the structure when new pivots confirm—by design.
⚠️ Disclaimer
This script is provided for educational purposes only.
Past performance does not guarantee future results.
Trading involves risk, and users should exercise caution and use proper risk management when applying this strategy.

Failure Swing IndicatorIdentify Failure Swing nice and easy
J. Welles Wilder Jr. describes Failure Swings as specific chart patterns used in conjunction with the Relative Strength Index (RSI) to identify potential reversals in price trends.
These patterns signal weakening momentum and can indicate a shift in market direction
Wilder emphasized that these patterns are more reliable when confirmed by price action or other technical indicators.
Apex Edge - MTF Confluence PanelApex Edge – MTF Confluence Panel
Description:
The Apex Edge – MTF Confluence Panel is a powerful multi-timeframe analysis tool built to streamline trade decision-making by aggregating key confluences across three user-defined timeframes. The panel visually presents the state of five core market signals—Trend, Momentum, Sweep, Structure, and Trap—alongside a unified Score column that summarizes directional bias with clarity.
Traders can customize the number of bullish/bearish conditions required to trigger a score signal, allowing the tool to be tailored for both conservative and aggressive trading styles. This script is designed for those who value a clean, structured, and objective approach to identifying market alignment—whether scalping or swing trading.
How it Works:
Across each of the three selected timeframes, the panel evaluates:
Trend: Based on a user-configurable Hull Moving Average (HMA), the script compares price relative to trend to determine bullish, bearish, or neutral bias.
Momentum: Uses OBV (On-Balance Volume) with volume spike detection to identify bursts of strong buying or selling pressure.
Sweep: Detects potential liquidity grabs by identifying price rejections beyond prior swing highs/lows. A break below a previous low with reversal signals bullish intent (and vice versa for bearish).
Structure: Uses dynamic pivot-based logic to identify market structure breaks (BOS) beyond recent confirmed swing levels.
Trap: Flags potential false moves by measuring RSI overbought/oversold signal clusters combined with minimal price movement—highlighting exhaustion or deceptive breaks.
Score: A weighted consensus of the above components. The number of required confluences to trigger a score (default: 3) can be set by the user via input, offering flexibility in signal sensitivity.
Why It’s Useful for Traders:
Quick Decision-Making: The color-coded panel provides instant visual feedback on whether confluences align across timeframes—ideal for fast-paced environments like scalping or high-volatility news sessions.
Multi-Timeframe Confidence: Helps eliminate guesswork by confirming whether higher and lower timeframe conditions support your trade idea.
Customizability: Adjustable confluence threshold means traders can fine-tune how sensitive the system is—more signals for faster entries, stricter confluence for higher conviction trades.
Built-In Alerts: Automated alerts for score alignment, trap detection, and liquidity sweeps allow traders to stay informed even when away from the screen.
Strategic Edge: Supports directional bias confirmation and trade filtering with logic designed to mimic professional decision-making workflows.
Features:
Clean, real-time confluence table across three user-selected timeframes
Configurable score sensitivity via “Minimum Confluences for Score” input
Cell-based colour coding for at-a-glance trade direction
Built-in alerts for score alignment, traps, and sweep triggers
Note - This Indicator works great in sync with Apex Edge - Session Sweep Pro
Useful levels for TP = previous session high/low boxes or fib levels.
⚠️ Disclaimer:
This script is for informational and educational purposes only and should not be considered financial advice. Always perform your own due diligence and practice proper risk management when trading.

((Range||Type||Swing))Consecutive Candle range boxes with gradient and number count. Inside Outside and Engulfing color bars plus plots. Strict swing filter plus bonus filter where the 3rd bar in the swing closes below the swing candles high or low respectfully.
How I Use
I use the candle stick patterns to gauge market conditions, the consecutive candle ranges to follow order flow using a closing break of the range and retest and the filtered swings to assist in identifying stronger. If any one wants to create a strategy around this that would be cool i know nothing of coding and do everything with A.I
turns
ScalpSwing Pro SetupScript Overview
This script is a multi-tool setup designed for both scalping (1m–5m) and swing trading (1H–4H–Daily). It combines the power of trend-following , momentum , and mean-reversion tools:
What’s Included in the Script
1. EMA Indicators (20, 50, 200)
- EMA 20 (blue) : Short-term trend
- EMA 50 (orange) : Medium-term trend
- EMA 200 (red) : Long-term trend
- Use:
- EMA 20 crossing above 50 → bullish trend
- EMA 20 crossing below 50 → bearish trend
- Price above 200 EMA = uptrend bias
2. VWAP (Volume Weighted Average Price)
- Shows the average price weighted by volume
- Best used in intraday (1m to 15m timeframes)
- Use:
- Price bouncing from VWAP = reversion trade
- Price far from VWAP = likely pullback incoming
3. RSI (14) + Key Levels
- Shows momentum and overbought/oversold zones
- Levels:
- 70 = Overbought (potential sell)
- 30 = Oversold (potential buy)
- 50 = Trend confirmation
- Use:
- RSI 30–50 in uptrend = dip buying zone
- RSI 70–50 in downtrend = pullback selling zone
4. MACD Crossovers
- Standard MACD with histogram & cross alerts
- Shows trend momentum shifts
- Green triangle = Bullish MACD crossover
- Red triangle = Bearish MACD crossover
- Use:
- Confirm swing trades with MACD crossover
- Combine with RSI divergence
5. Buy & Sell Signal Logic
BUY SIGNAL triggers when:
- EMA 20 crosses above EMA 50
- RSI is between 50 and 70 (momentum bullish, not overbought)
SELL SIGNAL triggers when:
- EMA 20 crosses below EMA 50
- RSI is between 30 and 50 (bearish momentum, not oversold)
These signals appear as:
- BUY : Green label below the candle
- SELL : Red label above the candle
How to Trade with It
For Scalping (1m–5m) :
- Focus on EMA crosses near VWAP
- Confirm with RSI between 50–70 (buy) or 50–30 (sell)
- Use MACD triangle as added confluence
For Swing (1H–4H–Daily) :
- Look for EMA 20–50 cross + price above EMA 200
- Confirm trend with MACD and RSI
- Trade breakout or pullback depending on structure

Adaptive Fibonacci Volatility Bands (AFVB)
**Adaptive Fibonacci Volatility Bands (AFVB)**
### **Overview**
The **Adaptive Fibonacci Volatility Bands (AFVB)** indicator enhances standard **Fibonacci retracement levels** by dynamically adjusting them based on market **volatility**. By incorporating **ATR (Average True Range) adjustments**, this indicator refines key **support and resistance zones**, helping traders identify **more reliable entry and exit points**.
**Key Features:**
- **ATR-based adaptive Fibonacci levels** that adjust to changing market volatility.
- **Buy and Sell signals** based on price interactions with dynamic support/resistance.
- **Toggleable confirmation filter** for refining trade signals.
- **Customizable color schemes** and alerts.
---
## **How This Indicator Works**
The **AFVB** operates in three main steps:
### **1️⃣ Detecting Key Fibonacci Levels**
The script calculates **swing highs and swing lows** using a user-defined lookback period. From this, it derives **Fibonacci retracement levels**:
- **0% (High)**
- **23.6%**
- **38.2%**
- **50% (Mid-Level)**
- **61.8%**
- **78.6%**
- **100% (Low)**
### **2️⃣ Adjusting for Market Volatility**
Instead of using **fixed retracement levels**, this indicator incorporates an **ATR-based adjustment**:
- **Resistance levels** shift **upward** based on ATR.
- **Support levels** shift **downward** based on ATR.
- This makes levels more **responsive** to price action.
### **3️⃣ Generating Buy & Sell Signals**
AFVB provides **two types of signals** based on price interactions with key levels:
✔ **Buy Signal**:
Occurs when price **dips below** a support level (78.6% or 100%) and **then closes back above it**.
- **Optionally**, a confirmation buffer can be enabled to require price to close **above an additional threshold** (based on ATR).
✔ **Sell Signal**:
Triggered when price **breaks above a resistance level** (0% or 23.6%) and **then closes below it**.
📌 **Important:**
- The **buy threshold setting** allows traders to **fine-tune** entry conditions.
- Turning this setting **off** generates **more frequent** buy signals.
- Keeping it **on** reduces false signals but may result in **fewer trade opportunities**.
---
## **How to Use This Indicator in Trading**
### 🔹 **Entry Strategy (Buying)**
1️⃣ Look for **buy signals** at the **78.6% or 100% Fibonacci levels**.
2️⃣ Ensure price **closes above** the support level before entering a long trade.
3️⃣ **Enable or disable** the buy threshold filter depending on desired trade strictness.
### 🔹 **Exit Strategy (Selling)**
1️⃣ Watch for **sell signals** at the **0% or 23.6% Fibonacci levels**.
2️⃣ If price **breaks above resistance and then closes below**, consider exiting long positions.
3️⃣ Can be used **alone** or **combined with trend confirmation tools** (e.g., moving averages, RSI).
### 🔹 **Using the Toggleable Buy Threshold**
- **ON**: Buy signal requires **extra confirmation** (reduces false signals but fewer trades).
- **OFF**: Buy triggers as soon as price **closes back above support** (more signals, but may include weaker setups).
---
## **User Inputs**
### **🔧 Customization Options**
- **ATR Length**: Defines the period for **ATR calculation**.
- **Swing Lookback**: Determines how far back to find **swing highs and lows**.
- **ATR Multiplier**: Adjusts the size of **volatility-based modifications**.
- **Buy/Sell Threshold Factor**: Fine-tunes the **entry signal strictness**.
- **Show Level Labels**: Enables/disables **Fibonacci level annotations**.
- **Color Settings**: Customize **support/resistance colors**.
### **📢 Alerts**
AFVB includes built-in **alert conditions** for:
- **Buy Signals** ("AFVB BUY SIGNAL - Possible reversal at support")
- **Sell Signals** ("AFVB SELL SIGNAL - Possible reversal at resistance")
- **Any Signal Triggered** (Useful for automated alerts)
---
## **Who Is This Indicator For?**
✅ **Scalpers & Day Traders** – Helps identify **short-term reversals**.
✅ **Swing Traders** – Useful for **buying dips** and **selling rallies**.
✅ **Trend Traders** – Can be combined with **momentum indicators** for confirmation.
**Best Timeframes:**
⏳ **15-minute, 1-hour, 4-hour, Daily charts** (works across multiple assets).
---
## **Limitations & Considerations**
🚨 **Important Notes**:
- **No indicator guarantees profits**. Always **combine** it with **risk management strategies**.
- Works best **in trending & mean-reverting markets**—may generate false signals in **choppy conditions**.
- Performance may vary across **different assets & timeframes**.
📢 **Backtesting is recommended** before using it for live trading.

Intraday Anchored FanSimilar to an Anchored VWAP, this lets you click a bar on an Intraday chart to add an "Anchored Fan" which displays lines at up to 6 levels above and below the chosen Anchor Point. Useful to measure the retracement during swing moves.
You can reposition the fan by either hovering over the anchor or by clicking the name of the study to "activate" it, and then dragging. You can also change the Anchor Point in Settings.
By default the anchor uses the bar Close, but you can change this manually in settings OR you can use the fancy "Auto high/low" mode which is handy if you are mainly dropping the fan on local swing highs and lows.
The default line measures were chosen for ES (Futures) but the study should be usable with nearly anything as long as you adjust the settings to something appropriate for the ticker. If you want to use this on NQ, for example, it would be reasonable to multiple each of these settings by 3.5 or so.
NOTE: If the fan is off the left side of the chart, one way to see the Anchor handle again easily is to switch to a higher timeframe; for example if you are on the 5min maybe use the 15min or hourly to find the handle -- if it is WAY off the left side (for example if you let many days pass without advancing it) it's generally easiest to use Settings to move it back to "now".

Gann + Laplace Smoothed Hybrid Volume Spread AnalysisThe Gann + Laplace Smoothed Hybrid Volume Spread Analysis ( GannLSHVSA ) Strategy/Indicator is an trading tool designed to fuse volume analysis with trend detection, offering traders a view of market dynamics.
This Strategy/Indicator stands apart by integrating the principles of the upgraded Discrete Fourier Transform (DFT), the Laplace Stieltjes Transform and volume spread analysis, enhanced with a layer of Fourier smoothing to distill market noise and highlight trend directions with unprecedented clarity.
The length of EMA and Strategy Entries are modified with the Gann swings .
This smoothing process allows traders to discern the true underlying patterns in volume and price action, stripped of the distractions of short-term fluctuations and noise.
The core functionality of the GannLSHVSA revolves around the innovative combination of volume change analysis, spread determination (calculated from the open and close price difference), and the strategic use of the EMA (default 10) to fine-tune the analysis of spread by incorporating volume changes.
Trend direction is validated through a moving average (MA) of the histogram, which acts analogously to the Volume MA found in traditional volume indicators. This MA serves as a pivotal reference point, enabling traders to confidently engage with the market when the histogram's movement concurs with the trend direction, particularly when it crosses the Trend MA line, signalling optimal entry points.
It returns 0 when MA of the histogram and EMA of the Price Spread are not align.
WHAT IS GannLSHVSA INDICATOR:
The GannLSHVSA plots a positive trend when a positive Volume smoothed Spread and EMA of Volume smoothed price is above 0, and a negative when negative Volume smoothed Spread and EMA of Volume smoothed price is below 0. When this conditions are not met it plots 0.
HOW TO USE THE STRATEGY:
Here you fine-tune the inputs until you find a combination that works well on all Timeframes you will use when creating your Automated Trade Algorithmic Strategy. I suggest 4h, 12h, 1D, 2D, 3D, 4D, 5D, 6D, W and M.
ORIGINALITY & USEFULNESS:
The GannLSHVSA Strategy is unique because it applies upgraded DFT, the Laplace Stieltjes Transform for data smoothing, effectively filtering out the minor fluctuations and leaving traders with a clear picture of the market's true movements. The DFT's ability to break down market signals into constituent frequencies offers a granular view of market dynamics, highlighting the amplitude and phase of each frequency component. This, combined with the strategic application of Ehler's Universal Oscillator principles via a histogram, furnishes traders with a nuanced understanding of market volatility and noise levels, thereby facilitating more informed trading decisions. The Gann swing strategy is developed by meomeo105, this Gann high and low algorithm forms the basis of the EMA modification.
DETAILED DESCRIPTION:
My detailed description of the indicator and use cases which I find very valuable.
What is the meaning of price spread?
In finance, a spread refers to the difference between two prices, rates, or yields. One of the most common types is the bid-ask spread, which refers to the gap between the bid (from buyers) and the ask (from sellers) prices of a security or asset.
We are going to use Open-Close spread.
What is Volume spread analysis?
Volume spread analysis (VSA) is a method of technical analysis that compares the volume per candle, range spread, and closing price to determine price direction.
What does this mean?
We need to have a positive Volume Price Spread and a positive Moving average of Volume price spread for a positive trend. OR via versa a negative Volume Price Spread and a negative Moving average of Volume price spread for a negative trend.
What if we have a positive Volume Price Spread and a negative Moving average of Volume Price Spread?
It results in a neutral, not trending price action.
Thus the Indicator/Strategy returns 0 and Closes all long and short positions.
I suggest using "Close all" input False when fine-tuning Inputs for 1 TimeFrame. When you export data to Excel/Numbers/GSheets I suggest using "Close all" input as True, except for the lowest TimeFrame. I suggest using 100% equity as your default quantity for fine-tune purposes. I have to mention that 100% equity may lead to unrealistic backtesting results. Be avare. When backtesting for trading purposes use Contracts or USDT.
