#JJ_Shares Trend Follower
-----------------
Hey there!
There are many reasons why this strategy has worked quite well over the past few years.
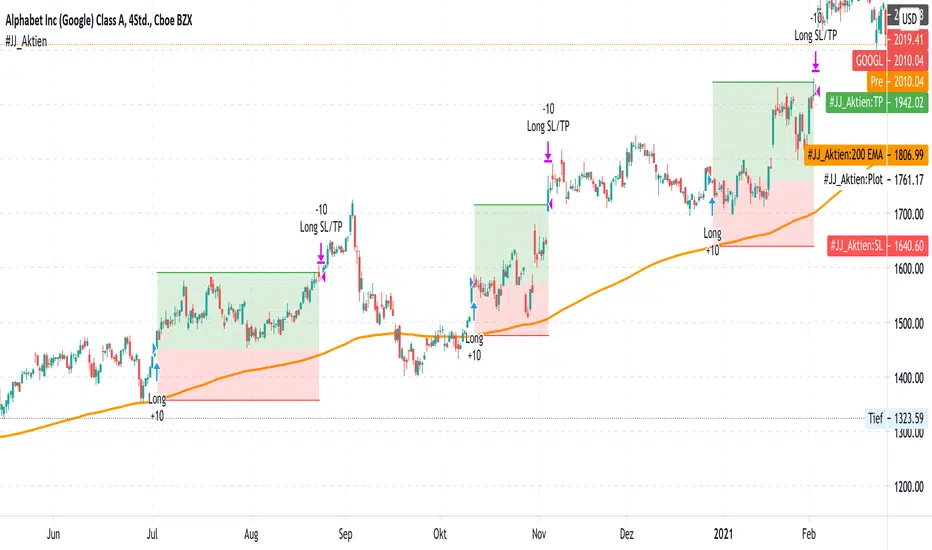
A very simple strategy in itself. The basis of this indicator is the trend following approach. "The trend is your friend." This strategy is based on individual separate indicators. A total of three EMA's (10.50 & 200) & the ATR are combined. The largest EMA shows the basic trend direction and thus also the preferred trade direction. The two smaller EMAs are used for the timing of the entrances at the intersection. The stop levels are placed with the help of the ATR and the large EMA. Profit areas are determined using a risk calculation.
Exact entry points can be identified using the indicator. In addition, a take profit is visualized based on a 3:1 CRV . The stop loss results from a long-term EMA .
Example for NASDAQ:GOOGL ! But can be used for all other trend following stocks!
The indicator can be used on all timeframes. However, the performance is significantly better in higher timeframes. In addition, the display can be adjusted using the options.
That's all. Due to the technical chart background, the strategy can be used without further chart analysis.
Attention: Before opening a position, always first check whether there is any strong news. In these cases it is better to be on the safe side.
Attention: With this strategy a SL is provided as standard. However, the risk must always be carefully calculated.
Past results do not guarantee future profits!
Use the link below to get access to this indicator or PM us to get access.
--------------------------------------------------------------------------------------------------------------
--------------------------------------------------------------------------------------------------------------
-----------------
Willkommen!
Es gibt viele Gründe, warum sich diese Strategie in den letzten Jahren ganz gut bewährt hat.
Eine sehr einfache Strategie für sich. Grundlage dieses Indikators ist der Trendfolgeansatz. "The trend is your friend." Diese Strategie basiert auf einzelnen seperaten Indikatoren. Insgesamt werden drei EMA's (10,50 & 200) & die ATR kombiniert. Der größte EMA zeigt die grundsätzliche Trendrichtung und somit auch die bevorzugte Traderichtung. Die beiden kleineren EMA werden bei Kreuzung für das Timing der Einstiege verwendet. Mit Hilfe der ATR und des großen EMA werden die Stop Level platziert. Gewinnzonen werden über eine Risikoberechnung ermittelt.
Anhand des Indikators können genaue Einstiege erkannt werden. Zusätzlich wird aufgrund eines 3:1 CRV ein Take Profit visualisiert. Der Stop Loss ergibt sich über einen langfristigen EMA .
Beispiel für NASDAQ:GOOGL ! Kann aber für alle weiteren Trendfolge Aktien verwendet werden!
Der Indikator kann auf allen Timeframes angewendet werden. Allerdings ist der Performance in höheren Timeframes deutlich besser. Zusätzlich kann die Anzeige über die Optionen angepasst werden.
Das ist alles. Aufgrund des charttechnischen Hintergrunds kann die Strategie ohne weitere Chartanalyse verwendet werden.
Achtung: Vor dem Öffnen einer Position immer zuerst prüfen ob starke News anstehen. In diesen Fällen lieber auf Nummer sicher gehen.
Achtung: Bei dieser Strategie ist standardmäßig ein SL vorgesehen. Das Risiko muss aber immer gut kalkuliert werden.
Vergangene Ergebnisse garantieren keine zukünftigen Gewinne!
Verwenden Sie den folgenden Link, um Zugriff auf diesen Indikator zu erhalten oder schreibe uns eine PM um Zugriff zu erhalten.
Cari dalam skrip untuk "take profit"
Triple SMA Strategy with entries based on sma price closesHi! :)
This strategy is made for intraday trades, especially on 5 sec - 5 min charts to follow the trend.
I have not tested on higher timeframes, but feel free to play with the values.
I have set a basic value for the 3 SMA at
-200
-400
-600
We will use an oscillator for entries which is not mine. Link ->
The oscillator mentioned above is just for visualization purposes, You do not need to get the signals, but You can see how scripts are generated with different values.
When the price above/below all the 3 SMA and oscillator crosses above/below "value you set" - You will get the buy or sell signal.
Your stop will be where the slowest SMA is.
Pyramiding is set for 10.
You can manually set 3 take profit and quantity levels.
Basic values are 1 %, 2 %, and 6 % for taking profits - You can change it based on how volatile the asset is.
Basic quantity values are 30 % at each level.
Hope You find it useful :)

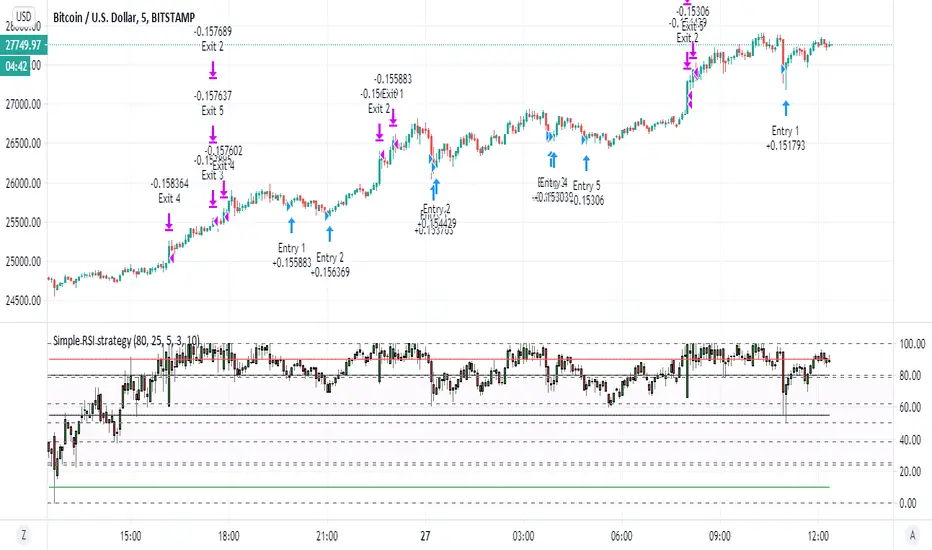
Simple RSI strategyso this script just take it as teaching how to make easy strategy
many time we try complex one and we fail
thanks to coinrule for his very smart method of pyramid
i just here in this very simple rsi strategy want to show how even lame strategy like RSI can be very profitable:)
1. we exit by take profit
2. we make sure that for exit by take profit the stop loss will be far lets say 10% or more
3. this shit only work good in up trending markets:)
why regular rsi strategy not working? because the exit is shity ... it depend on false top that based on RSI above 70 or 80 in general.
in bullish state this will exit us faster then we desire and will cost us loss . in bearish state rsi will not go so high and we exit too late so the stop loss is our our only saver
here by exiting by% we get much better results
so what happen if the trend is bearish? you can can try to do the same just reverse order to create more shorts (sometime it work sometime is not)
end conclusion in bullish trending market even shifty strategy is good
the only reason this one work is actually because of the script of coinrule so i want to thank him on this
happy new year to all TV members
KISS Strategy: SMA + EMA//Hello my fellow investors
//I am creating a simple non-cluttered strategy that uses 3(+1) simple means to determine: viability, entry, and exit
//1) Has a consistent trend been maintained for several days/weeks
//2) SH SMA crossover LG SMA = Bullish entry/LG SMA crossover SH SMA = Bearish entry
//3) Use the Slope factor & Weeks in Trend (WiT) to dertermine how strong of an entry signal you are comfortable with
//4) Exit position based on next SMA cross and trend reversal or stop loss%
//3+1) For added confidence in trend detection: Apply MACD check - buy--> MACD line above signal line and corssover below histogram \\ sell --> MACD line below signal line and crossover above histogram.
//*)This code also allows you to determine your desired backtesting date compliments of alanaster
The chart shown has:
Starting Capital: $10,000
Investment percent per trade: 1.5%
Stop Loss: 20%
Take Profit: 100%
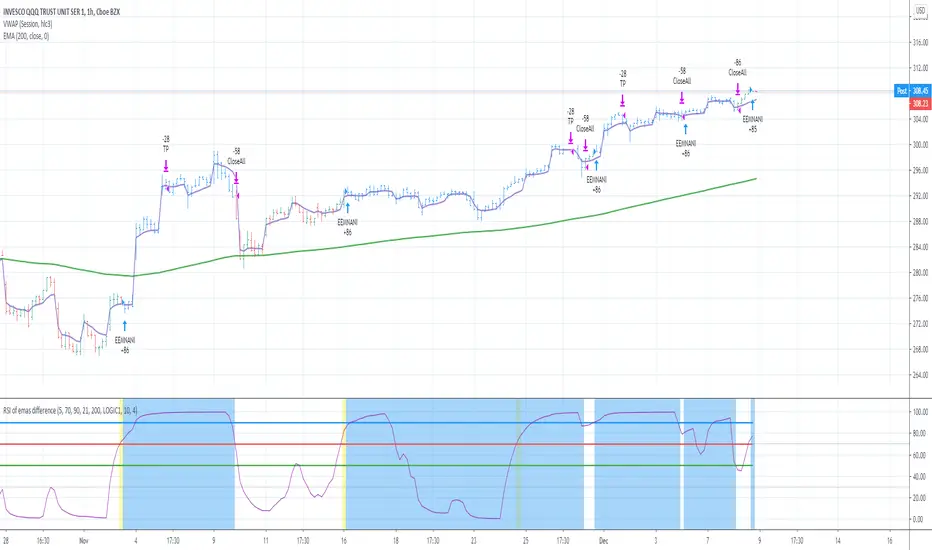
RSI of emas difference [ EEMANI ]This strategy is found by error.
Initially I started to find the weekly version of RSIofVWAP strategy. somehow I didn't see good results. Then , on the same script I did change it to find rsi emas difference strategy.
while changing the code , for the long term ema /slow ema input , I had entered fastema value instead of the price close. That is the error.
But strategy showed good results , then I extended it to add stop loss and take profits. Since this is found by error, I cant explain much how it is working.
Please check if your symbol works with this strategy and let me know ... your feedback is greatly appreciated to improve the strategy ...
I name it as EEMANI strategy
BUY
======
When the RSIofEMAsdiff is crossing above 70 (buy Line) and fastEma is rising
Note:
On the indicator it shows yellow background ... thats the entry point ....
when strategy is already in Long position , if you see yellow back ground thats where you can add or enter if you missed earlier signal
background and bar color color changes to blue when strategy is in Long position
Partial Exit
=========
when RSI value reaches 99 , 1/3 of the position si closed with profit
Close
======
when RSI value crossing down 90 (exitLine)
Stop Loss
=========
defaulted to 4% (increasing this value might improve the performance , but number of bars will go high , that means you need to wait longer time to get out of the trade ... Thats boring !!!
Note :
I have added two formulas , both of them are produce similar results. But different equities on different logic. check which formula is working for you
LOGIC1 => fastEMAval-slowEMAval
LOGIC2 => (slowEMAval+fastEMAval)/weeklyVwap
Warning
=========
For the use of educational purposes only
Bitcoin (BTC) Scalp / Short-term Short IndicatorThe purpose of this scalping Indicator is to help identifying Sell signals for short term trades on Bitcoin (Spot, Features, etc.) .
This script is working with more indicators and everything is balanced by hard work on (back)testing.
Result for users is a simple signal to SELL.
You can use it as easy indicator in your graph or create alerts.
I have the best results on 1min graph, with leverage and stop-loss feature.
This is my own version of scalping Sell Script / Indicator, which is a combination of few indicators, for example RSI , BB and price levels (actual and average) and works on standard candles.
SELL signal paints above the candle and you can set your target / trailing / stop-loss in the settings and check how it works in Strategy Tester.
Settings of this Indicator:
Take Profit
Stop Loss
Trailing Stop Loss
Trailing Stop Loss Offset
Initial Capital
Base Currency
Order size
Pyramiding
Commissions
Slippage
Average price lines (colors and visibility)
Plot background
These signals can be often observed at the beginning of a strong move, but there is a significant probability that these price levels will be revisited at a later point in time again.
Therefore these are interesting levels to place limit orders.
A Sell signal is defined as the last up candle before a sequence of down candles.
In my trading settings I have more but small positions, one safety limit order (for price averaging = better entry - easier close in profit) and stop-loss.
Sometimes trailing-profit feature have very nice profits.
Settings depends on your own money-management and free capital.
Don't ignore UP / DOWN trend. For UP trend I have an Indicator too (check my profile).
In addition to the upper/lower limits of each line, also average value is marked as this is an interesting area for price interaction and better view.
PM me to obtain access, more informations or support.
NOTICE: By requesting access to this script you acknowledge that you have read and understood that this is for research purposes only and I am not responsible for any financial losses you may incur by using this script.

Bitcoin (BTC) Scalp / Short-term Long IndicatorThe purpose of this scalping Indicator is to help identifying Buy signals for short term trades on Bitcoin (Spot, Features, etc.) .
This script is working with more indicators and everything is balanced by hard work on (back)testing.
Result for users is a simple signal to BUY .
You can use it as easy indicator in your graph or create alerts.
I have the best results on 1min graph, with leverage and stop-loss feature.
This is my own version of scalping Buy Script / Indicator, which is a combination of few indicators, for example RSI, BB and price levels (actual and average) and works on standard candles .
LONG signal paints below the candle and you can set your target / trailing / stop-loss in the settings and check how it works in Strategy Tester .
Settings of this Indicator:
Take Profit
Stop Loss
Trailing Stop Loss
Trailing Stop Loss Offset
Initial Capital
Base Currency
Order size
Pyramiding
Commissions
Slippage
Average price lines (colors and visibility)
Plot background
These signals can be often observed at the beginning of a strong move, but there is a significant probability that these price levels will be revisited at a later point in time again.
Therefore these are interesting levels to place limit orders.
A Buy signal is defined as the last down candle before a sequence of up candles.
In my trading settings I have more but small positions, one safety limit order (for price averaging = better entry - easier close in profit) and stop-loss.
Sometimes trailing-profit feature have very nice profits.
Settings depends on your own money-management and free capital.
In addition to the upper/lower limits of each line, also average value is marked as this is an interesting area for price interaction and better view.
PM me to obtain access, more informations or support.
NOTICE: By requesting access to this script you acknowledge that you have read and understood that this is for research purposes only and I am not responsible for any financial losses you may incur by using this script.

Multi Time Frame Buy the Dips (by Coinrule)Buying the dips is a relatively easy automated trading strategy that can return impressive profits, especially during uptrend times. Not all price drops are for buying, though. This trading system is based on a multi time frame buy-the-dip approach to optimize each trade.
The strategy catches sudden price drops on a 1-hr time frame when the price increases significantly in the last 12 hours. During steep uptrends, profit-taking price actions result in flash crashes that provide great opportunity to enter at convenient prices.
Buy Condition
The setup of the script is optimized on a 30 min time frame. You can adjust the parameters to fit different time frames.
The system gets a buy signal when
- the price drops 1% from the two previous candles (1 hour time frame = two 30-min candles)
- the price is up 3% from the last 12 hours (twenty-four 30-min candles equal the desired time frame)
Sell Condition
Each trade comes with a stop loss of 3% and a take profit of 4%.
This setup has been optimized, running over 150 backtests on more than 20 different crypto trading pairs.
The strategy assumes each order to trade 30% of the available capital. A trading fee of 0.1% is taken into account. The fee is aligned to the base fee applied on Binance, which is the largest cryptocurrency exchange.

Buy the Dips (by Coinrule)Taking your first steps into automated trading may be challenging. Coinrule's mission is to make it as easy as possible, also for beginners.
Here follows the best trading strategy to get started with Coinrule. This strategy doesn't involve complex indicators, yet was proved to be effective in the long term for many coins. Results seem to be improved when trading a coin vs Bitcoin.
The strategy buys the dips of a coin to sell with a profit. A stop-loss protects every trade.
Crypto markets offer high volatility and, thus, excellent opportunities for trading. Excluding times of severe downtrend, buying the dip is a simple and effective long-term trading strategy. The buy-signal is set to a 2% drop in a 30-minutes time frame.
Each trade comes with a take profit and a stop loss. Both set at 2%.
You can adjust these percentages to the market volatility as an advanced setup. You can backtest the outcomes using the backtesting tool from Tradingview
The strategy assumes each order to trade 30% of the available capital. A trading fee of 0.1% is taken into account. The fee is aligned to the base fee applied on Binance, which is the largest cryptocurrency exchange.

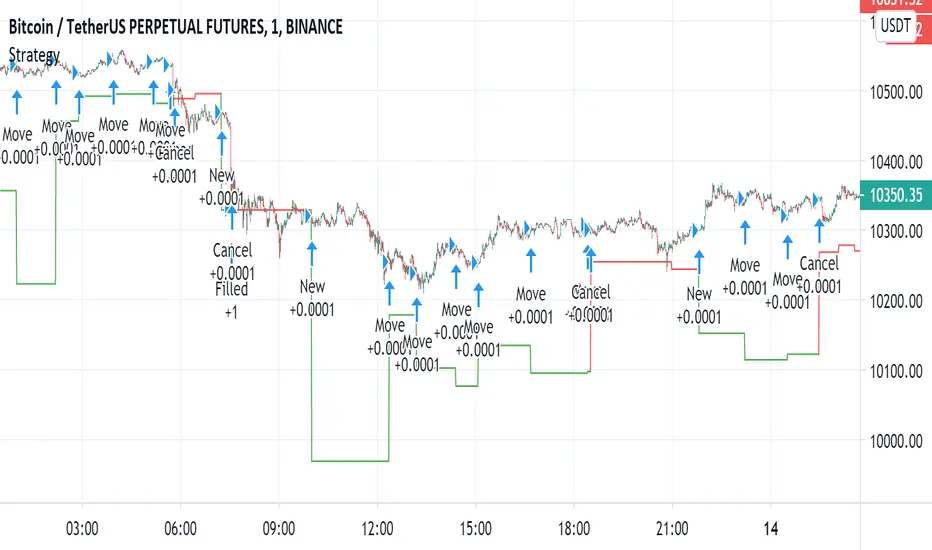
Automated - Fibs with Limit only ordersAutomated - Fibs with Limit only orders
This script was designed to demonstrate how you can use a single alert to move your limit orders around.
It is not meant to be traded live and has been built to work with Binance Futures Testnet.
You will notice a lot of plots with 5 different titles.
New = Place your limit buy at a fixed-price.
Move = Cancel the current limit buy and place it at the new fixed-price.
Filled = Cancel any limit closes and places them anew based on the new average and take profit.
Cancel = Cancels exisiting limit buys.
Cloes All = Limit close filled, no commands necessary.
The default quantity in the command is the minimum order size on Binance.
Settings
Live
- If enabled it will only place trades after the "Stat Timestamp + Start Delay" that you provide.
Start Timestamp
- Use something similar to epochconverter to get the current timestamp.
Start Delay
- Gives you 1 minute by default to start the script and create your alert before it begins looking for a new entry.
Leverage
- Default 1. Affects the "Take Profit and DCA When" Settings.
Take Profit %
- This is the percentage above the current average you'd like to place your position close at.
DCA When %
- The percentage below your last entry that you're willing to buy again.
Note: This strategy has no stop-loss and pyramiding is enabled. It is not built for, or recommended to run live.
I hope this opens some doors and helps advance your personal trading system.
Good luck and happy scripting!
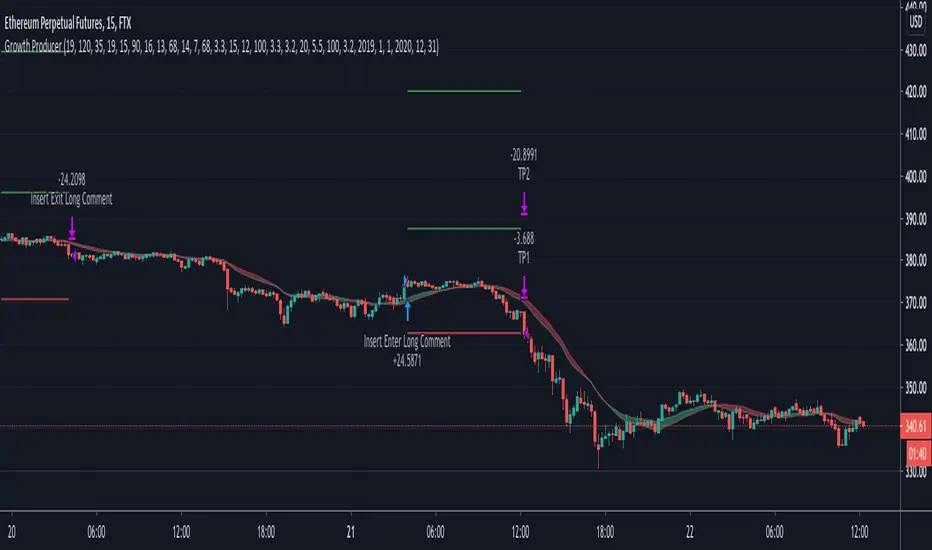
Growth Producer
Applicable to FTX:ETHPERP 15 min
Relative volatility index (RVI) that will determine the entry and exit points only when the volatility will start to increase and Money Flow index as an additional point for entry.
IMPORTANT
• Input Partial take profits in your Bot settings
• This is a trend strategy and works better in the trending market
• We added the trend identifier using the EMA and SMA interaction
• We added Take profit and stop loss levels
• We added inputs for the period selection, so you could see how the strategy is performing on a monthly basis.
• RVI for the entry conditions
• MFI was added for the additional entries.
• Partial Take-profits
Gladiator USDJPY1 ) This strategy is based on VWAP.
2 ) This strategy is based on BB+.
3 ) This strategy is based on a range.
4 ) This strategy has only longs. Shorts are separate.
It buys according to a flat position 10000 JPY per order.
Maximum positions are 1000 000 JPY which is 10x leverage with an initial balance of 100 000 JPY.
Take profit scales with a recent price range during an uptrend.
During a downtrend, there is a static take profit.
Commisions are 0.02JPY per contract.
Slippage is 5 pips.

Simple and efficient PSAR swing strategyThis is a strategy build inside tradingview, which I found it works great with swing/position trading.
It works based on parabolic sar indicator, when indicator is below the candle, is an uptrend and when its its above is a downtrend.
At the same time it's very nice, because it has a sort of stop loss which is dynamic, because it triggers when candle crosses with indicator, so you dont have to worry about stop loss or take profit .
The key here of course, is going to be the risk management, if you want to success with it, never trade more than 2% of you capital, and if you want you can always apply a rule inside the code to close all position if x % amount of equity was going down, although I recommend have patience and let the system do its job.
I recommend this strategy to be used with charts like 1 day or 1 week. If you need and want I can convert it to an indicator that uses alerts (although with strategy as well can be made to send alerts).
PS. When you add this strategy on chart, inside is has different versions, if you use first version(1), it uses the system I explain above. If you use the last one, its based on risk management when the stop loss is the difference between psar and the candle, but it still needs some adjustments to make.
Overall first one is atm much more profitable, but I believe that the version with risk management can be much better, but it need much more adjustments to make which I dont have the time at the moment for it.
Enjoy it .

renko candle strategy(lirshah)Renko candles strategy has been written based on renko box plots.
the strategy plots renko boxes and levels for trading,
the buy signals trigger when renko is on uptrend and hit the lower box border and similar scenario for sell signal.
the standard parameter are as bellow:
box size: 3.5$
take profit: 1000 pip
stop loss: 200 pip
the below overview is results of strategy on 1sec chart(normal candle) of Nasdaq index, with 1 contract and 0.5 $ commission per order during New york session.
in order to access scripts contact me directly.

Rsi BotOk This is MTF RSI bot
it has two way to approach it . one is strict with no repaint at all , just click to remove the repaint in the menu .
its still make profit but sure not crazy unrealistic one:)
The other option is the "repaint version" which is under my special repaint control system (not perfect but since we can never truly control the repaint the signal may be not perfect ) , but in general it not so much repainting :)
to verify just use the bar control to see how it work.
the buy and sell depend on the rsi crossing oversold and overbought level that you can control in the menu
Also in the menu you see a factor . this has two function . since it based on % , when you buy you want to be buying in upswing
so let factor let say of 0.8 (is 0.8% above the entry ) this to make sure we buy in upswing and vice versa when we sell. this to correct many wrong entry of the rsi . the other function is important in the repainting model since it reduce the repainting by allot.
the min distance in menu is to control the difference between the two rsi (red color and the blue color= slow and fast)
for Forex i find factor of 0.1 % in the repaint model to work find
on Crypto best is between 0.5 to 1
there is option to check and see if stop loss and take profit improve your profit or not (i put both on very high level so it will not be a factor but you can change it as you wish
you can test to see if it better to go longs or shorts in this model or both direction
i put the setup of 50% eqiuty maybe it too much but it you choice if you test the model to reduce it to proper amount (best is 10-30%)
The repainting model is much more profti but does not matter what i do to correct it is sometime repaint. most of time it actual work fine so it your choice if you want to use it or not . just be sure on what you are doing if you put money on it
the non repaint model is much more safe nut much less profit. still it can make profit with proper setting can work very nice
so if you are not sure what you doing the use the more stable one and remove the repaint in the option
if you have any question just pm or write remarks

[STRATEGY] Moving Average CrossoverHello friends,
This is a comprehensive backtesting engine for Moving Average crossover strategies, supporting over 63 types of moving averages and filters. It allows you to test, compare, and optimize crossover behaviors between any two moving averages with flexible profit and risk management tools.
Built upon the Moving Average Crossover foundation, this advanced version lets you manually backtest more than 4096 combinations of moving average types. When combined with customizable periods, take-profits, and stop-loss levels, the total number of possible configurations becomes virtually unlimited.
🛠 How It Works
The system tests crossovers between two selected moving averages, with full control over their types, lengths, and trading direction. Integrated bracket settings enable dynamic take-profit, stop-loss, and trailing-stop management using units such as % , ATR , points , pips , or ticks .
You can restrict backtesting to a custom date range for focused performance evaluation or run it across the instrument’s full history.
🔥 Key Features
Supports 63+ moving average and filter types — including algorithms by Ehlers , Jurik , Kaufman , Apirine , Tillson , and Dürschner
Customizable MA types, periods, and strategy direction
Full-featured bracket control: TP, SL, and TSL in ATR, %, points, pips, or ticks
Backtest window customization (start, end, or range)
Direction filter: Longs only, Shorts only, or Both
Dynamic trade labeling and color-coded visualization
Option to exit only at TP, SL, or TSL
If you'd like access or have any questions, feel free to reach out to me directly via DM.
👋 Good luck and happy trading!
Skrip berbayar

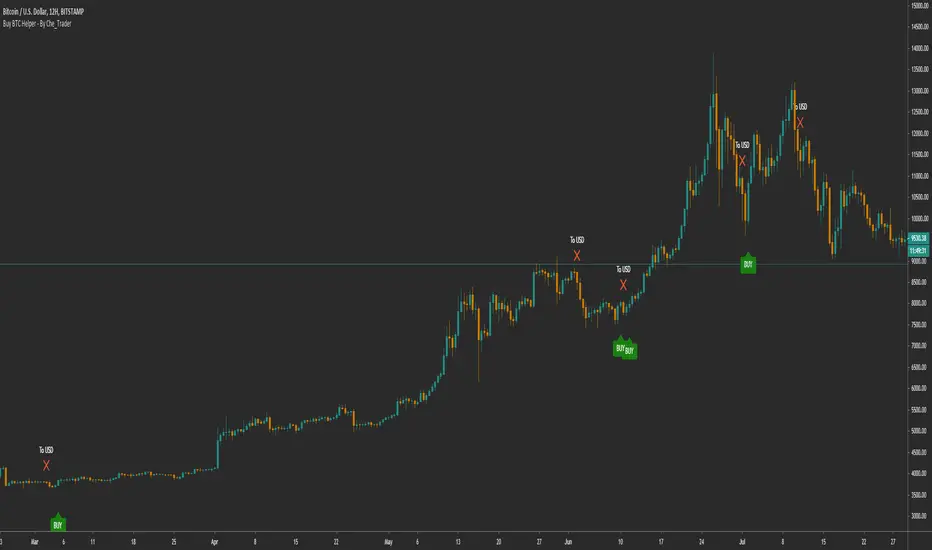
Buy BTC Helper - Buy SPOT, sell to USD (BTC-ETH) - By Che_TraderBuy BTC Helper - Buy SPOT, sell to USD (BTC-ETH) - By Che_Trader
The Buy Helper is specially designed for users who want to invest in BTC in the long term.
Usually you will make about 20-25 trades per year in spot trading.
You do not need a margin account or understand anything about trading.
Just follow the "BUY" and "To usd" signals to make sure you are on trend when BTC goes up but also take profit when BTC starts going down.
This simple tool has beaten the HOLD in all the years tested, also in bull trend or bear trend.
We'll develop this better.
*****************************************************************************************************************************************************************************
General stats from 2017 to 2020 are in the bottom, These are:
(**All data include 0.15% fees+slippage what is more than double the normal fees**)
- 8462% Gains (compound)
- 72 transactions
- 3.238 Profit Factor
- 18.58% Max drawdown
*****************************************************************************************************************************************************************************
The year-by-year analysis is very interesting:
*****************************************************************************************************************************************************************************
2017 HOLD result
+1254%
Buy helper 2017 results:
- +1214.5 % Gains
- 19 transactions
- 11% max drawdown
The 2017 profits are very similar, so you can expect similar win in next bull run.
This is something you'd expect, but it's hard to get in a bot.
*****************************************************************************************************************************************************************************
*****************************************************************************************************************************************************************************
2018 Hold Result
-71%
Buy helper 2018 results:
- +59% Gains
- 21 transactions
- 13.53% max drawdown
These results are particularly impressive. In a year in which BTC declined 72% and with a strategy of only LONG,
that is, without being able to take profit from the crashes,
we were able to finish the year with more than 59% of the money we made on the 2017 bull run.
*****************************************************************************************************************************************************************************
*****************************************************************************************************************************************************************************
2019 Hold Result
+94%
Buy helper 2019 results:
- +202% Gains
- 20 transactions
- 10.4% max drawdown
In 2019 with the buy helper you gained +100% the performance of hold BTC
*****************************************************************************************************************************************************************************
*****************************************************************************************************************************************************************************
2020 Hold Result (up to 04 may 2020)
+24.5%
Buy helper 2020 results:
- +39% Gains
- 11 transactions
- 15.43% max drawdown
In 2020 with the buy helper you gained +50% the performance of hold BTC
*****************************************************************************************************************************************************************************
*****************************************************************************************************************************************************************************
To get access, you can send me a PM here or at a link in the tradingview profile.
*****************************************************************************************************************************************************************************
Gap Trading Strategy: CME BitcoinI created a strategy which finds gaps on CME Futures market for Bitcoin, BTC1! and opens a long or short position on the crypto exchange depending on what kind of gap was found (up or down) on CME.
Up gap: today open price > previous day high price
Down gap: today open price < previous day low price
Two lines below the main chart show when gaps appear. The green line represents the size of up gaps, when it crosses zero it gives a long signal. The red line - represents the size of down gaps, when it crosses zero - short signal.
Instead of having to look between multiple charts, this simply overlays the past weeks open and close should a gap appear.
Usage:
Strategy flips long / short depending of indicator signals. It could cut the position by stop loss or take profit.
Features:
ability to set stop loss and take profit in %
ability to set delta for gaps (if you want to filter small ones)
ability to choose strategy type. Standart: Long Up/Short Down || Inverse: Short Up/Long Down.
Backtesting:
Backtested on BTCPERP ( FTX ) and XBTUSD (Bitmex).
It shows a low drawdown, a small number of trades and 50% of profit for the 2020.
For example, I set high delta for down gaps to filter small ones
Strategy doesn't repaint.

TARI FX USOILHi guys,
this is a brand new strategy for USOIL, WTI.
It works on daily chart, so basically you can watch it just a few seconds per day. Not much time, but consistent profit.
Stop Loss is set on 500 pips, Take Profit on 600 pips, for USOIL on TVC, if you prefer OANDA set 5.000 and 6.000 pips each.
This strategy has been backtested since 1983, almost 36 years, and had nice results, 18% return per year and Max DD 30% with initial capital 1.000$ and 30 contracts size per trade.
Ask for a free trial to enjoy! And look yourself how much whould have been the profit using 100% of the equity!
Enjoy your wallet!
Tari.

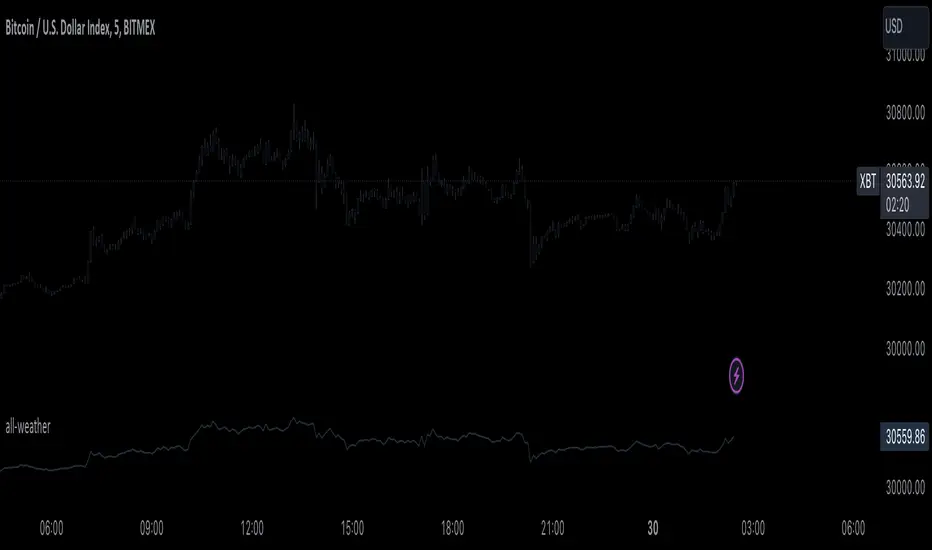
tercanomics' all-weatherIt is a strategy that takes scalps by using support/resistance levels detection when the exhaustion conditions have been met.
It is profitable to take scalp positions with reversals on sideways market by its nature, as well as its entry and exit prices, as they are being used as take profit and stop loss levels. If there is already an existing trend that one wants to follow, this strategy can meet the need for signals in the trends direction within a low time frame, whereas enter and exit prices can be used for dynamic support and resistance levels for manual trades within high time frames.
Besides the fact that it is designed for every market and every product, Volume Filter and some specific levels like Stop-Loss & Dollar-Cost Averaging percentages were created for BitMEX: XBTUSD, 1-minute time frame.
The backtest equations have been calculated with an assumption of the use of 100% of the equity and depending on the chosen exchange to trade, there will be market fee (commission) needed.
PM us to obtain access.
Special thanks to @hophop
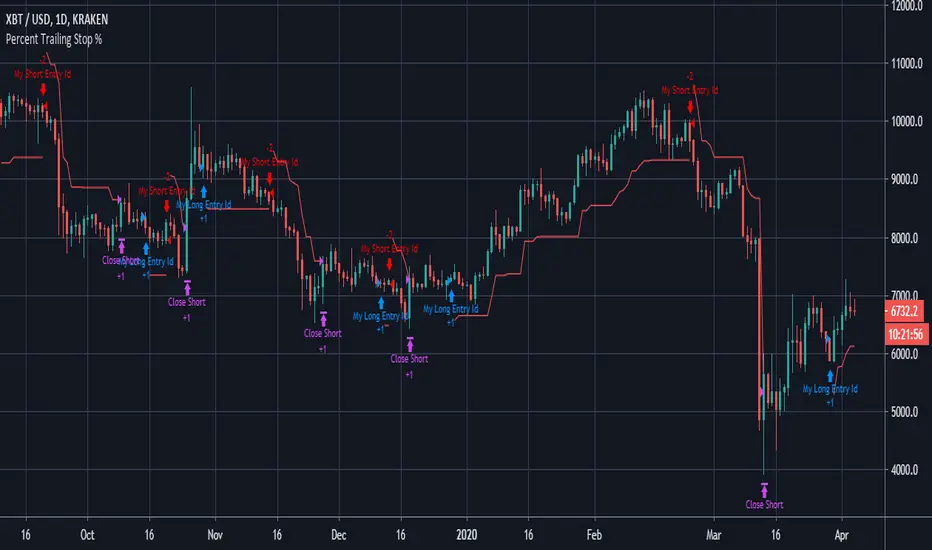
Percent Trailing Stop %===========
Percent Trailing Stop %
===========
Another Stop Loss Indicator today - our last Fixed SL/TP script went down quite well, this one is for adding a Percent Trailing Stop from Entry Price to your own strategy.
You can ignore the actual entry/exit orders - they're based on a simple MA cross and are therefore NOT relevant, NOT profitable and NOT recommended!
You should be using this code as a way of adding a % Trailing Stop to your own scripts - hope it helps!
You should also notice that a generally considered losing strategy (a simple MA cross) could actually become profitable with careful money management - try combining this Trailing Stop script with our Fixed Stop/Take Profit script for really accurate management of your capital.
-----------
Good Luck and Happy Trading!
VEST [mcristianrios] StrategyVEST is the intelectual part of two indicators to enter and exit Long or Short trades with ease.
The core functionality will not be fully explained but why VEST?
Volume: There are three configurations base on Volume in order to operate in favor of the market.
Ema vs Ema: There are three configurations base on two EMAs crossing each other.
Super Trend: If trend goes Long why not? Volume and EMA alone are not enough and it works as a filter to avoid not favorable trades. Factor and ATR Length are configurable.
What else do you I to offer? Oh yeah!
Going with the idea of managing risk VEST can enable up to 7 TP signals. So, if profit pips is 100 at 1:1 and take profit 2.5:1 is enabled we'll have: TP: 250pips and SL: 100pips
What markets can this indicator be used on?
Only Forex.
What time-frames can this indicator be used on?
This indicator can be used from 5 minutes up to 37 minutes.
Does Study Indicator repaint?
No
-- It should be configured to send alerts Once Per Bar Close
* Besides that the only functionality of the Study Indicator is to send Alerts *
Does the study indicator fill SL Price and TP Price on alerts?
Yes, it certainly does having one alert per Take Profit.
So can I automate this?
Of course yes! And alert messages are set by default to work with TradingConnector.
As a preview suggested configuration for a Long 2.5:1 operation looks like: long tradesymbol={{ticker}} slprice={{plot("SLLong")}} tpprice={{plot("TPLong25")}}
-----------------------------------------------------------------------------------------
This is not a free to use indicator. Get in touch with me if you would like access to both indicators for a free trial before deciding on a paid access for a period of your choice.
-----------------------------------------------------------------------------------------

DMT Autobot StrategyDMT its a Modified homemade Trend Reversal Indicator base on Volatility & Average true range
You have to have a defined trading plan and you also have to believe it. For this, it is necessary to have coordination and harmony between the conscious and subconscious part of the individual, That is why it is so difficult for most retail traders to be profitable
ĐΜŦ is designed to identify spots in the market that offer some of the most suitable buy and sell scalping trading opportunities plus swing trading over runs.
ĐΜŦ is comprised of three inputs, which are helping to identify the volatility of a security. To determine the level of volatility there are three ranges included in the equation
Input 1 - Current Day's Range
Input 2 - How High has the security risen from the previous day's close
Input 3 - How low has the security dropped from the previous day's close
One of the greatest challenges for new traders is avoiding drawdowns on their account. Drawdowns are what kills a trader's ability to consistently earn over the long haul and creates enormous emotional pain and turmoil.
Drawdowns are a result of two factors:
(1) over-leverage and
(2) extremely volatile stocks. One could argue that if you get to number 1 right, the volatility is irrelevant; however, these two elements are not always mutually exclusive.
HOW TO USE
Buy and sell signals for entry
and 1 take profit levels
1 adjustable stop loss level for each direction.
easy to set up with Autobot service and alert system trading
