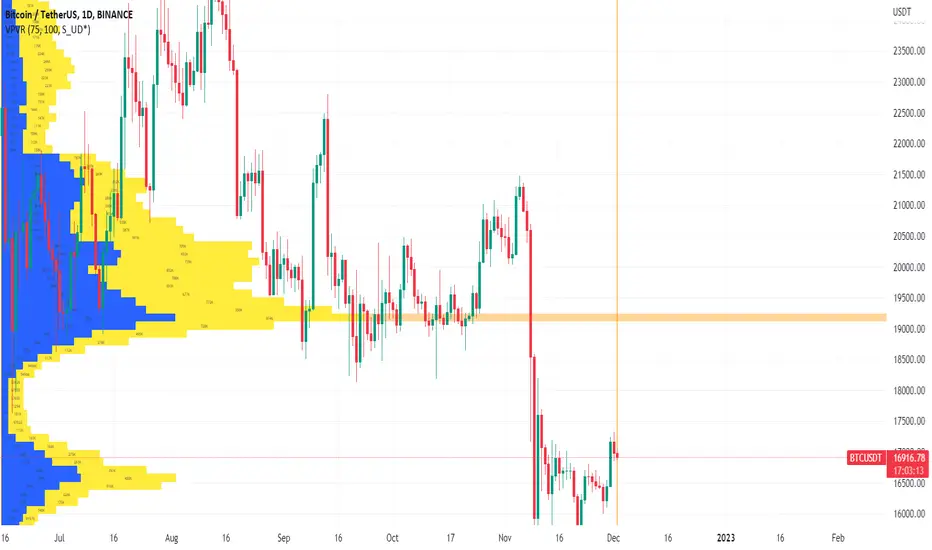
Volume Profile Visible Range For All AccountsVolume Profile Visible Range For All Accounts is displaying volume from price perspective. It’s done by summing volume by the “estimated” transaction price. This version is estimating it based on public volume data so it can be used with any account.
Volume Profile is a powerful tool commonly used by PRO users, to disseminate its use also by users who operate on basic volume data, we have prepared a set of scripts:
Volume Profile For All Accounts – Analyze last 50-20000 bars.
Volume Profile From Date For All Accounts – Analyze all bars since start date.
Volume Profile Range For All Accounts – Analyze bars in a range between start and end date.
Volume Profile Visible Range For All Accounts – Analyze bars in the range visible on the screen.
If after reading script description something is not clear, do not hesitate to ask. We are helping all users.
Script Settings:
| SCANNER VISUALIZATION |
Rows – Number of rows
Width – Width of the visualization.
Position – Position of the visualization:
S_DU – At START of the area (left edge of the screen), DOWN first
S_UD – At START of the area (left edge of the screen), UP first
BE_DU – At BEFORE END of the area, DOWN first
BE_UD – At BEFORE END of the area, UP first
E_DU – At END of the area, DOWN first
E_UD – At END of the area, UP first
Color Up – Color of volume classified as move Up, or Both if separation is off.
Color Down - Color of volume classified as move Down
Color Border – Border color.
Up/Down separate – Draw separate volume classified as Up and Down
Show values – Showing volume values of the bars.
Troubleshooting:
In case of any problems, send error details to the author of the script.
Cari dalam skrip untuk "the script"
Time Machine█ OVERVIEW
This script is designed to display future and current time resistance levels based on multiple techniques such as candle behaviors and count and some significant financial times according to Gann and more.
Each chart consists of an X-Axis ( time ) and a Y-Axis ( price ). Price can travel up and down giving you both support and resistance levels, on the other hand, time only travels forward which is why they are called time resistance levels.
Time resistance happens at multiple significant places. Have you noticed that when a triangle breaks north or south that the tip of the triangle acts as time resistance level where something happens ? Many patterns and techniques are designed
to detect and these levels through patters, candle behavior and more. This script aims to assist in detecting these levels ahead of time or at candle opens . This is a very important point. A signal of time resistance can be displayed at candle open
or ahead of time. both of these cases mean that the time resistance is confirmed. These resistance levels are rated on a scale from 0 to 3 and this scale could change and more filtering could be applied in the future to make this script
even more powerful. I would say this is a functional beta version ( v0.5 ) that could be improved upon and that's what I intend to do. scroll down to see if there are any other upgrades to this script. Each time frame has its own time resistance levels. Future levels could appear at any point;
for example, if there are no future time resistance levels within the next 6 days -lets say,- this does not mean that one doesn't appear tomorrow. A regular check would give you an edge in this script. Of course this is something that can be improved in the near future. This script does not reprint ( confirmed data does not change ) but more future data can be added no previous data.
Enjoy!
█ Future Plans and upgrades to this script may include :
1. Adding more astro influencers into the script.
2. Fine tuning the script a bit more to filter unwanted noise.
3. Adding toggle switches for users to select from. ( toggle between multiple techniques )
and more! feel free to let me know what you'd like to see!
█ How to use :
1. Put the script on your chart
give the script a few seconds and you should be set.
This script is coded as an addon to the Gann ToolBox package/scripts.

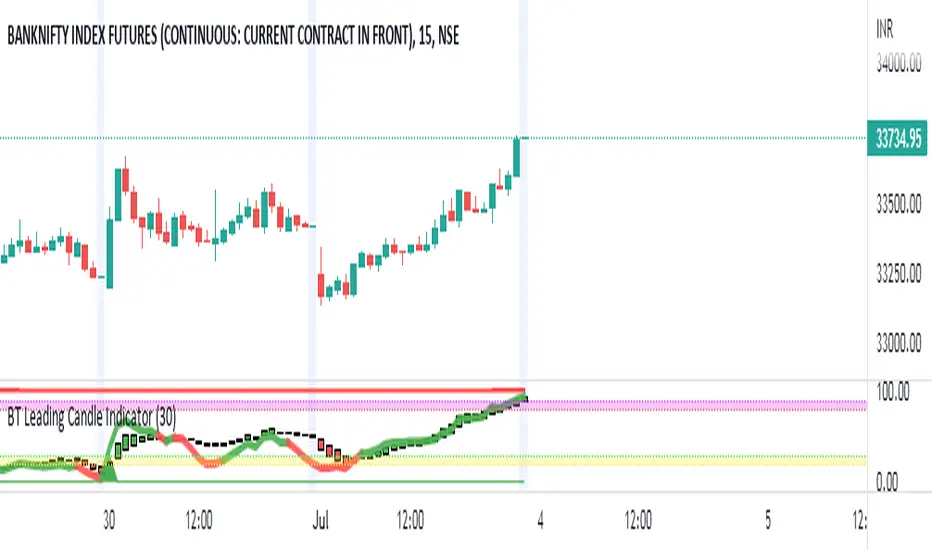
BT Leading Candle IndicatorThe oscillator display consists of 3 lines (K, D and J - hence the name of the display) and 2 levels. K and D are the same lines you see when using the stochastic oscillator. The J line in turn represents the deviation of the D value from the K value. The convergence of these lines indicates new trading opportunities. Just like the Stochastic Oscillator, oversold and overbought levels correspond to the times when the trend is likely to reverse.
Function
BT Leading KDJ Candle Indicator use candles to indicate KD relationship. E.g. yellow candles for bull (K>=D) and fuchsia candles for bear (K=D and fuchsia for K KDJ K value
d --> KDJ D value
buysig --> KD buy signal in green triangle
selsig --> KD sell signal in red triangle
leadingline --> colorful leading line for KDJ
Pros and Cons
Pros:
1. Candle height can indicates the strength of trend and different colors are used for indicating KD relationship
2. a leading line is added as aux method to confirm KDJ signal
Cons:
1. It may satruate for extreme conditions of long and short as described in the chart, which is inherent KDJ shortcoming.
2. Not accurate for long and short entries and need filtering out noise and fake signal.
Remarks
More direct to observe and confirm trend with the leading line.
Read me
In real life, I am a prolific inventor. I have successfully applied for more than 60 international and regional patents in the past 12 years. But in the past two years or so, I have tried to transfer my creativity to the development of trading strategies. Trading view is the ideal platform for me. I am selecting and contributing some of the hundreds of scripts to publish in Trading view community. Welcome everyone to interact with me to discuss these interesting pine scripts.
The scripts posted are categorized into 5 levels according to my efforts or man hours put into these works.
Level 1 : interesting script snippets or distinctive improvement from classic indicators or strategy. Level 1 scripts can usually appear in more complex indicators as a function module or element.
Level 2 : composite indicator/strategy. By selecting or combining several independent or dependent functions or sub indicators in proper way, the composite script exhibits a resonance phenomenon which can filter out noise or fake trading signal to enhance trading confidence level.
Level 3 : comprehensive indicator/strategy. They are simple trading systems based on my strategies. They are commonly containing several or all of entry signal, close signal, stop loss, take profit, re-entry, risk management, and position sizing techniques. Even some interesting fundamental and mass psychological aspects are incorporated.
Level 4 : script snippets or functions that do not disclose source code. Interesting element that can reveal market laws and work as raw material for indicators and strategies. If you find Level 1~2 scripts are helpful, Level 4 is a private version that took me far more efforts to develop.
Level 5 : indicator/strategy that do not disclose source code. private version of Level 3 script with my accumulated script processing skills or a large number of custom functions. I had a private function library built in past two years. Level 5 scripts use many
CAGR Custom Range█ OVERVIEW
This script calculates an annualized Compound Annual Growth Rate from two points in time which you can select on the chart. It previews an upcoming feature where Pine scripts will be able to provide users with interactive inputs for time and price values.
👉🏼 We are looking for feedback on our first take of this feature.
Please comment in this publication's "Comments" section if you have suggestions for improvement.
█ HOW TO USE IT
When you first load this script on a chart, you will enter the new interactive selection mode. At that point, the script is waiting for you to pick two points in time on your chart by clicking on the chart. Once you select the two points, the script will find the close value for each of the two selected bars, and calculate the CAGR value from them. It will then display a line between the two points, and the CAGR value above or below the last point in time.
If the CAGR value is positive, the line and label will display in their "up" color (see the "🠅" color in the script's "Settings/Inputs" tab), otherwise they appear in their "down" color (the "🠇" color in the inputs). You can also control the line's width from the inputs.
You have the option of comparing the chart's CAGR value with that of another symbol, which you specify in the "Compare to" input. When a comparison is made, the label's background color will be dependent on the result of the comparison. The line's color will still be determined by the chart's value.
Once time points have been selected on the chart and the script is displaying the line, you can change the time points by clicking on the script's name on the chart. A small, blue rectangular handle will then appear for each point, which you can then grab and move. If you reset the inputs using the "Defaults/Reset Settings" button in the script's inputs, the two time points will reset to the beginning of September and October 2021, respectively.
█ CONCEPTS
The CAGR is a notional, annualized growth rate that assumes all profits are reinvested. It calculates from the close value of the two end points. It does not account for drawdowns, so it does not calculate risk. It can be used as a yardstick to compare the performance of two instruments. Because it annualizes values, the function requires a minimum of one day between the two end points (annualizing returns over smaller periods of times doesn't produce very meaningful figures).
█ LIMITATIONS
• The two selected points must be distant from a minimum of one day. A runtime error will occur otherwise.
• There is currently no way to restart the interactive mode from scratch without re-adding the script to the chart.
• The points in time you select on one chart may map quite differently on other charts,
depending on their constituent bars (e.g., intraday charts for 24x7 and conventional markets).
█ FOR PINE CODERS
• Our script uses the most recent version of Pine, as the `//@version=5` compiler directive indicates.
• Interactive inputs were a long-standing and highly-requested feature by our beloved community of Pine coders.
We hope you find this first step promising, as it opens up entirely new possibilities for both Pine coders and script users.
You can, for example, use interactive inputs to draw shapes with your scripts, or support and resistance levels, etc.
We're sure you'll come up with more creative uses of the feature than we could ever dream up )
• Interactive inputs are implemented for input.time() and input.price() , the specialized input functions now available in v5.
See the User Manual's new page on inputs for more information about them.
You can also create one interactive input for both time and price values
by using the same `inline` argument in a pair of input.time() and input.price() function calls.
• Our min/max filtering when initializing `entryTime` and `exitTime` will handle cases where
the script user inverts the two points on the chart.
• The script uses the new runtime.error() function to throw an error in the `if days < 1` conditional structure.
• We use the `cagr()` function from our recently-published ta Pine library .
Pine libraries — not to be confused with the Public Library showcasing scripts published by our community of Pine coders —
are one of the new features available with the recent Pine v5.
• Note that our `strRightOf()` function cannot be used to generate ticker identifier strings for use in `request.*()` functions.
This is because it produces results of "series" form while the functions require
arguments of "simple" form for their `symbol` or `ticker` parameters.
Have a look at our new User Manual page on Pine's Type system if you need to brush up on Pine forms and types.
• We use a simple, repainting request.security() call because our calculations are not used to generate orders or alerts.
• We document our user-defined functions using the same compiler directives used in exported functions in libraries.
It will make conversion of those functions to library format easier if we ever choose to do so.
• We use two Unicode hair spaces (U+200A) to push the "%" sign slightly away from values in our str.format() calls.
While the impact is minimal, it increases readability.
• Note the `priceIsHigh` logic used to determine if we place the label above or below bars.
When price is higher than recent prices, we place the label above the bar, otherwise we place it below.
It's not foolproof but it provides optimal positioning most of the time.
• The point of the complicated "bool" expression initializing `displayCAGR` is to ensure that we only draw the line and labels once.
When no comparison with another symbol is made, this occurs the first time we encounter a non- na value from the `cagr()` function.
When a comparison is required, it occurs the first time both values are not na .
• Before all mentions of "CAGR" in our description, we use a Unicode zero-width space (U+200B)
to prevent the auto-linking feature to kick in for the term.
This prevents the dashed underscore and a link like this (CAGR) from appearing every time "CAGR" is mentioned.
• With Pine v5, the `study()` declaration statement was renamed to indicator() .
Accordingly, we will be eliminating the use of the "study" term from documentation and the UI.
The generic "script" term will continue to designate Pine code that can be an indicator, a strategy or a library, when applicable.
• We followed our new Style guide recommendations to write our script.
• We used the techniques explained in the How We Write and Format Script Descriptions publication by PineCoders.
• That's it! We've covered all the new features and tricks we used. We sincerely hope you enjoy the new interactive inputs,
and please remember to comment here if you have suggestions for improvement. 💙
Look first. Then leap.

[blackcat] L1 Enhanced DMILevel: 1
Background
The Directional Movement Index (DMI) is an indicator developed by J. Welles Wilder in 1978 that shows the direction in which the price of an asset is moving. The indicator does this by comparing previous highs and lows and drawing two lines: a positive directional movement line (+ DI) and a negative directional movement line (-DI). An optional third line, called the Average Directional Index (ADX), can also be used to measure the strength of the upward or downward trend.
When + DI is above -DI there is more upward pressure than downward pressure in price. Conversely, when -DI is above + DI, there is more downward pressure on the price. This indicator can help traders estimate the direction of the trend. Crossovers between the lines are also sometimes used as trading signals to buy or sell.
Function
This is a blackcat1402 enhanced DMI indicator by counting period number of +DI and -DI relationship, overbought and oversold states are given.
Key Signal
White line --> +DI
Yellow line --> -DI
Fuchsia line --> ADX
Green line --> ADXR, or averaged ADX
red OB label --> overbought
green OS label --> oversold
Remarks
Feedbacks are appreciated.
Readme
In real life, I am a prolific inventor. I have successfully applied for more than 60 international and regional patents in the past 12 years. But in the past two years or so, I have tried to transfer my creativity to the development of trading strategies. Tradingview is the ideal platform for me. I am selecting and contributing some of the hundreds of scripts to publish in Tradingview community. Welcome everyone to interact with me to discuss these interesting pine scripts.
The scripts posted are categorized into 5 levels according to my efforts or manhours put into these works.
Level 1 : interesting script snippets or distinctive improvement from classic indicators or strategy. Level 1 scripts can usually appear in more complex indicators as a function module or element.
Level 2 : composite indicator/strategy. By selecting or combining several independent or dependent functions or sub indicators in proper way, the composite script exhibits a resonance phenomenon which can filter out noise or fake trading signal to enhance trading confidence level.
Level 3 : comprehensive indicator/strategy. They are simple trading systems based on my strategies. They are commonly containing several or all of entry signal, close signal, stop loss, take profit, re-entry, risk management, and position sizing techniques. Even some interesting fundamental and mass psychological aspects are incorporated.
Level 4 : script snippets or functions that do not disclose source code. Interesting element that can reveal market laws and work as raw material for indicators and strategies. If you find Level 1~2 scripts are helpful, Level 4 is a private version that took me far more efforts to develop.
Level 5 : indicator/strategy that do not disclose source code. private version of Level 3 script with my accumulated script processing skills or a large number of custom functions. I had a private function library built in past two years. Level 5 scripts use many of them to achieve private trading strategy.

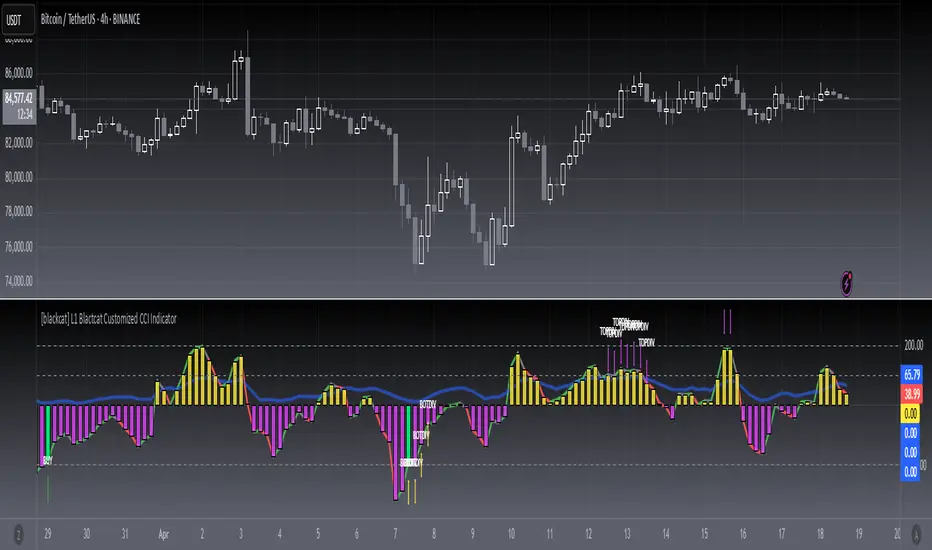
[blackcat] L1 Blackcat Customized CCI IndicatorLevel: 1
Background
This CCI indicator is blackcat customized version with enhanced features.
Function
This CCI use green line to indicate strong long trend with cci values > 0 and red line to indicate weak long trend with cci values <0. It also use yellow and fuchsia candles to present the strong and weak long trend. A green candle is used to indicate long entry, while a red candle is usded to indicate long flatten signal.
Key Signal
green line --> strong long trend
red line --> weak long trend
blue line --> trend strength indicator
SELL label --> flatten long or short entry
BUY label --> long entry
TOPDIV label --> top divergence indicator
BOTDIV label --> bottom divergence indicator
Remarks
Feedbacks are appreciated.
Readme
In real life, I am a prolific inventor. I have successfully applied for more than 60 international and regional patents in the past 12 years. But in the past two years or so, I have tried to transfer my creativity to the development of trading strategies. Tradingview is the ideal platform for me. I am selecting and contributing some of the hundreds of scripts to publish in Tradingview community. Welcome everyone to interact with me to discuss these interesting pine scripts.
The scripts posted are categorized into 5 levels according to my efforts or manhours put into these works.
Level 1 : interesting script snippets or distinctive improvement from classic indicators or strategy. Level 1 scripts can usually appear in more complex indicators as a function module or element.
Level 2 : composite indicator/strategy. By selecting or combining several independent or dependent functions or sub indicators in proper way, the composite script exhibits a resonance phenomenon which can filter out noise or fake trading signal to enhance trading confidence level.
Level 3 : comprehensive indicator/strategy. They are simple trading systems based on my strategies. They are commonly containing several or all of entry signal, close signal, stop loss, take profit, re-entry, risk management, and position sizing techniques. Even some interesting fundamental and mass psychological aspects are incorporated.
Level 4 : script snippets or functions that do not disclose source code. Interesting element that can reveal market laws and work as raw material for indicators and strategies. If you find Level 1~2 scripts are helpful, Level 4 is a private version that took me far more efforts to develop.
Level 5 : indicator/strategy that do not disclose source code. private version of Level 3 script with my accumulated script processing skills or a large number of custom functions. I had a private function library built in past two years. Level 5 scripts use many of them to achieve private trading strategy.
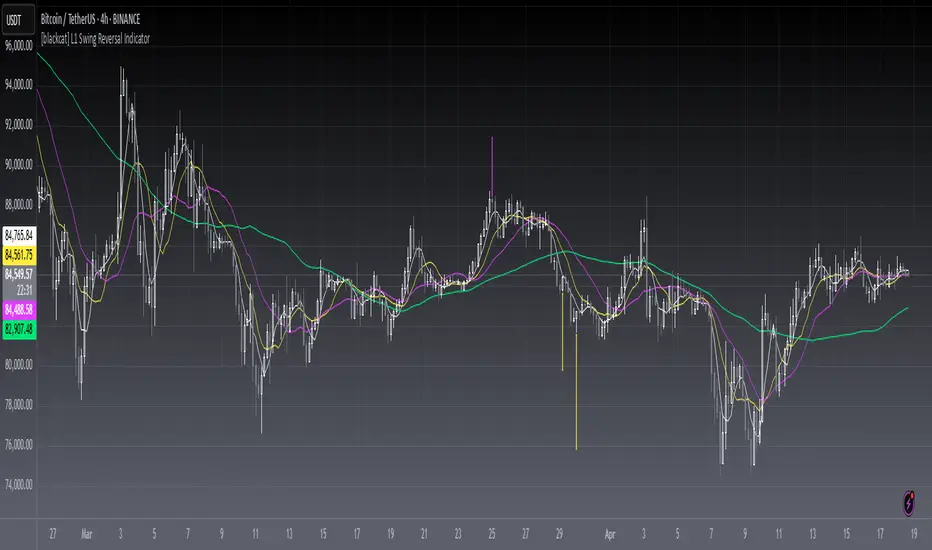
[blackcat] L1 Swing Reversal IndicatorLevel: 1
Background
Many asked me about swing reversal indicators. There are many but less of them can guarantee high win rate. Because market is complex, the reversals can be nested together, which means sub level reversals will be contained in higher level waves. This can be well explained by Elloit wave theory.
Function
Here it is a simple moving average based swing reversal indicator as an example for many others to improve it. Although it simple, it could be very powerful to dedicated trading pairs in specific time frame. One can adjust N1~N4 as SMA peiords from short to long to customized this indicator or even by trying different moving average types to enhance its accuracy.
Key Signal
N1~N4 --> SMA look back periods
OB --> Overbought Threshold
OS --> Oversold Threshold
Pros and Cons
Simpe but powerful. More feedbacks are appreciated.
Remarks
Easy to be customized or integrated to your trading system.
Readme
In real life, I am a prolific inventor. I have successfully applied for more than 60 international and regional patents in the past 12 years. But in the past two years or so, I have tried to transfer my creativity to the development of trading strategies. Tradingview is the ideal platform for me. I am selecting and contributing some of the hundreds of scripts to publish in Tradingview community. Welcome everyone to interact with me to discuss these interesting pine scripts.
The scripts posted are categorized into 5 levels according to my efforts or manhours put into these works.
Level 1 : interesting script snippets or distinctive improvement from classic indicators or strategy. Level 1 scripts can usually appear in more complex indicators as a function module or element.
Level 2 : composite indicator/strategy. By selecting or combining several independent or dependent functions or sub indicators in proper way, the composite script exhibits a resonance phenomenon which can filter out noise or fake trading signal to enhance trading confidence level.
Level 3 : comprehensive indicator/strategy. They are simple trading systems based on my strategies. They are commonly containing several or all of entry signal, close signal, stop loss, take profit, re-entry, risk management, and position sizing techniques. Even some interesting fundamental and mass psychological aspects are incorporated.
Level 4 : script snippets or functions that do not disclose source code. Interesting element that can reveal market laws and work as raw material for indicators and strategies. If you find Level 1~2 scripts are helpful, Level 4 is a private version that took me far more efforts to develop.
Level 5 : indicator/strategy that do not disclose source code. private version of Level 3 script with my accumulated script processing skills or a large number of custom functions. I had a private function library built in past two years. Level 5 scripts use many of them to achieve private trading strategy.
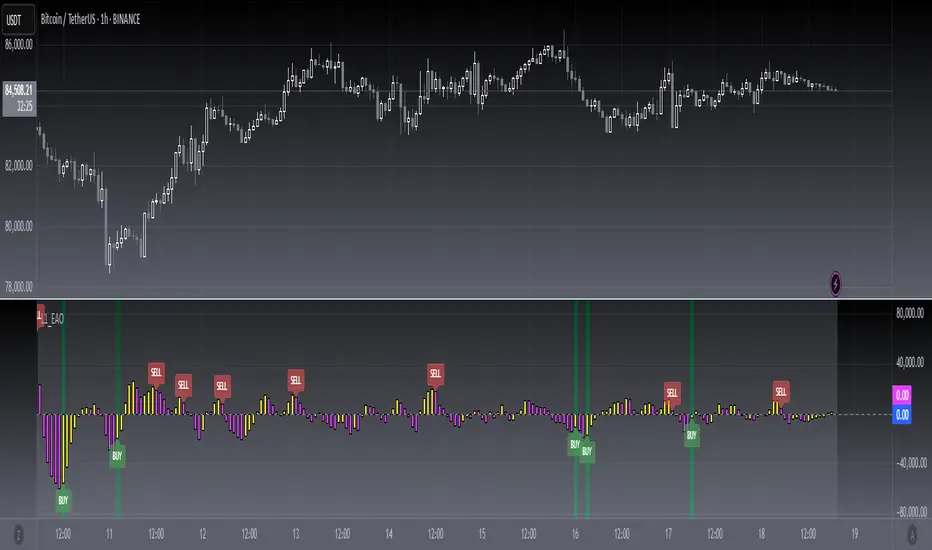
[blackcat] L1 Enhanced Awesome OscillatorLevel: 1
Background
The awesome oscillator is just that, an oscillator by Bill Williams. In contrast to the slow stochastics, which ranges from +100 to -100, the fantastic oscillator is limitless. On the surface, one might think that the fantastic oscillator is made up of a complicated algorithm developed by a Whiz Kid from M.I.T. You will be surprised to learn that the indicator is a basic calculation of two simple moving averages. I made some improvements on it by introducing some novel moving average functions and choppiness index as L1 Enhanced Awesome Oscillator.
Function
Yellow bars for bull and fuchsia bars for bear with candles. Buying and selling signal is provided. Divergence signal is provided. Choppiness index is used as a green background color, which indicates trends when it under green color. The choppiness index is used to filter out entry signals.
Key Signal
yellow candle --> bull
fuchsia candle --> bear
yellow DIV label --> bottom divergence
fuchsia DIV label --> top divergence
red SELL label --> short entry
green BUY label --> long entry
Remarks
Feedbacks are appreciated.
Readme
In real life, I am a prolific inventor. I have successfully applied for more than 60 international and regional patents in the past 12 years. But in the past two years or so, I have tried to transfer my creativity to the development of trading strategies. Tradingview is the ideal platform for me. I am selecting and contributing some of the hundreds of scripts to publish in Tradingview community. Welcome everyone to interact with me to discuss these interesting pine scripts.
The scripts posted are categorized into 5 levels according to my efforts or manhours put into these works.
Level 1 : interesting script snippets or distinctive improvement from classic indicators or strategy. Level 1 scripts can usually appear in more complex indicators as a function module or element.
Level 2 : composite indicator/strategy. By selecting or combining several independent or dependent functions or sub indicators in proper way, the composite script exhibits a resonance phenomenon which can filter out noise or fake trading signal to enhance trading confidence level.
Level 3 : comprehensive indicator/strategy. They are simple trading systems based on my strategies. They are commonly containing several or all of entry signal, close signal, stop loss, take profit, re-entry, risk management, and position sizing techniques. Even some interesting fundamental and mass psychological aspects are incorporated.
Level 4 : script snippets or functions that do not disclose source code. Interesting element that can reveal market laws and work as raw material for indicators and strategies. If you find Level 1~2 scripts are helpful, Level 4 is a private version that took me far more efforts to develop.
Level 5 : indicator/strategy that do not disclose source code. private version of Level 3 script with my accumulated script processing skills or a large number of custom functions. I had a private function library built in past two years. Level 5 scripts use many of them to achieve private trading strategy.
[blackcat] L1 Digitized KDJLevel: 1
Background
This is a simple model for digitized KDJ
Function
Lime for bull and Red for bear with digitized candles.
Key Signal
lime candle --> bull
red candle --> bear
blue candle --> watch
yellow candle --> long entry
fuchsia candle --> overbought
Remarks
Feedbacks are appreciated.
Readme
In real life, I am a prolific inventor. I have successfully applied for more than 60 international and regional patents in the past 12 years. But in the past two years or so, I have tried to transfer my creativity to the development of trading strategies. Tradingview is the ideal platform for me. I am selecting and contributing some of the hundreds of scripts to publish in Tradingview community. Welcome everyone to interact with me to discuss these interesting pine scripts.
The scripts posted are categorized into 5 levels according to my efforts or manhours put into these works.
Level 1 : interesting script snippets or distinctive improvement from classic indicators or strategy. Level 1 scripts can usually appear in more complex indicators as a function module or element.
Level 2 : composite indicator/strategy. By selecting or combining several independent or dependent functions or sub indicators in proper way, the composite script exhibits a resonance phenomenon which can filter out noise or fake trading signal to enhance trading confidence level.
Level 3 : comprehensive indicator/strategy. They are simple trading systems based on my strategies. They are commonly containing several or all of entry signal, close signal, stop loss, take profit, re-entry, risk management, and position sizing techniques. Even some interesting fundamental and mass psychological aspects are incorporated.
Level 4 : script snippets or functions that do not disclose source code. Interesting element that can reveal market laws and work as raw material for indicators and strategies. If you find Level 1~2 scripts are helpful, Level 4 is a private version that took me far more efforts to develop.
Level 5 : indicator/strategy that do not disclose source code. private version of Level 3 script with my accumulated script processing skills or a large number of custom functions. I had a private function library built in past two years. Level 5 scripts use many of them to achieve private trading strategy.

[blackcat] L1 MACD with Overbought and Oversold DetectionLevel: 1
Background
This MACD is designed with unique oversold and overbought detections, which you may not sell or buy immedidately. You may need to watch the trend movements and decide to buy or sell on current or next goldcross and deadcross respectively.
Function
Add oversold and overbought detections for MACD to locate proper entry point.
Key Signal
diff--> MACD fast line
dea --> MACD slow line
macdhisto --> MACD histogram
overbought --> overbought signal
oversold --> oversold signal
Pros and Cons
It assits you to locate a rough zone for overbought and oversold in classic MACD indicator. Classic MACD indicator does not have this function.
Remarks
Since we cannot look into the future, so it does not inform you on exact entries but alerts of current or next cross may be a good opportunity.
Readme
In real life, I am a prolific inventor. I have successfully applied for more than 60 international and regional patents in the past 12 years. But in the past two years or so, I have tried to transfer my creativity to the development of trading strategies. Tradingview is the ideal platform for me. I am selecting and contributing some of the hundreds of scripts to publish in Tradingview community. Welcome everyone to interact with me to discuss these interesting pine scripts.
The scripts posted are categorized into 5 levels according to my efforts or manhours put into these works.
Level 1 : interesting script snippets or distinctive improvement from classic indicators or strategy. Level 1 scripts can usually appear in more complex indicators as a function module or element.
Level 2 : composite indicator/strategy. By selecting or combining several independent or dependent functions or sub indicators in proper way, the composite script exhibits a resonance phenomenon which can filter out noise or fake trading signal to enhance trading confidence level.
Level 3 : comprehensive indicator/strategy. They are simple trading systems based on my strategies. They are commonly containing several or all of entry signal, close signal, stop loss, take profit, re-entry, risk management, and position sizing techniques. Even some interesting fundamental and mass psychological aspects are incorporated.
Level 4 : script snippets or functions that do not disclose source code. Interesting element that can reveal market laws and work as raw material for indicators and strategies. If you find Level 1~2 scripts are helpful, Level 4 is a private version that took me far more efforts to develop.
Level 5 : indicator/strategy that do not disclose source code. private version of Level 3 script with my accumulated script processing skills or a large number of custom functions. I had a private function library built in past two years. Level 5 scripts use many of them to achieve private trading strategy.

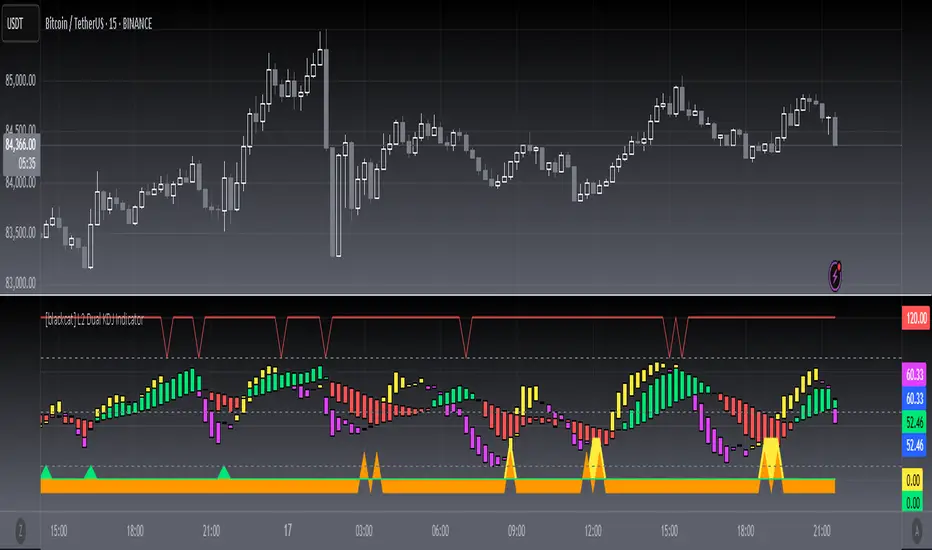
[blackcat] L2 Dual KDJ IndicatorLevel: 2
Background
I am wondering how it works with short-term and middle-term KDJ indicators put together to emulate MTF.
Function
Use a fast and a slow KDJ to combine signal together to judge trend
Key Signal
oversold --> oversold signal for long
reentry --> re-entry signal for long
addmore --> buy more signal for long
sellready --> overbought signal for short
Pros and Cons
Although it can filter out some noise, dual KDJ still have saturation issue. It may not so reliable when there are extreme market movements as similar to signle KDJ indicators.
Remarks
It improves KDJ to some extent, but it does not satisfy me yet. Keep improving.
Readme
In real life, I am a prolific inventor. I have successfully applied for more than 60 international and regional patents in the past 12 years. But in the past two years or so, I have tried to transfer my creativity to the development of trading strategies. Tradingview is the ideal platform for me. I am selecting and contributing some of the hundreds of scripts to publish in Tradingview community. Welcome everyone to interact with me to discuss these interesting pine scripts.
The scripts posted are categorized into 5 levels according to my efforts or manhours put into these works.
Level 1 : interesting script snippets or distinctive improvement from classic indicators or strategy. Level 1 scripts can usually appear in more complex indicators as a function module or element.
Level 2 : composite indicator/strategy. By selecting or combining several independent or dependent functions or sub indicators in proper way, the composite script exhibits a resonance phenomenon which can filter out noise or fake trading signal to enhance trading confidence level.
Level 3 : comprehensive indicator/strategy. They are simple trading systems based on my strategies. They are commonly containing several or all of entry signal, close signal, stop loss, take profit, re-entry, risk management, and position sizing techniques. Even some interesting fundamental and mass psychological aspects are incorporated.
Level 4 : script snippets or functions that do not disclose source code. Interesting element that can reveal market laws and work as raw material for indicators and strategies. If you find Level 1~2 scripts are helpful, Level 4 is a private version that took me far more efforts to develop.
Level 5 : indicator/strategy that do not disclose source code. private version of Level 3 script with my accumulated script processing skills or a large number of custom functions. I had a private function library built in past two years. Level 5 scripts use many of them to achieve private trading strategy.
[blackcat] L1 Stock Volume AnalyzerLevel: 1
Background
The basic volume analysis is that buyers are in control when the price is increased. The purchase volume takes place at the offer price and represents the lowest advertised price at which sellers sell their shares. When someone buys shares at the current asking price, it shows that someone wants the shares and is included in the purchase volume metric.
Function
L1 Stock Volume Analyzer plot colorful volume candles with different meanings: red for red price bars, green for green price bars, yellow for active buying volume, fuchsia for active selling volume, navy for high active buying volume turn over rate, and white for high active selling volume turn over rate.
Key Signal
VOLUME SIGNAL:
activbuying ---> active buying volume
activselling ---> active selling volume
abtor ---> high active buying turn over rate
astor ---> high active selling turn over rate
PRICE SIGNAL:
cd ---> price covergence and divergence
positioning ---> price positioning
callthshots ---> call the shorts price signal
Pros and Cons
Pros:
1. extract volume detailed information to judge price trend together
2. price convergence and divergence help to identify long and short entry points
Cons:
1. price convergence and divergence visually works well only for <= 8H time frame
2. this indicator only works for stock trading pairs
Remarks
In order to put price and volume in a unified scale, this indicator is scaled. This scaling is not suitable for all markets. At present, it has only been optimized in the stock exchange market.
Readme
In real life, I am a prolific inventor. I have successfully applied for more than 60 international and regional patents in the past 12 years. But in the past two years or so, I have tried to transfer my creativity to the development of trading strategies. Tradingview is the ideal platform for me. I am selecting and contributing some of the hundreds of scripts to publish in Tradingview community. Welcome everyone to interact with me to discuss these interesting pine scripts.
The scripts posted are categorized into 5 levels according to my efforts or manhours put into these works.
Level 1 : interesting script snippets or distinctive improvement from classic indicators or strategy. Level 1 scripts can usually appear in more complex indicators as a function module or element.
Level 2 : composite indicator/strategy. By selecting or combining several independent or dependent functions or sub indicators in proper way, the composite script exhibits a resonance phenomenon which can filter out noise or fake trading signal to enhance trading confidence level.
Level 3 : comprehensive indicator/strategy. They are simple trading systems based on my strategies. They are commonly containing several or all of entry signal, close signal, stop loss, take profit, re-entry, risk management, and position sizing techniques. Even some interesting fundamental and mass psychological aspects are incorporated.
Level 4 : script snippets or functions that do not disclose source code. Interesting element that can reveal market laws and work as raw material for indicators and strategies. If you find Level 1~2 scripts are helpful, Level 4 is a private version that took me far more efforts to develop.
Level 5 : indicator/strategy that do not disclose source code. private version of Level 3 script with my accumulated script processing skills or a large number of custom functions. I had a private function library built in past two years. Level 5 scripts use many of them to achieve private trading strategy.

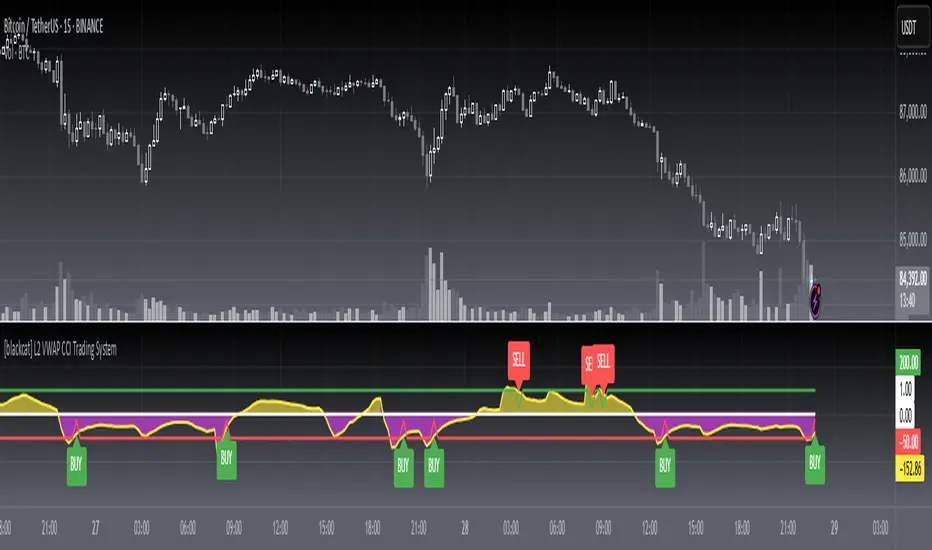
[blackcat] L2 VWAP CCI Trading SystemLevel: 2
Background
Volume-Weighted Average Price (VWAP) is a trading benchmark used by traders that indicates the average price that a security has traded for throughout the day based on volume and price. This is important as it gives traders insight into the trend and value of a security.
The Commodity Channel Index (CCI) indicator was created to identify bullish and bearish market cycles, as well as to define market turning points and the strongest and weakest market periods. CCI was developed for commodities and quickly found application in other markets, including forex.
Function
blackcat L2 VWAP CCI Trading System is an innovative indicator that combines vwap and cci indicator together. Not only long and short entries can be disclosed, but also the overbought and oversold zones are clearly observed.
Key Signal
cci ---> vwap cci indicator output
long --> long entry condition
short --> short entry condition
backtest --> indicator backtest scheme "NLX-L3 Backtest" required input source for strategy backtest
longentry --> visual long entry
shortentry --> visual short entry
Pros and Cons
Pros:
1. exact long and short entries are produced by overbought and oversold conditions
2. support "NLX-L3 Backtest" framework
Cons:
1. noise may be produced under extreme market condition
2. due to this is un-optimized version, time frame and trading pairs need to be selected
Remarks
Courtesy of @nilux "NLX-L3 Backtest" easy backtest framework for dummies.
Step by step backtest guide with "NLX-L3 Backtest" framework:
STEP1: Add this indicator into your chart
STEP2: Add "NLX-L3 Backtest" into your chart
STEP3: Click "Settings" gear icon of "NLX-L3 Backtest" to select "Select L2 Indicator" in the 1st line as "blackcat L2 VWAP CCI Trading System: backtest"
STEP4: Configure your backtest other settings under "NLX-L3 Backtest" framework
STEP5: Click "OK" and view the results in "Strategy Tester" tab
Readme
In real life, I am a prolific inventor. I have successfully applied for more than 60 international and regional patents in the past 12 years. But in the past two years or so, I have tried to transfer my creativity to the development of trading strategies. Tradingview is the ideal platform for me. I am selecting and contributing some of the hundreds of scripts to publish in Tradingview community. Welcome everyone to interact with me to discuss these interesting pine scripts.
The scripts posted are categorized into 5 levels according to my efforts or manhours put into these works.
Level 1 : interesting script snippets or distinctive improvement from classic indicators or strategy. Level 1 scripts can usually appear in more complex indicators as a function module or element.
Level 2 : composite indicator/strategy. By selecting or combining several independent or dependent functions or sub indicators in proper way, the composite script exhibits a resonance phenomenon which can filter out noise or fake trading signal to enhance trading confidence level.
Level 3 : comprehensive indicator/strategy. They are simple trading systems based on my strategies. They are commonly containing several or all of entry signal, close signal, stop loss, take profit, re-entry, risk management, and position sizing techniques. Even some interesting fundamental and mass psychological aspects are incorporated.
Level 4 : script snippets or functions that do not disclose source code. Interesting element that can reveal market laws and work as raw material for indicators and strategies. If you find Level 1~2 scripts are helpful, Level 4 is a private version that took me far more efforts to develop.
Level 5 : indicator/strategy that do not disclose source code. private version of Level 3 script with my accumulated script processing skills or a large number of custom functions. I had a private function library built in past two years. Level 5 scripts use many of them to achieve private trading strategy.
[blackcat] L2 Center Band BollingerLevel: 2
Background
Bollinger bands are a type of price envelope developed by John Bollinger , where price envelopes define upper and lower price ranges. Bollinger Bands are envelopes that are represented with a standard deviation above and below a simple moving average of price. Because the spacing of the bands is based on the standard deviation, they adjust for fluctuations in the volatility of the underlying price.
Function
L2 Center Band Bollinger takes advantage of Bollinger band to detect sideways and trends. At the same time, I made an improvement and the center Bollinger line as a fast-slow-line color band. The algorithm of the color center band is composed of price and volume information, which produces gold cross and dead cross for short term long and short entries.
Key Signal
aa10 --> bollinger middle fast line
aa12 --> bollinger middle slow line
up --> upper envelope
dn --> lower envelope
Pros and Cons
Pros:
1. it can easy see the sections of trends or sideways by width of Bollinger band
2. long and short entries are disclosed
Cons:
1. Some noise is still incorporated in trends
2. due to this is un-optimized version, time frame and trading pairs need to be selected
3. Bollinger re-entry signal is not disclosed yet
Remarks
The long and short signal is compatible to @nilux strategy backtest framework for sandardized backtest scheme: Backtest
Readme
In real life, I am a prolific inventor. I have successfully applied for more than 60 international and regional patents in the past 12 years. But in the past two years or so, I have tried to transfer my creativity to the development of trading strategies. Tradingview is the ideal platform for me. I am selecting and contributing some of the hundreds of scripts to publish in Tradingview community. Welcome everyone to interact with me to discuss these interesting pine scripts.
The scripts posted are categorized into 5 levels according to my efforts or manhours put into these works.
Level 1 : interesting script snippets or distinctive improvement from classic indicators or strategy. Level 1 scripts can usually appear in more complex indicators as a function module or element.
Level 2 : composite indicator/strategy. By selecting or combining several independent or dependent functions or sub indicators in proper way, the composite script exhibits a resonance phenomenon which can filter out noise or fake trading signal to enhance trading confidence level.
Level 3 : comprehensive indicator/strategy. They are simple trading systems based on my strategies. They are commonly containing several or all of entry signal, close signal, stop loss, take profit, re-entry, risk management, and position sizing techniques. Even some interesting fundamental and mass psychological aspects are incorporated.
Level 4 : script snippets or functions that do not disclose source code. Interesting element that can reveal market laws and work as raw material for indicators and strategies. If you find Level 1~2 scripts are helpful, Level 4 is a private version that took me far more efforts to develop.
Level 5 : indicator/strategy that do not disclose source code. private version of Level 3 script with my accumulated script processing skills or a large number of custom functions. I had a private function library built in past two years. Level 5 scripts use many of them to achieve private trading strategy.

[blackcat] L2 Bull Bear Convergence Divergence (BBCD)Level: 2
Background
A bull market is gaining ground and is economically sound, while a bear market is declining and most stocks are depreciating. The actual origins of these terms are unclear, but one reason could be that bulls attack by pulling their horns up while bears attack by brushing their paws down.
Function
L2 Bull Bear Convergence Divergence (BBCD) disclose the convergence divergence of the bull bear as a market opinion indicator. It tells you the opinion of those who are directly involved with the markets. As a trader, understanding how the convergence divergence of the bull bear works can be of great help. I inherited the traditional MACD expression method, and added golden cross (yellow cross) and dead cross (fuchsia cross) prompts, as well as bottom divergence (lime cross) and top divergence (red cross) prompts.
Key Signal
bbd --> bull bear fast line
bbdsupport --> bull bear slow line and support level
bbdgx --> bull bear gold cross in yellow
bbddx --> bull bear dead cross in fuchsia
bbotdiverg --> bull bear bottom divergence alert in lime cross
btopdiverg --> bull bear top divergence alert in red cross
Pros and Cons
Pros:
1. it can help to see the strength change of a trend in time
2. visual bottom and top divergence alerts are provided
Cons:
1. it disclose the strength change better than price change
Remarks
Bull Bear Convergence Divergence (BBCD) is new.
Readme
In real life, I am a prolific inventor. I have successfully applied for more than 60 international and regional patents in the past 12 years. But in the past two years or so, I have tried to transfer my creativity to the development of trading strategies. Tradingview is the ideal platform for me. I am selecting and contributing some of the hundreds of scripts to publish in Tradingview community. Welcome everyone to interact with me to discuss these interesting pine scripts.
The scripts posted are categorized into 5 levels according to my efforts or manhours put into these works.
Level 1 : interesting script snippets or distinctive improvement from classic indicators or strategy. Level 1 scripts can usually appear in more complex indicators as a function module or element.
Level 2 : composite indicator/strategy. By selecting or combining several independent or dependent functions or sub indicators in proper way, the composite script exhibits a resonance phenomenon which can filter out noise or fake trading signal to enhance trading confidence level.
Level 3 : comprehensive indicator/strategy. They are simple trading systems based on my strategies. They are commonly containing several or all of entry signal, close signal, stop loss, take profit, re-entry, risk management, and position sizing techniques. Even some interesting fundamental and mass psychological aspects are incorporated.
Level 4 : script snippets or functions that do not disclose source code. Interesting element that can reveal market laws and work as raw material for indicators and strategies. If you find Level 1~2 scripts are helpful, Level 4 is a private version that took me far more efforts to develop.
Level 5 : indicator/strategy that do not disclose source code. private version of Level 3 script with my accumulated script processing skills or a large number of custom functions. I had a private function library built in past two years. Level 5 scripts use many of them to achieve private trading strategy.

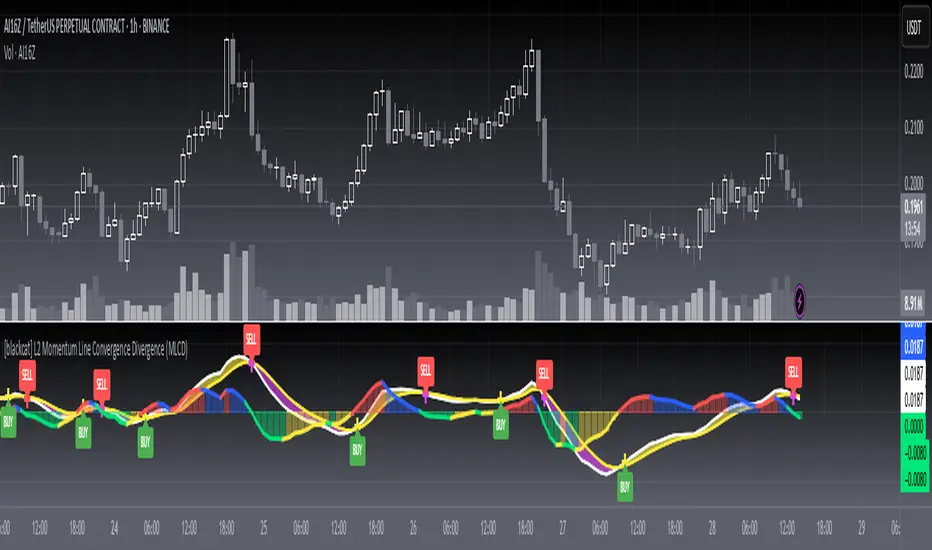
[blackcat] L2 Momentum Line Convergence Divergence (MLCD)Level: 2
Background
Momentum indicators are technical analysis tools that can be used to determine the strength or weakness of the stock price. Momentum measures the speed at which stock prices rise or fall. Common momentum indicators are the relative strength index (RSI) and the moving average of convergence divergence (MACD).
Function
L2 Momentum Line Convergence Divergence (MLCD) is one of my innovative indicator which is to differeniate with average of convergence divergence (MACD). So, I named it as Momentum Line Convergence Divergence (MLCD). In order for everyone to be more familiar with its useage, I inherited the traditional MACD expression method, and added golden cross (yellow cross) and dead cross (fuchsia cross) prompts, as well as bottom divergence (lime cross) and top divergence (red cross) prompts.
Key Signal
mtm --> momentum fast line
mtmaux --> momentum slow line
mtmgx --> momentum gold cross in yellow
mtmdx --> momentum dead cross in fuchsia
mtmbotdiverg --> momentum bottom divergence alert in lime cross
mtmtopdiverg --> momentum top divergence alert in red cross
Pros and Cons
Pros:
1. very stable for market price change and trend following
2. visual bottom and top divergence alerts are provided
Cons:
To be found yet
Remarks
Blackcat1402 brand MLCD indicator
Readme
In real life, I am a prolific inventor. I have successfully applied for more than 60 international and regional patents in the past 12 years. But in the past two years or so, I have tried to transfer my creativity to the development of trading strategies. Tradingview is the ideal platform for me. I am selecting and contributing some of the hundreds of scripts to publish in Tradingview community. Welcome everyone to interact with me to discuss these interesting pine scripts.
The scripts posted are categorized into 5 levels according to my efforts or manhours put into these works.
Level 1 : interesting script snippets or distinctive improvement from classic indicators or strategy. Level 1 scripts can usually appear in more complex indicators as a function module or element.
Level 2 : composite indicator/strategy. By selecting or combining several independent or dependent functions or sub indicators in proper way, the composite script exhibits a resonance phenomenon which can filter out noise or fake trading signal to enhance trading confidence level.
Level 3 : comprehensive indicator/strategy. They are simple trading systems based on my strategies. They are commonly containing several or all of entry signal, close signal, stop loss, take profit, re-entry, risk management, and position sizing techniques. Even some interesting fundamental and mass psychological aspects are incorporated.
Level 4 : script snippets or functions that do not disclose source code. Interesting element that can reveal market laws and work as raw material for indicators and strategies. If you find Level 1~2 scripts are helpful, Level 4 is a private version that took me far more efforts to develop.
Level 5 : indicator/strategy that do not disclose source code. private version of Level 3 script with my accumulated script processing skills or a large number of custom functions. I had a private function library built in past two years. Level 5 scripts use many of them to achieve private trading strategy.
[blackcat] L2 KDJ Trading SystemLevel: 2
Background
The KDJ oscillator display consists of 3 lines (K, D and J - hence the name of the display) and 2 levels. K and D are the same lines you see when using the stochastic oscillator. The J line in turn represents the deviation of the D value from the K value. The convergence of these lines indicates new trading opportunities. Just like the Stochastic Oscillator, oversold and overbought levels correspond to the times when the trend is likely to reverse.
Function
L2 KDJ Trading System provides long and short entries for trading.
Key Signal
k --> KDJ K value
d --> KDJ D value
j --> KDJ J value
shortentry --> short entry signal
longentry1 --> long entry signal without confirmation
syn --> long entry signal with confirmation
Pros and Cons
Pros:
1. Candle height can indicates the strength of trend and different colors are used for indicating KD relationship
2. Exact short and long entries are disclosed
Cons:
1. It may satruate for extreme conditions of long and short as described in the chart, which is inherent KDJ shortcoming
Remarks
Another algorithm for KDJ trading with exact short and long entries
Readme
In real life, I am a prolific inventor. I have successfully applied for more than 60 international and regional patents in the past 12 years. But in the past two years or so, I have tried to transfer my creativity to the development of trading strategies. Tradingview is the ideal platform for me. I am selecting and contributing some of the hundreds of scripts to publish in Tradingview community. Welcome everyone to interact with me to discuss these interesting pine scripts.
The scripts posted are categorized into 5 levels according to my efforts or manhours put into these works.
Level 1 : interesting script snippets or distinctive improvement from classic indicators or strategy. Level 1 scripts can usually appear in more complex indicators as a function module or element.
Level 2 : composite indicator/strategy. By selecting or combining several independent or dependent functions or sub indicators in proper way, the composite script exhibits a resonance phenomenon which can filter out noise or fake trading signal to enhance trading confidence level.
Level 3 : comprehensive indicator/strategy. They are simple trading systems based on my strategies. They are commonly containing several or all of entry signal, close signal, stop loss, take profit, re-entry, risk management, and position sizing techniques. Even some interesting fundamental and mass psychological aspects are incorporated.
Level 4 : script snippets or functions that do not disclose source code. Interesting element that can reveal market laws and work as raw material for indicators and strategies. If you find Level 1~2 scripts are helpful, Level 4 is a private version that took me far more efforts to develop.
Level 5 : indicator/strategy that do not disclose source code. private version of Level 3 script with my accumulated script processing skills or a large number of custom functions. I had a private function library built in past two years. Level 5 scripts use many of them to achieve private trading strategy.

[blackcat] L3 Price Positioning IndexLevel: 3
Background
Are you tired of traditional Japanese candlesticks? Do you want to try a new type of candle master chart?
Function
L3 Price Positioning Index is totally brand-new candle chart invented by myself. This main chart can provide effective resistance and support levels, and you can see where the price is running at any time. There are 3 key circle lines. Green circle line is used to indicate oversold support or breakthrough support levels; yellow circle line indicates the midline position where prices may pause; and red circle line indicates overbought resistance or breakthrough resistance levels.
There are two types of candlestick charts.
The first type candles are mid-to-long-term trend candles, navy represents an uptrend and the length of the candle represents a change in intensity; maroon represents a downward trend and the length of the candle represents a change in intensity. This trend candle is the effective support and resistance level of the second type short-term swing candle.
The second type candles are short-term candles fluctuate around the first medium- and long-term trend candles. The second short-term candle is divided into five colors: green means pump; fuchsia means retracement in the ascending process; yellow means bullish reversal signal; red means dump; blue means price rebound in the descending process.
Key Signal
THREE KEY LINES:
htop --> red circle line, overbought resistance or pump breakout threshold
hmid --> yellow circle line, price pause zone, sideways may happen here
hbot --> green circle line, oversold support or dump breakout threshold
MID-LONG TERM CANDLES:
x22,x33 --> navy for up and maroon for down trend, they are important support or resistance for short term price movements
SHORT TERM CANDLES:
1. bearreboun --> rebounce in down trend candle with blue color
2. pump --> up trend pump candle with green color
3. bullreversal --> bullish reversal candle with yellow color
4. dump --> bearish dump candle with red color
5. bullretra --> retracement in up trend candle with fuchsia
Pros and Cons
Pros:
1. Long term trend identification by three lines for overbought, oversold and breakouts
2. Mid term trend support and resistance with navy and maroon candles
3. Short term price behaviors are classified into 5 types of candles in blue, green, yellow, red and fuchsia
Cons:
I invent this to solve traditional JP candlestick shortcomings. If you find anything on Cons, just feedback to me for improvements.
Remarks
Brand-new Candle System invented by myself
Readme
In real life, I am a prolific inventor. I have successfully applied for more than 60 international and regional patents in the past 12 years. But in the past two years or so, I have tried to transfer my creativity to the development of trading strategies. Tradingview is the ideal platform for me. I am selecting and contributing some of the hundreds of scripts to publish in Tradingview community. Welcome everyone to interact with me to discuss these interesting pine scripts.
The scripts posted are categorized into 5 levels according to my efforts or manhours put into these works.
Level 1 : interesting script snippets or distinctive improvement from classic indicators or strategy. Level 1 scripts can usually appear in more complex indicators as a function module or element.
Level 2 : composite indicator/strategy. By selecting or combining several independent or dependent functions or sub indicators in proper way, the composite script exhibits a resonance phenomenon which can filter out noise or fake trading signal to enhance trading confidence level.
Level 3 : comprehensive indicator/strategy. They are simple trading systems based on my strategies. They are commonly containing several or all of entry signal, close signal, stop loss, take profit, re-entry, risk management, and position sizing techniques. Even some interesting fundamental and mass psychological aspects are incorporated.
Level 4 : script snippets or functions that do not disclose source code. Interesting element that can reveal market laws and work as raw material for indicators and strategies. If you find Level 1~2 scripts are helpful, Level 4 is a private version that took me far more efforts to develop.
Level 5 : indicator/strategy that do not disclose source code. private version of Level 3 script with my accumulated script processing skills or a large number of custom functions. I had a private function library built in past two years. Level 5 scripts use many of them to achieve private trading strategy.

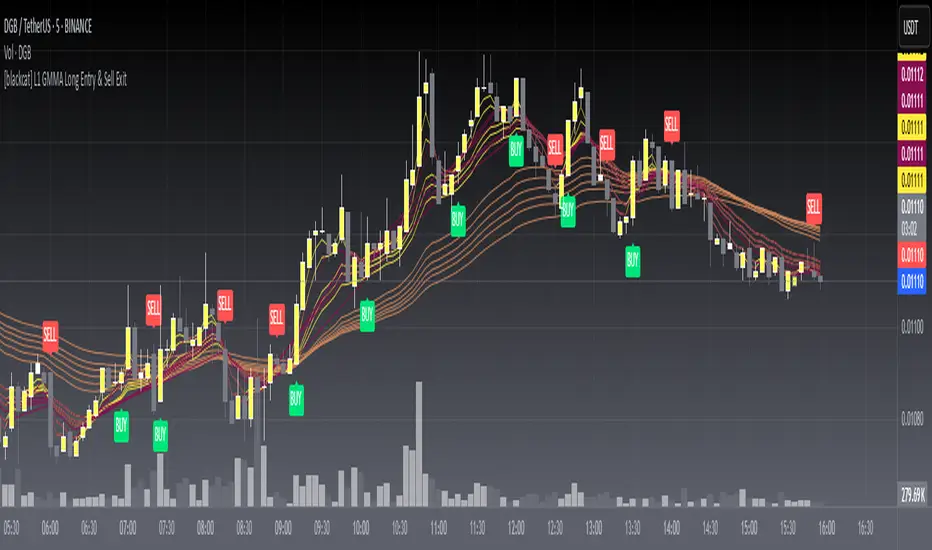
[blackcat] L1 GMMA Long EntryLevel: 1
Background
The Guppy Multiple Moving Average (GMMA) is a technical indicator that identifies changing trends, breakouts, and trading opportunities in the price of an asset by combining two sets of moving averages (MA) with different time periods. There is a short term group of MAs and a long term group of MAs.
Function
L1 GMMA Long Entry classify short-mid term GMMA cluster and long term GMMA cluster with key Fibnocci numbers. Long entry signal is generated with GMMA cluster relationship.
Key Signal
Long entry 1~6 ---> Long entry signal generated with GMMA cluster relationship.
Pros and Cons
Pros:
1. easy observe price trend
2. it covers short, middle and long term trend analysis
Cons:
1. Only long entry signal is disclosed here
2. No complex trading strategy is used yet
Remarks
NA
Readme
In real life, I am a prolific inventor. I have successfully applied for more than 60 international and regional patents in the past 12 years. But in the past two years or so, I have tried to transfer my creativity to the development of trading strategies. Tradingview is the ideal platform for me. I am selecting and contributing some of the hundreds of scripts to publish in Tradingview community. Welcome everyone to interact with me to discuss these interesting pine scripts.
The scripts posted are categorized into 5 levels according to my efforts or manhours put into these works.
Level 1 : interesting script snippets or distinctive improvement from classic indicators or strategy. Level 1 scripts can usually appear in more complex indicators as a function module or element.
Level 2 : composite indicator/strategy. By selecting or combining several independent or dependent functions or sub indicators in proper way, the composite script exhibits a resonance phenomenon which can filter out noise or fake trading signal to enhance trading confidence level.
Level 3 : comprehensive indicator/strategy. They are simple trading systems based on my strategies. They are commonly containing several or all of entry signal, close signal, stop loss, take profit, re-entry, risk management, and position sizing techniques. Even some interesting fundamental and mass psychological aspects are incorporated.
Level 4 : script snippets or functions that do not disclose source code. Interesting element that can reveal market laws and work as raw material for indicators and strategies. If you find Level 1~2 scripts are helpful, Level 4 is a private version that took me far more efforts to develop.
Level 5 : indicator/strategy that do not disclose source code. private version of Level 3 script with my accumulated script processing skills or a large number of custom functions. I had a private function library built in past two years. Level 5 scripts use many of them to achieve private trading strategy.
[blackcat] L1 Stick-Line Merged MACDLevel: 1
Background
The MACD is a superior derivative of moving average crossovers and was developed by Gerald Appel in 1979 as a market timing tool. MACD uses two exponential moving averages with different bar periods, which are then subtracted to form what Mr. Appel calls the Fast Line. A 9-period moving average of the fast line creates the slow line.
Function
L1 Stick-Line Merged MACD merges dif and dea lines with macd sticks by the same color candles. The generation of candles help to confirm the trend contiuation. E.g. yellow candles indicate up trend continuation while blue candles indicate down trend continuation
Key Signal
dif --> classic MACD diff fast line in yellow
dea --> classic MACD dea slow line in fuchsia
macd --> classic difference histogram
upslmerge --> up trend continuation yellow candle merge condition
dnslmerge --> down trend continuation blue candle merge condition
Pros and Cons
Pros:
1. merged line and stick with candles help confirm trend reversal
2. long entry signal is indicated.
Cons:
1. need sophisticated knowledge of MACD to use this well
2. this still requires a lot of MACD experience to obtain reliable trading signals
Remarks
Merge lines and sticks of MACD into candles. Better view of the trend
Readme
In real life, I am a prolific inventor. I have successfully applied for more than 60 international and regional patents in the past 12 years. But in the past two years or so, I have tried to transfer my creativity to the development of trading strategies. Tradingview is the ideal platform for me. I am selecting and contributing some of the hundreds of scripts to publish in Tradingview community. Welcome everyone to interact with me to discuss these interesting pine scripts.
The scripts posted are categorized into 5 levels according to my efforts or manhours put into these works.
Level 1 : interesting script snippets or distinctive improvement from classic indicators or strategy. Level 1 scripts can usually appear in more complex indicators as a function module or element.
Level 2 : composite indicator/strategy. By selecting or combining several independent or dependent functions or sub indicators in proper way, the composite script exhibits a resonance phenomenon which can filter out noise or fake trading signal to enhance trading confidence level.
Level 3 : comprehensive indicator/strategy. They are simple trading systems based on my strategies. They are commonly containing several or all of entry signal, close signal, stop loss, take profit, re-entry, risk management, and position sizing techniques. Even some interesting fundamental and mass psychological aspects are incorporated.
Level 4 : script snippets or functions that do not disclose source code. Interesting element that can reveal market laws and work as raw material for indicators and strategies. If you find Level 1~2 scripts are helpful, Level 4 is a private version that took me far more efforts to develop.
Level 5 : indicator/strategy that do not disclose source code. private version of Level 3 script with my accumulated script processing skills or a large number of custom functions. I had a private function library built in past two years. Level 5 scripts use many of them to achieve private trading strategy.

[blackcat] L2 Swing Oscillator Swing MeterLevel: 2
Background
Swing trading is a type of trading aimed at making short to medium term profits from a trading pair over a period of a few days to several weeks. Swing traders mainly use technical analysis to look for trading opportunities. In addition to analyzing price trends and patterns, these traders can also use fundamental analysis.
Function
L2 Swing Oscillator Swing Meter is an oscillator based on breakouts. Another important feature of it is the swing meter, which confirms the top or bottom's confidence level with different color candles. The higher of the candles stack up, the higher confidence level is indicated.
Key Signal
absolutebot ---> absolute bottom with very high confidence level
ltbot ---> long term bottom with high confidence level
mtbot ---> middle term bottom with moderate confidence level
stbot ---> short term bottom with low confidence level
absolutetop ---> absolute top with very high confidence level
lttop ---> long term top with high confidence level
mttop ---> middle term top with moderate confidence level
sttop ---> short term top with low confidence level
fastline ---> oscillator fast line
slowline ---> oscillator slow line
Pros and Cons
Pros:
1. reconfigurable swing oscillator based on breakouts
2. swing meter can confirm/validate the bottom and top signal
Cons:
1. not appliable with trading pairs without volume information
2. small time frame may not trigger swing meter function
Remarks
This is a simple but very comprehensive technical indicator
Readme
In real life, I am a prolific inventor. I have successfully applied for more than 60 international and regional patents in the past 12 years. But in the past two years or so, I have tried to transfer my creativity to the development of trading strategies. Tradingview is the ideal platform for me. I am selecting and contributing some of the hundreds of scripts to publish in Tradingview community. Welcome everyone to interact with me to discuss these interesting pine scripts.
The scripts posted are categorized into 5 levels according to my efforts or manhours put into these works.
Level 1 : interesting script snippets or distinctive improvement from classic indicators or strategy. Level 1 scripts can usually appear in more complex indicators as a function module or element.
Level 2 : composite indicator/strategy. By selecting or combining several independent or dependent functions or sub indicators in proper way, the composite script exhibits a resonance phenomenon which can filter out noise or fake trading signal to enhance trading confidence level.
Level 3 : comprehensive indicator/strategy. They are simple trading systems based on my strategies. They are commonly containing several or all of entry signal, close signal, stop loss, take profit, re-entry, risk management, and position sizing techniques. Even some interesting fundamental and mass psychological aspects are incorporated.
Level 4 : script snippets or functions that do not disclose source code. Interesting element that can reveal market laws and work as raw material for indicators and strategies. If you find Level 1~2 scripts are helpful, Level 4 is a private version that took me far more efforts to develop.
Level 5 : indicator/strategy that do not disclose source code. private version of Level 3 script with my accumulated script processing skills or a large number of custom functions. I had a private function library built in past two years. Level 5 scripts use many of them to achieve private trading strategy.

[blackcat] L1 Banker Entry IndicatorLevel: 1
Background
@testtttt1111 inquired me how to model banker entry
Function
L1 Banker Entry Indicator demostrates a simple model of banker entry for long or short
Key Signal
bankerthreshold ---> customized input for threshold value for banker move identification
pumpdumpsoon ---> alerts for pump or dump start soon in green color
longshortentry ---> alerts for long or short entry in orange color
bankermove ---> alerts for banker move in yellow color
Pros and Cons
Pros:
1. indicating banker move and entries
2. simple classification of banker move alerts
Cons:
1. no direction can be identified
2. no volume information is utilized for big fund move
Remarks
A demo for banker entry inquired by @testtttt1111
Readme
In real life, I am a prolific inventor. I have successfully applied for more than 60 international and regional patents in the past 12 years. But in the past two years or so, I have tried to transfer my creativity to the development of trading strategies. Tradingview is the ideal platform for me. I am selecting and contributing some of the hundreds of scripts to publish in Tradingview community. Welcome everyone to interact with me to discuss these interesting pine scripts.
The scripts posted are categorized into 5 levels according to my efforts or manhours put into these works.
Level 1 : interesting script snippets or distinctive improvement from classic indicators or strategy. Level 1 scripts can usually appear in more complex indicators as a function module or element.
Level 2 : composite indicator/strategy. By selecting or combining several independent or dependent functions or sub indicators in proper way, the composite script exhibits a resonance phenomenon which can filter out noise or fake trading signal to enhance trading confidence level.
Level 3 : comprehensive indicator/strategy. They are simple trading systems based on my strategies. They are commonly containing several or all of entry signal, close signal, stop loss, take profit, re-entry, risk management, and position sizing techniques. Even some interesting fundamental and mass psychological aspects are incorporated.
Level 4 : script snippets or functions that do not disclose source code. Interesting element that can reveal market laws and work as raw material for indicators and strategies. If you find Level 1~2 scripts are helpful, Level 4 is a private version that took me far more efforts to develop.
Level 5 : indicator/strategy that do not disclose source code. private version of Level 3 script with my accumulated script processing skills or a large number of custom functions. I had a private function library built in past two years. Level 5 scripts use many of them to achieve private trading strategy.

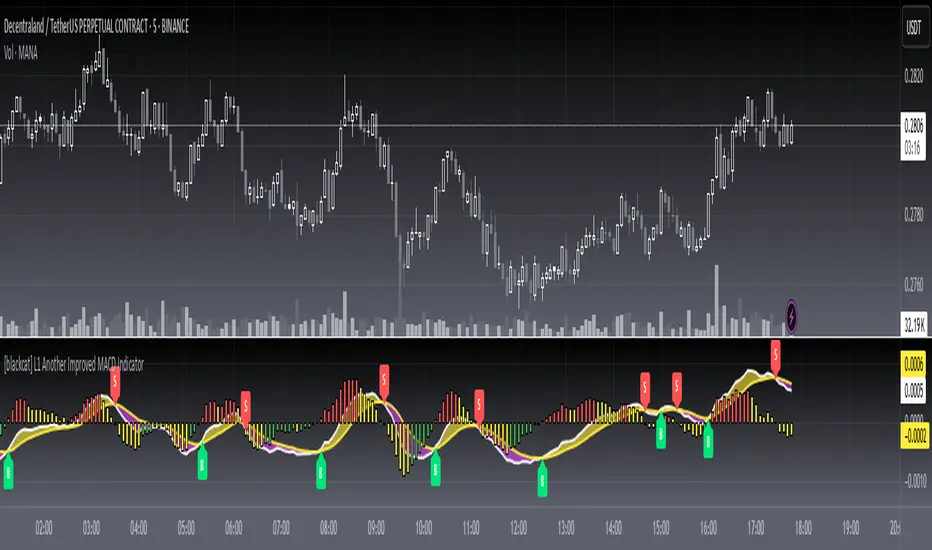
[blackcat] L1 Another Improved MACD IndicatorLevel: 1
Background
The MACD is a superior derivative of moving average crossovers and was developed by Gerald Appel in 1979 as a market timing tool. MACD uses two exponential moving averages with different bar periods, which are then subtracted to form what Mr. Appel calls the Fast Line. A 9-period moving average of the fast line creates the slow line.
Function
L1 Another Improved MACD Indicator improves MACD histogram by customized an algorithm and add three levels of long entry alerts derived from ema ().
Key Signal
diff --> classic MACD diff fast line in white
dea --> classic MACD dea slow line in yellow
macd --> classic difference histogram,but I did not use it directly in the plot.
macd1 --> ema3 of macd
Pros and Cons
Pros:
1. more clear sub level trend change with new histograms
Cons:
1. need sophisticated knowledge of MACD to use this well
2. this still requires a lot of MACD experience to obtain reliable trading signals
Remarks
Another improved MACD on histogram
Readme
In real life, I am a prolific inventor. I have successfully applied for more than 60 international and regional patents in the past 12 years. But in the past two years or so, I have tried to transfer my creativity to the development of trading strategies. Tradingview is the ideal platform for me. I am selecting and contributing some of the hundreds of scripts to publish in Tradingview community. Welcome everyone to interact with me to discuss these interesting pine scripts.
The scripts posted are categorized into 5 levels according to my efforts or manhours put into these works.
Level 1 : interesting script snippets or distinctive improvement from classic indicators or strategy. Level 1 scripts can usually appear in more complex indicators as a function module or element.
Level 2 : composite indicator/strategy. By selecting or combining several independent or dependent functions or sub indicators in proper way, the composite script exhibits a resonance phenomenon which can filter out noise or fake trading signal to enhance trading confidence level.
Level 3 : comprehensive indicator/strategy. They are simple trading systems based on my strategies. They are commonly containing several or all of entry signal, close signal, stop loss, take profit, re-entry, risk management, and position sizing techniques. Even some interesting fundamental and mass psychological aspects are incorporated.
Level 4 : script snippets or functions that do not disclose source code. Interesting element that can reveal market laws and work as raw material for indicators and strategies. If you find Level 1~2 scripts are helpful, Level 4 is a private version that took me far more efforts to develop.
Level 5 : indicator/strategy that do not disclose source code. private version of Level 3 script with my accumulated script processing skills or a large number of custom functions. I had a private function library built in past two years. Level 5 scripts use many of them to achieve private trading strategy.