CCI+EMA Strategy with Percentage or ATR TP/SL [Alifer]This is a momentum strategy based on the Commodity Channel Index (CCI), with the aim of entering long trades in oversold conditions and short trades in overbought conditions.
Optionally, you can enable an Exponential Moving Average (EMA) to only allow trading in the direction of the larger trend. Please note that the strategy will not plot the EMA. If you want, for visual confirmation, you can add to the chart an Exponential Moving Average as a second indicator, with the same settings used in the strategy’s built-in EMA.
The strategy also allows you to set internal Stop Loss and Take Profit levels, with the option to choose between Percentage-based TP/SL or ATR-based TP/SL.
The strategy can be adapted to multiple assets and timeframes:
Pick an asset and a timeframe
Zoom back as far as possible to identify meaningful positive and negative peaks of the CCI
Set Overbought and Oversold at a rough average of the peaks you identified
Adjust TP/SL according to your risk management strategy
Like the strategy? Give it a boost!
Have any questions? Leave a comment or drop me a message.
CAUTIONARY WARNING
Please note that this is a complex trading strategy that involves several inputs and conditions. Before using it in live trading, it is highly recommended to thoroughly test it on historical data and use risk management techniques to safeguard your capital. After backtesting, it's also highly recommended to perform a first live test with a small amount. Additionally, it's essential to have a good understanding of the strategy's behavior and potential risks. Only risk what you can afford to lose .
USED INDICATORS
1 — COMMODITY CHANNEL INDEX (CCI)
The Commodity Channel Index (CCI) is a technical analysis indicator used to measure the momentum of an asset. It was developed by Donald Lambert and first published in Commodities magazine (now Futures) in 1980. Despite its name, the CCI can be used in any market and is not just for commodities. The CCI compares current price to average price over a specific time period. The indicator fluctuates above or below zero, moving into positive or negative territory. While most values, approximately 75%, fall between -100 and +100, about 25% of the values fall outside this range, indicating a lot of weakness or strength in the price movement.
The CCI was originally developed to spot long-term trend changes but has been adapted by traders for use on all markets or timeframes. Trading with multiple timeframes provides more buy or sell signals for active traders. Traders often use the CCI on the longer-term chart to establish the dominant trend and on the shorter-term chart to isolate pullbacks and generate trade signals.
CCI is calculated with the following formula:
(Typical Price - Simple Moving Average) / (0.015 x Mean Deviation)
Some trading strategies based on CCI can produce multiple false signals or losing trades when conditions turn choppy. Implementing a stop-loss strategy can help cap risk, and testing the CCI strategy for profitability on your market and timeframe is a worthy first step before initiating trades.
2 — AVERAGE TRUE RANGE (ATR)
The Average True Range (ATR) is a technical analysis indicator that measures market volatility by calculating the average range of price movements in a financial asset over a specific period of time. The ATR was developed by J. Welles Wilder Jr. and introduced in his book “New Concepts in Technical Trading Systems” in 1978.
The ATR is calculated by taking the average of the true range over a specified period. The true range is the greatest of the following:
The difference between the current high and the current low.
The difference between the previous close and the current high.
The difference between the previous close and the current low.
The ATR can be used to set stop-loss orders. One way to use ATR for stop-loss orders is to multiply the ATR by a factor (such as 2 or 3) and subtract it from the entry price for long positions or add it to the entry price for short positions. This can help traders set stop-loss orders that are more adaptive to market volatility.
3 — EXPONENTIAL MOVING AVERAGE (EMA)
The Exponential Moving Average (EMA) is a type of moving average (MA) that places a greater weight and significance on the most recent data points.
The EMA is calculated by taking the average of the true range over a specified period. The true range is the greatest of the following:
The difference between the current high and the current low.
The difference between the previous close and the current high.
The difference between the previous close and the current low.
The EMA can be used by traders to produce buy and sell signals based on crossovers and divergences from the historical average. Traders often use several different EMA lengths, such as 10-day, 50-day, and 200-day moving averages.
The formula for calculating EMA is as follows:
Compute the Simple Moving Average (SMA).
Calculate the multiplier for weighting the EMA.
Calculate the current EMA using the following formula:
EMA = Closing price x multiplier + EMA (previous day) x (1-multiplier)
STRATEGY EXPLANATION
1 — INPUTS AND PARAMETERS
The strategy uses the Commodity Channel Index (CCI) with additional options for an Exponential Moving Average (EMA), Take Profit (TP) and Stop Loss (SL).
length : The period length for the CCI calculation.
overbought : The overbought level for the CCI. When CCI crosses above this level, it may signal a potential short entry.
oversold : The oversold level for the CCI. When CCI crosses below this level, it may signal a potential long entry.
useEMA : A boolean input to enable or disable the use of Exponential Moving Average (EMA) as a filter for long and short entries.
emaLength : The period length for the EMA if it is used.
2 — CCI CALCULATION
The CCI indicator is calculated using the following formula:
(src - ma) / (0.015 * ta.dev(src, length))
src is the typical price (average of high, low, and close) and ma is the Simple Moving Average (SMA) of src over the specified length.
3 — EMA CALCULATION
If the useEMA option is enabled, an EMA is calculated with the given emaLength .
4 — TAKE PROFIT AND STOP LOSS METHODS
The strategy offers two methods for TP and SL calculations: percentage-based and ATR-based.
tpSlMethod_percentage : A boolean input to choose the percentage-based method.
tpSlMethod_atr : A boolean input to choose the ATR-based method.
5 — PERCENTAGE-BASED TP AND SL
If tpSlMethod_percentage is chosen, the strategy calculates the TP and SL levels based on a percentage of the average entry price.
tp_percentage : The percentage value for Take Profit.
sl_percentage : The percentage value for Stop Loss.
6 — ATR-BASED TP AND SL
If tpSlMethod_atr is chosen, the strategy calculates the TP and SL levels based on Average True Range (ATR).
atrLength : The period length for the ATR calculation.
atrMultiplier : A multiplier applied to the ATR to set the SL level.
riskRewardRatio : The risk-reward ratio used to calculate the TP level.
7 — ENTRY CONDITIONS
The strategy defines two conditions for entering long and short positions based on CCI and, optionally, EMA.
Long Entry: CCI crosses below the oversold level, and if useEMA is enabled, the closing price should be above the EMA.
Short Entry: CCI crosses above the overbought level, and if useEMA is enabled, the closing price should be below the EMA.
8 — TP AND SL LEVELS
The strategy calculates the TP and SL levels based on the chosen method and updates them dynamically.
For the percentage-based method, the TP and SL levels are calculated as a percentage of the average entry price.
For the ATR-based method, the TP and SL levels are calculated using the ATR value and the specified multipliers.
9 — EXIT CONDITIONS
The strategy defines exit conditions for both long and short positions.
If there is a long position, it will be closed either at TP or SL levels based on the chosen method.
If there is a short position, it will be closed either at TP or SL levels based on the chosen method.
Additionally, positions will be closed if CCI crosses back above oversold in long positions or below overbought in short positions.
10 — PLOTTING
The script plots the CCI line along with overbought and oversold levels as horizontal lines.
The CCI line is colored red when above the overbought level, green when below the oversold level, and white otherwise.
The shaded region between the overbought and oversold levels is plotted as well.
Cari dalam skrip untuk "tp"

ATR-based TP/SL with Dynamic RREnglish
This indicator combines the power of the Average True Range (ATR) with dynamic calculations for Take Profit (TP) and Stop Loss (SL) levels, offering a clear visualization of trading opportunities and their respective Risk-Reward Ratios (RRR).
Features:
Dynamic TP/SL Calculation:
TP and SL levels are derived using user-defined ATR multipliers for precise positioning.
Multipliers are flexible, allowing traders to adjust according to their strategies.
Risk-Reward Ratio (RRR):
Automatically calculates and displays the RRR for each trade signal.
Helps traders quickly assess if a trade aligns with their risk management plan.
Entry Conditions:
Buy signals occur when the closing price crosses above the 20-period Simple Moving Average (SMA).
Sell signals occur when the closing price crosses below the 20-period SMA.
Visual Aids:
Red and green lines indicate Stop Loss and Take Profit levels.
Blue and orange labels show the RRR for long and short trades, respectively.
How It Works:
The indicator uses the ATR to calculate TP and SL levels:
TP: Adjusted based on the desired Risk-Reward Ratio (RR).
SL: Proportional to the ATR multiplier.
Entry signals are plotted with "BUY" or "SELL" markers, while the respective TP/SL levels are drawn as horizontal lines.
Why Use This Indicator?
Perfect for traders who value precise risk management.
Helps identify trades with favorable RRR (e.g., greater than 1.5 or 2.0).
Ideal for swing traders, day traders, and scalpers looking to automate their decision-making process.
Customization:
ATR Length: Control the sensitivity of ATR-based calculations.
ATR Multipliers: Set the TP and SL distances relative to the ATR.
Desired RRR: Define the risk/reward ratio you aim to achieve.
Important Notes:
The indicator does not place trades automatically; it is for visual and analytical purposes.
Always backtest and combine it with additional analysis for best results.
French
Cet indicateur combine la puissance de l’Average True Range (ATR) avec des calculs dynamiques pour les niveaux de Take Profit (TP) et de Stop Loss (SL), tout en offrant une visualisation claire des opportunités de trading et de leurs Ratios Risque/Rendement (RRR).
Fonctionnalités :
Calcul Dynamique des TP/SL :
Les niveaux de TP et SL sont calculés à l'aide de multiplicateurs ATR définis par l’utilisateur pour une position précise.
Les multiplicateurs sont personnalisables pour s'adapter à votre stratégie de trading.
Ratio Risque/Rendement (RRR) :
Calcule et affiche automatiquement le ratio RRR pour chaque signal de trade.
Permet aux traders d’évaluer rapidement si un trade correspond à leur plan de gestion des risques.
Conditions d'Entrée :
Les signaux d'achat apparaissent lorsque le prix de clôture traverse au-dessus de la moyenne mobile simple (SMA) à 20 périodes.
Les signaux de vente apparaissent lorsque le prix de clôture traverse en dessous de la SMA à 20 périodes.
Aides Visuelles :
Lignes rouges et vertes pour indiquer les niveaux de Stop Loss et de Take Profit.
Étiquettes bleues et orange pour afficher le RRR des trades longs et courts, respectivement.
Comment Cela Fonctionne :
L'indicateur utilise l’ATR pour calculer les niveaux TP et SL :
TP : Calculé dynamiquement en fonction du ratio risque/rendement souhaité (RRR).
SL : Proportionnel au multiplicateur ATR défini par l’utilisateur.
Les signaux d’entrée sont représentés par des étiquettes "BUY" ou "SELL", tandis que les niveaux de TP/SL sont tracés sous forme de lignes horizontales.
Pourquoi Utiliser Cet Indicateur ?
Idéal pour les traders soucieux d’une gestion rigoureuse des risques.
Identifie les opportunités de trades avec des RRR favorables (par exemple, supérieurs à 1.5 ou 2.0).
Convient aux swing traders, day traders et scalpeurs souhaitant automatiser leur processus de décision.
Personnalisation :
Longueur de l’ATR : Contrôlez la sensibilité des calculs basés sur l’ATR.
Multiplicateurs ATR : Ajustez les distances TP et SL par rapport à l’ATR.
Ratio RRR souhaité : Définissez le ratio risque/rendement que vous visez.
Remarques Importantes :
Cet indicateur n’exécute pas de trades automatiquement ; il est destiné à un usage visuel et analytique uniquement.
Toujours backtester et combiner avec une analyse supplémentaire pour de meilleurs résultats.
parametre par type de trading:
1. Pour les Scalpers :
Style de trading : Trades rapides sur de petites variations de prix, souvent sur des unités de temps courtes (1 min, 5 min).
Recommandations de paramètres :
ATR Length : 7 (plus court pour réagir rapidement à la volatilité).
Multiplicateur SL : 1.0 (Stop Loss proche pour limiter les pertes).
RR souhaité : 1.5 à 2.0 (bon équilibre entre risque et récompense).
Résultat attendu : Des trades fréquents, avec une probabilité raisonnable de toucher le TP tout en limitant les pertes.
2. Pour les Day Traders :
Style de trading : Trades qui durent plusieurs heures dans la journée, souvent sur des unités de temps moyennes (15 min, 1h).
Recommandations de paramètres :
ATR Length : 14 (standard pour capturer une volatilité modérée).
Multiplicateur SL : 1.5 (Stop Loss à distance raisonnable pour supporter les fluctuations intrajournalières).
RR souhaité : 2.0 à 3.0 (ciblez une bonne récompense par rapport au risque).
Résultat attendu : Moins de trades, mais un RR élevé pour compenser les pertes potentielles.
3. Pour les Swing Traders :
Style de trading : Trades qui durent plusieurs jours, souvent sur des unités de temps longues (4h, 1 jour).
Recommandations de paramètres :
ATR Length : 20 (pour capturer des mouvements de volatilité plus larges).
Multiplicateur SL : 2.0 (Stop Loss large pour supporter des fluctuations importantes).
RR souhaité : 3.0 ou plus (ciblez de gros mouvements de prix).
Résultat attendu : Des trades moins fréquents mais potentiellement très lucratifs.
4. Pour les Actifs Volatils (Crypto, Commodités) :
Problème spécifique : Les actifs volatils ont souvent des mouvements brusques.
Recommandations de paramètres :
ATR Length : 7 ou 10 (plus court pour suivre rapidement les variations).
Multiplicateur SL : 1.5 à 2.0 (assez large pour ne pas être déclenché prématurément).
RR souhaité : 1.5 à 2.0 (favorisez des récompenses réalistes sur des mouvements volatils).
Résultat attendu : Trades qui s’adaptent à la volatilité sans sortir trop tôt.
5. Pour les Marchés Stables (Indices, Actions Blue Chip) :
Problème spécifique : Les mouvements sont souvent lents et prévisibles.
Recommandations de paramètres :
ATR Length : 14 ou 20 (capture une volatilité modérée).
Multiplicateur SL : 1.0 à 1.5 (Stop Loss serré pour maximiser l’efficacité).
RR souhaité : 2.0 à 3.0 (ciblez des ratios plus élevés sur des mouvements moins fréquents).
Résultat attendu : Maximisation des profits sur des tendances claires.
Recommandation Générale :
Si vous ne savez pas par où commencer, utilisez ces paramètres par défaut :
ATR Length : 14
Multiplicateur SL : 1.5
RR souhaité : 2.0

RSI Strategy With TP/SL - Lower TFThis Pine Script strategy integrates the Relative Strength Index (RSI) for trade signals with user-defined Take Profit (TP) and Stop Loss (SL) levels. It's designed for flexible application in different market conditions, offering long, short, or dual-direction trading.
Short Description
The strategy uses the RSI to identify overbought and oversold market conditions:
Buy signal: When RSI drops below the specified "Buy Level."
Sell signal: When RSI rises above the "Sell Level."
Additionally, it manages risk and profit targets with:
Take Profit (TP): Exits trades when the price reaches a percentage gain.
Stop Loss (SL): Exits trades to limit losses if the price falls by a certain percentage.
The strategy is versatile and includes options for visualizing performance, monthly profit/loss data, and detailed trade metrics.
How to Use
Set Parameters:
RSI Period: Default is 14. Adjust based on your analysis.
RSI Buy/Sell Levels:
Buy Level: Default is 40. Consider higher levels for conservative entries.
Sell Level: Default is 60. Lower this for earlier exits.
Take Profit (%): Set your profit target (default: 5%).
Stop Loss (%): Set your risk tolerance (default: 2%).
Trade Direction: Choose "Long Only," "Short Only," or "Both."
Interpret Signals:
Buy signals appear when RSI crosses below the buy threshold.
Sell signals appear when RSI crosses above the sell threshold.
Risk Management:
The strategy dynamically calculates TP and SL levels for each trade.
TP/SL is applied using the percentage input based on the entry price.
Monitor Performance:
Review trade statistics in the "Strategy Tester."
Use the monthly performance table to track P/L across months.
Customize Alerts:
Alerts for buy, sell, TP, and SL events can be used to automate notifications.
Key Features
Configurable RSI Settings: Adaptable to various market conditions.
Risk Management: Built-in TP and SL management.
Customizable Trade Direction: Tailored for long-only, short-only, or both directions.
Monthly P/L Table: Visualizes performance trends over time.
Alerts: Notifies when critical trade events occur.
Please do your own research before ase this to your real trading.

ATR SL/TP Precision Zones (Dots)ATR SL/TP Precision Zones (Dots) is a volatility-based tool designed to help traders set accurate Stop Loss and Take Profit levels based on real market volatility — not fixed pips or emotion.
This indicator uses ATR (Average True Range) multiplied by 1.2 to calculate dynamic distance bands.
Instead of drawing a ribbon or channel, it places simple dots above and below each candle:
Upper Dot (Green) → Suggested Take Profit / Price Stretch Zone
Lower Dot (Red) → Suggested Stop Loss Cushion / Support Expansion Zone
Because ATR measures market volatility, these dots expand during high volatility and tighten during slow markets, helping traders avoid stop-loss hunts and premature exits.
Why This Works
Most traders lose because:
They set SL too close → stopped out by noise
They set TP too far → price never reaches it
This tool calibrates those distances automatically based on real price movement behavior.
ATR = volatility
Volatility = market breathing room
This indicator ensures your trade has room to breathe, increasing win consistency.
Best Use Cases
Scalping
Swing trading
Trend continuation entries
Reversal confirmations with support/resistance
Works on Crypto / Forex / Stocks / Futures

Scalping using RSI 2 indicator with TP and TSLThis study implements a simply scalping using the RSI (calculated on two periods), the slopes of two MAs (EMA or SMA) having different lengths (by default, I use 50 and 200).
A take profit (%) and a trailing stop loss (%) are used.
Entry conditions:
.) Fast MA > Slow MA and Price > Slow MA and RSI < Oversold Threshold ------> go Long
.) Fast MA < Slow MA and Price < Slow MA and RSI > Overbought Threshold ------> go Short
Exit conditions:
.) Long entry condition is true and (close >= TP or close <= TSL) ----> close short position
.) Short entry condition is true and (close <= TP or close >= TSL) ----> close long position
The strategy performed best on Bitcoin and the most liquid and capitalized Altcoins but works excellent on volatile assets, mainly if they often go trending.
Works best on 3h - 4h time frame.
There's also an optional Volatility filter, which opens the position only if the difference between the two slopes is more than a specific value, which can be set in the study inputs. The purpose is not opening positions if the price goes sideways and the noise is way > than the signal.
Note:
.) the RSI length is 2;
.) the oversold Threshold is 90%;
.) the overbought Threshold is 10%;
.) by default, the take profit per cent is 0.5%;
.) by default, the trailing stop loss per cent is 0.5%;
.) by default, the fast MA length is 50;
.) by default, the slow MA length is 200;
.) by default, the MA used is EMA.
Cheers.

TP/SL Percentage & RR Visual ToolThis tool is designed to help traders visually and statistically assess their trade setup by calculating Stop Loss (SL), Take Profit (TP), and Risk-to-Reward (RR) based on percentage inputs from the current price.
🔧 How It Works:
Uses the current candle’s close price as your entry.
Calculates TP and SL as percentage-based levels (e.g., 1% SL, 1.5% TP).
Displays horizontal lines and labels on the chart for TP and SL (only on the latest candle to reduce clutter).
Shows a compact table in the top-right corner with all key values:
Entry Price
Current Price
TP Price (+%)
SL Price (-%)
TP Distance from current price
RR Ratio (e.g., 1:1.5)
💡 Use Cases:
Quickly validate if a trade setup meets your desired RR profile (e.g., 1:2).
Perfect for scalpers, swing traders, and position traders who rely on structured risk management.
Combine with your entry signal strategy to visualize targets and stops without manual calculations.
⚙️ Inputs:
Stop Loss % – Sets how far your SL is from the entry.
Take Profit % – Sets how far your TP is from the entry.

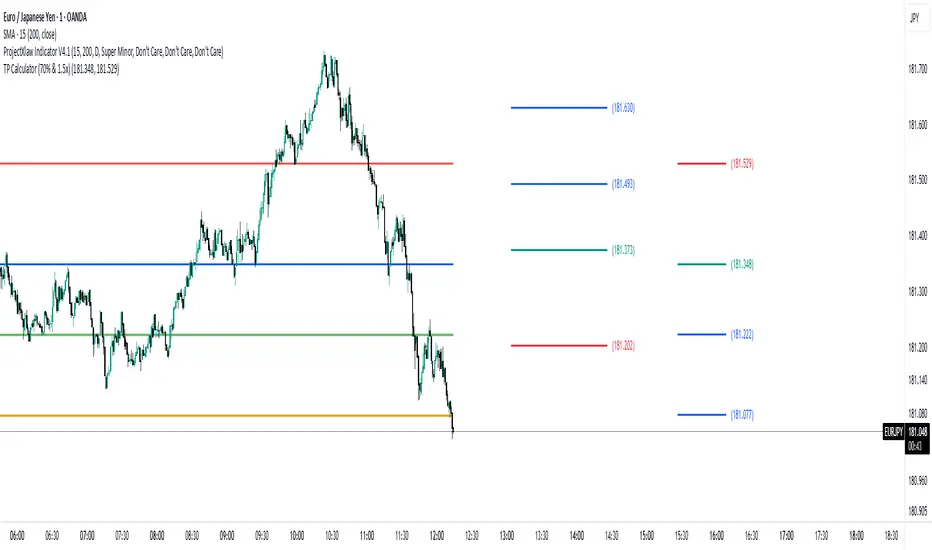
TP Calculator (70% & 1.5x)//@version=5
indicator("TP Calculator (70% & 1.5x)", overlay=true)
// -------- Inputs --------
entry = input.float(100.0, "Entry Price")
stoploss = input.float(90.0, "Stop Loss")
// -------- Determine Direction --------
// اگر SL پایینتر بود = پوزیشن Long
// اگر SL بالاتر بود = پوزیشن Short
isLong = stoploss < entry ? true : false
// -------- Calculations --------
distance = math.abs(entry - stoploss)
// جهت پوزیشن (بالا یا پایین TP میرود)
direction = isLong ? 1 : -1
tp1 = entry + direction * (distance * 0.70) // 70%
tp2 = entry + direction * (distance * 1.50) // 1.5x
// -------- Plot Levels --------
plot(entry, "Entry", color=color.blue, linewidth=2)
plot(stoploss, "Stop Loss", color=color.red, linewidth=2)
plot(tp1, "TP1 (70%)", color=color.green, linewidth=2)
plot(tp2, "TP2 (1.5x)", color=color.orange, linewidth=2)
TPS Short Strategy by Larry ConnersThe TPS Short strategy aims to capitalize on extreme overbought conditions in an ETF by employing a scaling-in approach when certain technical indicators signal potential reversals. The strategy is designed to short the ETF when it is deemed overextended, based on the Relative Strength Index (RSI) and moving averages.
Components:
200-Day Simple Moving Average (SMA):
Purpose: Acts as a long-term trend filter. The ETF must be below its 200-day SMA to be eligible for shorting.
Rationale: The 200-day SMA is widely used to gauge the long-term trend of a security. When the price is below this moving average, it is often considered to be in a downtrend (Tushar S. Chande & Stanley Kroll, "The New Technical Trader: Boost Your Profit by Plugging Into the Latest Indicators").
2-Period RSI:
Purpose: Measures the speed and change of price movements to identify overbought conditions.
Criteria: Short 10% of the position when the 2-period RSI is above 75 for two consecutive days.
Rationale: A high RSI value (above 75) indicates that the ETF may be overbought, which could precede a price reversal (J. Welles Wilder, "New Concepts in Technical Trading Systems").
Scaling-In Mechanism:
Purpose: Gradually increase the short position as the ETF price rises beyond previous entry points.
Scaling Strategy:
20% more when the price is higher than the first entry.
30% more when the price is higher than the second entry.
40% more when the price is higher than the third entry.
Rationale: This incremental approach allows for an increased position size in a worsening trend, potentially increasing profitability if the trend continues to align with the strategy’s premise (Marty Schwartz, "Pit Bull: Lessons from Wall Street's Champion Day Trader").
Exit Conditions:
Criteria: Close all positions when the 2-period RSI drops below 30 or the 10-day SMA crosses above the 30-day SMA.
Rationale: A low RSI value (below 30) suggests that the ETF may be oversold and could be poised for a rebound, while the SMA crossover indicates a potential change in the trend (Martin J. Pring, "Technical Analysis Explained").
Risks and Considerations:
Market Risk:
The strategy assumes that the ETF will continue to decline once shorted. However, markets can be unpredictable, and price movements might not align with the strategy's expectations, especially in a volatile market (Nassim Nicholas Taleb, "The Black Swan: The Impact of the Highly Improbable").
Scaling Risks:
Scaling into a position as the price increases may increase exposure to adverse price movements. This method can amplify losses if the market moves against the position significantly before any reversal occurs.
Liquidity Risk:
Depending on the ETF’s liquidity, executing large trades in increments might affect the price and increase trading costs. It is crucial to ensure that the ETF has sufficient liquidity to handle large trades without significant slippage (James Altucher, "Trade Like a Hedge Fund").
Execution Risk:
The strategy relies on timely execution of trades based on specific conditions. Delays or errors in order execution can impact performance, especially in fast-moving markets.
Technical Indicator Limitations:
Technical indicators like RSI and SMA are based on historical data and may not always predict future price movements accurately. They can sometimes produce false signals, leading to potential losses if used in isolation (John Murphy, "Technical Analysis of the Financial Markets").
Conclusion
The TPS Short strategy utilizes a combination of long-term trend filtering, overbought conditions, and incremental shorting to potentially profit from price reversals. While the strategy has a structured approach and leverages well-known technical indicators, it is essential to be aware of the inherent risks, including market volatility, liquidity issues, and potential limitations of technical indicators. As with any trading strategy, thorough backtesting and risk management are crucial to its successful implementation.

TP RSITP RSI - Integrated Trend, Momentum, and Volatility Analyzer
The TP RSI indicator is an innovative 3-in-1 technical analysis tool that combines RSI, Bollinger Bands, and an EMA ribbon to provide traders with a comprehensive view of trend, momentum, and volatility in a single, easy-to-interpret visual display.
Why This Combination? This mashup addresses three critical aspects of market analysis simultaneously:
Trend identification and strength (EMA ribbon)
Momentum measurement (RSI)
Volatility assessment (Bollinger Bands)
By integrating these components, traders can make more informed decisions based on multiple factors without switching between different indicators.
How Components Work Together:
1. EMA Ribbon (Trend):
10 EMAs form 5 color-coded bands
Blue: Uptrend, Red: Downtrend
Provides a nuanced view of trend strength and potential reversals
2. RSI (Momentum):
Color-coded for quick interpretation
Blue: Upward momentum, Red: Downward momentum, White: Neutral
Position relative to the ribbon offers additional insight
3. Bollinger Bands (Volatility):
Applied to RSI for dynamic overbought/oversold levels
Narrow bands indicate low volatility, suggesting potential breakouts
Unique Aspects and Originality:
Synergistic visual cues: Color coordination between ribbon and RSI
Multi-factor confirmation: Requires alignment of trend, momentum, and volatility for strong signals
Volatility-adjusted momentum: RSI interpreted within the context of Bollinger Bands
How these components work together:
Buy Signal: Blue ribbon with blue RSI outside the ribbon.
Sell Signal: Red ribbon with red RSI outside the ribbon.
Neutral: White RSI or RSI inside the ribbon (not recommended for trading)
Increasing Momentum: RSI crossing above upper Bollinger Band (upward) or below lower Band (downward).
Trend Strength: RSI rejection by the ribbon, while all bands are colored along with the trend direction, identifies a strong trend.

[Top] Simple ATR TP/SLSimple TP/SL from ATR (Locked per Bar) - Advanced Position Management Tool
What This Indicator Does:
Automatically calculates and displays Take Profit (TP) and Stop Loss (SL) levels based on Average True Range (ATR)
Locks ATR values and direction signals at the start of each bar to prevent repainting and provide consistent levels
Offers multiple direction detection modes including real-time candle-based positioning for dynamic trading approaches
Displays entry, TP, and SL levels as clean horizontal lines that extend from the current bar
Original Features That Make This Script Unique:
Bar-Locked ATR System: ATR values are captured and frozen at bar open, ensuring levels remain stable throughout the bar's progression
Multi-Modal Direction Detection: Four distinct modes for determining TP/SL positioning - Trend Following (EMA-based), Bullish Only, Bearish Only, and real-time Candle Based
Real-Time Candle Flipping: In Candle Based mode, TP/SL levels flip immediately when the current candle changes from bullish to bearish or vice versa
Persistent Line Management: Uses efficient line object management to prevent ghost lines and maintain clean visual presentation
Flexible Base Price Selection: Choose between Open (static), Close (dynamic), or midpoint (H+L)/2 for entry level calculation
How The Algorithm Works:
ATR Calculation: Captures ATR value at each bar open using specified length parameter, maintaining consistency throughout the bar
Direction Determination: Uses different methods based on selected mode - EMA crossover for trend following, or real-time candle color for dynamic positioning
Level Calculation: TP level = Base Price + (Direction × TP Multiplier × ATR), SL level = Base Price - (Direction × SL Multiplier × ATR)
Visual Management: Creates persistent line objects once, then updates their positions every bar for optimal performance
Direction Modes Explained:
Trend Following: Uses 5-period and 12-period EMA relationship to determine trend direction (locked at bar open)
Bullish Only: Always places TP above and SL below entry (traditional long setup)
Bearish Only: Always places TP below and SL above entry (traditional short setup)
Candle Based: Dynamically adjusts based on current candle direction - flips in real-time as candle develops
Key Input Parameters:
ATR Length: Period for ATR calculation (default 14) - longer periods provide smoother volatility measurement
TP Multiplier: Take profit distance as multiple of ATR (default 1.0) - higher values target larger profits
SL Multiplier: Stop loss distance as multiple of ATR (default 1.0) - higher values allow more room for price movement
Base Price: Reference point for level calculations - Open for static entry, Close for dynamic tracking
Direction Mode: Method for determining whether TP goes above or below entry level
How To Use This Indicator:
For Position Sizing: Use the displayed SL distance to calculate appropriate position size based on your risk tolerance
For Entry Timing: Wait for price to approach the entry level before taking positions
For Risk Management: Set your actual stop loss orders at or near the displayed SL level
For Profit Taking: Use the TP level as initial profit target, consider scaling out at this level
Mode Selection: Choose Candle Based for scalping and quick reversals, Trend Following for swing trading
Visual Style Customization:
Line Colors: Customize TP line color (default teal) and SL line color (default orange) for easy identification
Line Widths: Adjust TP/SL line thickness (1-5) and entry line thickness (1-3) for visibility preferences
Clean Display: Lines extend 3 bars forward from current bar and update position dynamically
Best Practices:
Use on clean charts without multiple overlapping indicators for clearest visual interpretation
Combine with volume analysis and key support/resistance levels for enhanced decision making
Adjust ATR length based on your trading timeframe - shorter for scalping, longer for position trading
Test different TP/SL multipliers based on the volatility characteristics of your chosen instruments
Consider using Trend Following mode during strong trending periods and Candle Based during ranging markets

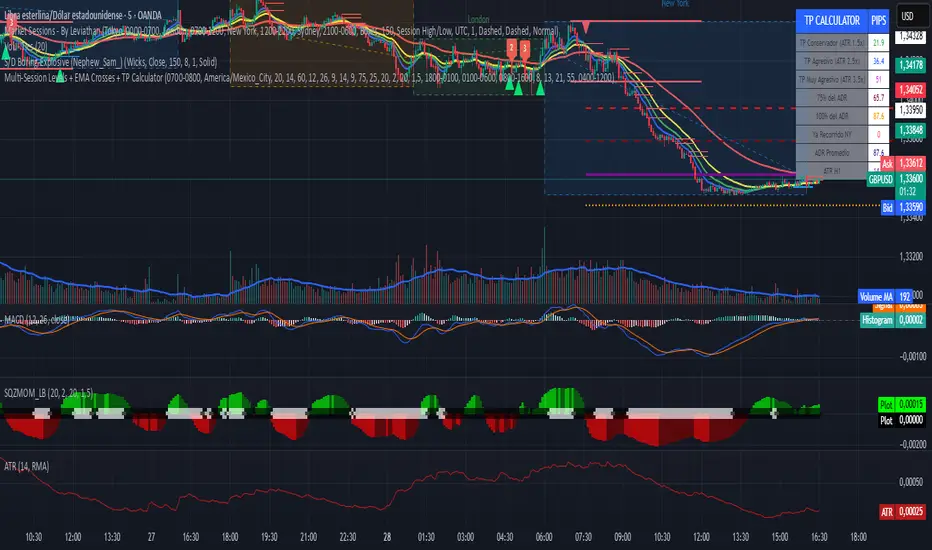
Multi-Session Levels + EMA Crosses + TP Calculator (GBP/USD)# Multi-Session Levels + EMA Crosses + TP Calculator
## 📋 Description
**Advanced trading indicator combining multi-session analysis, EMA cross validation, and automated Take Profit calculations for Forex markets.**
This comprehensive tool integrates session-based level analysis with validated EMA crossovers and intelligent TP calculations, designed specifically for serious traders who need precise entry signals with calculated exit strategies.
## 🎯 Key Features
### 📊 **Multi-Session Analysis**
- **Asian Session (6PM-1AM Mexico)**: Generates key support/resistance levels
- **London Session (1AM-6AM Mexico)**: Analyzes manipulation patterns
- **New York Session (8AM-4PM Mexico)**: Dynamic levels with trend confirmation
- **AMD Setup Detection**: Combines all sessions for high-probability setups
### 📈 **Advanced EMA System**
- **4 EMAs**: 8, 13, 21, and 55 periods with visual display
- **Validated Crossovers**: EMA 8 vs EMA 13 with multiple confirmations
- **Smart Filtering**: Only shows signals during optimal trading hours (6AM-12PM Mexico)
### ✅ **Triple Validation System**
- **MACD Confirmation**: Histogram strength + signal line position + momentum direction
- **RSI Filter**: Overbought/oversold levels with moving average confirmation
- **Squeeze Momentum**: Bollinger Bands vs Keltner Channels compression detection
### 💰 **Intelligent TP Calculator**
- **ADR-Based Targets**: Uses Average Daily Range for realistic profit expectations
- **ATR Multipliers**: Conservative (1.5x), Aggressive (2.5x), Very Aggressive (3.5x)
- **Session-Aware**: Considers already-traveled distance in NY session
- **Real-Time Table**: Live pip calculations for all TP levels
- **Visual Levels**: Automatic TP lines drawn on chart with color coding
### 🚨 **Smart Alert System**
- **Validated Signals Only**: Alerts trigger only when ALL confirmations align
- **TP Integration**: Alerts include suggested take profit levels
- **Non-Validated Tracking**: Shows basic crosses that don't meet full criteria
## 📐 **Technical Calculations**
### **ADR (Average Daily Range)**
- 20-period average of daily high-low ranges
- Converted to pips for easy interpretation
- Used for percentage-based TP targets (50%, 75%, 100% of ADR)
### **ATR (Average True Range)**
- 14-period ATR from H1 timeframe (configurable)
- Accounts for gaps and volatility
- Base for multiplier-based TP levels
### **Session Tracking**
- Real-time monitoring of NY session range
- Calculates remaining potential movement
- Optimizes TP placement based on session progress
## 🎨 **Visual Elements**
### **Chart Levels**
- **Orange Lines**: Asian and London session levels
- **White/Green/Red Lines**: NY session levels (color changes with trend direction)
- **TP Lines**: Color-coded take profit levels with different styles
### **EMA Display**
- **Blue**: EMA 8 (fastest)
- **Green**: EMA 13 (signal line)
- **Yellow**: EMA 21 (trend filter)
- **Red**: EMA 55 (major trend)
### **Signal Shapes**
- **Bright Triangles**: Fully validated signals
- **Faded Triangles**: Non-validated basic crosses
- **Size Variation**: Signal strength indication
## 📊 **Information Table**
Real-time display showing:
- **TP Levels**: All calculated take profit targets in pips
- **Session Data**: NY range already traveled vs average
- **Volatility Metrics**: Current ATR and ADR values
- **Clean Design**: Easy-to-read format with color coding
## ⚙️ **Customization Options**
### **Session Times**
- Fully configurable session times
- Mexico City timezone support
- Enable/disable individual session analysis
### **Validation Controls**
- Toggle MACD, RSI, Squeeze validation independently
- Adjust RSI overbought/oversold levels
- Customize MACD and Squeeze parameters
### **Display Options**
- Show/hide EMAs, crosses, TP levels, table
- Customize TP calculation periods (ADR, ATR)
- Choose ATR timeframe for calculations
## 🎯 **Ideal For**
- **Forex Day Traders**: Especially USD pairs during NY session
- **Session-Based Strategies**: Traders who respect market sessions
- **Risk Management Focus**: Those who need calculated exit strategies
- **Multi-Timeframe Analysis**: Traders using H1-H4 charts
## 📈 **Best Practices**
1. **Use during high-volume sessions** (London-NY overlap)
2. **Wait for full validation** before entering trades
3. **Consider session context** when setting TPs
4. **Combine with proper risk management** (1-2% per trade)
5. **Backtest thoroughly** before live trading
## ⚠️ **Important Notes**
- **Signals work best** during trending market conditions
- **AMD setups** provide highest probability entries
- **TP levels are suggestions** - adjust based on market context
- **Always use stop losses** (not included in this indicator)
- **Designed for Forex markets** - may need adjustment for other instruments
---
*This indicator combines proven technical analysis concepts with modern session-based trading approaches, providing both entry timing and exit planning in one comprehensive tool.*
XAUUSD 1m SMC Zones (BOS + Flexible TP Modes + Trailing Runner)//@version=6
strategy("XAUUSD 1m SMC Zones (BOS + Flexible TP Modes + Trailing Runner)",
overlay = true,
initial_capital = 10000,
pyramiding = 10,
process_orders_on_close = true)
//━━━━━━━━━━━━━━━━━━━
// 1. INPUTS
//━━━━━━━━━━━━━━━━━━━
// TP / SL
tp1Pips = input.int(10, "TP1 (pips)", minval = 1)
fixedSLpips = input.int(50, "Fixed SL (pips)", minval = 5)
runnerRR = input.float(3.0, "Runner RR (TP2 = SL * RR)", step = 0.1, minval = 1.0)
// Daily risk
maxDailyLossPct = input.float(5.0, "Max daily loss % (stop trading)", step = 0.5)
maxDailyProfitPct = input.float(20.0, "Max daily profit % (stop trading)", step = 1.0)
// HTF S/R (1H)
htfTF = input.string("60", "HTF timeframe (minutes) for S/R block")
// Profit strategy (Option C)
profitStrategy = input.string("Minimal Risk | Full BE after TP1", "Profit Strategy", options = )
// Runner stop mode (your option 4)
runnerStopMode = input.string( "BE only", "Runner Stop Mode", options = )
// ATR trail settings (only used if ATR mode selected)
atrTrailLen = input.int(14, "ATR Length (trail)", minval = 1)
atrTrailMult = input.float(1.0, "ATR Multiplier (trail)", step = 0.1, minval = 0.1)
// Pip size (for XAUUSD: 1 pip = 0.10 if tick = 0.01)
pipSize = syminfo.mintick * 10.0
tp1Points = tp1Pips * pipSize
slPoints = fixedSLpips * pipSize
baseQty = input.float (1.0, "Base order size" , step = 0.01, minval = 0.01)
//━━━━━━━━━━━━━━━━━━━
// 2. DAILY RISK MANAGEMENT
//━━━━━━━━━━━━━━━━━━━
isNewDay = ta.change(time("D")) != 0
var float dayStartEquity = na
var bool dailyStopped = false
equityNow = strategy.initial_capital + strategy.netprofit
if isNewDay or na(dayStartEquity)
dayStartEquity := equityNow
dailyStopped := false
dailyPnL = equityNow - dayStartEquity
dailyPnLPct = dayStartEquity != 0 ? (dailyPnL / dayStartEquity) * 100.0 : 0.0
if not dailyStopped
if dailyPnLPct <= -maxDailyLossPct
dailyStopped := true
if dailyPnLPct >= maxDailyProfitPct
dailyStopped := true
canTradeToday = not dailyStopped
//━━━━━━━━━━━━━━━━━━━
// 3. 1H S/R ZONES (for direction block)
//━━━━━━━━━━━━━━━━━━━
htOpen = request.security(syminfo.tickerid, htfTF, open)
htHigh = request.security(syminfo.tickerid, htfTF, high)
htLow = request.security(syminfo.tickerid, htfTF, low)
htClose = request.security(syminfo.tickerid, htfTF, close)
// Engulf logic on HTF
htBullPrev = htClose > htOpen
htBearPrev = htClose < htOpen
htBearEngulf = htClose < htOpen and htBullPrev and htOpen >= htClose and htClose <= htOpen
htBullEngulf = htClose > htOpen and htBearPrev and htOpen <= htClose and htClose >= htOpen
// Liquidity sweep on HTF previous candle
htSweepHigh = htHigh > ta.highest(htHigh, 5)
htSweepLow = htLow < ta.lowest(htLow, 5)
// Store last HTF zones
var float htResHigh = na
var float htResLow = na
var float htSupHigh = na
var float htSupLow = na
if htBearEngulf and htSweepHigh
htResHigh := htHigh
htResLow := htLow
if htBullEngulf and htSweepLow
htSupHigh := htHigh
htSupLow := htLow
// Are we inside HTF zones?
inHtfRes = not na(htResHigh) and close <= htResHigh and close >= htResLow
inHtfSup = not na(htSupLow) and close >= htSupLow and close <= htSupHigh
// Block direction against HTF zones
longBlockedByZone = inHtfRes // no buys in HTF resistance
shortBlockedByZone = inHtfSup // no sells in HTF support
//━━━━━━━━━━━━━━━━━━━
// 4. 1m LOCAL ZONES (LIQUIDITY SWEEP + ENGULF + QUALITY SCORE)
//━━━━━━━━━━━━━━━━━━━
// 1m engulf patterns
bullPrev1 = close > open
bearPrev1 = close < open
bearEngulfNow = close < open and bullPrev1 and open >= close and close <= open
bullEngulfNow = close > open and bearPrev1 and open <= close and close >= open
// Liquidity sweep by previous candle on 1m
sweepHighPrev = high > ta.highest(high, 5)
sweepLowPrev = low < ta.lowest(low, 5)
// Local zone storage (one active support + one active resistance)
// Quality score: 1 = engulf only, 2 = engulf + sweep (we only trade ≥2)
var float supLow = na
var float supHigh = na
var int supQ = 0
var bool supUsed = false
var float resLow = na
var float resHigh = na
var int resQ = 0
var bool resUsed = false
// New resistance zone: previous bullish candle -> bear engulf
if bearEngulfNow
resLow := low
resHigh := high
resQ := sweepHighPrev ? 2 : 1
resUsed := false
// New support zone: previous bearish candle -> bull engulf
if bullEngulfNow
supLow := low
supHigh := high
supQ := sweepLowPrev ? 2 : 1
supUsed := false
// Raw "inside zone" detection
inSupRaw = not na(supLow) and close >= supLow and close <= supHigh
inResRaw = not na(resHigh) and close <= resHigh and close >= resLow
// QUALITY FILTER: only trade zones with quality ≥ 2 (engulf + sweep)
highQualitySup = supQ >= 2
highQualityRes = resQ >= 2
inSupZone = inSupRaw and highQualitySup and not supUsed
inResZone = inResRaw and highQualityRes and not resUsed
// Plot zones
plot(supLow, "Sup Low", color = color.new(color.lime, 60), style = plot.style_linebr)
plot(supHigh, "Sup High", color = color.new(color.lime, 60), style = plot.style_linebr)
plot(resLow, "Res Low", color = color.new(color.red, 60), style = plot.style_linebr)
plot(resHigh, "Res High", color = color.new(color.red, 60), style = plot.style_linebr)
//━━━━━━━━━━━━━━━━━━━
// 5. MODERATE BOS (3-BAR FRACTAL STRUCTURE)
//━━━━━━━━━━━━━━━━━━━
// 3-bar swing highs/lows
swHigh = high > high and high > high
swLow = low < low and low < low
var float lastSwingHigh = na
var float lastSwingLow = na
if swHigh
lastSwingHigh := high
if swLow
lastSwingLow := low
// BOS conditions
bosUp = not na(lastSwingHigh) and close > lastSwingHigh
bosDown = not na(lastSwingLow) and close < lastSwingLow
// Zone “arming” and BOS validation
var bool supArmed = false
var bool resArmed = false
var bool supBosOK = false
var bool resBosOK = false
// Arm zones when first touched
if inSupZone
supArmed := true
if inResZone
resArmed := true
// BOS after arming → zone becomes valid for entries
if supArmed and bosUp
supBosOK := true
if resArmed and bosDown
resBosOK := true
// Reset BOS flags when new zones are created
if bullEngulfNow
supArmed := false
supBosOK := false
if bearEngulfNow
resArmed := false
resBosOK := false
//━━━━━━━━━━━━━━━━━━━
// 6. ENTRY CONDITIONS (ZONE + BOS + RISK STATE)
//━━━━━━━━━━━━━━━━━━━
flatOrShort = strategy.position_size <= 0
flatOrLong = strategy.position_size >= 0
longSignal = canTradeToday and not longBlockedByZone and inSupZone and supBosOK and flatOrShort
shortSignal = canTradeToday and not shortBlockedByZone and inResZone and resBosOK and flatOrLong
//━━━━━━━━━━━━━━━━━━━
// 7. ORDER LOGIC – TWO PROFIT STRATEGIES
//━━━━━━━━━━━━━━━━━━━
// Common metrics
atrTrail = ta.atr(atrTrailLen)
// MINIMAL MODE: single trade, BE after TP1, optional trailing
// HYBRID MODE: two trades (Scalp @ TP1, Runner @ TP2)
// Persistent tracking
var float longEntry = na
var float longTP1 = na
var float longTP2 = na
var float longSL = na
var bool longBE = false
var float longRunEntry = na
var float longRunTP1 = na
var float longRunTP2 = na
var float longRunSL = na
var bool longRunBE = false
var float shortEntry = na
var float shortTP1 = na
var float shortTP2 = na
var float shortSL = na
var bool shortBE = false
var float shortRunEntry = na
var float shortRunTP1 = na
var float shortRunTP2 = na
var float shortRunSL = na
var bool shortRunBE = false
isMinimal = profitStrategy == "Minimal Risk | Full BE after TP1"
isHybrid = profitStrategy == "Hybrid | Scalp TP + Runner TP"
//━━━━━━━━━━ LONG ENTRIES ━━━━━━━━━━
if longSignal
if isMinimal
longEntry := close
longSL := longEntry - slPoints
longTP1 := longEntry + tp1Points
longTP2 := longEntry + slPoints * runnerRR
longBE := false
strategy.entry("Long", strategy.long)
supUsed := true
supArmed := false
supBosOK := false
else if isHybrid
longRunEntry := close
longRunSL := longRunEntry - slPoints
longRunTP1 := longRunEntry + tp1Points
longRunTP2 := longRunEntry + slPoints * runnerRR
longRunBE := false
// Two separate entries, each 50% of baseQty (for backtest)
strategy.entry("LongScalp", strategy.long, qty = baseQty * 0.5)
strategy.entry("LongRun", strategy.long, qty = baseQty * 0.5)
supUsed := true
supArmed := false
supBosOK := false
//━━━━━━━━━━ SHORT ENTRIES ━━━━━━━━━━
if shortSignal
if isMinimal
shortEntry := close
shortSL := shortEntry + slPoints
shortTP1 := shortEntry - tp1Points
shortTP2 := shortEntry - slPoints * runnerRR
shortBE := false
strategy.entry("Short", strategy.short)
resUsed := true
resArmed := false
resBosOK := false
else if isHybrid
shortRunEntry := close
shortRunSL := shortRunEntry + slPoints
shortRunTP1 := shortRunEntry - tp1Points
shortRunTP2 := shortRunEntry - slPoints * runnerRR
shortRunBE := false
strategy.entry("ShortScalp", strategy.short, qty = baseQty * 50)
strategy.entry("ShortRun", strategy.short, qty = baseQty * 50)
resUsed := true
resArmed := false
resBosOK := false
//━━━━━━━━━━━━━━━━━━━
// 8. EXIT LOGIC – MINIMAL MODE
//━━━━━━━━━━━━━━━━━━━
// LONG – Minimal Risk: 1 trade, BE after TP1, runner to TP2
if isMinimal and strategy.position_size > 0 and not na(longEntry)
// Move to BE once TP1 is touched
if not longBE and high >= longTP1
longBE := true
// Base SL: BE or initial SL
float dynLongSL = longBE ? longEntry : longSL
// Optional trailing after BE
if longBE
if runnerStopMode == "Structure trail" and not na(lastSwingLow) and lastSwingLow > longEntry
dynLongSL := math.max(dynLongSL, lastSwingLow)
if runnerStopMode == "ATR trail"
trailSL = close - atrTrailMult * atrTrail
dynLongSL := math.max(dynLongSL, trailSL)
strategy.exit("Long Exit", "Long", stop = dynLongSL, limit = longTP2)
// SHORT – Minimal Risk: 1 trade, BE after TP1, runner to TP2
if isMinimal and strategy.position_size < 0 and not na(shortEntry)
if not shortBE and low <= shortTP1
shortBE := true
float dynShortSL = shortBE ? shortEntry : shortSL
if shortBE
if runnerStopMode == "Structure trail" and not na(lastSwingHigh) and lastSwingHigh < shortEntry
dynShortSL := math.min(dynShortSL, lastSwingHigh)
if runnerStopMode == "ATR trail"
trailSLs = close + atrTrailMult * atrTrail
dynShortSL := math.min(dynShortSL, trailSLs)
strategy.exit("Short Exit", "Short", stop = dynShortSL, limit = shortTP2)
//━━━━━━━━━━━━━━━━━━━
// 9. EXIT LOGIC – HYBRID MODE
//━━━━━━━━━━━━━━━━━━━
// LONG – Hybrid: Scalp + Runner
if isHybrid
// Scalp leg: full TP at TP1
if strategy.opentrades > 0
strategy.exit("LScalp TP", "LongScalp", stop = longRunSL, limit = longRunTP1)
// Runner leg
if strategy.position_size > 0 and not na(longRunEntry)
if not longRunBE and high >= longRunTP1
longRunBE := true
float dynLongRunSL = longRunBE ? longRunEntry : longRunSL
if longRunBE
if runnerStopMode == "Structure trail" and not na(lastSwingLow) and lastSwingLow > longRunEntry
dynLongRunSL := math.max(dynLongRunSL, lastSwingLow)
if runnerStopMode == "ATR trail"
trailRunSL = close - atrTrailMult * atrTrail
dynLongRunSL := math.max(dynLongRunSL, trailRunSL)
strategy.exit("LRun TP", "LongRun", stop = dynLongRunSL, limit = longRunTP2)
// SHORT – Hybrid: Scalp + Runner
if isHybrid
if strategy.opentrades > 0
strategy.exit("SScalp TP", "ShortScalp", stop = shortRunSL, limit = shortRunTP1)
if strategy.position_size < 0 and not na(shortRunEntry)
if not shortRunBE and low <= shortRunTP1
shortRunBE := true
float dynShortRunSL = shortRunBE ? shortRunEntry : shortRunSL
if shortRunBE
if runnerStopMode == "Structure trail" and not na(lastSwingHigh) and lastSwingHigh < shortRunEntry
dynShortRunSL := math.min(dynShortRunSL, lastSwingHigh)
if runnerStopMode == "ATR trail"
trailRunSLs = close + atrTrailMult * atrTrail
dynShortRunSL := math.min(dynShortRunSL, trailRunSLs)
strategy.exit("SRun TP", "ShortRun", stop = dynShortRunSL, limit = shortRunTP2)
//━━━━━━━━━━━━━━━━━━━
// 10. RESET STATE WHEN FLAT
//━━━━━━━━━━━━━━━━━━━
if strategy.position_size == 0
longEntry := na
shortEntry := na
longBE := false
shortBE := false
longRunEntry := na
shortRunEntry := na
longRunBE := false
shortRunBE := false
//━━━━━━━━━━━━━━━━━━━
// 11. VISUAL ENTRY MARKERS
//━━━━━━━━━━━━━━━━━━━
plotshape(longSignal, title = "Long Signal", style = shape.triangleup,
location = location.belowbar, color = color.lime, size = size.tiny, text = "L")
plotshape(shortSignal, title = "Short Signal", style = shape.triangledown,
location = location.abovebar, color = color.red, size = size.tiny, text = "S")

Negroni MA & RSI Strategy, plus trade entry and SL/TP optionsI will start with the context, and some things to think about when using a strategy tool to back-test ideas.
CONTEXT
FIRST: This is derived from other people's work, but I honestly hadn't found a mixed indicator MA strategy tool that does what this now does. If it is out there, apologies!!
This tool can help back-test various MA trends (SMA, EMA, HMA, VWMA); as well as factoring in RSI levels (or not); and can factor in a fixed HTF MA (or not). You can apply a 'retest entry' or a 'breakout entry', and you can also apply various risk mgt for SL/TP orders: 1) No SL/TP; or 2) a fixed %, or 3) dynamic ATR multipliers.
Find below, some details explaining what this tool is attempting to do.
Thank you, tack, salute!
THINGS TO REVIEW (it is not just about 'profitability'!!)
Whilst discretion is always highly encouraged as a trader, and a 100% indicator-driven strategy is VERY unlikely to yield sustainable results going forward, at the very least back-testing your strategies can help provide some guidance, not just on win rate Vs profit factor, but other things including:
a) Trade frequency: if a strategy has an 75% win rate and profit factor of 4, with all your parameters and confluence checks, but only triggers 3 trades every 5 years, is that realistically implementable to your trading situation if you have a $10,000 account?
b) Trade entry type: is it consistently better to wait for a retest of an 'MA zone', or is it better to market buy/sell on breakout of the 'MA zone'?
c) Risk management (SL/TP): is it consistently better to have a fixed static % for SL/TP ("I always place my stops 2% away, whether it is EURUSD or BTCUSDT"), or would you be better placed to try using an ATR multiplier of the respective assets?
d) Moving average type: is your old faithful 100 EMA really serving you well, or is the classic SMA more reliable, or how about the HMA, or the VWMA? Is the 100/200 cross holding up, or do you need something more sensitive? Is there any significant difference between a 10 EMA/20 EMA trend zone compared to a 13 EMA /25 EMA zone?
e) Confluence: Do added confluence checks (RSI, higher timeframe MA) actually improve profitability? But even if they do, is at the cost of cutting too many trades?
INPUTS AND PARAMETERS
Choice 1) Entry Strategy: Retest or Breakout - You can select both!
[ ]:
a) RETEST entry strat: price crosses UNDER FastMA INTO the 'MA trend zone'.
b) BREAKOUT entry strat: price crosses OVER FastMA OUT the 'MA trend zone'.
Choice 2) Risk Management (SL and TP) - You can select more than 1 strategy!
a) No SL/TP: Long trades are closed when the LOW crosses back UNDER the fastMA again, and shorts are closed when the HIGH crosses back OVER the fastMA again.
b) Static % SL/TP: Your SL/TP will be a fixed % away from avg. position price... WARNING: You should change this for various asset classes; FX vol is not the same as crypto altcoin vol!
c) Dynamic ATR SL/TP: Your SL/TP is a multiple of your selected ATR range (default is 50, see 'info' when you select ATR range). ATR accounts for the change in vol of different asset classes somewhat, HOWEVER... you should probably still not have the same multiplier trading S&P500 as you would trading crypto altcoins!
Then select your preferred parameters: EMA, SMA, HMA, VWMA, etc. You can mix and match, and most options have a info/tooltip guide.
RSI note: If you don't care for RSI levels, then set buy signal at 1... i.e always buys! Similarly set sell signal at 99.
ATR note: standard ATR length is usually 14, however... your SL/TP will move POST entry, and can tighten or widen your initial SL/TP... for better AND usually for worse! Go find a trade (strat 3) on the chart, look at the SL/TP lines, now change the number to 5, you'll see.
Fixed HTF MA note: If you don't care for HTF MA confluence, just change the timeframe/options to match the 'Slow MA' options you've chosen.

Low Volatility Breakout + TP/SL Levels█ OVERVIEW
"Low Volatility Breakout + TP/SL Levels" is a breakout indicator designed to detect and trade breakouts from periods of low volatility (consolidation). Unlike classic strategies based on fixed support/resistance levels, this indicator dynamically identifies consolidations characterized by small candle bodies and only generates a signal when the breakout occurs with a large, decisive candle. It also automatically plots 3 Take Profit levels and a Stop Loss (with two calculation modes), making it a complete breakout trading tool.
█ CONCEPTS
The strongest market moves most often start after a prolonged period of very low volatility — when candles become small and the market "falls asleep". The indicator first detects such consolidations (small bodies for at least X bars), draws a box around them, and then waits for a breakout with a candle significantly larger than the average. Additional filters (e.g., the box height cannot exceed the average candle body by too much) eliminate false consolidations and volatility traps. Immediately after the breakout, TP1, TP2, TP3, and SL levels are plotted.
█ FEATURES
Dynamic detection of low-volatility consolidations
- candles with small bodies (< average body × consolidationMultiplier)
- minimum number of bars in consolidation: confirmBars (default 5)
Automatic drawing of consolidation boxes
- green (bullish) or red (bearish) with transparent background (85)
- adjustable border thickness (border_width 1–5)
- box height filter (boxHeightMultiplier, default 6.0 × average body) – removes overly stretched/false consolidations
Breakout conditions
- current candle must be larger than average body × threshold (default 1.5)
- must be the largest candle in the entire consolidation
- must close above the highest high (long) or below the lowest low (short)
Breakout signals
- small green triangles below the bar (long)
- small red triangles above the bar (short)
Automatic Take Profit and Stop Loss levels (drawn 5 bars forward)
- two calculation modes:
• Candle Multiplier – based on average true range (high-low) over tp_sl_length period
• Percentage – fixed percentage from breakout close price (percentages must be manually adjusted to the asset and timeframe)
- 3 TP levels (default 2×, 3×, 4× or 2%, 3%, 4%)
- 1 SL level (default 2× or 1.5%)
Live TP/SL price table (top-right corner)
- displays exact current values of SL, TP1, TP2, TP3 immediately after each new signal
- colors identical to drawn lines (red background for SL, green for TP levels)
- updates automatically with every new breakout
Built-in alerts
- “Bullish Breakout Alert” and “Bearish Breakout Alert”
█ HOW TO USE
Add the indicator to your TradingView chart → Indicators → search “Low Volatility Breakout + TP/SL Levels”.
After each valid breakout you will immediately see:
- the colored box
- signal triangle
- horizontal TP/SL lines
- updated table in the top-right corner showing precise price levels for the current trade
Key settings to adjust:
Consolidation Settings
- Volatility Window (length) – period for average body calculation (default 20)
- Consolidation Multiplier – how small bodies must be to count as consolidation (default 2.0)
- Breakout Multiplier – minimum size of breakout candle (default 1.5)
- Box Height Multiplier – maximum allowed box height (default 6.0)
- Min Consolidation Bars – minimum bars required (default 5)
Risk Management Settings
- Choose TP/SL mode: Candle Multiplier or Percentage
- Adjust TP1–3 and SL multipliers/percentages to match your risk management style
Signal interpretation:
- Green triangle below bar + green box + green TP levels in table = long signal
- Red triangle above bar + red box + red SL level in table = short signal
- Boxes remain on chart until broken — they highlight accumulation/distribution zones
█ APPLICATIONS
- Trading breakouts from consolidation on all markets and timeframes
- Recommended to trade in the direction of the higher-timeframe trend or with additional confirmations (e.g., key level breaks). Aggressive mode (trading both directions) is also possible — provided box and TP/SL settings are properly optimized
- Experiment with different TP/SL ratios — higher reward-to-risk setups (e.g., SL 1×, TP3 6–8×) with lower win rate are often more profitable in the long run
- Strongly encourage testing various box parameters (consolidationMultiplier, boxHeightMultiplier, confirmBars) — small changes can dramatically affect signal frequency and quality
█ NOTES
Always test and optimize parameters for the specific instrument and timeframe.

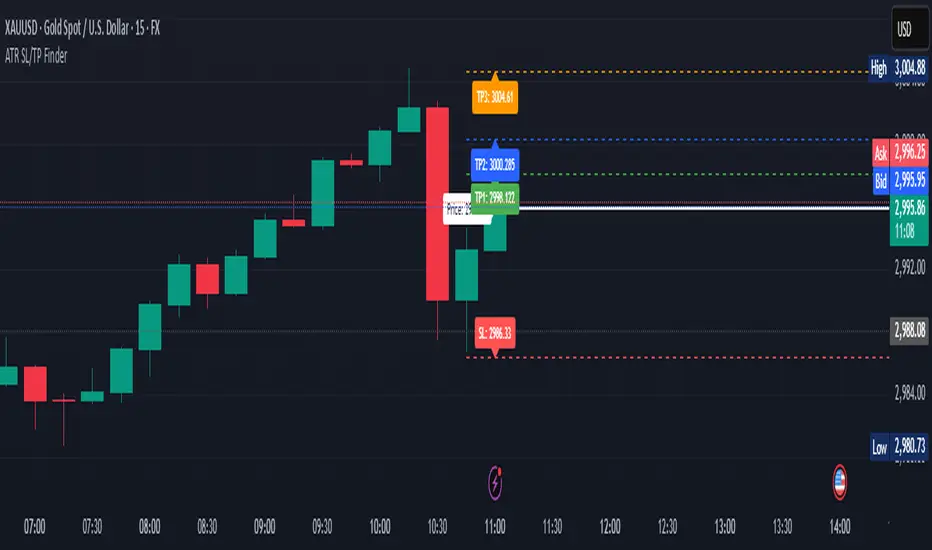
ATR Stop Loss & 3 TP FinderATR Stop Loss & 3 TP Finder - By SeehraSingh
This indicator is designed to help traders automate Stop Loss (SL) and Take Profit (TP) placement based on the Average True Range (ATR). It dynamically calculates:
Stop Loss (SL): Set based on a user-defined ATR multiplier.
Three Take Profit (TP) levels: Configurable ATR multipliers for TP1, TP2, and TP3.
Customizable Price Sources: Allows traders to choose different price sources (Open, High, Low, Close, HL2, HLC3, OHLC4, HLCC4) for both SL and TP calculations.
Visual Representation: Plots dashed lines for Entry, SL, TP1, TP2, and TP3.
Table Display: Provides an easy-to-read table at the bottom showing SL, TP1, TP2, and TP3 values.
How It Works:
Select ATR length and smoothing type (RMA, SMA, EMA, WMA).
Set ATR multipliers for SL and TP levels.
Choose the price source for SL and TP calculations.
The indicator automatically plots entry, SL, and three TP levels on the chart.
Ideal For:
Traders who use ATR-based dynamic Stop Loss and Take Profit strategies.
Those who want to avoid fixed SL/TP placements and prefer volatility-based risk management.
Scalpers, Swing Traders, and Position Traders looking for automated SL/TP visualization.
Disclaimer
⚠️ Trading involves risk. This indicator is for educational purposes only and should not be considered financial advice. Always conduct your own analysis before entering any trade. The author is not responsible for any financial losses incurred while using this tool. Past performance does not guarantee future results.
Trend Signals with TP & SL [UAlgo] StrategyThe "Trend Signals with TP & SL Strategy" is a trading strategy designed to capture trend continuation signals while incorporating sophisticated risk management techniques. This strategy is tailored for traders who wish to capitalize on trending market conditions with precise entry and exit points, automatically calculating Take Profit (TP) and Stop Loss (SL) levels based on either Average True Range (ATR) or percentage values. The strategy aims to enhance trade management by preventing multiple simultaneous positions and dynamically adapting to changing market conditions.
This strategy is highly configurable, allowing traders to adjust sensitivity, the ATR calculation method, and the cloud moving average length. Additionally, the strategy can display buy and sell signals directly on the chart, along with visual representation of entry points, stop losses, and take profits. It also features a cloud-based trend analysis using a MACD-driven color fill that indicates the strength and direction of the trend.
🔶 Key Features
Configurable Trend Continuation Signals:
Source Selection: The strategy uses the midpoint of the high-low range as the default source, but it is adjustable.
Sensitivity: The sensitivity of the trend signals can be adjusted using a multiplier, ranging from 0.5 to 5.
ATR Calculation: The strategy allows users to choose between two ATR calculation methods for better adaptability to different market conditions.
Cloud Moving Average: Traders can adjust the cloud moving average length, which is used in conjunction with MACD to provide a visual trend indication.
Take Profit & Stop Loss Management:
ATR-Based or Percent-Based: The strategy offers flexibility in setting TP and SL levels, allowing traders to choose between ATR-based multipliers or fixed percentage values.
Dynamic Adjustment: TP and SL levels are dynamically adjusted according to the selected method, ensuring trades are managed based on real-time market conditions.
Prevention of Multiple Positions:
Single Position Control: To reduce risk and enhance strategy reliability, the strategy includes an option to prevent multiple positions from being opened simultaneously.
Visual Trade Indicators:
Buy/Sell Signals: Clearly displays buy and sell signals on the chart for easy interpretation.
Entry, SL, and TP Lines: Draws lines for entry price, stop loss, and take profit directly on the chart, helping traders to monitor trades visually.
Trend Cloud: A color-filled cloud based on MACD and the cloud moving average provides a visual cue of the trend’s direction and strength.
Performance Summary Table:
In-Chart Statistics: A table in the top right of the chart displays key performance metrics, including total trades, wins, losses, and win rate percentage, offering a quick overview of the strategy’s effectiveness.
🔶 Interpreting the Indicator
Trend Signals: The strategy identifies trend continuation signals based on price action relative to an ATR-based threshold. A buy signal is generated when the price crosses above a key level, indicating an uptrend. Conversely, a sell signal occurs when the price crosses below a level, signaling a downtrend.
Cloud Visualization: The cloud, derived from MACD and moving averages, changes color to reflect the current trend. A positive cloud in aqua suggests an uptrend, while a red cloud indicates a downtrend. The transparency of the cloud offers further nuance, with more solid colors denoting stronger trends.
Entry and Exit Management: Once a trend signal is generated, the strategy automatically sets TP and SL levels based on your chosen method (ATR or percentage). The stop loss and take profit lines will appear on the chart, showing where the strategy will exit the trade. If the price reaches either the SL or TP, the trade is closed, and the respective line is deleted from the chart.
Performance Metrics: The strategy’s performance is tracked in real-time with an in-chart table. This table provides essential information about the number of trades executed, the win/loss ratio, and the overall win rate. This information helps traders assess the strategy's effectiveness and make necessary adjustments.
This strategy is designed for those who seek to engage with trending markets, offering robust tools for entry, exit, and overall trade management. By understanding and leveraging these features, traders can potentially improve their trading outcomes and risk management.
🔷 Related Script
🔶 Disclaimer
Use with Caution: This indicator is provided for educational and informational purposes only and should not be considered as financial advice. Users should exercise caution and perform their own analysis before making trading decisions based on the indicator's signals.
Not Financial Advice: The information provided by this indicator does not constitute financial advice, and the creator (UAlgo) shall not be held responsible for any trading losses incurred as a result of using this indicator.
Backtesting Recommended: Traders are encouraged to backtest the indicator thoroughly on historical data before using it in live trading to assess its performance and suitability for their trading strategies.
Risk Management: Trading involves inherent risks, and users should implement proper risk management strategies, including but not limited to stop-loss orders and position sizing, to mitigate potential losses.
No Guarantees: The accuracy and reliability of the indicator's signals cannot be guaranteed, as they are based on historical price data and past performance may not be indicative of future results.

ATR+CCI Monetary Risk Tool - TP/SL⚙️ ATR+CCI Monetary Risk Tool — Volatility-aware TP/SL & Position Sizing
Exact prices (no rounding), ATR-percentile dynamic stops, and risk-budget sizing for consistent execution.
🧠 What this indicator is
A risk-first planning tool. It doesn’t generate orders; it gives you clean, objective levels (Entry, SL, TP) and position size derived from your risk budget. It shows only the latest setup to keep charts readable, and a compact on-chart table summarizing the numbers you actually act on.
✨ What makes it different
Dynamic SL by regime (ATR percentile): Instead of a fixed multiple, the SL multiplier adapts to the current volatility percentile (low / medium / high). That helps avoid tight stops in noisy markets and over-wide stops in quiet markets.
Risk budgeting, not guesswork: Size is computed from Account Balance × Max Risk % divided by SL distance × point value. You risk the same dollars across assets/timeframes.
Precision that matches your instrument: Entry, TP, SL, and SL Distance are displayed as exact prices (no rounding), truncated to syminfo.mintick so they align with broker/exchange precision.
Symbol-aware point value: Uses syminfo.pointvalue so you don’t maintain tick tables.
Non-repaint option: Work from closed bars to keep the plan stable.
🔧 How to use (quick start)
Add to chart and pick your timeframe and symbol.
In settings:
Set Account Balance (USD) and Max Risk per Trade (%).
Choose R:R (1:1 … 1:5).
Pick ATR Period and CCI Period (defaults are sensible).
Keep Dynamic ATR ON to adapt SL by regime.
Keep Use closed-bar values ON to avoid repaint when planning.
Read the labels (Entry/TP/SL) and the table (SL Distance, Position Size, Max USD Risk, ATR Percentile, effective SL Mult).
Combine with your entry trigger (price action, levels, momentum, etc.). This indicator handles risk & targets.
📐 How levels are computed
Bias: CCI ≥ 0 ⇒ long, otherwise short.
ATR Percentile: Percent rank of ATR(atrPeriod) over a lookback window.
Effective SL Mult:
If percentile < Low threshold ⇒ use Low SL Mult (tighter).
If between thresholds ⇒ use Base SL Mult.
If percentile > High threshold ⇒ use High SL Mult (wider).
Stop-Loss: SL = Entry ± ATR × SL_Mult (minus for long, plus for short).
Take-Profit: TP = Entry ± (Entry − SL) × R (R from the R:R dropdown).
Position Size:
USD Risk = Balance × Risk%
Contracts = USD Risk ÷ (|Entry − SL| × PointValue)
For futures, quantity is floored to whole contracts.
Exact prices: Entry/TP/SL and SL Distance are not rounded; they’re truncated to mintick so what you see matches valid price increments.
📊 What you’ll see on chart
Latest Entry (blue), TP (green), SL (red) with labels (optional emojis: ➡️ 🎯 🛑).
Info Table with:
Bias, Entry, TP, SL (exact, truncated to mintick)
SL Distance (exact, truncated)
Position Size (contracts/units)
Max USD Risk
Point Value
ATR Percentile and effective SL Mult
🧪 Practical examples
High-volatility session (e.g., XAUUSD, 1H): ATR percentile is high ⇒ wider SL, smaller size. Reduces churn from normal noise during macro events.
Range-bound market (e.g., EURUSD, 4H): ATR percentile low ⇒ tighter SL, better R:R. Helps you avoid carrying unnecessary risk.
Index swing planning (e.g., ES1!, Daily): Non-repaint levels + risk budgeting = consistent sizing across days/weeks, easier to review and journal.
🧭 Why traders should use it
Consistency: Same dollar risk regardless of instrument or volatility regime.
Clarity: One-trade view forces focus; you see the numbers that matter.
Adaptivity: Stops calibrated to the market’s current behavior, not last month’s.
Discipline: A visible checklist (SL distance, size, USD risk) before you hit buy/sell.
🔧 Input guide (practical defaults)
CCI Period: 100 by default; use as a bias filter, not an entry signal.
ATR Period: 14 by default; raise for smoother, lower for more reactive.
ATR Percentile Lookback: 200 by default (stable regime detection).
Percentile thresholds: 33/66 by default; widen the gap to change how often regimes switch.
SL Mults: Start ~1.5 / 2.0 / 2.5 (low/base/high). Tune by asset.
Risk % per trade: Common pro ranges are 0.25–1.0%; adjust to your risk tolerance.
R:R: Start with 1:2 or 1:3 for balanced skew; adapt to strategy edge.
Closed-bar values: Keep ON for planning/live; turn OFF only for exploration.
💡 Best practices
Combine with your entry logic (structure, momentum, liquidity levels).
Review ATR percentile and effective SL Mult across sessions so you understand regime shifts.
For futures, remember size is floored to whole contracts—safer by design.
Journal trades with the table snapshot to improve risk discipline over time.
⚠️ Notes & limitations
This is not a strategy; it does not place orders or alerts.
No slippage/commissions modeled here; build a strategy() version for backtests that mirror your broker/exchange.
Displayed non-price metrics use two decimals; prices and SL Distance are exact (truncated to mintick).
📎 Disclaimer
For educational purposes only. Not financial advice. Markets involve risk. Test thoroughly before trading live.

XAUUSD Sniper Setup (Pre-Arrows + SL/TP)//@version=5
indicator("XAUUSD Sniper Setup (Pre-Arrows + SL/TP)", overlay=true)
// === Inputs ===
rangePeriod = input.int(20, "Lookback Bars for Zone", minval=5)
maxRangePercent = input.float(0.08, "Max Range % for Consolidation", step=0.01)
tpMultiplier = input.float(1.5, "TP Multiplier")
slMultiplier = input.float(1.0, "SL Multiplier")
// === Consolidation Detection ===
highestPrice = ta.highest(high, rangePeriod)
lowestPrice = ta.lowest(low, rangePeriod)
priceRange = highestPrice - lowestPrice
percentRange = (priceRange / close) * 100
isConsolidation = percentRange < maxRangePercent
// === Zones ===
demandZone = lowestPrice
supplyZone = highestPrice
// === Plot Consolidation Zone Background ===
bgcolor(isConsolidation ? color.new(color.gray, 85) : na)
// === Plot Potential Buy/Sell Levels ===
plot(isConsolidation ? demandZone : na, color=color.green, title="Potential Buy Level", linewidth=2)
plot(isConsolidation ? supplyZone : na, color=color.red, title="Potential Sell Level", linewidth=2)
// === Liquidity Sweep ===
liquidityTakenBelow = low < demandZone
liquidityTakenAbove = high > supplyZone
// === Engulfing Candles ===
bullishEngulfing = close > open and close < open and close > open
bearishEngulfing = close < open and close > open and close < open
// === Break of Structure ===
bosUp = high > ta.highest(high , 5)
bosDown = low < ta.lowest(low , 5)
// === Sniper Entry Conditions ===
buySignal = isConsolidation and liquidityTakenBelow and bullishEngulfing and bosUp
sellSignal = isConsolidation and liquidityTakenAbove and bearishEngulfing and bosDown
// === SL & TP Levels ===
slBuy = demandZone - (priceRange * slMultiplier)
tpBuy = close + (priceRange * tpMultiplier)
slSell = supplyZone + (priceRange * slMultiplier)
tpSell = close - (priceRange * tpMultiplier)
// === PRE-ARROWS (Show Before Breakout) ===
preBuyArrow = isConsolidation ? 1 : na
preSellArrow = isConsolidation ? -1 : na
plotarrow(preBuyArrow, colorup=color.new(color.green, 50), maxheight=20, minheight=20, title="Pre-Buy Arrow")
plotarrow(preSellArrow, colordown=color.new(color.red, 50), maxheight=20, minheight=20, title="Pre-Sell Arrow")
// === SNIPER CONFIRMATION ARROWS ===
buyArrow = buySignal ? 1 : na
sellArrow = sellSignal ? -1 : na
plotarrow(buyArrow, colorup=color.green, maxheight=60, minheight=60, title="Sniper BUY Arrow")
plotarrow(sellArrow, colordown=color.red, maxheight=60, minheight=60, title="Sniper SELL Arrow")
// === BUY SIGNAL ===
if buySignal
label.new(bar_index, low, "BUY\nSL/TP Added", style=label.style_label_up, color=color.green, textcolor=color.white)
line.new(bar_index, slBuy, bar_index + 5, slBuy, color=color.red, style=line.style_dotted)
line.new(bar_index, tpBuy, bar_index + 5, tpBuy, color=color.green, style=line.style_dotted)
label.new(bar_index, slBuy, "SL", color=color.red, style=label.style_label_down)
label.new(bar_index, tpBuy, "TP", color=color.green, style=label.style_label_up)
// === SELL SIGNAL ===
if sellSignal
label.new(bar_index, high, "SELL\nSL/TP Added", style=label.style_label_down, color=color.red, textcolor=color.white)
line.new(bar_index, slSell, bar_index + 5, slSell, color=color.red, style=line.style_dotted)
line.new(bar_index, tpSell, bar_index + 5, tpSell, color=color.green, style=line.style_dotted)
label.new(bar_index, slSell, "SL", color=color.red, style=label.style_label_up)
label.new(bar_index, tpSell, "TP", color=color.green, style=label.style_label_down)
// === Alerts ===
alertcondition(buySignal, title="Sniper BUY", message="Sniper BUY setup on XAUUSD")
alertcondition(sellSignal, title="Sniper SELL", message="Sniper SELL setup on XAUUSD")
OANDA:XAUUSD
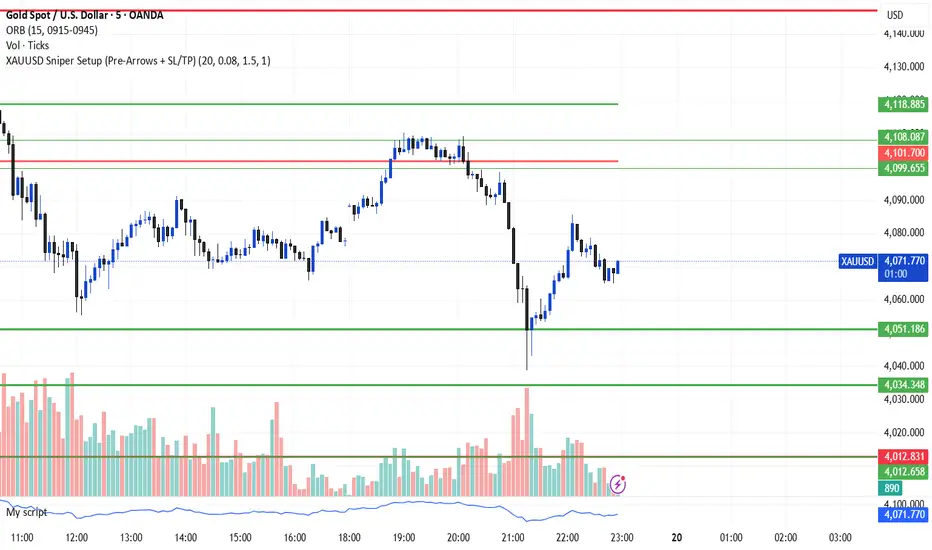
BullTrader - ParabolicSARFlipSignals(NonRepainting)TP/SL🧠 Purpose & Concept
This indicator refines Wilder’s Parabolic SAR into a simple, non‑repainting alert and visualization system that marks each confirmed trend flip with a clear buy or sell signal.
It also auto‑generates dynamic, ATR‑based Take‑Profit (TP) and Stop‑Loss (SL) levels, keeps them updating with price in real time, and displays the current market bias in an on‑chart table.
The goal: clarity and automation without complexity — see exactly when a new bullish or bearish phase begins, what your current TP/SL targets are, and receive a single clean alert for every new flip.
⚙️ How It Works
1. The built‑in ta.sar() function tracks the Parabolic SAR dots.
2. When a candle closes across the SAR line, a trend‑change is confirmed:
• Price crossing above a SAR dot → Buy Flip (green triangle).
• Price crossing below a SAR dot → Sell Flip (red triangle).
3. On each flip, the indicator calculates dynamic ATR‑based TP / SL targets:
TP = entry ± (ATR × tpMult) and SL = entry ∓ (ATR × slMult)
These values move automatically as the trend develops.
4. A small floating label beside the latest bar shows live‑updated TP / SL numbers.
5. A color‑coded table in the upper‑right corner displays the current trend: Lime = Bullish, Red = Bearish, Yellow = Neutral.
6. Each new flip triggers an easy‑to‑use Buy / Sell alert after the bar closes—no repainting.
🔔 Alerts
Alert Name Triggers When Message
SAR Buy Flip Alert Green triangle (bullish reversal) “BUY Flip — Parabolic SAR on {{ticker}} ({{interval}})”
SAR Sell Flip Alert Red triangle (bearish reversal) “SELL Flip — Parabolic SAR on {{ticker}} ({{interval}})”
📈 Chart Elements
Element Meaning
🟠 Orange cross Standard Parabolic SAR trail.
🟢 / 🔴 Triangles Confirmed buy / sell flips (non‑repainting).
Bright lime/red TP‑SL box Live ATR targets that move with price.
Trend table (top‑right) Instant status of bullish/bearish bias.
✅ Features & Highlights
Non‑repainting — all signals confirm on closed bars.
Visual clarity — single pair of bright triangles for flips.
Dynamic ATR‑based TP / SL values that auto‑trail with trend.
Always‑visible trend summary table.
Two ready‑made alert types (Buy / Sell).
Lightweight and optimized for any timeframe or symbol.
💡 Best Use
Ideal for traders who prefer clean trend‑based entries and volatility‑adaptive exits without signal clutter:
Pair it with your existing strategy or use it standalone for reversal‑based swing and intraday trading.

AI Trading Alerts v6 — SL/TP + Confidence + Panel (Fixed)Overview
This Pine Script is designed to identify high-probability trading opportunities in Forex, commodities, and crypto markets. It combines EMA trend filters, RSI, and Stochastic RSI, with automatic stop-loss (SL) & take-profit (TP) suggestions, and provides a confidence panel to quickly assess the trade setup strength.
It also includes TradingView alert conditions so you can set up notifications for Long/Short setups and EMA crosses.
⚙️ Features
EMA Trend Filter
Uses EMA 50, 100, 200 for trend confirmation.
Bull trend = EMA50 > EMA100 > EMA200
Bear trend = EMA50 < EMA100 < EMA200
RSI Filter
Bullish trades require RSI > 50
Bearish trades require RSI < 50
Stochastic RSI Filter
Prevents entries during overbought/oversold extremes.
Bullish entry only if %K and %D < 80
Bearish entry only if %K and %D > 20
EMA Proximity Check
Price must be near EMA50 (within ATR × adjustable multiplier).
Signals
Continuation Signals:
Long if all bullish conditions align.
Short if all bearish conditions align.
Cross Events:
Long Cross when price crosses above EMA50 in bull trend.
Short Cross when price crosses below EMA50 in bear trend.
Automatic SL/TP Suggestions
SL size adjusts depending on asset:
Gold/Silver (XAU/XAG): 5 pts
Bitcoin/Ethereum: 100 pts
FX pairs (default): 20 pts
TP = SL × Risk:Reward ratio (default 1:2).
Confidence Score (0–4)
Based on conditions met (trend, RSI, Stoch, EMA proximity).
Labels:
Strongest (4/4)
Strong (3/4)
Medium (2/4)
Low (1/4)
Visual Panel on Chart
Shows ✅/❌ for each condition (trend, RSI, Stoch, EMA proximity, signal now).
Confidence row with color-coded strength.
Alerts
Long Setup
Short Setup
Long Cross
Short Cross
🖥️ How to Use
1. Add the Script
Open TradingView → Pine Editor.
Paste the full script.
Click Add to chart.
Save as "AI Trading Alerts v6 — SL/TP + Confidence + Panel".
2. Configure Inputs
EMA Lengths: Default 50/100/200 (works well for swing trading).
RSI Length: 14 (standard).
Stochastic Length/K/D: Default 14/3/3.
Risk:Reward Ratio: Default 2.0 (can change to 1.5, 3.0, etc.).
EMA Proximity Threshold: Default 0.20 × ATR (adjust to be stricter/looser).
3. Read the Panel
Top-right of chart, you’ll see ✅ or ❌ for:
Trend → Are EMAs aligned?
RSI → Above 50 (bull) or below 50 (bear)?
Stoch OK → Not extreme?
Near EMA50 → Close enough to EMA50?
Above/Below OK → Price position vs. EMA50 matches trend?
Signal Now → Entry triggered?
Confidence row:
🟢 Green = Strongest
🟩 Light green = Strong
🟧 Orange = Medium
🟨 Yellow = Low
⬜ Gray = None
4. Alerts Setup
Go to TradingView Alerts (⏰ icon).
Choose the script under “Condition”.
Select alert type:
Long Setup
Short Setup
Long Cross
Short Cross
Set notification method (popup, sound, email, mobile).
Click Create.
Now TradingView will notify you automatically when signals appear.
5. Example Workflow
Wait for Confidence = Strong/Strongest.
Check if market session supports volatility (e.g., XAU in London/NY).
Review SL/TP suggestions:
Long → Entry: current price, SL: close - risk_pts, TP: close + risk_pts × RR.
Short → Entry: current price, SL: close + risk_pts, TP: close - risk_pts × RR.
Adjust based on your own price action analysis.
📊 Best Practices
Use on H1 + D1 combo → align higher timeframe bias with intraday entries.
Risk only 1–2% of account per trade (position sizing required).
Filter with market sessions (Asia, Europe, US).
Strongest signals work best with trending pairs (e.g., XAUUSD, USDJPY, BTCUSD).

Dynamic SL/TP Levels (ATR or Fixed %)This indicator, "Dynamic SL/TP Levels (ATR or Fixed %)", is designed to help traders visualize potential stop loss (SL) and take profit (TP) levels for both long and short positions, refreshing dynamically on each new bar. It assumes entry at the current bar's close price and uses a fixed 1:2 risk-reward ratio (TP is twice the distance of SL in the profit direction). Levels are displayed in a compact table in the chart pane for easy reference, without cluttering the main chart with lines.
Key Features:
Calculation Modes:
ATR-Based (Dynamic): SL distance is derived from the Average True Range (ATR) multiplied by a user-defined factor (default 1.5x). This adapts to the asset's volatility, providing breathing room based on recent price movements.
Fixed Percentage: SL is set as a direct percentage of the current close price (default 0.5%), offering consistent gaps regardless of volatility.
Long and Short Support: Calculates and shows SL/TP for longs (SL below close, TP above) and shorts (SL above close, TP below), with toggles to hide/show each.
Real-Time Updates: Levels recalculate every bar, making them readily available for entry decisions in your trading system.
Display: Outputs to a table in the top-right pane, showing precise values formatted to the asset's tick size (e.g., full decimal places for crypto).
How to Use:
Add the indicator to your chart via TradingView's Pine Editor or library.
Adjust settings:
Toggle "Use ATR?" on/off to switch modes.
Set "ATR Length" (default 14) and "ATR Multiplier for SL" for dynamic mode.
Set "Fixed SL %" for percentage mode.
Enable/disable "Show Long Levels" or "Show Short Levels" as needed.
Interpret the table: Use the displayed SL/TP values when your strategy signals an entry. For risk management, combine with position sizing (e.g., risk 1% of account per trade based on SL distance).
Example: On a volatile asset like BTC, ATR mode might set a wider SL for realism; on stable pairs, fixed % ensures predictability.
This tool promotes disciplined trading by tying levels to price action or fixed rules, but it's not financial advice—always backtest and use with your full strategy. Feedback welcome!

RSI and ATR Trend Reversal SL/TPQuick History:
I was frustrated with a standard fixed percent TP/SL as they often were not receptive to quick market rallies/reversals. I developed this TP/SL and eventually made it into a full fledge strategy and found it did well enough to publish. This strategy can be used as a standalone or tacked onto another strategy as a TP/SL. It does function as both with a single line. This strategy has been tested with TSLA , AAPL, NVDA, on the 15 minutes timeframe.
HOW IT WORKS:
Inputs:
Length: Simple enough, it determines the length of the RSI and ATR used.
Multiplier: This multiplies the RSI and ATR calculation, more on this later.
Delay to prevent Idealization: TradingView will use the open of the bar the strategy triggers on when calculating the backtest. This can produce unrealistic results depending on the source. If your source is open, set to 0, if anything else, set to 1.
Minimum Difference: This is essentially a traditional SL/TP, it is borderline unnecessary, but if the other parameters are wacky this can be used to ensure the SL/TP. It multiplies the source by the percent, so if it is set to 10, the SL/TP is initialized at src +- 10%.
Source input: Self Explanatory, be sure to update the Delay if you use open.
CALCULATION:
Parameters Initialization:
The strategy uses Heikinashi values for calculations, this is not toggleable in parameters, but can be easily changed by changing hclose to equal src.
FUNCTION INITIALIZATION:
highest_custom and lowest_custom do the same thing as ta.highest and ta.lowest, however the built in ta library does not allow for var int input, so I had to create my own functions to be used here. I actually developed these years ago and have used them in almost every strategy since. Feel especially free to use these in your own scripts.
The rsilev is where the magic happens.
SL/TP min/max are initially calculated to be used later.
Then we begin by establishing variables.
BullGuy is used to determine the length since the last crossup or crossdown, until one happens, it returns na, breaking the function. BearGuy is used in all the calculations, and is the same as BullGuy, unless BullGuy is na, where BearGuy counts up from 1 on each bar from 0.
We create our rsi and have to modify the second one to suit the function. In the case of the upper band, we mirror the lower one. So if the RSI is 80, we want it to be 20 on the upper band.
the upper band and lower band are calculated the exact same way, but mirrored. For the purpose of writing, I'm going to talk about the lower band. Assume everything is mirrored for the upper one. It finds the highest source since the last crossup or crossdown. It then multiplies from 1 / the RSI, this means that a rapid RSI increase will increase the band dramatically, so it is able to capture quick rally/reversals. We add this to the atr to source ratio, as the general volatility is a massive factor to be included. We then multiply this number by our chosen amount, and subtract it from the highest source, creating the band.
We do this same process but mirrored with both bands and compared it to the source. If the source is above the lower band, it suggests an uptrend, so the lower band is outputted, and vice versa for the upper one.
PLOTTING:
We also determine the line color in the same manner as we do the trend direction.
STRATEGY:
We then use the source again, and if it crosses up or down relative to the selected band, we enter a long or short respectively.
This may not be the most superb independent strategy, but it can be very useful as a TP/SL for your chosen entry conditions, especially in volatile markets or tickers.
Thank you for taking the time to read, and please enjoy.

Уровни SL/TP и значение ATR первого часаSession Range SL/TP Levels with Advanced ATR
Overview
The Session Range SL/TP Levels indicator is a comprehensive tool designed for session-based trading strategies, particularly for breakouts. It identifies the high and low of a user-defined time range (e.g., the Asian session) and uses a sophisticated, customizable Average True Range (ATR) calculation to project key Stop Loss (SL) and Take Profit (TP) levels.
This indicator helps traders visualize potential entry and exit points based on the volatility of a specific trading session, with all crucial data presented in a clean on-screen table.
Key Features
Customizable Trading Session: Define any time range to establish your core trading zone. The indicator will automatically find the high and low of this period.
Advanced ATR Calculation: The indicator uses an ATR calculated on a 5-minute timeframe for higher precision. You can customize:
The ATR length and smoothing method (RMA, SMA, EMA, WMA).
A unique percentage reduction from the ATR to create a more conservative volatility buffer.
Volatility-Based SL/TP Levels: Automatically calculates and plots multiple SL and TP levels for both long and short scenarios based on user-defined multipliers of the modified ATR.
Comprehensive On-Screen Display: A detailed on-screen table provides all critical data at a glance, including:
The original 5-min ATR value.
The modified ATR after the percentage reduction.
Three custom ATR-multiple values for quick reference.
All calculated SL and TP price levels for both Long and Short setups.
Copy-Friendly Data Logging: With a single click in the settings, you can print all calculated values into the Pine Logs panel, allowing for easy copying and pasting into other applications or trading journals.
How to Use
Define Your Session: In the settings, enter the time for the trading session you want to analyze (e.g., "0200-0300" for a part of the Asian session).
Identify the Range: The indicator will draw the high and low of this session once the time period is complete.
Plan Your Trade: The calculated levels provide potential targets for breakout trades.
For a Long Trade: If the price breaks above the session high, the green Take Profit lines (TP1, TP2, TP3) serve as potential exit points, while the Stop Loss (Long) level serves as a volatility-based stop.
For a Short Trade: If the price breaks below the session low, the red Take Profit lines serve as potential targets, with the Stop Loss (Short) level as the corresponding stop.
Reference the Table: Use the on-screen table to see the exact price levels and ATR values without needing to hover over the lines.