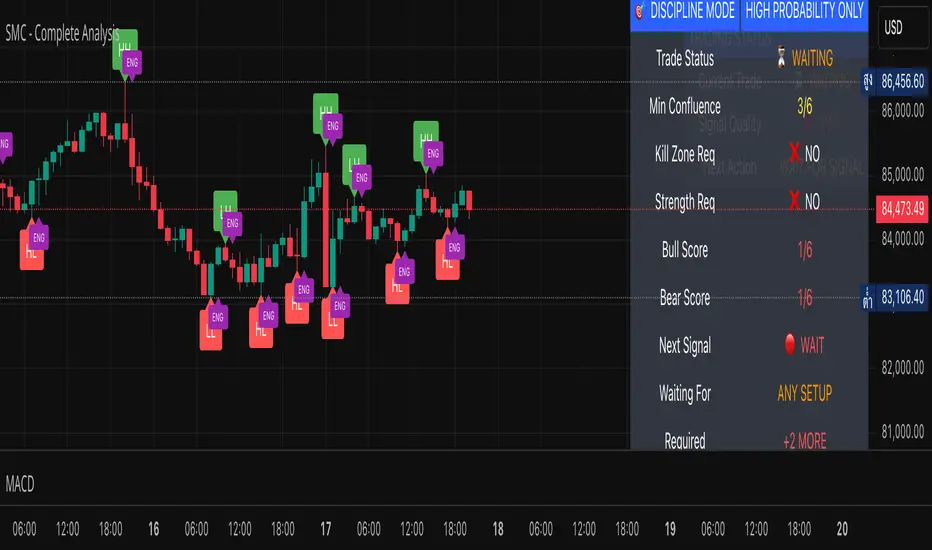
SMC - Complete AnalysisMC COMPLETE TRADING SYSTEM
📊 OVERVIEW
Professional Smart Money Concepts indicator with automated BUY/SELL signals, Entry/SL/TP prices, and 4-level market analysis for disciplined trading.
🎯 MAIN FEATURES
🟢 BUY/🔴 SELL Signals - Clear entry signals with exact prices
📍 ENTRY/SL/TP - Automated price calculations
🎪 Discipline Mode - High-probability setups only
⚡ Confluence Scoring - 6-factor signal validation
🏗️ 4 ANALYSIS LEVELS
Level 1: Market Structure
BOS/CHoCH/MSS detection
Displacement & Range analysis
Internal structure mapping
Level 2: Time-Based
Kill Zones (Asian/London/NY)
Session tracking
Daily/Weekly levels
Level 3: Entry & Risk
Smart entry triggers
Auto risk calculator
Target projections
Level 4: Advanced Analytics
Auto Fibonacci levels
Trend line detection
Smart money flow analysis
Strength meter
⚙️ SETTINGS
Default (Relaxed for more signals):
Minimum Confluence: 3/6
Kill Zone Required: OFF
Strength Bias Required: OFF
Risk per Trade: 2%
Risk:Reward: 3:1
📈 RECOMMENDED PAIRS
EURUSD (Beginners)
GBPUSD (Experienced)
XAUUSD (Best SMC signals)
EURJPY (Good structure)
⏰ BEST TIMEFRAMES
H1 - Recommended balance
H4 - High quality signals
M30 - More frequent signals
🎯 TRADING RULES
Trade ONLY on BUY/SELL signals
Use exact ENTRY/SL/TP prices
Set orders immediately
Wait for SL HIT or TP HIT
No modifications allowed
🔒 DISCIPLINE MODE
Shows signals only when confluence ≥3/6
All other features hidden by default
Simple status table
Forces disciplined trading
💡 USAGE
Wait for BUY or SELL signal
Note ENTRY/SL/TP prices
Execute trade exactly as shown
Hold until exit signal
Repeat
⚠️ IMPORTANT
No signal = No trading
2% risk maximum per trade
London/NY sessions preferred
Patience is key to success
🚀 Professional SMC system for consistent profitability through disciplined trading!
Cari dalam skrip untuk "tp"
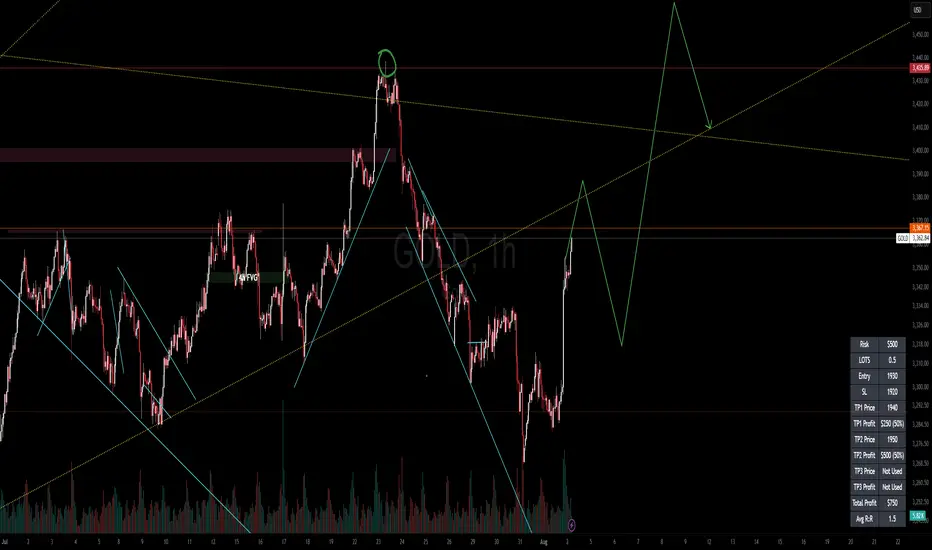
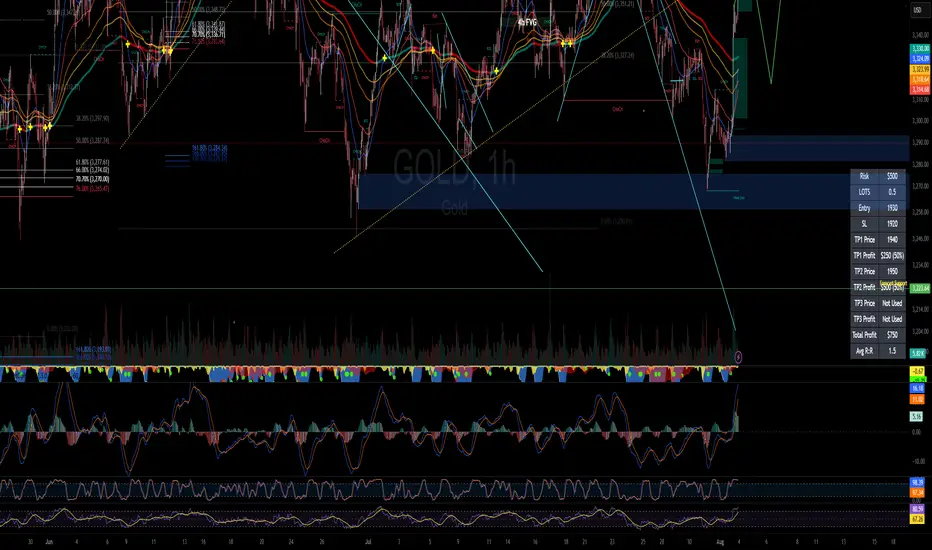
RISK MANAGEMENT CALCULATOR V3📊 RISK MANAGEMENT CALCULATOR – Lot Size, Profit & R:R Tool
This script is designed to help traders instantly calculate lot size, expected profit, and risk/reward ratio based on their trade plan.
✅ Features:
Input your Risk Amount ($), Entry, Stop Loss, and up to 3 Take Profits
Calculates:
✅ Lot Size based on risk
✅ Split profits per TP level (equally weighted)
✅ Total Profit & Risk/Reward (R:R)
Displays everything in a clean bottom-right table
Optimized for both:
🖥️ Desktop mode (larger layout)
📱 Mobile mode (toggle compact view)
💡 How to Use:
Enter your planned Entry, Stop Loss, and Risk Amount
Set any TP1, TP2, or TP3 prices (set TP to 0 if not used)
The system will auto-compute your ideal lot size and show estimated profits
🔧 Parameters:
Risk Amount ($) – how much you’re willing to lose
Entry Price – your trade entry
Stop Loss Price – your SL level
Take Profit 1/2/3 – optional TP targets
Pip Value – profit/loss per point for 1 standard lot
📱 Mobile Mode – compact the table for small screens
🔐 Notes:
No trades are executed – this is a risk planning tool only
Designed for all markets (forex, gold, indices, crypto)
TP profits are equally split (e.g. 2 TP = 50% / 50%)
RISK MANAGEMENT CALCULATOR📊 RISK MANAGEMENT CALCULATOR – Lot Size, Profit & R:R Tool
This script is designed to help traders instantly calculate lot size, expected profit, and risk/reward ratio based on their trade plan.
✅ Features:
Input your Risk Amount ($), Entry, Stop Loss, and up to 3 Take Profits
Calculates:
✅ Lot Size based on risk
✅ Split profits per TP level (equally weighted)
✅ Total Profit & Risk/Reward (R:R)
Displays everything in a clean bottom-right table
Optimized for both:
🖥️ Desktop mode (larger layout)
📱 Mobile mode (toggle compact view)
💡 How to Use:
Enter your planned Entry, Stop Loss, and Risk Amount
Set any TP1, TP2, or TP3 prices (set TP to 0 if not used)
The system will auto-compute your ideal lot size and show estimated profits
🔧 Parameters:
Risk Amount ($) – how much you’re willing to lose
Entry Price – your trade entry
Stop Loss Price – your SL level
Take Profit 1/2/3 – optional TP targets
Pip Value – profit/loss per point for 1 standard lot
📱 Mobile Mode – compact the table for small screens
🔐 Notes:
No trades are executed – this is a risk planning tool only
Designed for all markets (forex, gold, indices, crypto)
TP profits are equally split (e.g. 2 TP = 50% / 50%)
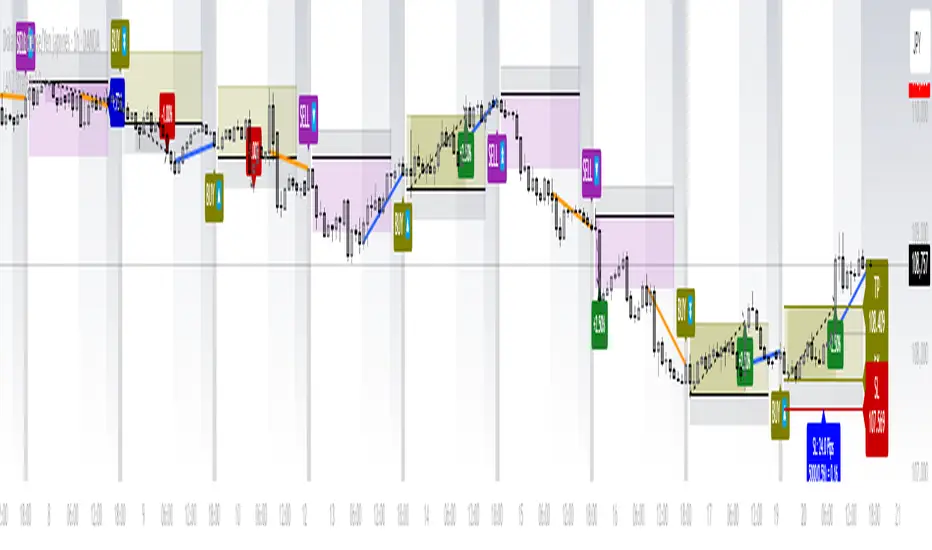
AI's Opinion Trading System V21. Complete Summary of the Indicator Script
AI’s Opinion Trading System V2 is an advanced, multi-factor trading tool designed for the TradingView platform. It combines several technical indicators (moving averages, RSI, MACD, ADX, ATR, and volume analysis) to generate buy, sell, and hold signals. The script features a customizable AI “consensus” engine that weighs multiple indicator signals, applies user-defined filters, and outputs actionable trade instructions with clear stop loss and take profit levels. The indicator also tracks sentiment, volume delta, and allows for advanced features like pyramiding (adding to positions), custom stop loss/take profit prices, and flexible signal confirmation logic. All key data and signals are displayed in a dynamic, color-coded table on the chart for easy review.
2. Full Explanation of the Table
The table is a real-time dashboard summarizing the indicator’s logic and recommendations for the most recent bars. It is color-coded for clarity and designed to help traders quickly understand market conditions and AI-driven trade signals.
Columns (from left to right):
Column Name What it Shows
Bar The time context: “Now” for the current bar, then “Bar -1”, “Bar -2”, etc. for previous bars.
Raw Consensus The raw AI consensus for each bar: “Buy”, “Sell”, or “-” (neutral).
Up Vol The amount of volume on up (rising) bars.
Down Vol The amount of volume on down (falling) bars.
Delta The difference between up and down volume. Green if positive, red if negative, gray if neutral.
Close The closing price for each bar, color-coded by price change.
Sentiment Diff The difference between the close and average sentiment price (a custom sentiment calculation).
Lookback The number of bars used for sentiment calculation (if enabled).
ADX The ADX value (trend strength).
ATR The ATR value (volatility measure).
Vol>Avg “Yes” (green) if volume is above average, “No” (red) otherwise.
Confirm Whether the AI signal is confirmed over the required bars.
Logic Output The AI’s interpreted signal after applying user-selected logic: “Buy”, “Sell”, or “-”.
Final Action The final signal after all filters: “Buy”, “Sell”, or “-”.
Trade Instruction A plain-English instruction: Buy/Sell/Add/Hold/No Action, with price, stop loss, and take profit.
Color Coding:
Green: Positive/bullish values or signals
Red: Negative/bearish values or signals
Gray: Neutral or inactive
Blue background: For all table cells, for visual clarity
White text: Default, except for color-coded cells
3. Full User Instructions for Every Input/Style Option
Below are plain-language instructions for every user-adjustable option in the indicator’s input and style pages:
Inputs
Table Location
What it does: Sets where the summary table appears on your chart.
How to use: Choose from 9 positions (Top Left, Top Center, Top Right, etc.) to avoid overlapping with other chart elements.
Decimal Places
What it does: Controls how many decimal places prices and values are displayed with.
How to use: Increase for assets with very small prices (e.g., SHIB), decrease for stocks or forex.
Show Sentiment Lookback?
What it does: Shows or hides the “Lookback” column in the table, which displays how many bars are used in the sentiment calculation.
How to use: Turn off if you want a simpler table.
AI View Mode
What it does: Selects the logic for how the AI combines signals from different indicators.
Majority: Follows the most common signal among all indicators.
Weighted: Uses custom weights for each type of signal.
Custom: Lets you define your own logic (see below).
How to use: Pick the logic style that matches your trading philosophy.
AI Consensus Weight / Vol Delta Weight / Sentiment Weight
What they do: When using “Weighted” AI View Mode, these let you set how much influence each factor (indicator consensus, volume delta, sentiment) has on the final signal.
How to use: Increase a weight to make that factor more important in the AI’s decision.
Custom AI View Logic
What it does: Lets advanced users write their own logic for when the AI should signal a trade (e.g., “ai==1 and delta>0 and sentiment>0”).
How to use: Only use if you understand basic boolean logic.
Use Custom Stop Loss/Take Profit Prices?
What it does: If enabled, you can enter your own fixed stop loss and take profit prices for buys and sells.
How to use: Turn on to override the auto-calculated SL/TP and enter your desired prices below.
Custom Buy/Sell Stop Loss/Take Profit Price
What they do: If custom SL/TP is enabled, these fields let you set exact prices for stop loss and take profit on both buy and sell trades.
How to use: Enter your preferred price, or leave at 0 for auto-calculation.
Sentiment Lookback
What it does: Sets how many bars the sentiment calculation should look back.
How to use: Increase to smooth out sentiment, decrease for faster reaction.
Max Pyramid Adds
What it does: Limits how many times you can add to an existing position (pyramiding).
How to use: Set to 1 for no adds, higher for more aggressive scaling in trends.
Signal Preset
What it does: Quick-sets a group of signal parameters (see below) for “Robust”, “Standard”, “Freedom”, or “Custom”.
How to use: Pick a preset, or select “Custom” to adjust everything manually.
Min Bars for Signal Confirmation
What it does: Sets how many bars a signal must persist before it’s considered valid.
How to use: Increase for more robust, less frequent signals; decrease for faster, but possibly less reliable, signals.
ADX Length
What it does: Sets the period for the ADX (trend strength) calculation.
How to use: Longer = smoother, shorter = more sensitive.
ADX Trend Threshold
What it does: Sets the minimum ADX value to consider a trend “strong.”
How to use: Raise for stricter trend confirmation, lower for more trades.
ATR Length
What it does: Sets the period for the ATR (volatility) calculation.
How to use: Longer = smoother volatility, shorter = more reactive.
Volume Confirmation Lookback
What it does: Sets how many bars are used to calculate the average volume.
How to use: Longer = more stable volume baseline, shorter = more sensitive.
Volume Confirmation Multiplier
What it does: Sets how much current volume must exceed average volume to be considered “high.”
How to use: Increase for stricter volume filter.
RSI Flat Min / RSI Flat Max
What they do: Define the RSI range considered “flat” (i.e., not trending).
How to use: Widen to be stricter about requiring a trend, narrow for more trades.
Style Page
Most style settings (such as plot colors, label sizes, and shapes) are preset in the script for visual clarity.
You can adjust plot visibility and colors (for signals, stop loss, take profit) in the TradingView “Style” tab as with any indicator.
Buy Signal: Shows as a green triangle below the bar when a buy is triggered.
Sell Signal: Shows as a red triangle above the bar when a sell is triggered.
Stop Loss/Take Profit Lines: Red and green lines for SL/TP, visible when a trade is active.
SL/TP Labels: Small colored markers at the SL/TP levels for each trade.
How to use:
Toggle visibility or change colors in the Style tab if you wish to match your chart theme or preferences.
In Summary
This indicator is highly customizable—you can tune every aspect of the AI logic, risk management, signal filtering, and table display to suit your trading style.
The table gives you a real-time, comprehensive view of all relevant signals, filters, and trade instructions.
All inputs are designed to be intuitive—hover over them in TradingView for tooltips, or refer to the explanations above for details.

TrendShift [MOT]📈 TrendShift – Multi-Factor Momentum & Trend Signal Suite
TrendShift is a precision-built momentum and confluence tool designed to highlight directional shifts in price action. It combines EMA slope structure, oscillator confirmation, volume behavior, and dynamic SL/TP logic into one cohesive system. Whether you're trading with the trend or catching reversals, TrendShift provides data-backed clarity and visual confidence — and it’s available free to the public.
🔍 Core Signal Logic
Buy (🟢 Long) and Sell (🔴 Short) signals are triggered when multiple conditions align within a set bar window (default: 5 bars):
Stochastic RSI K/D cross
RSI crosses above 20 (long) or below 80 (short)
Stochastic RSI breaks 20 (long) or 80 (short)
Volume exceeds 20-bar average
🧭 Visual Trend Dashboard – Signal Table
A real-time on-chart dashboard displays:
EMA Trend: Bullish / Bearish / Mixed (based on 4 EMA slopes)
Stoch RSI: Oversold / Overbought / Neutral
RSI: Exact value with zone label
Volume: Above or Below average
Dashboard theme and position are fully customizable.
📐 Trend Structure with EMA Slope Logic
Plots four EMAs (21, 50, 100, 200) color-coded by slope:
Green = Rising
Red = Falling
These feed into the dashboard's EMA Trend display.
🎯 Optional Take Profit / Stop Loss Zones
When enabled, SL/TP lines plot automatically on valid signals:
Fixed-distance targets (e.g., 10pt TP, 5pt SL)
Auto-remove on TP or SL hit
Separate lines for long vs. short trades
Fully customizable styling
🔁 Trailing Stop Filter (Internal Logic)
A custom ATR-based trailing stop helps validate directional strength:
ATR period
HHV window
ATR multiplier
Used internally — not plotted — to confirm trend progression before entry.
⚙️ Customizable Parameters
Every core component is user-configurable:
EMA periods: 21 / 50 / 100 / 200
ATR trailing logic: period, HHV, multiplier
Oscillator settings: Stoch RSI & RSI
Volume length
SL/TP toggles and point values
Bar clustering window
Dashboard theme and location
🔔 Alerts Included
BUY Signal Triggered
SELL Signal Triggered
Compatible with webhook automation or mobile push notifications.
⚠️ Disclaimer
This tool is for educational purposes only and is not financial advice. Trading involves risk — always do your own research and consult a licensed professional before making trading decisions.

Profitable Loser Model [MMT]Profitable Loser Model
Overview
The Profitable Loser Model is a powerful PineScript v6 indicator designed to enhance your trading by visualizing key price levels, session open zones, Fibonacci retracements, and premium/discount zones. This overlay indicator provides traders with a customizable toolkit to analyze market structure across any timeframe, making it ideal for intraday and swing trading strategies.
Features
Open Zone Visualization
- Plots a box based on the open and close of the first candle in a user-defined timeframe (default: 5-minute).
- Customizable box color, projection offset, and label size (Tiny, Small, Normal, Large).
- Displays a timeframe label (e.g., "5m Open Zone") for quick reference, toggleable on/off.
Session Open Lines
- Optionally draws horizontal lines at key session opens (8:30 AM, 9:30 AM, 1:30 PM, Midnight, New York time).
- Customize line color, style (Solid, Dashed, Dotted), width, and label size for each session.
- Perfect for identifying critical intraday price levels.
Premium and Discount Zones
- Highlights premium (above midpoint) and discount (below midpoint) zones based on session high/low.
- Toggleable with customizable colors and projection offsets.
- Helps traders spot overbought/oversold areas for potential mean-reversion trades.
Fibonacci Retracement Levels
- Plots user-defined Fibonacci levels (default: 0.23, 0.35, 0.5, 0.62, 0.705, 0.79, 0.886, 1, 1.1).
- Customizable line style, width, color, and labels (showing percentage and/or price).
- Dynamically adjusts based on price movement relative to the open zone.
Take Profit (TP) and Stop Loss (SL) Levels
- Highlights TP (default: 0.23) and SL (default: 1.1) Fibonacci levels with distinct colors.
- Fully customizable to align with your risk-reward strategy.
How It Works
- Session Detection : Resets daily (or per user-defined timeframe) to capture the first candle's open, high, low, and close.
- Open Zone : Draws a box between the open and close, extended forward by the projection offset.
- Session Lines : Plots lines at specified session opens with customizable styles and labels.
- Fibonacci Retracement : Adjusts levels dynamically based on session high/low and price action.
- Premium/Discount Zones : Calculated from the session range midpoint, updated in real-time.
Settings
- Open Zone :
- Timeframe (default: 5m), Calculate Timeframe (default: Daily).
- Toggle label, adjust size, box color, and projection offset.
- Session Open Lines :
- Enable/disable lines for 8:30 AM, 9:30 AM, 1:30 PM, Midnight.
- Customize color, style, width, label size, and vertical offset.
- Premium/Discount Zones :
- Toggle visibility, set colors, and adjust projection offset.
- Fibonacci Retracement :
- Toggle visibility, set custom levels, line style, width, color, and label options.
- Adjust projection offset.
- TP/SL :
- Set TP/SL Fibonacci levels and colors.
Use Cases
- Intraday Trading : Use session open lines and open zones to trade key market hours.
- Swing Trading : Leverage Fibonacci levels for potential reversal or continuation zones.
- Risk Management : Set precise TP/SL levels based on Fibonacci retracements.
- Market Structure : Identify overbought/oversold zones with premium/discount areas.
Notes
- Optimized with `dynamic_requests = true` for efficient real-time data handling.
- Visual elements (boxes, lines, labels) are cleaned up at the start of each new session.
- Session lines use New York time (`America/New_York`) for alignment with major markets.

Future is hereOverview
"Future is Here" is an original, multi-faceted Pine Script indicator designed to provide traders with a comprehensive toolset for identifying high-probability trading opportunities. By integrating volatility-based entry zones, trend-based price targets, momentum confirmation, dynamic support/resistance levels, and risk-reward ratio (RRR) calculations, this indicator offers a cohesive and actionable trading framework. Each feature is carefully designed to complement the others, ensuring a synergistic approach that enhances decision-making across various market conditions. This script is unique in its ability to combine these elements into a single, streamlined interface with clear visual cues and customizable alerts, making it suitable for both novice and experienced traders.
Key Features and How They Work Together
Volatility-Based Entry Zones
Purpose: Identifies overbought and oversold conditions using a volatility-adjusted moving average, helping traders spot potential reversal zones.
Mechanism: Utilizes a user-defined volatility length and multiplier to calculate dynamic overbought/oversold thresholds based on the standard deviation of price. Crossovers and crossunders of these levels trigger "Buy Zone" or "Sell Zone" labels.
Synergy: These zones act as the foundation for entry signals, which are later confirmed by momentum and trend filters to reduce false signals.
Trend-Based Price Targets
Purpose: Projects potential price targets based on the prevailing trend, giving traders clear objectives for profit-taking.
Mechanism: Combines a fast and slow moving average to determine trend direction, then calculates target prices using a multiplier of the price deviation from the slow MA. Labels display bullish or bearish targets when the fast MA crosses the slow MA.
Synergy: Works in tandem with entry zones and momentum signals to align targets with market conditions, ensuring traders aim for realistic price levels supported by trend strength.
Momentum Confirmation
Purpose: Validates entry signals by assessing momentum strength, filtering out weak setups.
Mechanism: Uses the momentum indicator to detect bullish or bearish momentum crossovers, labeling them as "Strong" or "Weak" based on a comparison with a smoothed momentum average.
Synergy: Enhances the reliability of buy/sell signals by ensuring momentum aligns with volatility zones and trend direction, reducing the risk of premature entries.
Dynamic Support/Resistance Levels
Purpose: Highlights key price levels where the market is likely to react, aiding in trade planning and risk management.
Mechanism: Detects pivot highs and lows over a user-defined lookback period, drawing horizontal lines for the most recent support and resistance levels (limited to two each for clarity). Labels mark these levels with price values.
Synergy: Complements entry zones and price targets by providing context for potential reversal or continuation points, helping traders set logical stop-losses or take-profits.
Buy/Sell Signals with Risk-Reward Ratios
Purpose: Generates precise buy/sell signals with integrated take-profit (TP), stop-loss (SL), and RRR calculations for disciplined trading.
Mechanism: Combines volatility zone crossovers, trend confirmation, and positive momentum to trigger signals. ATR-based TP and SL levels are calculated, and the RRR is displayed in labels for quick assessment.
Synergy: This feature ties together all previous components, ensuring signals are only generated when volatility, trend, and momentum align, while providing clear risk-reward metrics for trade evaluation.
Customizable Alerts
Purpose: Enables traders to stay informed of trading opportunities without constant chart monitoring.
Mechanism: Alert conditions are set for buy and sell signals, delivering notifications with the entry price for seamless integration into trading workflows.
Synergy: Enhances usability by allowing traders to act on high-probability setups identified by the indicator’s combined logic.
Originality
"Future is Here" is an original creation that distinguishes itself through its holistic approach to technical analysis. Unlike single-purpose indicators, it integrates volatility, trend, momentum, and support/resistance into a unified system, reducing the need for multiple scripts. The inclusion of RRR calculations directly in signal labels is a unique feature that empowers traders to evaluate trade quality instantly. The script’s design emphasizes clarity and efficiency, with cooldowns to prevent label clutter and a limit on support/resistance lines to maintain chart readability. This combination of features, along with its customizable parameters, makes it a versatile and novel tool for traders seeking a robust, all-in-one solution.
How to Use
Setup: Add the indicator to your TradingView chart and adjust input parameters (e.g., Volatility Length, Trend Length, TP/SL Multipliers) to suit your trading style and timeframe.
Interpretation:
Look for "Buy Zone" or "Sell Zone" labels to identify potential entry points.
Confirm entries with "Bull Mom" or "Bear Mom" labels and trend direction (Bull/Bear Target labels).
Use Support/Resistance lines to set logical TP/SL levels or anticipate reversals.
Evaluate Buy/Sell signals with TP, SL, and RRR for high-probability trades.
Alerts: Set up alerts for Buy/Sell signals to receive real-time notifications.
Customization: Fine-tune multipliers and lengths to adapt the indicator to different markets (e.g., stocks, forex, crypto) or timeframes.

LANZ Strategy 1.0🔷 LANZ Strategy 1.0 — Session-Based Directional Logic with Visual Multi-Account Risk Management
LANZ Strategy 1.0 is a structured and disciplined trading strategy designed for the 1-hour timeframe, operating during the NY session and executing trades overnight. It uses the directional behavior between 08:00 and 18:00 New York time to define precise limit entries for the following night. Ideal for traders who prefer time-based execution, clear visuals, and professional risk management across multiple accounts.
🧠 Core Components:
1. Session Direction Confirmation:
At 18:00 NY, the system evaluates the market direction by comparing the open at 08:00 vs the close at 18:00:
If the direction matches the previous day, it is reversed.
If it differs, the current day’s direction is kept.
This logic is designed to avoid trend exhaustion and favor potential reversal opportunities.
2. EP Level & Risk Definition:
Once direction is defined:
For BUY, EP is set at the Low of the session.
For SELL, EP is set at the High of the session.
The system automatically plots:
SL fixed at 18 pips from EP
TP at 3.00× the risk → 54 pips from EP
All levels (EP, SL, TP) are shown with visual lines and price labels.
3. Time-Restricted Entry Execution:
The entry is only valid if price touches the EP between 19:00 and 08:00 NY.
If EP is not touched before 08:00 NY, the trade is automatically cancelled.
4. Multi-Account Lot Sizing:
Traders can configure up to five different accounts, each with its own capital and risk percentage.
The system calculates and displays the lot size per account, based on SL distance and pip value, in a dynamic floating label.
5. Outcome Tracking:
If TP is hit, a +3.00% profit label is displayed along with a congratulatory alert.
If SL is hit, a -1.00% label appears with a loss alert.
If the trade is still open by 09:00 NY, it is manually closed, and the result is shown as a percentage of the initial risk.
📊 Visual Features:
Custom-colored angle and guide lines.
Dynamic angle line starts at 08:00 NY and tracks price until 18:00.
Shaded backgrounds for key time zones (e.g., 08:00, 18:00, 19:00).
BUY/SELL signals shown at 19:00 based on match/divergence logic.
Label panel showing risk metrics and lot size for each active account.
⚙️ How It Works:
08:00 NY: Marks the session open and initiates a dynamic angle line.
18:00 NY: Evaluates the session direction and calculates EP/SL/TP based on outcome.
19:00 NY: Activates limit order monitoring.
During the night (until 08:00 NY): If EP is touched, the trade is triggered.
At 08:00 NY: If no touch occurred, trade is cancelled.
Overnight: TP/SL logic is enforced, showing percentage outcomes.
At 09:00 NY: If still open, trade is closed manually and result is labeled visually.
🔔 Alerts:
🚀 EP execution alert when touched
💢 Stop Loss hit alert
⚡ Take Profit hit alert
✅ Manual close at 09:00 NY with performance result
🔔 Daily reminder at 19:00 NY to configure and prepare the trade
📝 Notes:
Strategy is exclusive to the 1-hour timeframe.
Works best on assets with clean NY session movement.
Perfect for structured, semi-automated swing/overnight trading styles.
Fully visual, self-explanatory, and backtest-friendly.
👨💻 Credits:
Developed by LANZ
A strategy created with precision, discipline, and a vision for traders who value time-based entries, clean execution logic, and visual confidence on the chart.
Special thanks to Kairos — your AI assistant — for the detailed structure, scripting, and documentation of the strategy.
[Mustang Algo] Channel Strategy# Mustang Algo Channel Strategy - Universal Market Sentiment Oscillator
## 🎯 ORIGINAL CONCEPT
This strategy employs a unique market sentiment oscillator that works on ALL financial assets. It uses Bitcoin supply dynamics combined with stablecoin market capitalization as a macro sentiment indicator to generate universal timing signals across stocks, forex, commodities, indices, and cryptocurrencies.
## 🌐 UNIVERSAL APPLICATION
- **Any Asset Class:** Stocks, Forex, Commodities, Indices, Crypto, Bonds
- **Market-Wide Timing:** BTC/Stablecoin ratio serves as a global risk sentiment gauge
- **Cross-Market Signals:** Trade any instrument using macro liquidity conditions
- **Ecosystem Approach:** One oscillator for all financial markets
## 🧮 METHODOLOGY
**Core Calculation:** BTC Supply / (Combined Stablecoin Market Cap / BTC Price)
- **Data Sources:** DAI + USDT + USDC market capitalizations
- **Signal Generation:** RSI(14) applied to the ratio, double-smoothed with WMA
- **Timing Logic:** Crossover signals filtered by overbought/oversold zones
- **Multi-Timeframe:** Configurable timeframe analysis (default: Daily)
## 📈 TRADING STRATEGY
**LONG Entries:** Bullish crossover when market sentiment is oversold (<48)
**SHORT Entries:** Bearish crossover when market sentiment is overbought (>55)
**Universal Timing:** These macro signals apply to trading any financial instrument
## ⚙️ FLEXIBLE RISK MANAGEMENT
**Three SL/TP Calculation Modes:**
- **Percentage Mode:** Traditional % based (4% SL, 12% TP default)
- **Ticks Mode:** Precise tick-based calculation (50/150 ticks default)
- **Pips Mode:** Forex-style pip calculation (50/150 pips default)
**Realistic Parameters:**
- Commission: 0.1% (adjustable for different asset classes)
- Slippage: 2 ticks
- Position sizing: 10% of equity (conservative)
- No pyramiding (single position management)
## 📊 KEY ADVANTAGES
✅ **Universal Application:** One strategy for all asset classes
✅ **Macro Foundation:** Based on global liquidity and risk sentiment
✅ **False Signal Filtering:** Overbought/oversold zones reduce noise
✅ **Flexible Risk Management:** Multiple SL/TP calculation methods
✅ **No Lookahead Bias:** Clean backtesting with realistic results
✅ **Cross-Market Correlation:** Captures broad market risk cycles
## 🎛️ CONFIGURATION GUIDE
1. **Asset Selection:** Apply to stocks, forex, commodities, indices, crypto
2. **Timeframe Setup:** Daily recommended for swing trading
3. **Sentiment Bounds:** Adjust 48/55 levels based on market volatility
4. **Risk Management:** Choose appropriate SL/TP mode for your asset class
5. **Direction Filter:** Select Long Only, Short Only, or Both
## 📋 BACKTESTING STANDARDS
**Compliant with TradingView Guidelines:**
- ✅ Realistic commission structure (0.1% default)
- ✅ Appropriate slippage modeling (2 ticks)
- ✅ Conservative position sizing (10% equity)
- ✅ Sustainable risk ratios (1:3 SL/TP)
- ✅ No lookahead bias (proper historical simulation)
- ✅ Sufficient sample size potential (100+ trades possible)
## 🔬 ORIGINAL RESEARCH
This strategy introduces a revolutionary approach to financial markets by treating the BTC/Stablecoin ratio as a global risk sentiment gauge. Unlike traditional indicators that analyze individual asset price action, this oscillator captures macro liquidity flows that affect ALL financial markets - from stocks to forex to commodities.
## 🎯 MARKET APPLICATIONS
**Stocks & Indices:** Risk-on/risk-off sentiment timing
**Forex:** Global liquidity flow analysis for major pairs
**Commodities:** Risk appetite for inflation hedges
**Bonds:** Flight-to-safety vs. risk-seeking behavior
**Crypto:** Native application with direct correlation
## ⚠️ RISK DISCLOSURE
- Designed for intermediate to long-term trading across all timeframes
- Market sentiment can remain extreme longer than expected
- Always use appropriate position sizing for your specific asset class
- Adjust commission and slippage settings for different markets
- Past performance does not guarantee future results
## 🚀 INNOVATION SUMMARY
**What makes this strategy unique:**
- First to use BTC/Stablecoin ratio as universal market sentiment indicator
- Applies macro-economic principles to technical analysis across all assets
- Single oscillator provides timing signals for entire financial ecosystem
- Bridges traditional finance with digital asset insights
- Combines fundamental liquidity analysis with technical precision

LANZ Strategy 2.0 [Backtest]🔷 LANZ Strategy 2.0 — Structural Breakout Logic with Dynamic Swing Protection
LANZ Strategy 2.0 is a precision-focused backtesting system built for intraday traders who rely on structural confirmations before the London session to guide directional bias. This tool uses smart swing detection, risk-defined position sizing, and strict time-based execution to simulate real trading conditions with clarity and control.
🧠 Core Components:
Structural Confirmation (Trend & BoS): Detects trend direction and break of structure (BoS) using a three-swing logic, aligning trade entries with valid structural movement.
Time-Based Execution: Trades are triggered exclusively at 02:00 a.m. New York time, ensuring disciplined and repeatable intraday testing.
Swing-Based SL Models: Traders can select between three stop-loss protection types:
First Swing: Most recent structural level
Second Swing: Prior level
Full Coverage: All recent swing levels + configurable pip buffer
Dynamic TP Calculation: Take-Profit is projected as a risk-based multiple (RR), fully adjustable via input.
Capital-Based Risk Management: Risk is defined as a percentage of a fixed account size (e.g., $100 per trade from $10,000), and lot size is automatically calculated based on SL distance.
Fallback Entry Logic: If structural breakout is present but trend is not confirmed, a secondary entry is triggered.
End-of-Session Management: Any open trades are automatically closed at 11:45 a.m. NY time, with optional manual labeling or review.
📊 Visual Features (Optional in Indicator Version):
(Note: Visuals apply to the indicator version of LANZ 2.0, not this backtest script)
Swing level labels (1st, 2nd) and dynamic SL/TP lines.
Real-time session coloring for clarity: Pre-London, Entry Window, and NY Close.
Outcome labels: +RR, -RR, or net % at close.
Auto-cleanup of previous drawings for a clean chart per session.
⚙️ How It Works:
Detects last trend and BoS using swing logic before 02:00 a.m. NY.
At 02:00 a.m., evaluates directional bias and executes BUY or SELL if confirmed.
Applies selected SL logic (1st, 2nd, or full swing protection).
Sets TP based on the RR multiplier.
Closes the trade either on SL, TP, or at 11:45 a.m. NY manually.
🔔 Alerts:
Time-of-day alert at 02:00 a.m. NY to monitor execution.
Can be extended to cover SL/TP triggers or new BoS events.
📝 Notes:
Designed for backtesting precision and discretionary decision-making.
Ideal for Forex pairs, indices, or assets active during the London session.
Fully customizable: session timing, swing logic, SL buffer, and RR.
👤 Credits:
Strategy built by @rau_u_lanz using Pine Script v6, combining structural logic, capital-based risk control, and London-session timing in a backtest-ready framework for traders who demand accuracy and structure.

Apex Edge - Session Sweep ProApex Edge Session Sweep Pro
By Apex Edge | 2025 Edition
🔍 What is it?
The Apex Session Sweep Pro is a precision trading tool designed for identifying high-probability liquidity sweep entries during key global market sessions. It combines powerful sweep detection logic with dynamic candle colouring, session visualization, TP projections, and real-time alerts — all within a clean, performance-optimized Pine Script engine.
This is not your average session box indicator. This is Apex-grade.
⚙️ How it Works
The indicator detects session liquidity sweeps by tracking price action relative to previous session highs and lows. When a session high/low is swept (i.e., price breaches it and then closes in the opposite direction), it generates a signal:
Buy Signal → Price sweeps previous low and closes back above it
Sell Signal → Price sweeps previous high and closes back below it
Each session is boxed on the chart (Tokyo, London, New York, Sydney), color-coded, and dynamically labelled.
Upon detecting a valid sweep, the script:
Plots a small entry label (toggleable)
Projects up to 5 customizable TP levels
Coloured candles for visual trade direction
Alerts for Buy or Sell sweep signals (optional)
All elements are memory-managed and customizable to suit your trading style.
🧠 Key Features
✅ Smart Sweep Detection Logic
✅ Global Market Session Boxes (Custom Times)
✅ Toggleable Entry Labels + TP Levels
✅ Candle Colouring by Signal
✅ Manual TP input + TP toggles
✅ Real-time Alerts for Apex entries
🕒 Why Are My Sessions Offset?
Your chart’s time zone may be different from UTC. This script is UTC-based by design, so if your chart is set to UTC+1, for example, the sessions will appear one hour later. Either:
Adjust your chart to UTC or or Exchange for perfect alignment,
Or tweak the session input times manually.
🧰 Who is this for?
This tool is made for:
Intraday traders looking for sweeps into liquidity
SMC (Smart Money Concept) strategists
Forex, crypto, and indices traders
Anyone who uses session-based levels to define entries
Whether you scalp London or ride NY swings, this tool frames each session cleanly — and shows you where the traps are laid.
🚨 Disclaimer
This indicator is a technical tool, not financial advice. Use proper risk management. Past performance ≠ future results.

External Signals Strategy Tester v5External Signals Strategy Tester v5 – User Guide (English)
1. Purpose
This Pine Script strategy is a universal back‑tester that lets you plug in any external buy/sell series (for example, another indicator, webhook feed, or higher‑time‑frame condition) and evaluate a rich set of money‑management rules around it – with a single click on/off workflow for every module.
2. Core Workflow
Feed signals
Buy Signal / Sell Signal inputs accept any series (price, boolean, output of request.security(), etc.).
A crossover above 0 is treated as “signal fired”.
Date filter
Start Date / End Date restricts the test window so you can exclude unwanted history.
Trade engine
Optional Long / Short enable toggles.
Choose whether opposite signals simply close the trade or reverse it (flip direction in one transaction).
Risk modules – all opt‑in via check‑boxes
Classic % block – fixed % Take‑Profit / Stop‑Loss / Break‑Even.
Fibonacci Bollinger Bands (FBB) module
Draws dynamic VWMA/HMA/SMA/EMA/DEMA/TEMA mid‑line with ATR‑scaled Fibonacci envelopes.
Every line can be used for stops, trailing, or multi‑target exits.
Separate LONG and SHORT sub‑modules
Each has its own SL plus three Take‑Profits (TP1‑TP3).
Per TP you set line, position‑percentage to close, and an optional trailing flag.
Executed TP/SLs deactivate themselves so they cannot refire.
Trailing behaviour
If Trail is checked, the selected line is re‑evaluated once per bar; the order is amended via strategy.exit().
3. Inputs Overview
Group Parameter Notes
Trade Settings Enable Long / Enable Short Master switches
Close on Opposite / Reverse Position How to react to a counter‑signal
Risk % Use TP / SL / BE + their % Traditional fixed‑distance management
Fibo Bands FIBO LEVELS ENABLE + visual style/length Turn indicator overlay on/off
FBB LONG SL / TP1‑TP3 Enable, Line, %, Trail Rules applied only while a long is open
FBB SHORT SL / TP1‑TP3 Enable, Line, %, Trail Rules applied only while a short is open
Line choices: Basis, 0.236, 0.382, 0.5, 0.618, 0.764, 1.0 – long rules use lower bands, short rules use upper bands automatically.
4. Algorithm Details
Position open
On the very first bar after entry, the script checks the direction and activates the corresponding LONG or SHORT module, deactivating the other.
Order management loop (every bar)
FBB Stop‑Loss: placed/updated at chosen band; if trailing, follows the new value.
TP1‑TP3: each active target updates its limit price to the selected band (or holds static if trailing is off).
The classic % block runs in parallel; its exits have priority because they call strategy.close_all().
Exit handling
When any strategy.exit() fires, the script reads exit_id and flips the *_Active flag so that order will not be recreated.
A Stop‑Loss (SL) also disables all remaining TPs for that leg.
5. Typical Use Cases
Scenario Suggested Setup
Scalping longs into VWAP‐reversion Enable LONG TP1 @ 0.382 (30 %), TP2 @ 0.618 (40 %), SL @ 0.236 + trailing
Fade shorts during news spikes Enable SHORT SL @ 1.0 (no trail) and SHORT TP1,2,3 on consecutive lowers with small size‑outs
Classic trend‑follow Use only classic % TP/SL block and disable FBB modules
6. Hints & Tips
Signal quality matters – this script manages exits, it does not generate entries.
Keep TV time zone in mind when picking start/end dates.
For portfolio‑style testing allocate smaller default_qty_value than 100 % or use strategy.percent_of_equity sizing.
You can combine FBB exits with fixed‑% ones for layered management.
7. Limitations / Safety
No pyramiding; the script holds max one position at a time.
All calculations are bar‑close; intra‑bar touches may differ from real‑time execution.
The indicator overlay is optional, so you can run visual‑clean tests by unchecking FIBO LEVELS ENABLE.

PowerHouse SwiftEdge AI v2.10 StrategyOverview
The PowerHouse SwiftEdge AI v2.10 Strategy is a sophisticated trading system designed to identify high-probability trade setups in forex, stocks, and cryptocurrencies. By combining multi-timeframe trend analysis, momentum signals, volume confirmation, and smart money concepts (Change of Character and Break of Structure ), this strategy offers traders a robust tool to capitalize on market trends while minimizing false signals. The strategy’s unique “AI” component analyzes trends across multiple timeframes to provide a clear, actionable dashboard, making it accessible for both novice and experienced traders. The strategy is fully customizable, allowing users to tailor its filters to their trading style.
What It Does
This strategy generates Buy and Sell signals based on a confluence of technical indicators and smart money concepts. It uses:
Multi-Timeframe Trend Analysis: Confirms the market’s direction by analyzing trends on the 1-hour (60M), 4-hour (240M), and daily (D) timeframes.
Momentum Filter: Ensures trades align with strong price movements to avoid choppy markets.
Volume Filter: Validates signals with above-average volume to confirm market participation.
Breakout Filter: Requires price to break key levels for added confirmation.
Smart Money Signals (CHoCH/BOS): Identifies reversals (CHoCH) and trend continuations (BOS) based on pivot points.
AI Trend Dashboard: Summarizes trend strength, confidence, and predictions across timeframes, helping traders make informed decisions without needing to analyze complex data manually.
The strategy also plots dynamic support and resistance trendlines, take-profit (TP) levels, and “Get Ready” signals to alert users of potential setups before they fully develop. Trades are executed with predefined take-profit and stop-loss levels for disciplined risk management.
How It Works
The strategy integrates multiple components to create a cohesive trading system:
Multi-Timeframe Trend Analysis:
The strategy evaluates trends on three timeframes (1H, 4H, Daily) using Exponential Moving Averages (EMA) and Volume-Weighted Average Price (VWAP). A trend is considered bullish if the price is above both the EMA and VWAP, bearish if below, or neutral otherwise.
Signals are only generated when the trend on the user-selected higher timeframe aligns with the trade direction (e.g., Buy signals require a bullish higher timeframe trend). This reduces noise and ensures trades follow the broader market context.
Momentum Filter:
Measures the percentage price change between consecutive bars and compares it to a volatility-adjusted threshold (based on the Average True Range ). This ensures trades are taken only during significant price movements, filtering out low-momentum conditions.
Volume Filter (Optional):
Checks if the current volume exceeds a long-term average and shows positive short-term volume change. This confirms strong market participation, reducing the risk of false breakouts.
Breakout Filter (Optional):
Requires the price to break above (for Buy) or below (for Sell) recent highs/lows, ensuring the signal aligns with a structural shift in the market.
Smart Money Concepts (CHoCH/BOS):
Change of Character (CHoCH): Detects potential reversals when the price crosses under a recent pivot high (for Sell) or over a recent pivot low (for Buy) with a bearish or bullish candle, respectively.
Break of Structure (BOS): Confirms trend continuations when the price breaks below a recent pivot low (for Sell) or above a recent pivot high (for Buy) with strong momentum.
These signals are plotted as horizontal lines with labels, making it easy to visualize key levels.
AI Trend Dashboard:
Combines trend direction, momentum, and volatility (ATR) across timeframes to calculate a trend score. Scores above 0.5 indicate an “Up” trend, below -0.5 indicate a “Down” trend, and otherwise “Neutral.”
Displays a table summarizing trend strength (as a percentage), AI confidence (based on trend alignment), and Cumulative Volume Delta (CVD) for market context.
A second table (optional) shows trend predictions for 1H, 4H, and Daily timeframes, helping traders anticipate future market direction.
Dynamic Trendlines:
Plots support and resistance lines based on recent swing lows and highs within user-defined periods (shortTrendPeriod, longTrendPeriod). These lines adapt to market conditions and are colored based on trend strength.
Why This Combination?
The PowerHouse SwiftEdge AI v2.10 Strategy is original because it seamlessly integrates traditional technical analysis (EMA, VWAP, ATR, volume) with smart money concepts (CHoCH, BOS) and a proprietary AI-driven trend analysis. Unlike standalone indicators, this strategy:
Reduces False Signals: By requiring confluence across trend, momentum, volume, and breakout filters, it minimizes trades in choppy or low-conviction markets.
Adapts to Market Context: The ATR-based momentum threshold adjusts dynamically to volatility, ensuring signals remain relevant in both trending and ranging markets.
Simplifies Decision-Making: The AI dashboard distills complex multi-timeframe data into a user-friendly table, eliminating the need for manual analysis.
Leverages Smart Money: CHoCH and BOS signals capture institutional price action patterns, giving traders an edge in identifying reversals and continuations.
The combination of these components creates a balanced system that aligns short-term trade entries with longer-term market trends, offering a unique blend of precision, adaptability, and clarity.
How to Use
Add to Chart:
Apply the strategy to your TradingView chart on a liquid symbol (e.g., EURUSD, BTCUSD, AAPL) with a timeframe of 60 minutes or lower (e.g., 15M, 60M).
Configure Inputs:
Pivot Length: Adjust the number of bars (default: 5) to detect pivot highs/lows for CHoCH/BOS signals. Higher values reduce noise but may delay signals.
Momentum Threshold: Set the base percentage (default: 0.01%) for momentum confirmation. Increase for stricter signals.
Take Profit/Stop Loss: Define TP and SL in points (default: 10 each) for risk management.
Higher/Lower Timeframe: Choose timeframes (60M, 240M, D) for trend filtering. Ensure the chart timeframe is lower than or equal to the higher timeframe.
Filters: Enable/disable momentum, volume, or breakout filters to suit your trading style.
Trend Periods: Set shortTrendPeriod (default: 30) and longTrendPeriod (default: 100) for trendline plotting. Keep below 2000 to avoid buffer errors.
AI Dashboard: Toggle Enable AI Market Analysis to show/hide the prediction table and adjust its position.
Interpret Signals:
Buy/Sell Labels: Green "Buy" or red "Sell" labels indicate trade entries with predefined TP/SL levels plotted.
Get Ready Signals: Yellow "Get Ready BUY" or orange "Get Ready SELL" labels warn of potential setups.
CHoCH/BOS Lines: Aqua (CHoCH Sell), lime (CHoCH Buy), fuchsia (BOS Sell), or teal (BOS Buy) lines mark key levels.
Trendlines: Green/lime (support) or fuchsia/purple (resistance) dashed lines show dynamic support/resistance.
AI Dashboard: Check the top-right table for trend strength, confidence, and CVD. The optional bottom table shows trend predictions (Up, Down, Neutral).
Backtest and Trade:
Use TradingView’s Strategy Tester to evaluate performance. Adjust TP/SL and filters based on results.
Trade manually based on signals or automate with TradingView alerts (set alerts for Buy/Sell labels).
Originality and Value
The PowerHouse SwiftEdge AI v2.10 Strategy stands out by combining multi-timeframe analysis, smart money concepts, and an AI-driven dashboard into a single, user-friendly system. Its adaptive momentum threshold, robust filtering, and clear visualizations empower traders to make confident decisions without needing advanced technical knowledge. Whether you’re a day trader or swing trader, this strategy provides a versatile, data-driven approach to navigating dynamic markets.
Important Notes:
Risk Management: Always use appropriate position sizing and risk management, as the strategy’s TP/SL levels are customizable.
Symbol Compatibility: Test on liquid symbols with sufficient historical data (at least 2000 bars) to avoid buffer errors.
Performance: Backtest thoroughly to optimize settings for your market and timeframe.

Dskyz (DAFE) Quantum Sentiment Flux - Beginners Dskyz (DAFE) Quantum Sentiment Flux - Beginners:
Welcome to the Dskyz (DAFE) Quantum Sentiment Flux - Beginners , a strategy and concept that’s your ultimate wingman for trading futures like MNQ, NQ, MES, and ES. This gem combines lightning-fast momentum signals, market sentiment smarts, and bulletproof risk management into a system so intuitive, even newbies can trade like pros. With clean DAFE visuals, preset modes for every vibe, and a revamped dashboard that’s basically a market GPS, this strategy makes futures trading feel like a high-octane sci-fi mission.
Built on the Dskyz (DAFE) legacy of Aurora Divergence, the Quantum Sentiment Flux is designed to empower beginners while giving seasoned traders a lean, sentiment-driven edge. It uses fast/slow EMA crossovers for entries, filters trades with VIX, SPX trends, and sector breadth, and keeps your account safe with adaptive stops and cooldowns. Tuned for more action with faster signals and a slick bottom-left dashboard, this updated version is ready to light up your charts and outsmart institutional traps. Let’s dive into why this strat’s a must-have and break down its brilliance.
Why Traders Need This Strategy
Futures markets are a wild ride—fast moves, volatility spikes (like the April 28, 2025 NQ 1k-point drop), and institutional games that can wreck unprepared traders. Beginners often get lost in complex systems or burned by impulsive trades. The Quantum Sentiment Flux is the antidote, offering:
Dead-Simple Setup: Preset modes (Aggressive, Balanced, Conservative) auto-tune signals, risk, and sizing, so you can trade without a quant degree.
Sentiment Superpower: VIX filter, SPX trend, and sector breadth visuals keep you aligned with market health, dodging chop and riding trends.
Ironclad Safety: Tighter ATR-based stops, 2:1 take-profits, and preset cooldowns protect your capital, even in chaotic sessions.
Next-Level Visuals: Green/red entry triangles, vibrant EMAs, a sector breadth background, and a beefed-up dashboard make signals and context pop.
DAFE Swagger: The clean aesthetics, sleek dashboard—ties it to Dskyz’s elite brand, making your charts a work of art.
Traders need this because it’s a plug-and-play system that blends beginner-friendly simplicity with pro-level market awareness. Whether you’re just starting or scalping 5min MNQ, this strat’s your key to trading with confidence and style.
Strategy Components
1. Core Signal Logic (High-Speed Momentum)
The strategy’s engine is a momentum-based system using fast and slow Exponential Moving Averages (EMAs), now tuned for faster, more frequent trades.
How It Works:
Fast/Slow EMAs: Fast EMA (Aggressive: 5, Balanced: 7, Conservative: 9 bars) and slow EMA (12/14/18 bars) track short-term vs. longer-term momentum.
Crossover Signals:
Buy: Fast EMA crosses above slow EMA, and trend_dir = 1 (fast EMA > slow EMA + ATR * strength threshold).
Sell: Fast EMA crosses below slow EMA, and trend_dir = -1 (fast EMA < slow EMA - ATR * strength threshold).
Strength Filter: ma_strength = fast EMA - slow EMA must exceed an ATR-scaled threshold (Aggressive: 0.15, Balanced: 0.18, Conservative: 0.25) for robust signals.
Trend Direction: trend_dir confirms momentum, filtering out weak crossovers in choppy markets.
Evolution:
Faster EMAs (down from 7–10/21–50) catch short-term trends, perfect for active futures markets.
Lower strength thresholds (0.15–0.25 vs. 0.3–0.5) make signals more sensitive, boosting trade frequency without sacrificing quality.
Preset tuning ensures beginners get optimized settings, while pros can tweak via mode selection.
2. Market Sentiment Filters
The strategy leans hard into market sentiment with a VIX filter, SPX trend analysis, and sector breadth visuals, keeping trades aligned with the big picture.
VIX Filter:
Logic: Blocks long entries if VIX > threshold (default: 20, can_long = vix_close < vix_limit). Shorts are always allowed (can_short = true).
Impact: Prevents longs during high-fear markets (e.g., VIX spikes in crashes), while allowing shorts to capitalize on downturns.
SPX Trend Filter:
Logic: Compares S&P 500 (SPX) close to its SMA (Aggressive: 5, Balanced: 8, Conservative: 12 bars). spx_trend = 1 (UP) if close > SMA, -1 (DOWN) if < SMA, 0 (FLAT) if neutral.
Impact: Provides dashboard context, encouraging trades that align with market direction (e.g., longs in UP trend).
Sector Breadth (Visual):
Logic: Tracks 10 sector ETFs (XLK, XLF, XLE, etc.) vs. their SMAs (same lengths as SPX). Each sector scores +1 (bullish), -1 (bearish), or 0 (neutral), summed as breadth (-10 to +10).
Display: Green background if breadth > 4, red if breadth < -4, else neutral. Dashboard shows sector trends (↑/↓/-).
Impact: Faster SMA lengths make breadth more responsive, reflecting sector rotations (e.g., tech surging, energy lagging).
Why It’s Brilliant:
- VIX filter adds pro-level volatility awareness, saving beginners from panic-driven losses.
- SPX and sector breadth give a 360° view of market health, boosting signal confidence (e.g., green BG + buy signal = high-probability trade).
- Shorter SMAs make sentiment visuals react faster, perfect for 5min charts.
3. Risk Management
The risk controls are a fortress, now tighter and more dynamic to support frequent trading while keeping accounts safe.
Preset-Based Risk:
Aggressive: Fast EMAs (5/12), tight stops (1.1x ATR), 1-bar cooldown. High trade frequency, higher risk.
Balanced: EMAs (7/14), 1.2x ATR stops, 1-bar cooldown. Versatile for most traders.
Conservative: EMAs (9/18), 1.3x ATR stops, 2-bar cooldown. Safer, fewer trades.
Impact: Auto-scales risk to match style, making it foolproof for beginners.
Adaptive Stops and Take-Profits:
Logic: Stops = entry ± ATR * atr_mult (1.1–1.3x, down from 1.2–2.0x). Take-profits = entry ± ATR * take_mult (2x stop distance, 2:1 reward/risk). Longs: stop below entry, TP above; shorts: vice versa.
Impact: Tighter stops increase trade turnover while maintaining solid risk/reward, adapting to volatility.
Trade Cooldown:
Logic: Preset-driven (Aggressive/Balanced: 1 bar, Conservative: 2 bars vs. old user-input 2). Ensures bar_index - last_trade_bar >= cooldown.
Impact: Faster cooldowns (especially Aggressive/Balanced) allow more trades, balanced by VIX and strength filters.
Contract Sizing:
Logic: User sets contracts (default: 1, max: 10), no preset cap (unlike old 7/5/3 suggestion).
Impact: Flexible but risks over-leverage; beginners should stick to low contracts.
Built To Be Reliable and Consistent:
- Tighter stops and faster cooldowns make it a high-octane system without blowing up accounts.
- Preset-driven risk removes guesswork, letting newbies trade confidently.
- 2:1 TPs ensure profitable trades outweigh losses, even in volatile sessions like April 27, 2025 ES slippage.
4. Trade Entry and Exit Logic
The entry/exit rules are simple yet razor-sharp, now with VIX filtering and faster signals:
Entry Conditions:
Long Entry: buy_signal (fast EMA crosses above slow EMA, trend_dir = 1), no position (strategy.position_size = 0), cooldown passed (can_trade), and VIX < 20 (can_long). Enters with user-defined contracts.
Short Entry: sell_signal (fast EMA crosses below slow EMA, trend_dir = -1), no position, cooldown passed, can_short (always true).
Logic: Tracks last_entry_bar for visuals, last_trade_bar for cooldowns.
Exit Conditions:
Stop-Loss/Take-Profit: ATR-based stops (1.1–1.3x) and TPs (2x stop distance). Longs exit if price hits stop (below) or TP (above); shorts vice versa.
No Other Exits: Keeps it straightforward, relying on stops/TPs.
5. DAFE Visuals
The visuals are pure DAFE magic, blending clean function with informative metrics utilized by professionals, now enhanced by faster signals and a responsive breadth background:
EMA Plots:
Display: Fast EMA (blue, 2px), slow EMA (orange, 2px), using faster lengths (5–9/12–18).
Purpose: Highlights momentum shifts, with crossovers signaling entries.
Sector Breadth Background:
Display: Green (90% transparent) if breadth > 4, red (90%) if breadth < -4, else neutral.
Purpose: Faster breadth_sma_len (5–12 vs. 10–50) reflects sector shifts in real-time, reinforcing signal strength.
- Visuals are intuitive, turning complex signals into clear buy/sell cues.
- Faster breadth background reacts to market rotations (e.g., tech vs. energy), giving a pro-level edge.
6. Sector Breadth Dashboard
The new bottom-left dashboard is a game-changer, a 3x16 table (black/gray theme) that’s your market command center:
Metrics:
VIX: Current VIX (red if > 20, gray if not).
SPX: Trend as “UP” (green), “DOWN” (red), or “FLAT” (gray).
Trade Longs: “OK” (green) if VIX < 20, “BLOCK” (red) if not.
Sector Breadth: 10 sectors (Tech, Financial, etc.) with trend arrows (↑ green, ↓ red, - gray).
Placeholder Row: Empty for future metrics (e.g., ATR, breadth score).
Purpose: Consolidates regime, volatility, market trend, and sector data, making decisions a breeze.
- VIX and SPX metrics add context, helping beginners avoid bad trades (e.g., no longs if “BLOCK”).
Sector arrows show market health at a glance, like a cheat code for sentiment.
Key Features
Beginner-Ready: Preset modes and clear visuals make futures trading a breeze.
Sentiment-Driven: VIX filter, SPX trend, and sector breadth keep you in sync with the market.
High-Frequency: Faster EMAs, tighter stops, and short cooldowns boost trade volume.
Safe and Smart: Adaptive stops/TPs and cooldowns protect capital while maximizing wins.
Visual Mastery: DAFE’s clean flair, EMAs, dashboard—makes trading fun and clear.
Backtestable: Lean code and fixed qty ensure accurate historical testing.
How to Use
Add to Chart: Load on a 5min MNQ/ES chart in TradingView.
Pick Preset: Aggressive (scalping), Balanced (versatile), or Conservative (safe). Balanced is default.
Set Contracts: Default 1, max 10. Stick low for safety.
Check Dashboard: Bottom-left shows preset, VIX, SPX, and sectors. “OK” + green breadth = strong buy.
Backtest: Run in strategy tester to compare modes.
Live Trade: Connect to Tradovate or similar. Watch for slippage (e.g., April 27, 2025 ES issues).
Replay Test: Try April 28, 2025 NQ drop to see VIX filter and stops in action.
Why It’s Brilliant
The Dskyz (DAFE) Quantum Sentiment Flux - Beginners is a masterpiece of simplicity and power. It takes pro-level tools—momentum, VIX, sector breadth—and wraps them in a system anyone can run. Faster signals and tighter stops make it a trading machine, while the VIX filter and dashboard keep you ahead of market chaos. The DAFE visuals and bottom-left command center turn your chart into a futuristic cockpit, guiding you through every trade. For beginners, it’s a safe entry to futures; for pros, it’s a scalping beast with sentiment smarts. This strat doesn’t just trade—it transforms how you see the market.
Final Notes
This is more than a strategy—it’s your launchpad to mastering futures with Dskyz (DAFE) flair. The Quantum Sentiment Flux blends accessibility, speed, and market savvy to help you outsmart the game. Load it, watch those triangles glow, and let’s make the markets your canvas!
Official Statement from Pine Script Team
(see TradingView help docs and forums):
"This warning may appear when you call functions such as ta.sma inside a request.security in a loop. There is no runtime impact. If you need to loop through a dynamic list of tickers, this cannot be avoided in the present version... Values will still be correct. Ignore this warning in such contexts."
(This publishing will most likely be taken down do to some miscellaneous rule about properly displaying charting symbols, or whatever. Once I've identified what part of the publishing they want to pick on, I'll adjust and repost.)
Use it with discipline. Use it with clarity. Trade smarter.
**I will continue to release incredible strategies and indicators until I turn this into a brand or until someone offers me a contract.
Created by Dskyz, powered by DAFE Trading Systems. Trade fast, trade bold.

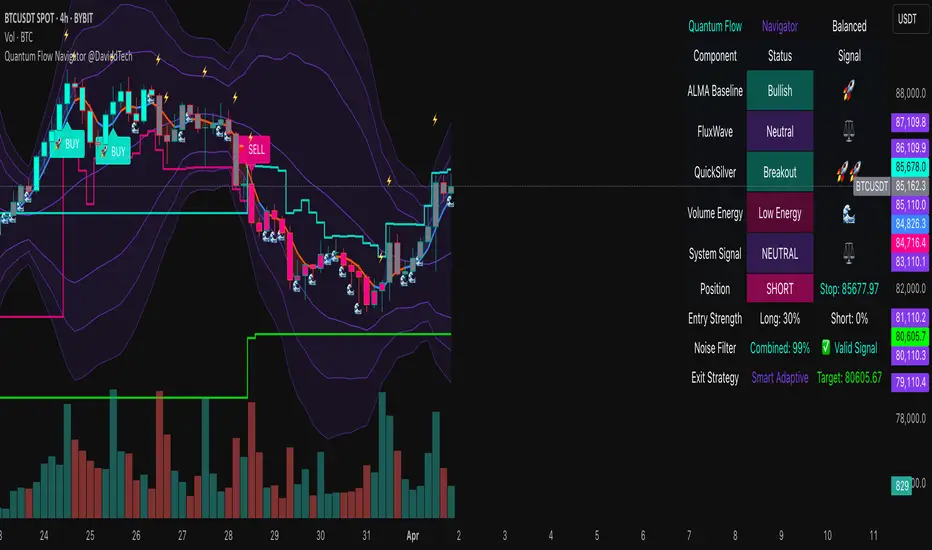
Quantum Flow Navigator @DaviddTechQuantum Flow Navigator – DaviddTech
Precision Strategy Builder Powered by Adaptive Filters, Statistical Noise Reduction & Multi-Modal Confirmation
🚀 Bullish Signal : Enter when ALMA, FluxWave, and QuickSilver all confirm bullish trend, with high volume and valid noise filter state.
🔻 Bearish Signal : Enter short when all components align bearishly and filters validate the signal.
🚪 Exit : Automatically managed by dynamic SL/TP or indicator-based reversal logic.
✅ Overview & DaviddTech Methodology
Quantum Flow Navigator is an advanced, multi-component trading system engineered around the strict modular logic of the DaviddTech methodology .
It integrates every core component required for a fully rule-based and signal-driven strategy—baseline, confirmations, volume filter, exit system, and noise filter.
Designed for traders who demand structure, clarity, and data-backed decision-making on 15M, 1H, and 4H charts.
🔍 Indicator Components
Baseline: Adaptive ALMA Filter
Smooth and responsive dynamic trend detection, with momentum validation and optional filled zones for enhanced visual feedback.
Confirmation #1: FluxWave Oscillator
Developed from an enhanced Trendlio concept by @dudeowns , FluxWave uses ALMA-smoothed rate-of-change logic with configurable signal behavior.
Confirmation #2: QuickSilver Band System
Custom breakout engine that maps volatility envelopes using multi-layered deviation bands for clear confirmation of structure breaks and trend direction.
Volume Filter: Normalized Volume Energy
Innovative volume filter inspired by @ceyhun 's work. Filters trades by classifying energy into High, Normal, or Low based on normalized volume context.
Exit System: Dynamic Momentum Stop Loss
Choose from Smart Adaptive, Trailing, Stepped, Percentage, ATR, or Volatility-adjusted logic. Supports TP via risk/reward, ATR multiples, or percentage targets.
Noise Filtration: Quantum Statistical Noise Reduction
Fuses Kalman smoothing with wavelet decomposition to eliminate non-signal noise and improve trade quality and confidence.
🎨 Visual System & Dashboard
🚀/🔻/🚪 Emoji Labels : Buy, sell, and exit trades clearly marked for instant recognition.
Color-Shifting Bars : Reflect FluxWave’s trend bias in real-time.
ALMA Fill Zone : Visual trend envelope between price and ALMA baseline.
QuickSilver Bands : Volatility envelopes with graduated depth for support/resistance awareness.
SL & TP Visuals : Dynamic stop-loss and take-profit zones plotted directly on chart.
Navigator Panel : In-chart dashboard displays real-time trend status, volume energy, noise filter state, signal strength, and active position tracking.
📈 How to Trade with It
Entry Mode Selection : Choose between Combined, ALMA, FluxWave, QuickSilver, or Custom scoring logic.
Final Signals : Trigger only when confirmations align, volume energy is valid, and noise is low.
Dashboard Summary : Use real-time signal display to validate entry strength.
Timeframes : 15M–1H recommended for swing/intraday setups; 5M–15M for automation.
💡 Advanced Features
Entry Strength Scoring: Composite weight of all active components + filters.
Cooldown System: Limits excessive signals in volatile periods.
Multiple Exit Strategies: SL & TP modes with optional indicator-based exits.
Statistical Filtering: Wavelet + Kalman combination optimizes entry confidence.
Full Alert Suite: Covers entries, exits, filter triggers, volume states, and more.
🧠 Suggested Strategy Usage
Wait for full confirmation from ALMA, FluxWave, and QuickSilver.
Ensure volume energy is High and noise filter confirms trend clarity.
Use adaptive SL/TP or indicator-based exits.
Monitor dashboard for live signal strength ≥ threshold.
Use “Balanced” mode for general use; switch to “Aggressive” for tighter signals.
📝 Credits & Originality
Concept based on DaviddTech’s component-driven methodology .
FluxWave Oscillator built as an evolved version of Trendlio with full signal customization — credit @dudeowns .
Volume Energy Filter adapted from the work of @ceyhun .
Noise filtration and system architecture developed independently using Pine Script v6.
All code and logic is original, non-rehashed, and completely refactored to ensure uniqueness.
Quantum Flow Navigator fuses adaptive baselines, confirmation logic, energy-based filters, and statistical refinement into a precision signal engine—optimized for traders who value structure, clarity, and control.
ChartPatternSetupsLibrary "ChartPatternSetups"
detectSymmetricalTriangle(lookback)
Detects a Symmetrical Triangle (Bullish or Bearish) and provides trade levels.
Parameters:
lookback (int) : Number of bars to look back for pivots.
Returns: Tuple of (isBullish, isBearish, entry, sl, tp).
detectAscendingTriangle(lookback)
Detects an Ascending Triangle (Bullish) and provides trade levels.
Parameters:
lookback (int) : Number of bars to look back for pivots.
Returns: Tuple of (isDetected, entry, sl, tp).
detectDescendingTriangle(lookback)
Detects a Descending Triangle (Bearish) and provides trade levels.
Parameters:
lookback (int) : Number of bars to look back for pivots.
Returns: Tuple of (isDetected, entry, sl, tp).
detectFallingWedge(lookback)
Detects a Falling Wedge (Bullish) and provides trade levels.
Parameters:
lookback (int) : Number of bars to look back for pivots.
Returns: Tuple of (isDetected, entry, sl, tp).
detectRisingWedge(lookback)
Detects a Rising Wedge (Bearish) and provides trade levels.
Parameters:
lookback (int) : Number of bars to look back for pivots.
Returns: Tuple of (isDetected, entry, sl, tp).

Breakout Support & Resistance SwiftEdgeBreakout Support & Resistance
The Breakout is a technical analysis tool designed to identify breakout opportunities in the market by detecting price movements through support and resistance levels. It plots potential entry points, stop-loss (SL), and take-profit (TP) levels based on user-defined percentages, helping traders visualize breakout setups on their charts.
How It Works
Support and Resistance Detection: The indicator uses pivot points to identify support and resistance levels over a user-defined lookback period.
Breakout Identification: A breakout is confirmed when the price crosses above a resistance level (bullish) or below a support level (bearish) and remains there for a specified number of bars.
Entry, SL, and TP Levels: Upon a confirmed breakout, the indicator sets an entry point at the closing price and calculates SL, TP1, and TP2 levels based on user-defined percentages.
Directional Filtering: To avoid conflicting signals, the indicator filters breakouts based on the current trade direction. A new entry in the opposite direction is only set if the price moves a user-defined percentage away from the previous entry or if the previous trade hits its SL, TP1, or TP2.
Visuals: The indicator plots support and resistance lines, breakout labels, and entry/SL/TP levels on the chart. Users can choose to display only the latest entry or up to 5 recent entries.
Features
Customizable Settings: Adjust the lookback period for pivot points, breakout confirmation bars, SL/TP percentages, and more.
Directional Change Control: A direction change is indicated when the price moves significantly in the opposite direction, helping to manage trend reversals.
Multiple Entry Display: Option to show up to 5 recent entries for tracking multiple breakouts.
Alerts: Receive alerts when a breakout is confirmed, including entry, SL, TP1, and TP2 levels.
Settings
Pivot Lookback Length: Number of bars to look back for identifying support and resistance levels (default: 5).
Breakout Confirmation Bars: Number of bars the price must stay above/below the level to confirm a breakout (default: 2).
Take Profit 1 (%): First take-profit level as a percentage above/below the entry (default: 2.0%).
Take Profit 2 (%): Second take-profit level as a percentage above/below the entry (default: 4.0%).
Stop Loss (%): Stop-loss level as a percentage below/above the entry (default: 1.0%).
Show Multiple Entries: Toggle to display up to 5 recent entries or only the latest (default: false).
Direction Change Threshold (%): Percentage the price must move away from the entry to allow a direction change (default: 2.0%).
How to Use
Add the Breakout Scanner to your chart.
Adjust the settings to match your trading style (e.g., tweak the pivot lookback or SL/TP percentages).
Watch for breakout labels ("Breakout") on the chart, indicating a confirmed breakout.
Use the plotted entry, SL, TP1, and TP2 levels to plan your trades.
Enable alerts to be notified of new breakouts in real-time.
Notes
This indicator is designed to assist with identifying breakout opportunities and does not guarantee specific results. Always combine it with other analysis and risk management techniques.
The direction change feature helps filter breakouts in the opposite direction, but significant price movements may still trigger a new entry in the opposite direction.
For best results, test the indicator on a demo account to understand its behavior in your preferred market and timeframe.

CCI with Signals & Divergence [AIBitcoinTrend]👽 CCI with Signals & Divergence (AIBitcoinTrend)
The Hilbert Adaptive CCI with Signals & Divergence takes the traditional Commodity Channel Index (CCI) to the next level by dynamically adjusting its calculation period based on real-time market cycles using Hilbert Transform Cycle Detection. This makes it far superior to standard CCI, as it adapts to fast-moving trends and slow consolidations, filtering noise and improving signal accuracy.
Additionally, the indicator includes real-time divergence detection and an ATR-based trailing stop system, helping traders identify potential reversals and manage risk effectively.
👽 What Makes the Hilbert Adaptive CCI Unique?
Unlike the traditional CCI, which uses a fixed-length lookback period, this version automatically adjusts its lookback period using Hilbert Transform to detect the dominant cycle in the market.
✅ Hilbert Transform Adaptive Lookback – Dynamically detects cycle length to adjust CCI sensitivity.
✅ Real-Time Divergence Detection – Instantly identifies bullish and bearish divergences for early reversal signals.
✅ Implement Crossover/Crossunder signals tied to ATR-based trailing stops for risk management
👽 The Math Behind the Indicator
👾 Hilbert Transform Cycle Detection
The Hilbert Transform estimates the dominant market cycle length based on the frequency of price oscillations. It is computed using the in-phase and quadrature components of the price series:
tp = (high + low + close) / 3
smooth = (tp + 2 * tp + 2 * tp + tp ) / 6
detrender = smooth - smooth
quadrature = detrender - detrender
inPhase = detrender + quadrature
outPhase = quadrature - inPhase
instPeriod = 0.0
deltaPhase = math.abs(inPhase - inPhase ) + math.abs(outPhase - outPhase )
instPeriod := nz(3.25 / deltaPhase, instPeriod )
dominantCycle = int(math.min(math.max(instPeriod, cciMinPeriod), 500))
Where:
In-Phase & Out-Phase Components are derived from a detrended version of the price series.
Instantaneous Frequency measures the rate of cycle change, allowing the CCI period to adjust dynamically.
The result is bounded within a user-defined min/max range, ensuring stability.
👽 How Traders Can Use This Indicator
👾 Divergence Trading Strategy
Bullish Divergence Setup:
Price makes a lower low, while CCI forms a higher low.
Buy signal is confirmed when CCI shows upward momentum.
Bearish Divergence Setup:
Price makes a higher high, while CCI forms a lower high.
Sell signal is confirmed when CCI shows downward momentum.
👾 Trailing Stop & Signal-Based Trading
Bullish Setup:
✅ CCI crosses above -100 → Buy signal.
✅ A bullish trailing stop is placed at Low - (ATR × Multiplier).
✅ Exit if the price crosses below the stop.
Bearish Setup:
✅ CCI crosses below 100 → Sell signal.
✅ A bearish trailing stop is placed at High + (ATR × Multiplier).
✅ Exit if the price crosses above the stop.
👽 Why It’s Useful for Traders
Hilbert Adaptive Period Calculation – No more fixed-length periods; the indicator dynamically adapts to market conditions.
Real-Time Divergence Alerts – Helps traders anticipate market reversals before they occur.
ATR-Based Risk Management – Stops automatically adjust based on volatility.
Works Across Multiple Markets & Timeframes – Ideal for stocks, forex, crypto, and futures.
👽 Indicator Settings
Min & Max CCI Period – Defines the adaptive range for Hilbert-based lookback.
Smoothing Factor – Controls the degree of smoothing applied to CCI.
Enable Divergence Analysis – Toggles real-time divergence detection.
Lookback Period – Defines the number of bars for detecting pivot points.
Enable Crosses Signals – Turns on CCI crossover-based trade signals.
ATR Multiplier – Adjusts trailing stop sensitivity.
Disclaimer: This indicator is designed for educational purposes and does not constitute financial advice. Please consult a qualified financial advisor before making investment decisions.

Dynamic Timeframe Trend AnalyzerPurpose and Core Logic
This indicator automatically adjusts its calculations based on the current chart’s timeframe, allowing traders to analyze trends, momentum, and mean reversion opportunities without manually changing indicator settings for each interval. It detects potential long or short setups by combining several techniques:
Dynamic Timeframe Factor
The script compares the current timeframe to a base (e.g., 5 minutes) and calculates a “factor” to scale certain parameters, such as EMA lengths or ATR settings. This reduces the need to reconfigure indicators when switching timeframes.
Regime Detection
It uses ADX (Average Directional Index) to classify the market as strongly trending, moderately trending, choppy, or in a potential mean-reversion phase.
RSI (Relative Strength Index) is also monitored for extreme levels (e.g., overbought/oversold) to detect potential reversal zones.
Volume is compared to a moving average to confirm or refute volatility conditions.
Trend & Mean Reversion Signals
EMA Alignment (8/21/55) helps identify bullish or bearish phases (strong bull if all EMAs align upward, strong bear if aligned downward).
For mean reversion opportunities, the script checks if ADX is sufficiently low (indicating weak or no trend) while price and RSI are at extreme levels—suggesting a snapback or countertrend move may occur.
Dynamic Stop Loss & Take Profit
Uses ATR (Average True Range) to set initial stop-loss (SL) and take-profit (TP) levels, then adjusts these levels further with “regime multipliers” based on whether the market is in a high-volatility trend or a quieter mean-reversion environment.
This approach aims to place stops and targets in a more adaptive way, reflecting current market conditions rather than a one-size-fits-all approach.
Visual Aids
Color-coded chart backgrounds (e.g., greenish for bullish trend, red for bearish, yellow/orange for mean reversion).
Triangles to show recent bullish/bearish signals.
A status table in the top-right corner (optional) displaying key metrics like ADX, RSI, dynamic thresholds, current SL/TP levels, and whether a stop loss has been hit.
How It Works Internally
ADX & Dynamic Thresholds:
A moving average (adx_mean) and standard deviation (adx_std) of the ADX are calculated over a lookback period to define “strong” vs. “weak” ADX thresholds.
This allows the script to adapt to changing volatility and trend strength in different markets or timeframes.
Mean Reversion Criteria:
The indicator checks if price deviates significantly from its own moving average, alongside RSI extremes. If ADX suggests no strong directional push (i.e., the market is “quiet”), it may classify conditions as mean-reverting.
Regime Multipliers:
Once the script identifies the market regime (e.g., strong uptrend, choppy, mean reversion), it applies different multipliers to the user-defined base values for stop-loss and take-profit. For instance, strong trending conditions might allow for wider stops to handle volatility, while mean reversion signals use tighter exits to capture quick reversals.
How to Use It
Timeframe Agnostic
Simply apply it to any timeframe (from 1-minute up to daily or weekly). The “Dynamic Timeframe Factor” will scale the indicator parameters automatically.
Look for Buy/Sell Triangles
When the script detects a valid bullish trend shift or a mean-reversion long setup, it plots a green triangle under the price bar. Conversely, it plots a red triangle above the price bar for bearish or mean-reversion short setups.
Check the Status Table
The table in the top-right corner summarizes the indicator’s current readings: ADX, RSI, volume trends, and the market regime classification.
The table also shows if a stop loss has been hit (SL Hit) and displays recommended SL/TP levels if a signal is active.
Stop Loss & Take Profit
The script plots lines for SL and TP on your chart after a new signal. These lines are automatically adjusted based on ATR, volume conditions, and ADX-derived multipliers.
Mean Reversion vs. Trend-Following
If you see a “Mean Rev” state in the table or the background turning yellow/orange, it suggests potential countertrend trades. Conversely, “STRONG BULL” or “STRONG BEAR” states favor momentum-based entries in the prevailing direction.
Originality & Benefits
Adaptive to Timeframe: Many indicators require reconfiguration when switching from short to long timeframes. This script automates that process using the “timeframe factor” logic.
Regime-Based SL/TP: Instead of fixed risk parameters, the script dynamically tunes stop and target levels depending on whether the market is trending or reverting.
Comprehensive Market View: It combines multiple factors—ADX, RSI, volume, moving averages, and volatility measurements—into a single, integrated framework that categorizes the market regime in real time.
Best Practices & Notes
Timeframes: It typically performs well on intraday timeframes (5m, 15m, 1H) but can also be used for swing trading on 4H or Daily charts.
Settings: The defaults are a good starting point, but you can adjust the base ATR multiplier or ADX lookbacks if you prefer a different balance between sensitivity and stability.
Risk Management: This indicator is not a guarantee of any specific results. Always use proper risk management (position sizing, stop-losses, and diversified strategies).
Alert Conditions: Built-in alert conditions can notify you when a new long or short signal appears, or when a stop loss is triggered.
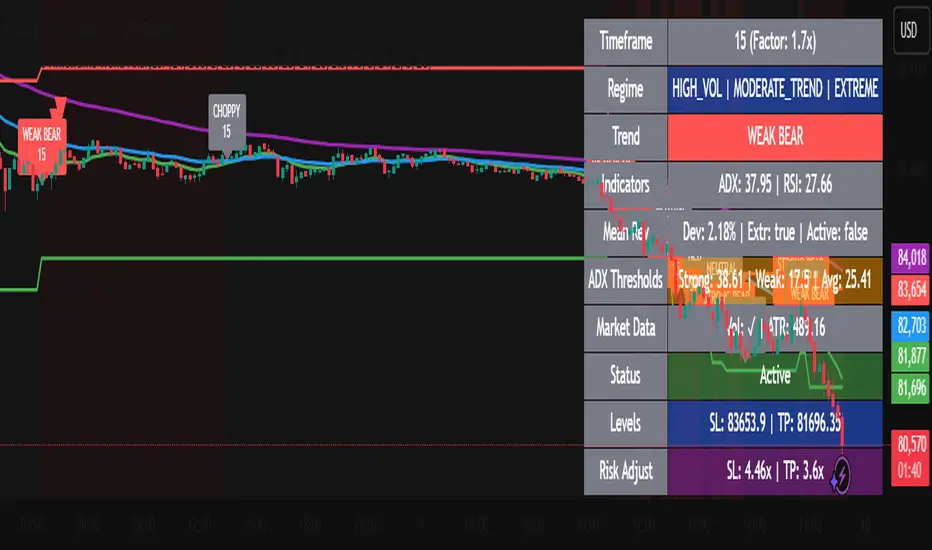
Stop Loss & TargetHow to Use the SL/TP Indicator
The SL/TP indicator is a versatile tool designed for traders to easily visualize entry, stop-loss (SL), and take-profit (TP) levels on their charts. This guide will walk you through the steps to configure and use the indicator effectively.
Features:
Configure Long Trades and Short Trades independently.
Define Entry Price, Stop Loss, and up to three Take Profit levels for each trade.
Customize line colors for better visualization.
Works for both risk-reward and target-based trading.
Adding the Indicator:
Open the TradingView platform.
Search for the indicator name: SL/TP.
Click the Add to Chart button to apply it.
Configuration:
1. Long Trade Settings
Enable Long Trade: Check this option to activate long trade lines on the chart.
Long Entry Price: Input the price at which you plan to enter the long trade.
Long Stop Loss: Input your stop-loss level for the long trade.
Line Colors: You can customize the colors for the Entry, SL, and TP lines in the Long Trade settings group.
Take Profit Levels (Calculated Automatically):
TP1: 1:1 Risk-Reward ratio (difference between Entry and SL added to Entry).
TP2: 1:2 Risk-Reward ratio.
TP3: 1:3 Risk-Reward ratio.
2. Short Trade Settings
Enable Short Trade: Check this option to activate short trade lines on the chart.
Short Entry Price: Input the price at which you plan to enter the short trade.
Short Stop Loss: Input your stop-loss level for the short trade.
Line Colors: You can customize the colors for the Entry, SL, and TP lines in the Short Trade settings group.
Take Profit Levels (Calculated Automatically):
TP1: 1:1 Risk-Reward ratio (difference between Entry and SL subtracted from Entry).
TP2: 1:2 Risk-Reward ratio.
TP3: 1:3 Risk-Reward ratio.
Visualizing on the Chart:
Once you configure the settings and enable the trade, the indicator will draw horizontal lines on the chart for:
Entry Price
Stop Loss
Take Profit Levels (TP1, TP2, TP3)
Each line will extend to three bars ahead of the current bar index.
Customization:
Adjust colors for better visibility depending on your chart theme.
The width and style of lines can also be modified in the source code if needed.
Example Usage:
Long Trade Example:
Enable Long Trade: Check the box.
Set Entry Price: 100.
Set Stop Loss: 95.
The indicator will draw the following lines:
Entry Line: At 100 (customizable color).
Stop Loss Line: At 95 (customizable color).
TP1 Line: At 105 (1:1 Risk-Reward).
TP2 Line: At 110 (1:2 Risk-Reward).
TP3 Line: At 115 (1:3 Risk-Reward).
Short Trade Example:
Enable Short Trade: Check the box.
Set Entry Price: 200.
Set Stop Loss: 205.
The indicator will draw the following lines:
Entry Line: At 200 (customizable color).
Stop Loss Line: At 205 (customizable color).
TP1 Line: At 195 (1:1 Risk-Reward).
TP2 Line: At 190 (1:2 Risk-Reward).
TP3 Line: At 185 (1:3 Risk-Reward).
Notes:
Ensure that you input valid and realistic price levels for Entry and Stop Loss.
The indicator will only display lines if both the Entry Price and Stop Loss are non-zero.
Use this indicator for planning trades visually but always confirm levels with your trading strategy.
Disclaimer: This indicator is a tool to assist in trading. Use it with proper risk management and your own due diligence.

Lot Size & Risk Calculator (All Pairs)this indicator is designed to simplify and optimize risk management. It automatically calculates the ideal lot size based on your account balance, risk percentage, and defined entry and exit levels. Additionally, it includes visual tools to represent stop-loss (SL) and take-profit (TP) levels, helping you trade with precision and consistency.
WHAT IS THIS INDICATOR FOR?
This indicator is essential for traders who want to:
Maintain consistent risk in their trades.
Quickly calculate lot sizes for Forex, XAUUSD, BTCUSD, and US100.
Visualize key levels (Entry, SL, and TP) on the chart.
Monitor potential losses and gains in real time.
COMPATIBLE ASSETS
The Lot Size Calculator works with the following assets:
Forex: Standard currency pairs.
XAUUSD: Gold versus the US dollar.
BTCUSD: Bitcoin versus the US dollar.
US100: Nasdaq 100 index.
Calculations adjust automatically based on the selected asset.
TAKE-PROFIT (TP) LEVELS
The indicator allows you to define up to three take-profit levels:
TP1
TP2
TP3
.
Each level is configurable based on your exit strategy.
DASHBOARD
The dashboard is a visual tool that consolidates key information about your trade:
Account balance: Total amount available in your account.
Lot size: Calculated based on your risk and parameters.
Potential loss (SL): Amount you could lose if the price hits your stop-loss.
Potential gain (TP): Expected profit if the take-profit level is reached.
SETTINGS
The indicator offers multiple configurable options to adapt to your trading style:
Levels
Entry: Initial trade price.
Stop-Loss (SL): Maximum allowed loss level.
Take-Profit (TP): Up to three configurable levels.
Risk Management
Account balance ($): Enter your total available balance.
Risk percentage: Define how much you're willing to risk per trade
.
Visual Options
Visualization style: Choose between simple lines or visual fills.
Colors: Customize the colors of lines and labels.
Dashboard Settings
Statistics: Enable or disable key data display.
Size and position: Adjust the dashboard's size and location on the chart.
HOW TO CHANGE AN ENTRY?
Open the indicator settings in TradingView and entering the new data manually
Removing and re-adding the indicator to the chart

SL ManagerSTOP LOSS MANAGER
Overview:
The "SL Manager" indicator is designed to assist traders in managing their stop loss (SL) and take profit (TP) levels for both long and short positions. This tool helps you visualize intermediate levels, enhancing your trading decisions by providing crucial information on the chart.
Usage:
This indicator is particularly useful for traders who want to manage their trades more effectively by visualizing potential adjustment points for their stop loss and take profit levels. It helps in making informed decisions to maximize profits and minimize risks by providing clear levels to take partial profits and adjust stop losses.
Features:
Position Input: Select between "long" and "short" positions.
Entry Price: Specify the entry price of your trade.
Take Profit: Define the price level at which you want to take profit.
Stop Loss: Set the stop loss price level to manage your risk.
Intermediate Levels:
For both long and short positions, the indicator calculates and plots the following intermediate levels:
50% Take Profit (TP 50%): Midway between the entry price and the take profit level, where you can take partial profits and move your SL up to the 25% mark.
75% Take Profit (TP 75%): Three-quarters of the way from the entry price to the take profit level, where you can take partial profits and move your SL to breakeven.
Stop Loss Move to 25% (SL Move to 25%): A level where the stop loss can be adjusted to lock in profits.
Visualization:
The indicator plots the calculated levels directly on the chart, provided the data for the current day is available. Different color codes and line styles distinguish between the various levels:
TP 50% and TP 75% are plotted in green.
SL Move to 25% is plotted in red .
Entry/Breakeven is plotted in blue.

Tetuan SniperThe TEMA and EMA Crossover Alert with SL, TP, and Order Signal strategy combines the power of Triple Exponential Moving Average (TEMA) and Exponential Moving Average (EMA) to generate high-quality trading signals. This strategy is designed to provide clear entry and exit points, manage risk through dynamic Stop Loss (SL) and Take Profit (TP) levels, and optimize trade sizes based on account balance and risk tolerance.
Key Features:
EMA and TEMA Crossover:
The strategy identifies potential buy and sell signals based on the crossover of EMA and TEMA. A buy signal is generated when TEMA crosses above EMA, and a sell signal is generated when TEMA crosses below EMA.
Dynamic Stop Loss (SL) and Take Profit (TP):
Stop Loss levels are dynamically set based on a user-defined number of pips below (for buy orders) or above (for sell orders) the lowest or highest point since the crossover.
Take Profit levels are dynamically adjusted using another TEMA, providing a flexible exit strategy that adapts to market conditions.
Lot Size Calculation:
The strategy calculates the optimal lot size based on the account balance, risk percentage per trade, and the number of maximum open orders. For JPY pairs, the lot size is adjusted by dividing by 100 to account for the different pip value.
The lot size is rounded to two decimal places for better readability and precision.
Visual Alerts and Labels:
Clear visual alerts and labels are provided for each buy and sell signal, including the recommended SL, TP, and lot size. The labels are placed in a way to avoid overlapping important chart elements.
Trend Visualization:
The area between the TEMA and EMA is colored to indicate the trend, with green for bullish trends and red for bearish trends, making it easy to visualize the market direction.
Inputs:
SL Points: Number of pips for the Stop Loss.
EMA Period: Period for the Exponential Moving Average.
TEMA Period: Period for the Triple Exponential Moving Average.
Account Balance: The total account balance for calculating the lot size.
Risk Percentage: The percentage of the account balance to risk per trade.
Take Profit TEMA Period: Period for the TEMA used to set Take Profit levels.
Lot per Pip Value: The value of 1 pip per lot.
Maximum Open Orders: The maximum number of open orders to split the balance among.
Example Usage
This strategy is suitable for traders who want to automate their trading signals and manage risk effectively. By combining TEMA and EMA crossovers with dynamic SL and TP levels and precise lot size calculation, traders can achieve a disciplined and methodical approach to trading.
