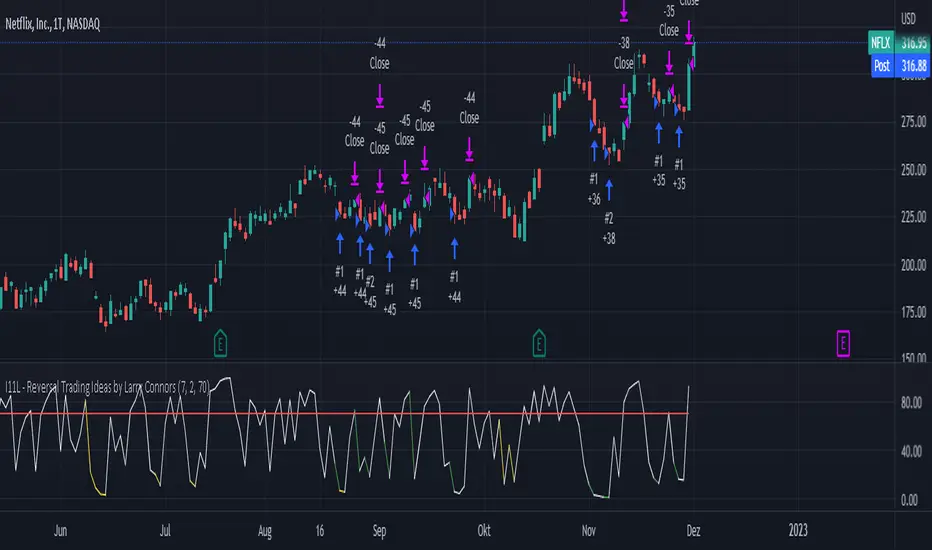
I11L - Reversal Trading Ideas by Larry ConnorsThis is my own Twist on Larry Connors Simple Tradingideas.
It Combines the RSI, Averaging In and the Lowest Bars in a Single System.
The current Configuration is designed for the Daily Timeframe.
Feel free to play with the Parameters and keep in mind that Larry Intended to buy fear and sell the greed!
The Rules are the following:
---Buy---
Buy, if the lowest Bar of your Configuration has been hit (default is set to 7).
---Average Down--
Buy, if the lowest Bar of your Configuration * Your open trades has been hit AND only if the buyin is atleast 1% cheaper.
---Close---
Close, if the RSI closes above a certain level (default is set to 70).
---TP---
There is no TP
---SL---
There is no SL, so be cautions of your tail Risk!
Cari dalam skrip untuk "tp"
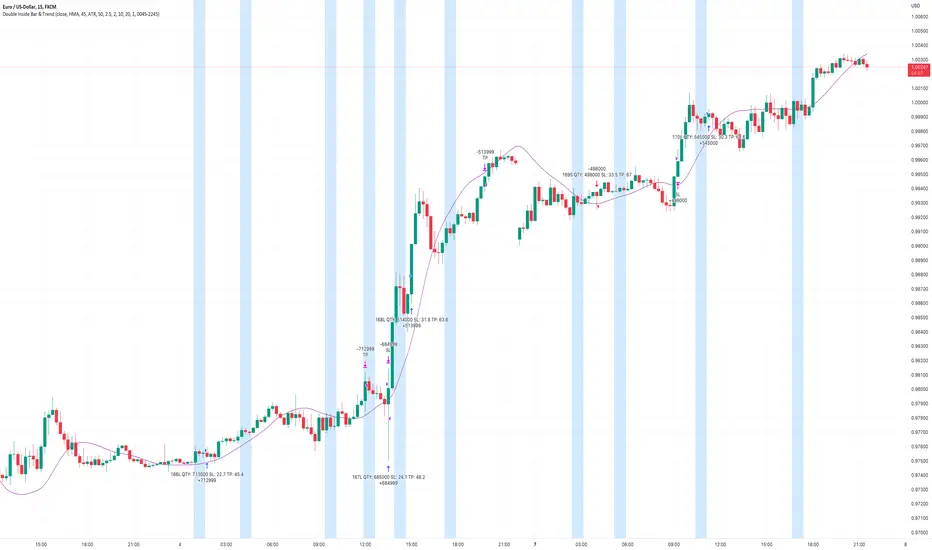
Double Inside Bar & Trend Strategy - KaspricciDouble Inside Bar & Trend Strategy - Kaspricci
This strategy combines the Double Inside Bar candlestick pattern with a trend filter. Once the second inside bar closes and price is above trend moving average, a buy stop order is placed at high of the candle. If price is below trend moving average, a sell stop order is placed at the low of the candle.
This strategy is for educational purposes only! It is not meant to be a financial advice.
Settings
Trend source, type of moving average and length for calculating trend
Stop Loss Type - default: ATR. You can switch between stop loss calculation based on Average True Range value or fixed value.
ATR Length / Factor / TP Ratio - default: 14 / 2.0 / 2.0. Used to calculate the Stop Loss as ATR * Factor and Take Profit as Stop Loss * TP Ratio.
FIX Stop Loss / Take Profit - default: 10 pips / 20 pips. In case you select Stop Loss Type = FIX, these value swill be used.
Risk in % - default: 1%, option to adjust the quantity of a trade based on a defined risk percentage. If enabled, it will overwrite the quantity parameter of the strategy settings.
On top you can filter trades by start and end date as well as time of the day.
The Only EURUSD Trading Strategy You Need - KaspricciThe Only EURUSD Trading Strategy You Need
I got the idea to this strategy from a youtube video uploaded by Trade Beta. It is designed to capture the early market move of major forex pair EURUSD at beginning of New York Stock Exchange (13:30 GMT). Trade Beta tested his strategy on the 5 minute chart. I have set all parameters to same values as shown in the video.
The strategy creates two pending orders at the recent swing high and low. Once the first pending order entered, the remaining one is cancelled. Latest at the end of market session all pending orders are cancelled and all open trade are closed as well.
In rare case that price at session opening is above swing high, only a pending sell stop order is created at swing high price. And in case price is below swing low, a pending buy stop order is created.
Settings
Trading Time - default: New York Stock Exchange opening hours. Pending orders are created at the close of the first candle within the session.
Swing High Source / Bars - default: High / 5 bars. Used to find the latest swing high within a range of 5 bars left and right. Price is used for buy stop order.
Swing Low Source / Bars - default: Low / 5 bars. Used to find the latest swing low within a range of 5 bars left and right. Price is used for sell stop order.
Stop Loss Type - default: ATR. You can switch between stop loss calculation based on Average True Range value or fixed value.
ATR Length / Factor / TP Ratio - default: 14 / 2.0 / 2.0. Used to calculate the Stop Loss as ATR * Factor and Take Profit as Stop Loss * TP Ratio.
FIX Stop Loss / Take Profit - default: 10 pips / 20 pips. In case you select Stop Loss Type = FIX, these value swill be used.
This strategy is for educational purposes only! It is not meant to be a financial advice.

[XRP][1h] Chanu Delta inspired — Breakeven StrategyHello, this is my first TV contribution. I usually don't publish anything but the script is a quick review of an other contributor (Chanu Delta V3 script )
I reverse engineered this indicator today as I wanted to test it on other contracts. The original version (which aims to be traded on BTC) has been ported to XRP (as btc and xrp prices are narrowly correlated) then modified with a couple of what I believe are improvements:
- No backtest bias even with `security` function.
- Extra backtest bias validation, always trading on next bar as Crossover/under bias is confirmed
- Backtest with 2 ajustable TP, ajustable equity and breakeven option
- The current version is not design to use pyramiding as it would require extra logic to monitor the lifecycle of the position in the context of a study.
- Commented alerts examples with variables available in script scope so you can use them in alerts (just replace strategy with indicator and remove backtest related code block).
- Trade filling assumption set to 10, fees to 0.02 as the are default bybit maker fees and I advice to enter with trailing orders using a max of 2 ticks as offset to lower fees rather than a market order!
- Backtest and Alerts happen on barclose.
- No repaint guaranteed.
There are a thousand ways to improve it (adx/bb based dynamic TP/SL, order lifecycle, pyramiding...) but it seems to be a cool starting point.
Don't forget to have fun!

Crypto BTC Correlation Scalper Gaps StrategyThis strategy is based on the gaps theory.
In this case we have the BTC futures from CME, which acts in a way similar to stocks, and we can have gaps present between close/open session, and also sometimes between same candle due to huge movements intra candle.
At the same time I have combined this with a daily moving average, to help out a bit with the trend, since we are looking at small timeframe like 1-15/30min .
On top of that we have a reverse option, where long = short and viceversa, which can be used with against BTC pairs .
Rule are simple:
For long, we have a long gap and the close of the correlated candle is above daily sma
For short, we have a short gap and the close of the correlated candle is below daily sma
For exit:
For exit, we take the highest highest values for short entry TP, meaning we get the different from the HH and rest the current open candle distance, and use that distance as a TP.
At the same time for long entry, we take the lowest low value and rest current close of the candle to that value, and we get the TP.
Can also be applied this logic for SL aswell but from the test I have found out that exiting based on a reverse condition(when tp is not being hit), gives better results/dd overall.
If you have any questions, please let me know !

VXMA BotThis strategy is separated version of Cloud MA form VXD Cloud Edition, Let called it "VXMA".
what's changed?
renew TP/SL Work
Simplify code and clean look.
Risk:Reward Calculation
Risk of Ruin Setting can now selected between Fixed $ or %
if Buy your Stoploss will be Swing low
if Sell your Stoploss will be Swing high and can be setting at Pivot Setting
then Auto Position Sizing and TP line will be calculated form there and will show in Orange color line (Draw Position Box is available)
Alert Setting
{{strategy.order.alert_message}}
Python-Bot
github.com
There are 2 mode : one-way mode and hedge mode is different script on my Github profile.
read README. MD and there's video tutorial.
Pls study app.py and it's script before deploy for your own safty and your own risk, I'm NOT responsible for your loss.
GOODLUCK

SuperVos Trade calculatorHave all your trade data in one small overview.
- TP amount in USD and %
- RR of the trade
- Cost if stoploss is hit
- Total profit in USD
- Account growth in percentage
- Sets automatic alerts on SL, entry en TP's if enabled
Enjoy!

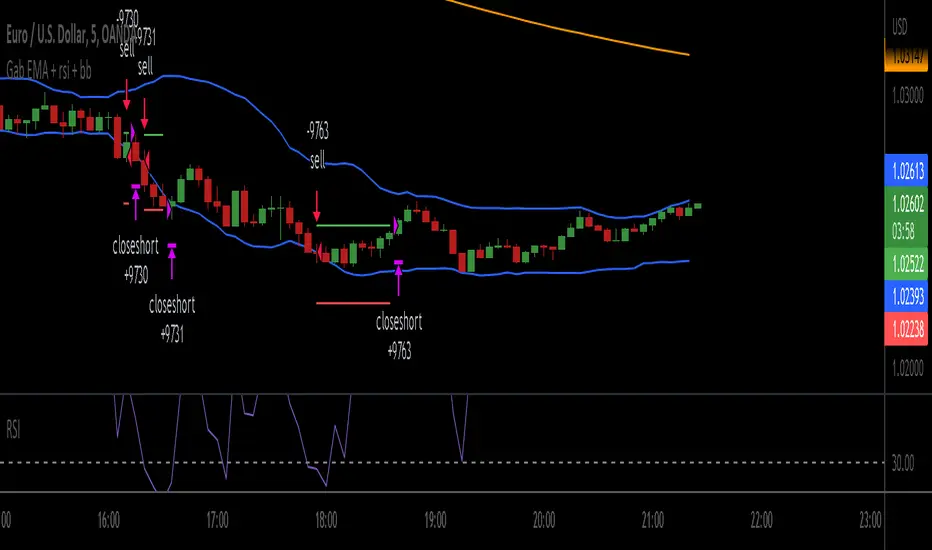
Gab EMA + rsi + bbscrypt I made for a friend
you are welcome bro ;)
simple strategy
BB Default
RSI 3
200 ema
200 EMA gives the trend direction.
if RSI is over bought and candle touch BB upper band then there will be buy entry. (Price must be above 200 ema)
If RSI is over sold and price touch bb lower band then there will be sell entry. (Price must be below the 200 ema)
SL will be 1 ATR of the entry candle. Tp will 2:1.
***Missing TP and SL values
BEST Strategy Template AutoviewHello Traders
I've build a strategy template building for you the AUTOVIEW commands
I made this template based on this documentation: use.autoview.with.pink
You can select whether you want to use an SL or not, a TP or not, using the borrow/repay feature (only for Binance), ... and it will build dynamically the Autoview commands and will send them when entry/exit alerts trigger.
The template accept SL/TP in percentage or pips/USD distance from the entry price
MAGICAL !!!! (not really, just some dumb coding)
Users will have to specify from the settings:
- the Autoview account name
- the symbol name: I couldn't capture it from the chart because sometimes the symbol name on the broker side is different than the one from the TradingView side
- the position size
- the broker name (Tradovate, Binance, Bitmex, FTX, ...)
- if you want to send the alerts to your DEMO or LIVE account
- a debug mode to check if your alerts are well formatted
- and a few other interesting options...
If you want to use it, you'll have to update the dummy entries logic lines 97-98 and replacing those two lines by your own stuff
I'll make the ProfitView and 3Commas and Alertatron versions shortly.
Basically the same script but with the commands built for those 3 automation third-parties.
Best regards
Dave

MPF EMA Cross Strategy (8~13~21) by Market Pip FactoryThis script is for a complete strategy to win maximum profit on trades whilst keeping losses at a minimum, using sound risk management at no greater than 1.5%
The 3x EMA Strategy uses the following parameters for trade activation and closure.
1/ Daily Time Frame for trend confirmation
2/ 4 Hourly Time Frame for trend confirmation
3/ 1 Hourly Time Frame for trend confirmation AND trade execution
4/ 3x EMAs (Exponential Moving Averages)
* EMA#1 = 8 EMA (Red Color)
* EMA#2 = 13 EMA (Blue Color)
* EMA#3 = 21 EMA (Orange Color)
5/ Fanning of all 3x EMAs and CrossOver/CrossUnder for Trend Confirmation
6/ Price Action touching an 8 EMA for trade activation
7/ Price Action touching a 21 EMA for trade cancellation BEFORE activation
* For LONG trades: 8 EMA would be ABOVE 21 EMA
* For SHORT trades: 8 EMA would be BELOW 21 EMA
* For trade Cancellation, price action would touch the 21 EMA before trade is activated
* For trade Entry, price action would touch 8 EMA
Once trigger parameter is identified, entry is found by:
a) Price action touches 8 EMA (Candle must Close for confirmed Trade preparation)
b) Trade preparation can be cancelled before trade is activated if price action touches 21 EMA
c) Trailing Stop Loss can be used (optional) by counting back 5 candles from current candle
CLOSURE of a Trade is identified by:
e) 8 EMA crossing the 21 EMA, then close trade, no matter LONG or SHORT
f) Trail Stop Loss
IMPORTANT:
g) No more than ONE activated trade per EMA crossover
h) No more than ONE active trade per pair
NOTE: This strategy is to be used in conjunction with Cipher Twister (my other indicator) to reduce trades on
sideways price action and market trends for super high win ratio.
NOTE: Enabling of LONGs and SHORTs Via Cipher Twister is done by using the previous
green or red dot made. Additionally, when the trend changes, so do the dot's validity based
on being above or below the 0 centerline.
----------------------------
Strategy and Bot Logic
----------------------------
.....::: FOR SHORT TRADES ONLY :::.....
The Robot must use the following logic to enable and activate the SHORT trades:
Parameters:
$(crossunder)=8EMA,21EMA=Bearish $(crossover)=8EMA,21EMA=Bullish $entry=SELL STOP ORDER (Short)
$EMA#1 = 8 EMA (Red Color) $EMA#2 = 13 EMA (Blue Color) $EMA#3 = 21 EMA (Orange Color)
Strategy Logic:
1/ Check Daily Time Frame for trend confirmation if:
(look back up to 50 candles - find last cross of EMAs)
$(chart)=daily and trend=$(crossunder) then goto 2/ *Means: crossunder = ema21 > ema8
$(chart)=daily and trend=$(crossover) then stop (No trades) *Means: crossover = ema8 > ema21
NOTE: This function is switchable. 0=off and 1=on(active). Default = 1 (on)
2/ Check 4 Hourly Time Frame for trend confirmation if:
(look back up to 50 candles - find last cross of EMAs)
$(chart)=4H and trend=$(crossunder) then goto 3/ *Means: crossunder = ema21 > ema8
$(chart)=4H and trend=$(crossover) then stop (No trades) *Means: crossover = ema8 > ema21
NOTE: This function is switchable. 0=off and 1=on(active). Default = 1 (on)
3/ 1 Hourly Time Frame for trend confirmation AND trade execution if:
(look back up to 50 candles - find last cross of EMAs)
$(chart)=1H and trend=$(crossunder) then goto 4/ *Means: crossunder = ema21 > ema8
$(chart)=1H and trend=$(crossover) then stop (No trades) *Means: crossover = ema8 > ema21
4/ Trade preparation:
* if Next (subsequent) candle touches 8EMA, then set STOP LOSS and ENTRY
* $stoploss=3 pips ABOVE current candle HIGH
* $entry=3 pips BELOW current candle LOW
5/ Trade waiting (ONLY BEFORE entry is hit and trade activated):
* if price action touches 21 EMA then cancel trade and goto 1/
Note: Once trade is active this function does not apply !
6/ Trade Activation:
* if price activates/hits ENTRY price, then bot activates trade SHORTs market
7/ Optional Trailing stop:
* if active, then trailing stop 3 pips ABOVE previous HIGH of previous 5th candle
or * Move Stop Loss to Break Even after $X number of pips
NOTE: This means count back and apply accordingly to the 5th previous candle from current candle.
NOTE: This function is switchable. 0=off and 1=on(active). Default = 0 (off)
8/ Trade Close ~ Take Profit:
* Only TP when
$(chart)=1H and trend=$(crossover) then close trade ~ Or obviously if Stop Loss is hit if 7/ is activated.
----------END FOR SHORT TRADES LOGIC----------
.....::: FOR LONG TRADES ONLY :::.....
The Robot must use the following logic to enable and activate the LONG trades:
Parameters:
$(crossunder)=8EMA,21EMA=Bearish $(crossover)=8EMA,21EMA=Bullish $entry=BUY STOP ORDER (Long)
$EMA#1 = 8 EMA (Red Color) $EMA#2 = 13 EMA (Blue Color) $EMA#3 = 21 EMA (Orange Color)
Strategy Logic:
1/ Check Daily Time Frame for trend confirmation if:
(look back up to 50 candles - find last cross of EMAs)
$(chart)=daily and trend=$(crossover) then goto 2/ *Means: crossover = ema8 > ema21
$(chart)=daily and trend=$(crossunder) then stop (No trades) *Means: crossunder = ema21 > ema8
NOTE: This function is switchable. 0=off and 1=on(active). Default = 1 (on)
2/ Check 4 Hourly Time Frame for trend confirmation if:
(look back up to 50 candles - find last cross of EMAs)
$(chart)=4H and trend=$(crossover) then goto 3/ *Means: crossover = ema8 > ema21
$(chart)=4H and trend=$(crossunder) then stop (No trades) *Means: crossunder = ema21 > ema8
NOTE: This function is switchable. 0=off and 1=on(active). Default = 1 (on)
3/ 1 Hourly Time Frame for trend confirmation AND trade execution if:
(look back up to 50 candles - find last cross of EMAs)
$(chart)=1H and trend=$(crossover) then goto 4/ *Means: crossover = ema8 > ema21
$(chart)=1H and trend=$(crossunder) then stop (No trades) *Means: crossunder = ema21 > ema8
4/ Trade preparation:
* if Next (subsequent) candle touches 8EMA, then set STOP LOSS and ENTRY
* $stoploss=3 pips BELOW current candle LOW
* $entry=3 pips ABOVE current candle HIGH
5/ Trade waiting (ONLY BEFORE entry is hit and trade activated):
* if price action touches 21 EMA then cancel trade and goto 1/
Note: Once trade is active this function does not apply !
6/ Trade Activation:
* if price activates/hits ENTRY price, then bot activates trade LONGs market
7/ Optional Trailing stop:
* if active, then trailing stop 3 pips BELOW previous LOW of previous 5th candle
or * Move Stop Loss to Break Even after $X number of pips
NOTE: This means count back and apply accordingly to the 5th previous candle from current candle.
NOTE: This function is switchable. 0=off and 1=on(active). Default = 0 (off)
8/ Trade Close ~ Take Profit:
* Only TP when
$(chart)=1H and trend=$(crossunder) then close trade ~ Or obviously if Stop Loss is hit if 7/ is activated.
----------END FOR LONG TRADES LOGIC----------
IMPORTANT:
* If an existing trade is already open for that same pair, & price action touches 8EMA, do NOT open a new trade..
* bot must continuously check if a trade is currently open on the pair that triggers
* New trades are to be only opened if there is no active trade opened on current pair.
* Only 1 trade per pair rule !
* 5 simultaneous open trades (not same pairs) default = 5 but value can be changed accordingly.
* Maximum risk management must not exceed 1.5% on lot size
*** Some features are not yet available autoated, they will be added in due course in subsequent version updates ***

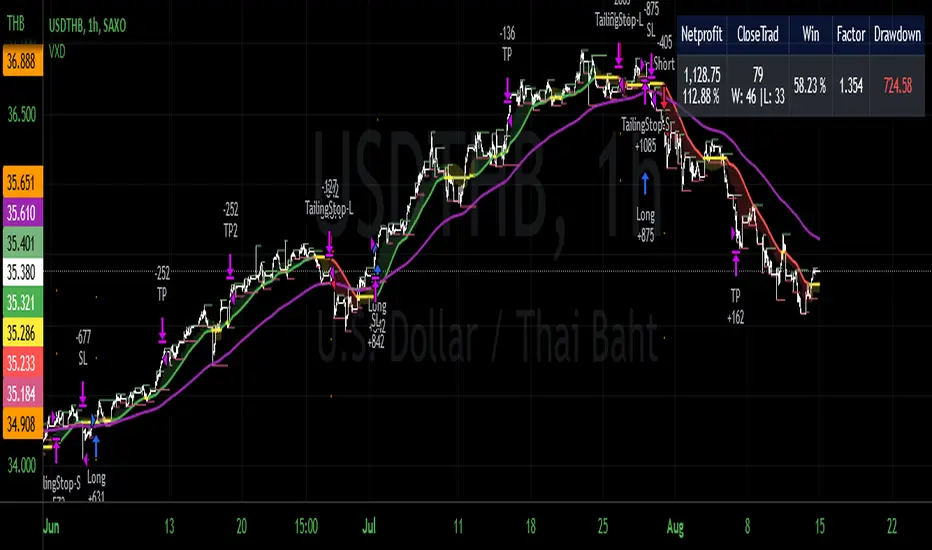
VXD Cloud EditionVXD Cloud Edition.
to overcome sideways market conditions this cloud configured for low timeframe.
every TA is same as VXD Supercycle but show as cloud.
Symbols on chart show Premium and Discount Prices
X-Cross = Engulfing Candle with weak volume .
O-circle - Engulfing Candle with strong volume .
Pivot point and Rejected Block
Pivot show last High and low of a price in past bars
Rejected Block show when that High or Low price are important level to determined if it's Hidden Divergence or Divergence (with RSI)
Setting
Momentum: RSI = 25 , RSI MA = 14
Trend: Rolling VWAP and ATR and Subhag (Everthing show as a cloud)
Trailing STOP: ATR 12 x 2.4
Highlight Bars color when volume is above SMA 6
SMA200 act as TP Line
Risk:Reward Calculation
if Buy your Stoploss will be previous Pivot low
if Sell your Stoploss will be previous Pivot high
and TP line will be calculated form there, then show in Orange color line
Buy condition : Close is above Cloud and close above pivot high
Sell condition : Close is below Cloud and close below pivot low
Trip : add this to alerts setting.
Order {{strategy.order.action}} filled on {{ticker}} @ {{strategy.order.price}} {{strategy.order.alert_message}}.
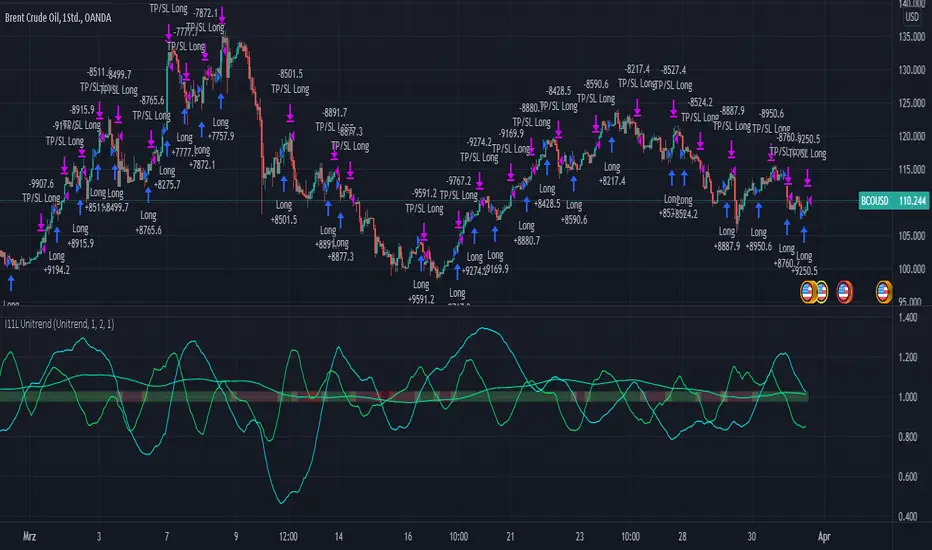
RSI, EMA, SMA Trendtrading - Oil Daytrading 1HThe Unitrend trading System produces trading recommendations on a pure Trend basis.
It is a Score based system.
--- How to use the System --
Simply adjust your capital you want to risk per trade and your TP Factor.
The TP Factor is the multiple of your risked Capital, also known as Risk/Reward ratio.
Furthermore you can toggle between a always Buy mode, to see if the System is better then market.
Compounding mode helps you to get a better understanding of your maximum drawdown with a total equity based approach.
--- How are Signals produced? ---
A score of 2 or 3 is a BUY signal.
You can count the score by looking at the lines above 1, or by reading the color.
Green is 3, yellow 2, orange 1 and red is 0.
The score is calculated by 3 conditions.
Each applying condition yields one point for the score.
The score resets each bar.
The rules are:
RSI > 45: Well known indicator, usually looks for reversal points but seems to produce above average results when above 45.
EMA(RSI) > SMA(RSI): My approach to momentum detection for the RSI movement, I consider a faster growing RSI as a good thing.
EMA(close) > SMA(close): My approach to trend detection for the market movement. Common Wisdom would be a fast SMA > slow SMA which I found to be too slow for the modern market.
Uptrend and Oversold Index Swing Trading System 8H--- Foreword ---
The Overbought and Oversold Index Swing Trading System or short: I11L Hypertrend primarily uses money management Strategies, EMA and SMA and my momentum Ideas for trying to produce satisfactory Alpha over a timespan of multiple years.
--- How does it Work? ---
It uses 20 different EMA's and SMA's to produce a score for each Bar.
It will credit one Point If the EMA is above the SMA.
A high score means that there is a strong Uptrend.
Spotting the strong Uptrend early is important.
The I11L Hypertrend System trys to spot the "UPTREND" by checking for a crossover of the Score(EMA) / Score(SMA).
A low score means that there is a strong Downtrend.
Its quite common to see a reversal to the mean after a Downtrend and spotting the bottom is important.
The System trys to spot the reversal, or "OVERSOLD" state by a crossunder of the Score(EMA) / Score(SMA).
--- What can i customize? ---
-> Trading Mode: You can choose between two different trading modes, Oversold and Overbought(trend) and Random Buys to check if your systems Profitfactor is actually better then market.
-> Work with the total equity: The system uses the initial capital per default for Backtesting purposes but seeing the maximum drawdown in a compounding mode might help!
-> Use a trailing SL: A TSL trys to not lose too much if the trade goes against your TP
-> Lookbackdistance for the Score: A higher Lookbackdistance results in a more lagging indicator. You have to find the balance between the confirmation of the Signal and the frontrunning.
-> Leverage: To see how your strategie and your maximum Drawdown with the total equity mode enabled would have performed.
-> Risk Capital per Trade unleveraged: How much the underlying asset can go against your position before the TSL hits, or the SL if no TSL is set.
-> TPFactor: Your risk/reward Ratio. If you risk 3% and you set the ratio to 1.2, you will have a TP at 3 * 1.2 = 3.6%
-> Select Date: Works best in the 8H Timeframe for CFD's. Good for getting a sense of what overfitting actually means and how easy one can fool themself, find the highest Profitfactor setting in the first Sector (Start - 2012) and then see if the second Sector (2012 - Now) produces Alpha over the Random Buy mode.
--- I have some questions about the System ---
Dear reader, please ask the question in the comment Section and i will do my best to assist you.

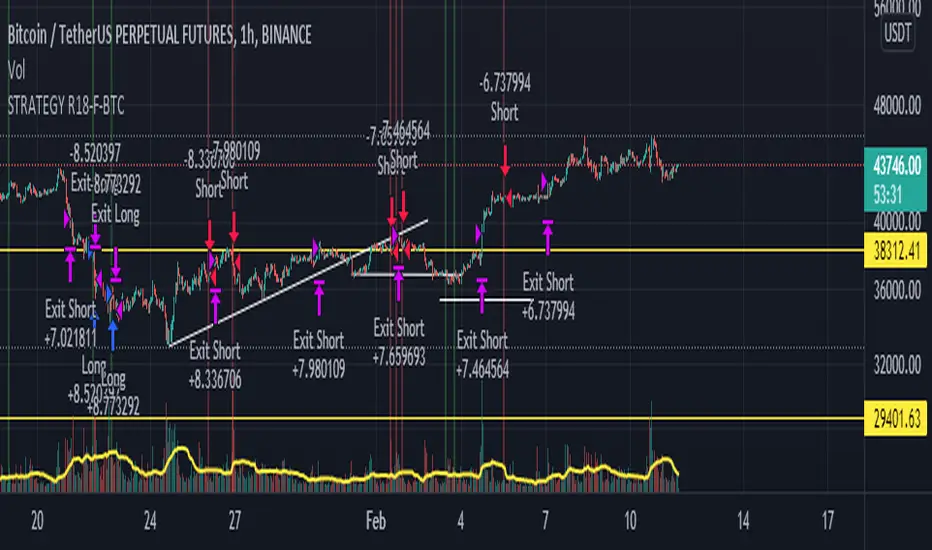
STRATEGY R18-F-BTCHi, I'm @SenatorVonShaft
Just finished the strategy "STRATEGY R18-F-BTC" for trading on #bitcoin and other cryptocurrencies.
As any strategy on TradingView, R18 opens Long/Short positions (with no leverage) on certain price points for assets in the chart. But I intentionally make this strategy for Bitcoin . Strategy is effective with 1h chart and it has %36 winning trade ratio for #bitcoin trade. As strategy uses approximately 1/3 ratio of SL/TP levels, gross profit for 1 year backtest is above %200 (I mean above 3x for only BTC )
Strategy is built on combination of:
- MACD
- RSI
- FIBONACCI levels
- BTCUSDT price itself as indicator (for different crypto assets and BTCUSDTPERP trading. You can select different assets you like for indicator (it's BTCUSDT:Binance by default))
I fine-tuned all levels of indicators above accordingly (it has more than 10 variables that effects strategy itself).
You can find out your own strategy levels by adjusting long/short tp&sl variables as well as initial capital ratio variable.
Reverse option open reverse positions of the strategy
RedK Auto-Stepping Ladder TraderThe RedK Auto-Stepping Ladder Trader is an experimental tool to help identify trade entry and exits for various types of trades (Trend / Momentum / Breakout and Swing trades)
The underlying concept here is loosely similar to the SMAC script - in case you'd like to read some of the "script-specific" write-up . I even borrowed some of the SMAC code, but upgraded the script to Pine v5 while working. So i won't repeat write-up here on how the script works - and we'll get right into how to use in trading
How to use / trade the Ladder Trader:
-------------------------------------------------
The idea is to set the auto-stepping ladder to a higher timeframe, the "ladder view" helps simplify the price action to show a clear direction, then use the lower timeframe to find best entries (close or at the ladder line) and exits (on the ATR as TP target)
- Entries should be as close to the ladder line as possible - a trader may decide to have a small margin above or below the ladder line where they set entry limit order
- note that when stepping is enabled, the auto-stepping algo will choose the step value based on the underlying price range and the selected timeframe to move with common trader "mental values" where traders will usually gravitate
- exits can be set using the optional ATR or Pct channels - by default, there's an ATR channel (golden color) for that purpose
Possible usage scenarios of the Ladder Trader:
--------------------------------------------------------------
- Trend / long(er) term: enter position once the ladder line switches to the color corresponding to my desired direction (example: blue for long), and hold all the way until the color changes
- Swing: Take only trades in the direction of the ladder (long with blue, short with orange) - enter at the ladder line value, set TP at the desired ATR, repeat as long as the direction holds
- Feel free to experiment and share back other uses you find. There are so many settings and tweaks provided for flexibility - the downside is this adds a certain level of complexity - however, i hope this will be a valuable tool to add to your trading.
Few Notes:
-----------------------
- The Auto-stepping algo is a bit improved to be more FOREX and Crypto-friendly - i do not trade these instruments myself, but will continue to improve the auto-stepping technique in upcoming updates
- the signal line (hidden by default, and is what causes the ladder to change color) is based on my Compound Ratio Moving Average - since it's the moving average i found to provide best combination of speed and smoothness. It is used as a proxy to the price, to signal when the price is above or below the ladder level - while removing some of the whipsaws if we use the price value directly.
- Broader analysis of price action should still be made using other indicators - and possibly other chart setups - we shouldn't rely on the Ladder Trader signal only - Check for overall momentum, volume movement and market sentiment before using the Ladder Trader
- Also test your settings in PaperMoney - i noticed that different instruments may need different settings (for Ladder Type, Length, Rounding Technique, ATR multiplier..etc) for optimal setup that shows best signals.. Get very familiar with the Ladder Trader and it should hopefully become more helpful to you as a tradiing tool.
Comments and Feedback are welcome. Good luck.

SQZ Multiframe StrategyThis is a first attempt to automate what my current strategy when trading is.
It uses 2 timeframes: the one you are currently using to see the chart and an "anchor trend" which is a higher order frame.
Supported timeframes are: 1m, 5m, 15m, 30m, 1H, 4H, 1D, 1W
The Strategy relies on two indicators:
Squeeze Momentum Indicator
CMF
How does it works?
It looks for a moment when the following conditions are met.
For Long:
Positive directionality in SQZM monitor in anchor timeframe
Positive directionality in SQZM monitor in current timeframe
Recent minimum in CMF
For Short:
Negative directionality in SQZM monitor in anchor timeframe
Negative directionality in SQZM monitor in current timeframe
Recent maximum in CMF
After a BUY or SELL order is executed the plot will start showing two lines: A TP line, and a SL line.
The TP and SL move dynamically based on a greedy algorithm based on 3 input parameters.
Min Profit to Start Moving SL (%): Sets an initial target for the trade.
Maximum Possible of SL (%): This is the maximum amount possible for SL. If volatility is not too high, a shorter SL will be chosen based on Kaufman's Stops method
Take profit factor: Is how much portion of the target I am taking as profit once the target is reached
Example for 5% Min profit:
When the first target is reached (+5%), the SL will be updated to 2.5% over the enter price.
When the second target is reached (+10%), the SL will be updated to 5% over the enter price.
Note: The strategy might abandon the position prematurely if a contrary signal is received while the trade is opened, and will change direction.
The Strategy has been backtested mostly for crypto. It might be good for stocks too, but the parameters mentioned might need some adjustments since price moves at a different rate.
Recommended timeframe is 4H for BTC , and 30min/1H for alts.
Comments and ideas are more than welcome!

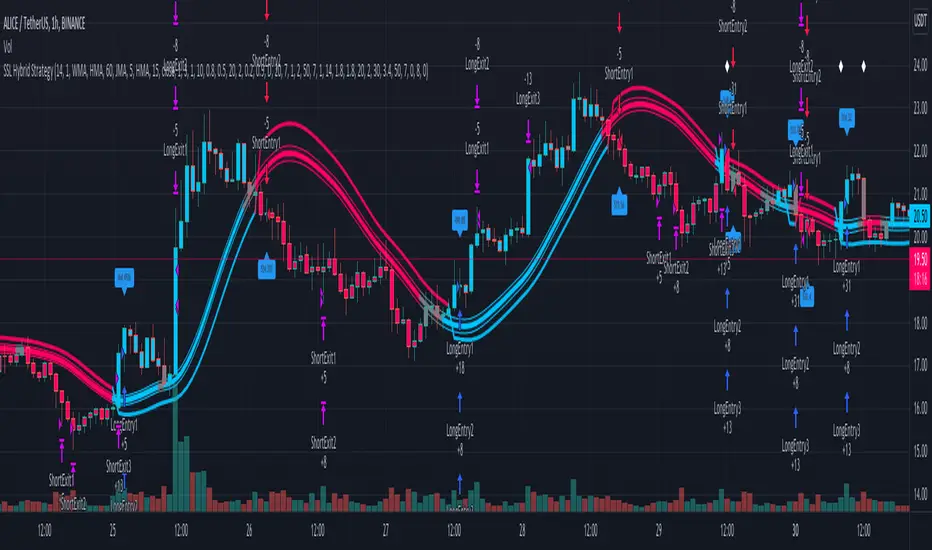
SSL Hybrid StrategyStrategy based on the SSL Hybrid indicator by Mihkel00
Designed for the purpose of back testing
Strategy:
Enters both long and short trades based on SSL1 crossing the baseline
Stop Loss calculated based on ATR multiplier
Option to allow moving of Stop Loss to break even on TP1
Option to turn off Stop Loss and Take Profit which will rely on indicator flip to exit from position
Take Profits configurable with up to 5 ATR multipliers and exits percentages (percentages calculated as percentages of original position size, eg. 100 tokens with 3 TPs of 20, 30, 50 would exit the same number of tokens on each TP)
Credits:
SSL Hybrid Mihkel00 www.tradingview.com
DMI + HMA - No Risk ManagementDMI (Directional Movement Index) and HMA (Hull Moving Average)
The DMI and HMA make a great combination, The DMI will gauge the market direction, while the HMA will add confirmation to the trend strength.
What is the DMI?
The DMI is an indicator that was developed by J. Welles Wilder in 1978. The Indicator was designed to identify in which direction the price is moving. This is done by comparing previous highs and lows and drawing 2 lines.
1. A Positive movement line
2. A Negative movement line
A third line can be added, which would be known as the ADX line or Average Directional Index. This can also be used to gauge the strength in which direction the market is moving.
When the Positive movement line (DI+) is above the Negative movement line (DI-) there is more upward pressure. Ofcourse visa versa, when the DI- is above the DI+ that would indicate more downwards pressure.
Want to know more about HMA? Check out one of our other published scripts
What is this strategy doing?
We are first waiting for the DMI to cross in our favoured direction, after that, we wait for the HMA to signal the entry. Without both conditions being true, no trade will be made.
Long Entries
1. DI+ crosses above DI-
2. HMA line 1 is above HMA line 2
Short Entries
1. DI- Crosses above DI+
2. HMA line 1 is below HMA lilne 2
Its as simple as that.
Conclusion
While this strategy does have its downsides, that can be reduced by adding some risk manegment into the script. In general the trade profitability is above average, And the max drawdown is at a minimum.
The settings have been optimised to suite BTCUSDT PERP markets. Though with small adjustments it can be used on many assets!

Forex bot full strategy with risk managementThis is a full strategy designed for forex major pairs, specially EUR/USD using 1h time frame chart.
Its components are
200 EMA
MACD
OBV
PSAR
RIsk management with tp and sl movements
Rules for entry
For long = Previous histogram from MACD was below 0 and current one is above 0. CLose of a candle is above EMA 200 , OBV oscillator is negative and we have an uptrend from PSAR
For short = Previous histogram from MACD was above 0 and current one is below 0. CLose of a candle is below EMA 200 , OBV oscillator is positive and we have an downtrend from PSAR
Rules for exit
For tp and sl values we calculate the distance from the close of candle until the psar values.
If you have any questions, let me know !

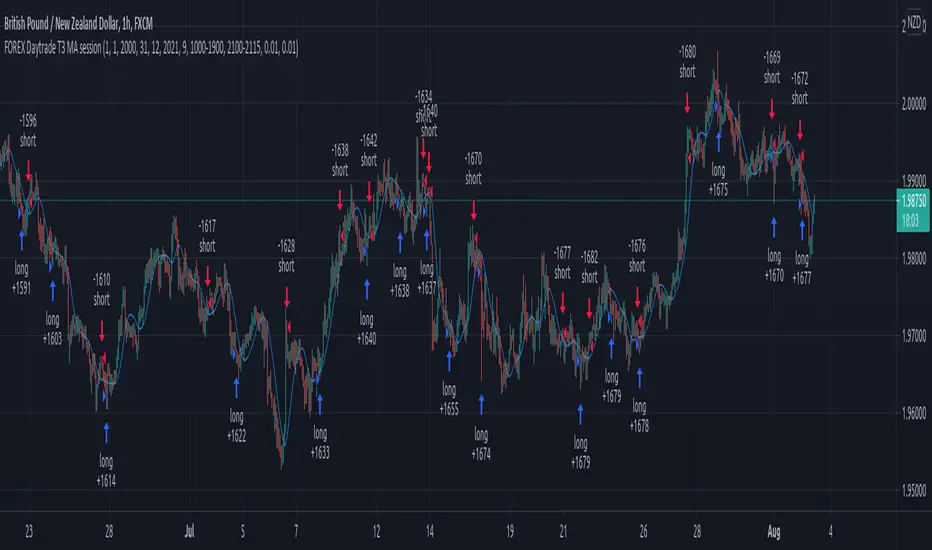
Forex Daytrade T3 MA sessionThis is a simple yet very efficient daytrading strategy for most crosses pairs, like EUR/NZD, EUR/AUD , GBP/NZD, GBP/AUD and so on.
It tends to works best with 1h and 15 min time frame charts.
Its components are :
Entry time = session that we want to trade, where we can combine for example half of London and all of NY using an hour system.
T3 Moving average
Price action.
Rules for entry
For long , we are during the hours we want to trade, current close is price is above previous high and at the same time is above moving average
For short , we are during the hours we want to trade, current close is price is below previous low and at the same time is below moving average
Rules for exit
We exit when either the opposite condition is triggered, if the hours of trading are off or based on a percentage TP/SL system movement.
For this example we use 1% movement both for TP and SL
If you have any questions, let me know !
TradePro's Trading Idea Cipher Divergence EMA Pb StrategyHere I present you on of Trade Pro's Trading Idea: Cipher B+ Divergence EMA Pullback Strategy.
Optimized the crypto pairBTC/USDT in the 30 minute chart.
There is the possibility to switch between short and long positions.
You can choose between 2 different take profit/stop loss types: The Lowest Low/ Highest High Stop Loss/ Take Profit and the ATR Take Profit/ Stop Loss.
-----------------------------------------------------------------------------------
How does the strategy work?
ENTRY
Long
The price must be above the 200 EMA .
The price needs to make a pullback into the 50 EMA .
Right after that, the Cipher B indicator must give a buy signal, it must be below the zero line and the Money Flow cloud must be green.
Short
Contrary to the premise of long positions.
EXIT
Lowest Low/ Highest High Exit
The Lowest Low (long) / highest high (short) serves as the stop loss. The TP is formed on the basis of a factor.
(Long for example: *Lowest Low* multiplied by *Profitfactor* = TP).
ATR Exit
The value of ATR at the time of buying is multiplied by the value entered in "Profit factor ATR" and "Stop factor ATR". As soon as the price reaches this value, it is closed.
Important
The script must be optimized for each coin or currency pair. However, only the values for the profit factor, the stop loss and Lowest Low / Highest High are relevant.
Also, by changing the Chanel Length and the Chanel Average, you can create strong profit changes.
The results of the strategy are without commissions and leverage.
If you have any questions or feedback, please let me know in the comments.
If you need more information about the strategy and want to know exactly how to apply it, check out my profile. There I have created a tutorial for the function of the script.

MACD EMA - TradingRush StrategyHey there!
Today I present you a rather simple, but very profitable MACD strategy. Since I trade it with cryptocurrencies, the settings have been adjusted.
I discovered the strategy on a YouTube channel and tried to transfer it as a strategy into a script.
Tested with the crypto pair ETH/USDT in the 15 minute chart.
There is the possibility to switch between short and long positions.
-----------------------------------------------------------------------------------
How does the strategy work?
ENTRY
The MACD indicator must cross below the histogram. If it crosses when the price is below the EMA, only short positions are traded. Above the EMA - long.
EXIT
The Lowest Low (long) / highest high (short) serves as the stop loss. The TP is formed on the basis of a factor. (SL multiplied by factor 2.1 = TP).
The red lines are used to illustrate the SL. Above for short positions below for long positions.
The results of the strategy are without commissions and levers.
If you have any questions or feedback, please let me know in the comments.
If you need more information about the strategy and want to know exactly how to apply it, check out my profile.
I wish you good luck with the strategy!

Bollinger Bands strategy with RSI and MACD v1.0 This is a strategy based on the Bollinger Bands, where buy trades are made when the price crosses the lower line of the Bollinger Bands upwards, and sell trades are made when the price crosses the upper line downwards.
In addition, it is possible through the inputs to enable trading with RSI and MACD, so that buy or sell trades are supported by these two indicators.
Trades are partially and fully closed in the following way, a buy trade will close half of the position when the price touches the middle line of the Bollinger bands and will be fully closed when the price touches the upper band. In the case of a sell position, half of the position will be closed if the price touches the middle band and the entire position will be closed when the price touches the lower band. Alternatively, a fixed take profit can be placed. In case the price moves against us, trailing stops can be placed.
In case of selecting to use RSI, MACD, or MACD variation, trades will be executed as long as The Bollinger Bands, and all the above-mentioned indicators give the same signals, either buy or sell.
For example in the case of selecting only Use RSI, buy trades would be made as long as RSI and BB give buy signals.
Strategy inputs:
-BB source: Bollinger Bands price source.
-Bollinger Bands SMA length: Bollinger Bands simple moving average length.
-Bollinger Bands StdDev length: Bollinger Bands standard deviation length.
-Trail Long Loss (%): Distance in percentage at which the stop loss will initially be placed for buy trades.
-Trail Short Loss (%): Distance in percentage at which the stop loss will be initially placed for sell trades.
-Maximum orders: Maximum of simultaneous operations, for example, if it is 3, up to 3 parallel operations of buy and up to 3 parallel operations of sell will be carried out.
-Position size: Number of contracts per trade.
-Use RSI: If selected, the strategy will also trade based on oversold or overbought signals provided by the RSI.
-RSI source: RSI price source.
-RSI period: The RSI period to use.
-RSI value for buy: If the RSI is below this value, it will give a buy signal.
-RSI value for sell: If the RSI value is above this value, it will give a sell signal.
-Use MACD: If selected, buy trades will be made when the MACD crosses 0 upwards, and sell trades will be made when the MACD crosses 0 downwards.
-Use MACD variation: Only available if MACD is previously selected. In this case, buy trades are made if the MACD value in the last 3 candles has been decreasing, and sell trades are made if the MACD value has been increasing.
-MACD source: MACD price source.
-MACD fast length: MACD fast EMA lenght.
-MACD slow length: MACD slow EMA lenght.
-MACD signal length: MACD signal EMA lenght.
-Use maximum TP long: If selected, a fixed take profit will be placed for buy trades. The position could be closed before reaching this take profit if the price touches one of the lower or upper lines first.
-Maximum take profit long (%): Distance in percentage at which the take profit will be placed for buy trades.
-Use maximum TP short: if selected, a fixed take profit will be placed for sell trades. The position could be closed before reaching this take profit if the price touches one of the lower or upper lines first.
-Maximum take profit short (%): Distance in percentage at which the take profit will be set for sell trades.
I hope you like it and as always all feedback is welcome.
