Katz Impact Wave 🚀Overview of the Katz Impact Wave 🚀
The Katz Impact Wave is a momentum oscillator designed to visualize the battle between buyers and sellers. Instead of combining bullish and bearish pressure into a single line, it separates them into two distinct "Impact Waves."
Its primary goal is to generate clear trade signals by identifying when one side gains control, but only when the market has enough volatility to be considered "moving." This built-in filter helps to avoid signals during flat or choppy market conditions.
Indicator Components: Lines & Plots
Impact Waves & Fill
Green Wave (Total Up Impulses): This line represents the cumulative buying pressure. When this line is rising, it indicates that bulls are getting stronger.
Red Wave (Total Down Impulses): This line represents the cumulative selling pressure. When this line is rising, it indicates that bears are getting stronger.
Colored Fill: The shaded area between the two waves provides an at-a-glance view of who is in control.
Lime Fill: Bulls are dominant (Green Wave is above the Red Wave).
Red Fill: Bears are dominant (Red Wave is above the Green Wave).
Background Color
The background color provides crucial context about the market state according to the indicator's logic.
Green Background: The market is in a bullish state (Green Wave is dominant) AND the Rate of Change (ROC) filter confirms the market is actively moving.
Red Background: The market is in a bearish state (Red Wave is dominant) AND the ROC filter confirms the market is actively moving.
Gray Background: The market is considered "not moving" or is in a low-volatility chop. Signals that occur when the background is gray should be viewed with extreme caution or ignored.
Symbols & Pivot Lines
▲ Blue Triangle (Up): This is your long entry signal. It appears on the bar where the Green Wave crosses above the Red Wave while the market is moving.
▼ Orange Triangle (Down): This is your short entry signal. It appears on the bar where the Red Wave crosses above the Green Wave while the market is moving.
Pivot Lines (Solid Green/Red/White Lines): These lines mark confirmed peaks of exhaustion in momentum, not price.
Green Pivot Line: Marks a peak in the Green Wave, signaling buying momentum exhaustion. This can be a warning that the uptrend is losing steam.
Red Pivot Line: Marks a peak in the Red Wave, signaling selling momentum exhaustion. This can be a warning that the downtrend is losing steam.
▼ Yellow Triangle (Compression): This rare signal appears when buying and selling exhaustion pivots happen at the same level. It signifies a point of extreme indecision or equilibrium that often occurs before a major price expansion.
Trading Rules & Strategy
This indicator provides entry signals but does not provide explicit Take Profit or Stop Loss levels. You must use your own risk management rules.
Long Trade Rules
Entry Signal: Wait for a blue ▲ triangle to appear at the top of the indicator panel.
Confirmation: Ensure the background color is green, confirming the market is in a bullish, moving state.
Action: Enter a long (buy) trade at the open of the next candle after the signal appears.
Short Trade Rules
Entry Signal: Wait for an orange ▼ triangle to appear at the bottom of the indicator panel.
Confirmation: Ensure the background color is red, confirming the market is in a bearish, moving state.
Action: Enter a short (sell) trade at the open of the next candle after the signal appears.
Take Profit (TP) & Stop Loss (SL) Ideas
You must develop and test your own exit strategy. Here are some common approaches:
Stop Loss:
Place a stop loss below the most recent significant swing low on the price chart for a long trade, or above the recent swing high for a short trade.
Use an ATR (Average True Range) based stop, such as 2x the ATR value below your entry for a long, to account for market volatility.
Take Profit:
Opposite Signal: The simplest exit is to close your trade when the opposite signal appears (e.g., close a long trade when a short signal ▼ appears).
Momentum Exhaustion: For a long trade, consider taking partial or full profit when a green Pivot Line appears, signaling that buying momentum is peaking.
Fixed Risk/Reward: Use a predetermined risk/reward ratio (e.g., 1:1.5 or 1:2).
Disclaimer
This indicator is a tool for analysis, not a financial advisor or a guaranteed profit system. All trading and investment activities involve substantial risk. You should not risk more than you are prepared to lose. Past performance is not an indication of future results. You are solely responsible for your own trading decisions, risk management, and for backtesting this or any other tool before using it in a live trading environment. This indicator is for educational purposes only.
Cari dalam skrip untuk "tp"

Katz Exploding PowerBand FilterUnderstanding the Katz Exploding PowerBand Filter (EPBF) v2.4
1. Indicator Overview
The Katz Exploding PowerBand Filter (EPBF) is an advanced technical indicator designed to identify moments of expanding bullish or bearish momentum, often referred to as "power." It operates as a standalone oscillator in a separate pane below the main price chart.
Its primary goal is to measure underlying market strength by calculating custom "Bull" and "Bear" power components. These components are then filtered through a versatile moving average and a dual signal line system to generate clear entry and exit signals. This indicator is not a simple momentum oscillator; it uses a unique calculation based on exponential envelopes of both price and squared price to derive its values.
2. On-Chart Lines and Components
The indicator pane consists of five main lines:
Bullish Component (Thick Green/Blue/Yellow/Gray Line): This is the core of the indicator. It represents the calculated bullish "power" or momentum in the market.
Bright Green: Indicates a strong, active long signal condition.
Blue: Shows the bull component is above the MA filter, but the filter itself is still pointing down—a potential sign of a reversal or weakening downtrend.
Yellow: A warning sign that bullish power is weakening and has fallen below the primary signal lines.
Gray: Represents neutral or insignificant bullish power.
Bearish Component (Thick Red/Purple/Yellow/Gray Line): This line represents the calculated bearish "power" or downward momentum.
Bright Red: Indicates a strong, active short signal condition.
Purple: Shows the bear component is above the MA filter, but the filter itself is still pointing down—a sign of potential trend continuation.
Yellow: A warning sign that bearish power is weakening.
Gray: Represents neutral or insignificant bearish power.
MA Filter (Purple Line): This is the main filter, calculated using the moving average type and length you select in the settings (e.g., HullMA, EMA). The Bull and Bear components are compared against this line to determine the underlying trend bias.
Signal Line 1 (Orange Line): A fast Exponential Moving Average (EMA) of the stronger power component. It acts as the first level of dynamic support or resistance for the power lines.
Signal Line 2 (Lime/Gray Line): A slower EMA that acts as a confirmation filter.
Lime Green: The line turns lime when it is rising and the faster Signal Line 1 is above it, indicating a confirmed bullish trend in momentum.
Gray: Indicates a neutral or bearish momentum trend.
3. On-Chart Symbols and Their Meanings
Various characters are plotted at the bottom of the indicator pane to provide clear, actionable signals.
L (Pre-Long Signal): The first sign of a potential long entry. It appears when the Bullish Component rises and crosses above both signal lines for the first time.
S (Pre-Short Signal): The first sign of a potential short entry. It appears when the Bearish Component rises and crosses above both signal lines for the first time.
▲ (Post-Long Signal): A stronger confirmation for a long entry. It appears with the 'L' signal only if the momentum trend is also confirmed bullish (i.e., the slower Signal Line 2 is lime green).
▼ (Post-Short Signal): A stronger confirmation for a short entry. It appears with the 'S' signal only if the momentum trend is confirmed bullish.
Exit / Take-Profit Symbols:
These symbols appear when a power component crosses below a line, suggesting that momentum is fading and it may be time to take profit.
⚠️ (Exit Signal 1): The Bull/Bear component has crossed below the main MA Filter. This is the first and most sensitive take-profit signal.
☣️ (Exit Signal 2): The Bull/Bear component has crossed below the faster Signal Line 1. This is a moderate take-profit signal.
🚼 (Exit Signal 3): The Bull/Bear component has crossed below the slower Signal Line 2. This is the slowest take-profit signal, suggesting the trend is more definitively exhausted.
4. Trading Strategy and Rules
Long Entry Rules:
Initial Signal: Wait for an L to appear at the bottom of the indicator. This confirms that bullish power is expanding.
Confirmation (Recommended): For a higher-probability trade, wait for a green ▲ symbol to appear. This confirms the underlying momentum trend aligns with the signal.
Entry: Enter a long (buy) position on the opening of the next candle after the signal appears.
Short Entry Rules:
Initial Signal: Wait for an S to appear at the bottom of the indicator. This confirms that bearish power is expanding.
Confirmation (Recommended): For a higher-probability trade, wait for a maroon ▼ symbol to appear. This confirms the underlying momentum trend aligns with the signal.
Entry: Enter a short (sell) position on the opening of the next candle after the signal appears.
Take Profit (TP) Rules:
The indicator provides three levels of take-profit signals. You can choose to exit your entire position or scale out at each level.
For a long trade, exit when you see ⚠️, ☣️, or 🚼 appear below the Bullish Component.
For a short trade, exit when you see ⚠️, ☣️, or 🚼 appear below the Bearish Component.
Stop Loss (SL) Rules:
The indicator does not provide an explicit stop loss. You must use your own risk management rules. Common methods include:
Swing High/Low: For a long position, place your stop loss below the most recent significant swing low on the price chart. For a short position, place it above the most recent swing high.
ATR-Based: Use an Average True Range (ATR) indicator to set a volatility-based stop loss.
Fixed Percentage: Risk a fixed percentage (e.g., 1-2%) of your account on the trade.
5. Disclaimer
This indicator is a tool for technical analysis and should not be considered financial advice. All trading involves significant risk, and past performance is not indicative of future results. The signals generated by this indicator are probabilistic and can result in losing trades. Always use proper risk management, such as setting a stop loss, and never risk more than you are willing to lose. It is recommended to backtest this indicator and use it in conjunction with other forms of analysis before trading with real capital. The indicator should only be used for educational purposes.

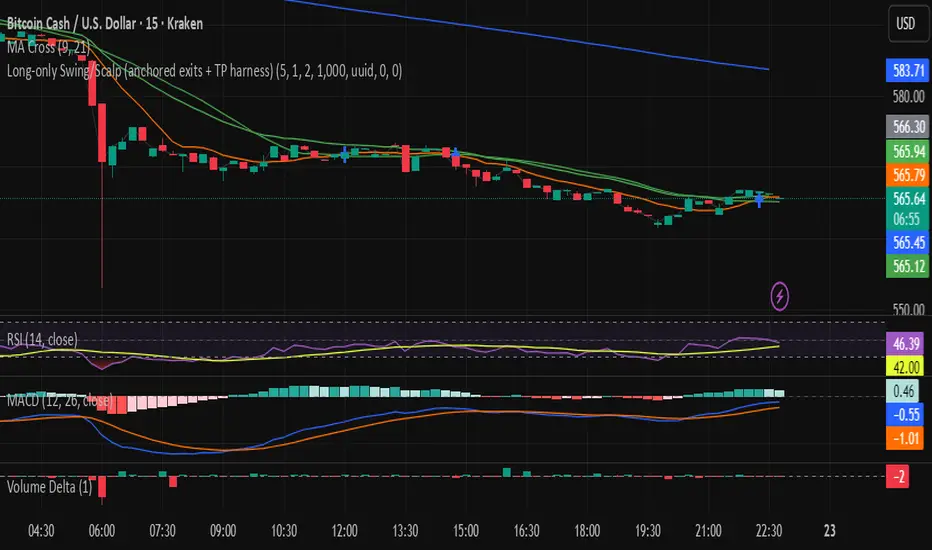
Long-only Swing/Scalp (anchored exits + TP harness) Traders PostThis is the Traders Post friendly drag and drop version of the swing/ scalp strategy for the algo traders out there. Let me know your thoughts, constructive criticism is always welcome.
Katz Calypso Indicator (Refactored)Overview
The Katz Calypso Indicator is a comprehensive momentum oscillator designed to identify potential entry and exit points in the market. At its core, it uses the True Strength Index (TSI) to gauge the strength and direction of a trend. To enhance signal accuracy and reduce false positives, the indicator integrates several optional filters, including the Waddah Attar Explosion, an EMA filter, and an ATR filter. It also provides an optional RVGI-based exit signal system.
This tool is designed to provide a clear, visual representation of market momentum, with customizable filters to adapt to various trading styles and market conditions.
How to Use the Indicator
The indicator is displayed in a separate pane below the main price chart.
TSI Line (Blue): This is the main oscillator line. Its position relative to the zero line indicates the overall trend bias (above 0 is bullish, below is bearish).
Signal Line (Red): A moving average of the TSI line. Crossovers between the TSI and Signal Line are the primary triggers for trade signals.
Zero Line: The centerline of the oscillator. A cross of the Zero Line can indicate a significant shift in momentum.
Overbought/Oversold Levels: These user-defined levels (defaulting to 65 and -65) help identify potential exhaustion points in a trend, which can be used for taking profits.
On-Chart Signals: The indicator plots shapes directly on the chart to make signals easy to spot:
Green Triangles (Up): Indicate long entry or continuation signals.
Red Triangles (Down): Indicate short entry or continuation signals.
Yellow Triangles: Suggest taking profits.
Maroon/Lime Triangles: Indicate an exit based on a signal cross (like RVGI or the Zero Line).
Trading Rules
Long Trade Rules
Entry: A long trade is signaled when ALL of the following conditions are met:
The blue TSI Line crosses above the red Signal Line.
The blue TSI Line is above the 0 Zero Line.
All enabled filters (Waddah Attar, EMA, ATR) confirm bullish conditions.
A green triangle labeled "Long" will appear below the price.
Exit (Take Profit): A take-profit signal for a long trade is generated when either of these occurs:
The TSI Line crosses below the Overbought level.
The TSI Line crosses back below the Signal Line while still above zero.
A yellow triangle labeled "TPL" (Take Profit Long) will appear above the price.
Exit (Stop/Reverse): A signal to exit a long trade is generated when either of these occurs:
The TSI Line crosses below the 0 Zero Line.
The RVGI Exit filter is enabled and generates a bearish crossover signal.
A maroon triangle labeled "Exit Long" will appear above the price.
Short Trade Rules
Entry: A short trade is signaled when ALL of the following conditions are met:
The blue TSI Line crosses below the red Signal Line.
The blue TSI Line is below the 0 Zero Line.
All enabled filters (Waddah Attar, EMA, ATR) confirm bearish conditions.
A red triangle labeled "Short" will appear above the price.
Exit (Take Profit): A take-profit signal for a short trade is generated when either of these occurs:
The TSI Line crosses above the Oversold level.
The TSI Line crosses back above the Signal Line while still below zero.
A yellow triangle labeled "TPS" (Take Profit Short) will appear below the price.
Exit (Stop/Reverse): A signal to exit a short trade is generated when either of these occurs:
The TSI Line crosses above the 0 Zero Line.
The RVGI Exit filter is enabled and generates a bullish crossover signal.
A lime green triangle labeled "Exit Short" will appear below the price.
Optional Filters
You can enable or disable these filters in the indicator's settings to fine-tune its sensitivity.
Waddah Attar Explosion Filter: This filter measures trend strength and volatility. When enabled, it ensures that entries are only taken during periods of strong, confirmed momentum, helping to avoid sideways or choppy markets.
EMA Price Filter: A classic trend filter. When enabled, it will only allow long entries if the price is above the specified Exponential Moving Average and short entries only if the price is below it.
ATR Filter: This acts as a volatility-based filter to prevent chasing a move. It helps ensure that you are not entering a long trade when the price has already moved too far above its EMA, or vice-versa for a short trade.
RVGI Exit Filter: The Relative Vigor Index (RVGI) is used here exclusively as an exit signal. When enabled, a crossover of the RVGI and its signal line can provide an earlier exit signal before the TSI crosses the zero line, potentially locking in profits sooner.
Disclaimer: This indicator is provided for educational and informational purposes only. It is not financial advice. Trading carries a high level of risk, and you can lose more than your initial investment. You should use this indicator at your own risk and discretion. Always conduct your own research and consider your risk tolerance before making any trading decisions.

维加斯双通道策略Vegas Channel Comprehensive Strategy Description
Strategy Overview
A comprehensive trading strategy based on the Vegas Dual Channel indicator, supporting dynamic position sizing and fund management. The strategy employs a multi-signal fusion mechanism including classic price crossover signals, breakout signals, and retest signals, combined with trend filtering, RSI+MACD filtering, and volume filtering to ensure signal reliability.
Core Features
Dynamic Position Sizing: Continue adding positions on same-direction signals, close all positions on opposite signals
Smart Take Profit/Stop Loss: ATR-based dynamic TP/SL, updated with each new signal
Fund Management: Supports dynamic total amount management for compound growth
Time Filtering: Configurable trading time ranges
Risk Control: Maximum order limit to prevent over-leveraging
Leverage Usage Instructions
Important: This strategy does not use TradingView's margin functionality
Setup Method
Total Amount = Actual Funds × Leverage Multiplier
Example: Have 100U actual funds, want to use 10x leverage → Set total amount to 100 × 10 = 1000U
Trading Amount Calculation
Each trade percentage is calculated based on leveraged amount
Example: Set 10% → Actually trade 100U margin × 10x leverage = 1000U trading amount
Maximum Orders Configuration
Must be used in conjunction with leveraged amount
Example: 1000U total amount, 10% per trade, maximum 10 orders = maximum use of 1000U
Note: Do not exceed 100% of total amount to avoid over-leveraging
Parameter Configuration Recommendations
Leverage Configuration Examples
Actual funds 100U, 5x leverage, total amount setting 500U, 10% per trade, 50U per trade, recommended maximum orders 10
Actual funds 100U, 10x leverage, total amount setting 1000U, 10% per trade, 100U per trade, recommended maximum orders 10
Actual funds 100U, 20x leverage, total amount setting 2000U, 5% per trade, 100U per trade, recommended maximum orders 20
Risk Control
Conservative: 5-10x leverage, 10% per trade, maximum 5-8 orders
Aggressive: 10-20x leverage, 5-10% per trade, maximum 10-15 orders
Extreme: 20x+ leverage, 2-5% per trade, maximum 20+ orders
Strategy Advantages
Signal Reliability: Multiple filtering mechanisms reduce false signals
Capital Efficiency: Dynamic fund management for compound growth
Risk Controllable: Maximum order limits prevent liquidation
Flexible Configuration: Supports various leverage and fund allocation schemes
Time Control: Configurable trading hours to avoid high-risk periods
Usage Notes
Ensure total amount is set correctly (actual funds × leverage multiplier)
Maximum orders should not exceed the range allowed by total funds
Recommend starting with conservative configuration and gradually adjusting parameters
Regularly monitor strategy performance and adjust parameters timely
维加斯通道综合策略说明
策略概述
基于维加斯双通道指标的综合交易策略,支持动态加仓和资金管理。策略采用多信号融合机制,包括经典价穿信号、突破信号和回踩信号,结合趋势过滤、RSI+MACD过滤和成交量过滤,确保信号的可靠性。
核心功能
动态加仓:同向信号继续加仓,反向信号全部平仓
智能止盈止损:基于ATR的动态止盈止损,每次新信号更新
资金管理:支持动态总金额管理,实现复利增长
时间过滤:可设置交易时间范围
风险控制:最大订单数限制,防止过度加仓
杠杆使用说明
重要:本策略不使用TradingView的保证金功能
设置方法
总资金 = 实际资金 × 杠杆倍数
示例:实际有100U,想使用10倍杠杆 → 总资金设置为 100 × 10 = 1000U
交易金额计算
每笔交易百分比基于杠杆后的金额计算
示例:设置10% → 实际交易 100U保证金 × 10倍杠杆 = 1000U交易金额
最大订单数配置
必须配合杠杆后的金额使用
示例:1000U总资金,10%单笔,最大10单 = 最多使用1000U
注意:不要超过总资金的100%,避免过度杠杆
参数配置建议
杠杆配置示例
实际资金100U,5倍杠杆,总资金设置500U,单笔百分比10%,单笔金额50U,建议最大订单数10单
实际资金100U,10倍杠杆,总资金设置1000U,单笔百分比10%,单笔金额100U,建议最大订单数10单
实际资金100U,20倍杠杆,总资金设置2000U,单笔百分比5%,单笔金额100U,建议最大订单数20单
风险控制
保守型:5-10倍杠杆,10%单笔,最大5-8单
激进型:10-20倍杠杆,5-10%单笔,最大10-15单
极限型:20倍以上杠杆,2-5%单笔,最大20单以上
策略优势
信号可靠性:多重过滤机制,减少假信号
资金效率:动态资金管理,实现复利增长
风险可控:最大订单数限制,防止爆仓
灵活配置:支持多种杠杆和资金配置方案
时间控制:可设置交易时间,避开高风险时段
使用注意事项
确保总资金设置正确(实际资金×杠杆倍数)
最大订单数不要超过总资金允许的范围
建议从保守配置开始,逐步调整参数
定期监控策略表现,及时调整参数


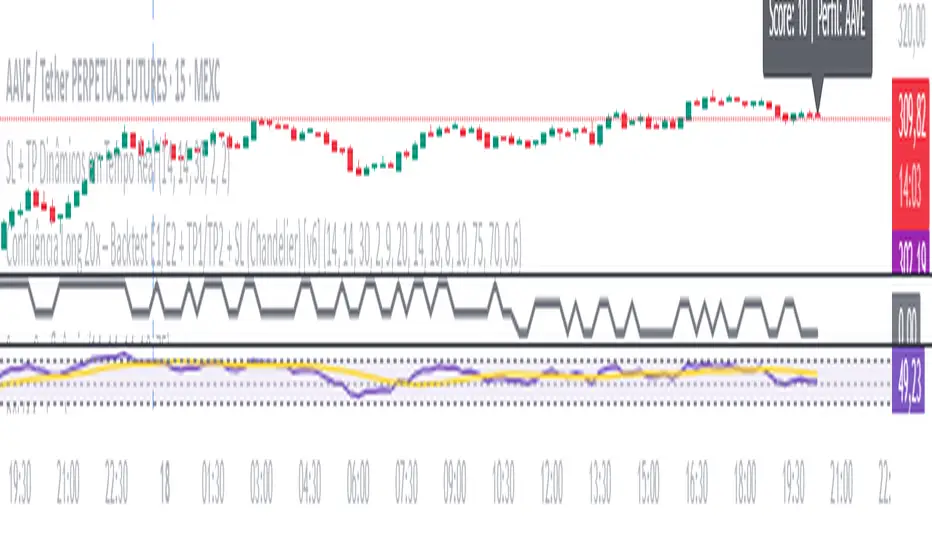
SL + TP Dynamics - By M.LolasStop Loss e Take Profit dinâmicos para operações semiautomatizadas.
By M.Lolas
Expected Value Monte CarloI created this indicator after noticing that there was no Expected Value indicator here on TradingView.
The EVMC provides statistical Expected Value to what might happen in the future regarding the asset you are analyzing.
It uses 2 quantitative methods:
Historical Backtest to ground your analysis in long-term, factual data.
Monte Carlo Simulation to project a cone of probable future outcomes based on recent market behavior.
This gives you a data-driven edge to quantify risk, and make more informed trading decisions.
The indicator includes:
Dual analysis: Combines historical probability with forward-looking simulation.
Quantified projections: Provides the Expected Value ($ and %), Win Rate, and Sharpe Ratio for both methods.
Asset-aware: Automatically adjusts its calculations for Stocks (252 trading days) and Crypto (365 days) for mathematical accuracy.
The projection cone shows the mean expected path and the +/- 1 standard deviation range of outcomes.
No repainting
Calculation:
1. Historical Expected Value:
This is a systematic backtest over thousands of bars. It calculates the return Rᵢ for N past trades (buy-and-hold). The Historical EV is the simple average of these returns, giving a baseline performance measure.
Historical EV % = (Σ Rᵢ) / N
2. Monte Carlo Projection:
This projection uses the Geometric Brownian Motion (GBM) model to simulate thousands of future price paths based on the market's recent behavior.
It first measures the drift (μ), or recent trend, and volatility (σ), or recent risk, from the Projection Lookback period. It then projects a final return for each simulation using the core GBM formula:
Projected Return = exp( (μ - σ²/2)T + σ√T * Z ) - 1
(Where T is the time horizon and Z is a random variable for the simulation.)
The purple line on the chart is the average of all simulated outcomes (the Monte Carlo EV). The cone represents one standard deviation of those outcomes.
The dashed lines represent one standard deviation (+/- 1σ) from the average, forming a cone of probable outcomes. Roughly 68% of the simulated paths ended within this cone.
This projection answers the question: "If the recent trend and volatility continue, where is the price most likely to go?"
Here's how to read the indicator
Expected Value ($/%): Is my average trade profitable?
Win Rate: How often can I expect to be right?
Sharpe Ratio: Am I being adequately compensated for the risk I'm taking?
User Guide
Max trade duration (bars): This is your analysis timeframe. Are you interested in the probable outcome over the next month (21 bars), quarter (63 bars), or year (252 bars)?
Position size ($): Set this to your typical trade size to see the Expected Value in real dollar terms.
Projection lookback (bars): This is the most important input for the Monte Carlo model. A short lookback (e.g., 50) makes the projection highly sensitive to recent momentum. Use this to identify potential recency bias. A long lookback (e.g., 252) provides a more stable, long-term projection of trend and volatility.
Historical Lookback (bars): For the historical backtest, more data is always better. Use the maximum that your TradingView plan allows for the most statistically significant results.
Use TP/SL for Historical EV: Check this box to see how the historical performance would have changed if you had used a simple Take Profit and Stop Loss, rather than just holding for the full duration.
I hope you find this indicator useful and please let me know if you have any suggestions. 😊

Trendline Breakout Strategy [KedArc Quant] Description
A single, rule-based system that builds two trendlines from confirmed swing pivots and trades their breakouts, with optional retest, trend-regime gates (EMA / HTF EMA), and ATR-based risk. All parts serve one decision flow: structure → breakout → gated entry → managed risk.
What it does (for traders)
Draws Up line (teal) through the last two Higher Lows and Down line (red) through the last two Lower Highs, then extends them forward.
Long when price breaks above red; Short when price breaks below teal.
Optional Retest entry: after a break, wait for a pullback toward the broken line within an ATR-scaled buffer.
Uses ATR stop and R-multiple target so risk is consistent across symbols/timeframes.
Labels HL1/HL2/LH1/LH2 so non-coders can verify which pivots built each line.
Why these components are combined
Pure breakout systems on trendlines suffer from three practical issues:
False breaks in chop → solved by trend-regime gates (EMA / HTF EMA) that only allow trades aligned with the prevailing trend.
Uneven volatility across markets/timeframes → solved by ATR-based stop/target, normalizing distance so R-multiples are comparable.
First break whipsaws near wedge apices → mitigated by the optional retest rule that demands a pullback/hold before entry.
These modules are not separate indicators with their own signals. They are support roles inside one method.
The pivot engine defines structure, the breakout detector defines signal, the regime gates decide if we’re allowed to take that signal, and the ATR module sizes risk.
Together they make the trendline breakout usable, testable, and explainable.
How it works (mechanism; each component explained)
1) Pivot engine (structure, non-repainting)
Swings are confirmed with ta.pivotlow/high(L, R). A pivot only exists after R bars (no look-ahead), so once plotted, the line built from those pivots will not repaint.
2) Trendline builder (geometry)
Teal line updates when two consecutive pivot lows satisfy HL2.price > HL1.price (and HL2 occurs after HL1).
Red line updates when two consecutive pivot highs satisfy LH2.price < LH1.price.
Lines are extended right and their current value is read every bar via line.get_price().
3) Breakout detector (signal)
On every bar, compute:
crossover(close, redLine) ⇒ Long breakout
crossunder(close, tealLine) ⇒ Short breakdown
4) Regime gates (trend filters, not separate signals)
EMA gate: allow longs only if close > EMA(len), shorts only if close < EMA(len).
HTF EMA gate (optional): same rule on a higher timeframe to avoid fighting the larger trend.
These do not create entries; they simply permit or block the breakout signal.
5) Retest module (optional confirmation)
After a breakout, record the line price. A valid retest occurs if price pulls back within an ATR-scaled buffer toward that broken line and then closes back in the breakout direction.
This reduces first-tick fakeouts.
6) Risk module (position exit)
Initial stop = ATR(len) × atrMult from entry.
Target = tpR × (ATR × atrMult) (e.g., 2R).
This keeps results consistent across instruments/timeframes.
Entries & exits
Long entry
Base: close breaks above red and passes EMA/HTF gates.
Retest (if enabled): after the break, price pulls back near the broken red line (within the ATR buffer) and holds; then enter.
Short entry
Mirror logic with teal (break below & gates), optionally with a retest.
Exit
strategy.exit places ATR stop & R-multiple target automatically.
Optional “flip”: close if the opposite base signal triggers.
How to use it (step-by-step)
Timeframe: 1–15m for intraday, 1–4h for swing.
Start defaults: Pivot L/R = 5, EMA len = 200, ATR len = 14, ATR mult = 2, TP = 2R, Retest = ON.
Tune sensitivity:
Faster lines (more trades): set L/R = 3–4.
Fewer counter-trend trades: enable HTF EMA (e.g., 60-min or Daily).
Visual audit: labels HL1/HL2 & LH1/LH2 show which pivots built each line—verify by eye.
Alerts: use Long breakout, Short breakdown, and Retest alerts to automate.
Originality (why it merits publication)
Trades the visualization: many “auto-trendline” tools only draw lines; this one turns them into testable, alertable rules.
Integrated design: each component has a defined role in the same pipeline—no unrelated indicators bolted together.
Transparent & non-repainting: pivot confirmation removes look-ahead; labels let non-coders understand the setup that produced each signal.
Notes & limitations
Lines update only after pivot confirmation; that lag is intentional to avoid repainting.
Breakouts near an apex can whipsaw; prefer Retest and/or HTF gate in choppy regimes.
Backtests are idealized; forward-test and size risk appropriately.
⚠️ Disclaimer
This script is provided for educational purposes only.
Past performance does not guarantee future results.
Trading involves risk, and users should exercise caution and use proper risk management when applying this strategy.

CCI Stochastic - YOSI
CCI Stochastic (Pro v6) – MTF, Adaptive Bands & Live Label
What it does
This indicator applies a Stochastic calculation on the CCI (K/D lines) to highlight momentum shifts, overbought/oversold zones, and adaptive market regimes. It comes with optional higher-timeframe confirmation, adaptive volatility bands, a live value label, and built-in alerts.
Key Features
Core Signal: Choose between D or K line of the Stoch-CCI.
Extreme Zones: Customizable OB/OS thresholds (default 80/20) and a midline (50), with dynamic background shading.
Adaptive Bands (optional): Mean ± k·standard deviation of the signal, to capture cyclic extremes.
MTF Confirmation (optional): Fetches the same signal from a higher timeframe via request.security.
Arrows/Signals:
Enter – Cross above OS (Buy) / below OB (Sell).
Center – Cross of the 50 midline (momentum shift).
Exit – Exit from extreme zones.
Alerts: All arrow signals + adaptive band crosses.
Live Value Label: Shows the latest signal value near the last bar, customizable decimals/offset/background colors.
Visuals: Red line above OB, green below OS, gray neutral; adaptive band fills.
Use Cases
Momentum / Reversals: Enter with OS/OB crosses confirmed by MTF.
Trend validation: Combine with moving averages (e.g., EMA200) or support/resistance.
Mean Reversion: Fade extreme zones, especially with adaptive band or OB/OS exit alerts.
Inputs
CCI Period, Stoch Period, Smooth K/D – core calculation.
Overbought / Oversold – thresholds (default 80/20).
Line to plot – K or D.
Show Arrows (Enter, Center, Exit) – visual control.
Adaptive Bands – length and k multiplier.
Higher TF – optional confirmation timeframe.
Live Label – decimals, offset, colors.
Quick Tips
For scalping/short-term setups: tighten OB/OS (e.g., 85/15) to filter noise.
In high volatility: increase adaptLen or decrease k to smooth bands.
Reduce false signals: require local + MTF alignment (e.g., only long if MTF > 50).
Disclaimer
This is a technical analysis tool – not a standalone buy/sell signal. Always use with proper risk management, key levels, and confluence from multiple factors.
מה זה עושה?
האינדיקטור מחשב Stochastic על CCI (קו K/D) ומציג אזורי קיצון, חציות ומשטרי שוק. הוא כולל אופציה לאישור מטיימפריים גבוה, בנדים אדפטיביים, תווית ערך חיה והתרעות מוכנות.
יכולות עיקריות
סיגנל מרכזי: בחירה בין קו D או K של Stoch-CCI.
אזורי קיצון: קווים ניתנים להגדרה (ברירת מחדל 80/20) וקו אמצע 50, עם צביעת רקע דינמית כשנכנסים לקיצון.
Adaptive Bands (אופציונלי): ממוצע ± k·סטיית תקן של הסיגנל—מסייע לזהות overheat ומחזוריות.
אישור MTF (אופציונלי): אותו סיגנל מטיימפריים גבוה באמצעות request.security.
חיצים/סיגנלים:
Enter – חציה מלמטה מעל OS (קנייה) / מלמעלה מתחת OB (מכירה).
Center – חציה של 50 (שינוי מומנטום).
Exit – יציאה מאזורים קיצוניים (OS/OB).
Alerts: לכל הסיגנלים לעיל + כניסה/יציאה לבנדים האדפטיביים.
תווית ערך חיה: מציגה את ערך הסיגנל האחרון ליד הנקודה (ספרות ו־offset ניתנים להגדרה).
עיצוב קריא: צבע קו אדום מעל OB, ירוק מתחת OS, אפור ניטרלי; מילוי אזורים.
שימוש מומלץ
מומנטום/היפוכים: כניסה עם חציה מה-OS/OB ואישור מה-MTF.
ממוצע נע/רמות מחיר: חברו לאימות מגמה (למשל EMA200 או תמיכה/התנגדות).
Mean Reversion: חיפוש חזרה מאזורי קיצון, במיוחד כשיש התרעת יציאה מ-OB/OS או נגיעה בבנד אדפטיבי.
קלטים מרכזיים
CCI Period, Stoch Period, Smooth K/D – פרמטרי חישוב.
Overbought / Oversold – ספי קיצון (ברירת מחדל 80/20).
Line to plot – בחירה בין K או D.
Show Arrows/Center/Exit/Enter – שליטה בתצוגת החיצים.
Adaptive Bands (len, k) – חלון ורגישות לבנדים.
Higher TF – טיימפריים לאישור (אופציונלי).
Live Label – ספרות, היסט ברים, צבעי רקע.
טיפים מהירים
בסקלפים/טווחים קצרים: הקשיחו ספי קיצון (למשל 85/15) להפחתת רעש.
בשוק תנודתי: העלו את adaptLen או הורידו את k כדי לקבל בנדים רגישים פחות.
להקטנת אותות שווא: דרשו התאמה בין הסיגנל המקומי ל-MTF (לדוגמה, לונג רק כשה-MTF מעל 50).
הערה חשובה
זהו כלי ניתוח טכני—לא אות קנייה/מכירה בפני עצמו. שלבו אותו עם ניהול סיכונים (SL/TP), בדיקת רמות מפתח ואימות ממספר אינדיקטורים או טיימפריימים.

RedFlagCounter-trend strategy
Condition to open a long position:
Buys if the price drops by a specified percentage from the previous candle’s close. Only one purchase can be made within a single candle.
Condition to close a position:
Places a separate individual closing limit order for each purchase, or uses one common take-profit order for the whole position.
⚠️ Attention : Stop-loss is not implemented in the current first version of the strategy.
Options description:
Drop_percent , % — Percentage drop in price from the From point
From — The reference point on the closed candle from which the Drop_percent is calculated (Open, Close, High, Low)
Tp , % — Take-profit level as a percentage
Count — Number of allowed additional purchases (scaling in)
Each_tp — Mode switch:
True — a separate take-profit is placed for each purchase
False — one common take-profit is placed based on the average entry price of the position
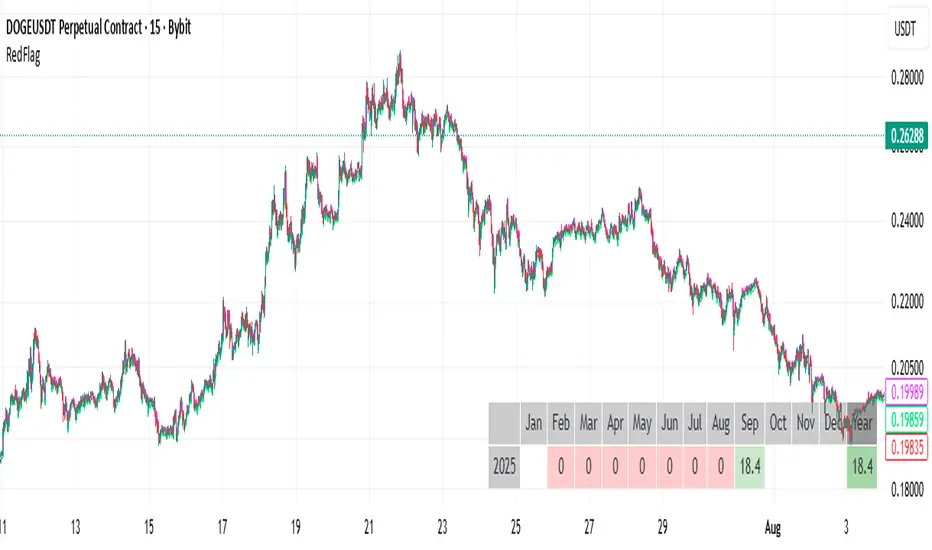
Table Logic ExtractorTable Logic Extractor v2.0
Advanced multi-timeframe analysis with intelligent trade recommendations!
Overview:
This sophisticated indicator provides comprehensive market analysis through multiple technical indicators and timeframes. It combines EMA analysis, RSI momentum, MACD signals, Bollinger Bands, volume analysis, divergence detection, and intelligent trade recommendations with support/resistance distance calculations and trading style detection.
Key Features:
✅ Multi-Indicator Analysis - EMA, RSI, MACD, Bollinger Bands, Volume, ATR
✅ Multi-Timeframe Analysis - M1, M5, M15, M30 trend comparison
✅ Divergence Detection - Bullish and bearish divergence with strength calculation
✅ Support/Resistance Analysis - Distance calculations with Fibonacci levels
✅ Trading Style Detection - Trend, Range, Breakout, Scalping identification
✅ Intelligent Trade Signals - Style-based trade recommendations with confidence levels
✅ Risk Management - Stop Loss and Take Profit calculations
✅ Comprehensive Table - Real-time analysis with 14 different metrics
How It Works:
The indicator uses advanced analysis:
• Multi-Timeframe - M1, M5, M15, M30 trend analysis
• Style Detection - Automatic trading style identification
• S/R Analysis - Fibonacci-based support/resistance levels
• Weighted Scoring - EMA (2.0), RSI (1.5), MACD (1.5), BB (1.0), Volume (1.0)
• Intelligent Signals - Style-based trade recommendations
Trading Style Detection:
• TREND TRADING - Strong trend + aligned timeframes (Green)
• RANGE TRADING - Low volatility + sideways movement (Yellow)
• BREAKOUT TRADING - High volume + near levels (Orange)
• SCALPING - High volatility + quick moves (Red)
Information Table (14 Metrics):
Real-time display showing:
• ATR volatility with signal (HIGH/MED/LOW/NORMAL VOL)
• Divergence status with strength percentage
• S/R Distance with Fibonacci levels
• Stop Loss (2.0:1 ratio) and Take Profit 1 (1.5:1 ratio)
• Multi-Timeframe analysis (M1, M5, M15, M30)
• Scalping signals with confidence levels
• Current trend with strength percentage
• Intelligent trade recommendations
Trade Recommendations:
• TREND BUY/SELL - All timeframes aligned (High confidence)
• SHORT-TERM BUY/SELL - M5 signal only (Medium confidence)
• SCALPING BUY/SELL - M5 vs higher timeframes (Low confidence)
• WAIT - No clear signal (No confidence)
Support/Resistance Analysis:
• Fibonacci Levels: 23.6%, 38.2%, 50% retracements
• Distance Categories: Very Near (Red), Near (Orange), Medium (Yellow), Far (Green)
• ATR-based distance measurement
• Real-time proximity alerts
Scalping Detection:
Specialized signals based on:
• High volatility (ATR ratio > 1.5)
• Quick price moves (fast momentum)
• Volume confirmation (high volume spikes)
• RSI extremes (oversold/overbought)
Settings:
• EMA - Fast (9), Slow (21), Trend (50)
• RSI - Length (14), Overbought (70), Oversold (30)
• MACD - Fast (12), Slow (26), Signal (9)
• Bollinger Bands - Length (20), Multiplier (2.0)
• ATR - Length (14) for volatility measurement
• Volume Threshold - 1.5x average volume
• Divergence - Lookback (3), Threshold (0.5)
Best Practices:
🎯 Adapt strategy to detected trading style
📊 Use multi-timeframe analysis for confirmation
⚡ Monitor S/R distances for entry timing
🛡️ Always use calculated Stop Loss levels
🔍 Watch for divergence signals
📈 Follow intelligent trade recommendations
Pro Tips:
• Table provides all essential information in one place
• Trading style detection helps adapt your strategy
• S/R distance shows proximity to key levels
• Confidence levels indicate signal reliability
• Multi-timeframe alignment increases success rate
• Scalping signals work best in high volatility
Alerts:
• Trend Change Alert - "Trend changed across timeframes"
• Divergence Alert - "Divergence detected"
• Scalping Alert - "Scalping opportunity"
• Trade Signal Alert - "Trade recommendation available"
Version 2.0 Improvements:
• Advanced multi-timeframe analysis (M1, M5, M15, M30)
• Intelligent trading style detection
• Comprehensive support/resistance analysis
• Professional trade recommendations with confidence levels
• Scalping detection with specialized signals
• Risk management with calculated SL/TP levels
• 14-metric comprehensive information table
Created with ❤️ for the trading community
This indicator is free to use for both commercial and non-commercial purposes.

RSI Momentum Trend MM with Risk Per Trade [MTF]This is a comprehensive and highly customizable trend-following strategy based on RSI momentum. The core logic identifies strong directional moves when the RSI crosses user-defined thresholds, combined with an EMA trend confirmation. It is designed for traders who want granular control over their strategy's parameters, from signal generation to risk management and exit logic.
This script evolves a simple concept into a powerful backtesting tool, allowing you to test various money management and trade management theories across different timeframes.
Key Features
- RSI Momentum Signals: Uses RSI crosses above a "Positive" level or below a "Negative" level to generate trend signals. An EMA filter ensures entries align with the immediate trend.
- Multi-Timeframe (MTF) Analysis: The core RSI and EMA signals can be calculated on a higher timeframe (e.g., using 4H signals to trade on a 1H chart) to align trades with the larger trend. This feature helps to reduce noise and improve signal quality.
Advanced Money Management
- Risk per Trade %: Calculate position size based on a fixed percentage of equity you want to risk per trade.
- Full Equity: A more aggressive option to open each position with 100% of the available strategy equity.
Flexible Exit Logic: Choose from three distinct exit strategies to match your trading style
- Percentage (%) Based: Set a fixed Stop Loss and Take Profit as a percentage of the entry price.
- ATR Multiplier: Base your Stop Loss and Take Profit on the Average True Range (ATR), making your exits adaptive to market volatility.
- Trend Reversal: A true trend-following mode. A long position is held until an opposite "Negative" signal appears, and a short position is held until a "Positive" signal appears. This allows you to "let your winners run."
Backtest Date Range Filter: Easily configure a start and end date to backtest the strategy's performance during specific market periods (e.g., bull markets, bear markets, or high-volatility periods).
How to Use
RSI Settings
- Higher Timeframe: Set the timeframe for signal calculation. This must be higher than your chart's timeframe.
- RSI Length, Positive above, Negative below: Configure the core parameters for the RSI signals.
Money Management
Position Sizing Mode
- Choose "Risk per Trade" to use the Risk per Trade (%) input for precise risk control.
- Choose "Full Equity" to use 100% of your capital for each trade.
- Risk per Trade (%): Define the percentage of your equity to risk on a single trade (only works with the corresponding sizing mode).
SL/TP Calculation Mode
Select your preferred exit method from the dropdown. The strategy will automatically use the relevant inputs (e.g., % values, ATR Multiplier values, or the trend reversal logic).
Backtest Period Settings
Use the Start Date and End Date inputs to isolate a specific period for your backtest analysis.
License & Disclaimer
© waranyu.trkm — MIT License.
This script is for educational purposes only and should not be considered financial advice. Trading involves significant risk, and past performance is not indicative of future results. Always conduct your own research and risk assessment before making any trading decisions.

Gann Fan Strategy [KedarArc Quant]Description
A single-concept, rule-based strategy that trades around a programmatic Gann Fan.
It anchors to a swing (or a manual point), builds 1×1 and related fan lines numerically, and triggers entries when price interacts with the 1×1 (breakout or bounce). Management is done entirely with the fan structure (next/previous line) plus optional ATR trailing.
What TV indicators are used
* Pivots: `ta.pivothigh/ta.pivotlow` to confirm swing highs/lows for anchor selection.
* ATR: `ta.atr` only to scale the 1×1 slope (optional) and for an optional trailing stop.
* EMA: `ta.ema` as a trend filter (e.g., only long above the EMA, short below).
No RSI/MACD/Stoch/Heikin/etc. The logic is one coherent framework: Gann price–time geometry, with ATR as a scale and EMA as a risk filter.
How it works
1. Anchor
* Auto: chooses the most recent *confirmed* pivot (you control Left/Right).
* Manual: set a price and bar index and the fan will hold that point (no re-anchoring).
* Optional Re-anchor when a newer pivot confirms.
2. 1×1 Slope (numeric, not cosmetic)
* ATR mode: `1×1 = ATR(Length) × Multiplier` (adapts to volatility).
* Fixed mode: `ticks per bar` (constant slope).
Because slope is numeric, it doesn’t change with chart zoom, unlike the drawing tool.
3. Fan Lines
Builds classic ratios around the 1×1: 1/8, 1/4, 1/3, 1/2, 1/1, 2/1, 3/1, 4/1, 8/1.
4. Signals
* Breakout: cross of price over/under the 1×1 in the EMA-aligned direction.
* Bounce (optional): touch + reversal across the 1×1 to reduce whipsaw.
5. Exits & Risk
* Take-profit at the next fan line; Stop at the previous fan line.
* If a level is missing (right after re-anchor), a fallback Risk-Reward (RR) is used.
* Optional ATR trailing stop.
Why this is unique
* True numeric fan: The 1×1 slope is calculated from ATR or fixed ticks—not from screen geometry—so it is scale-invariant and reproducible across users/timeframes.
* Deterministic anchor logic: Uses confirmed pivots (with your L/R settings). No look-ahead; anchors update only when the right bars complete.
* Fan-native trade management: Both entries and exits come from the fan structure itself (with a minimal ATR/EMA assist), keeping the method pure.
* Two entry archetypes: Breakout for momentum days; Bounce for range days—switchable without changing the core model.
* Manual mode: Lock a session’s bias by anchoring to a chosen swing (e.g., day’s first major low/high) and keep the fan constant all day.
Inputs (quick guide)
* Auto Anchor (Left/Right): pivot sensitivity. Higher values = fewer, stronger anchors.
* Re-anchor: refresh to newer pivots as they confirm.
* Manual Anchor Price / Bar Index: fixes the fan (turn Auto off).
* Scale 1×1 by ATR: on = adaptive; off = use ticks per bar.
* ATR Length / ATR Multiplier: controls adaptive slope; start around 14 / 0.25–0.35.
* Ticks per bar: exact fixed slope (match a hand-drawn fan by computing slope ÷ mintick).
* EMA Trend Filter: e.g., 50–100; trades only in EMA direction.
* Use Bounce: require touch + reverse across 1×1 (helps in chop).
* TP/SL at fan lines; Fallback RR for missing levels; ATR Trailing Stop optional.
* Transparency/Plot EMA: visual preferences.
Tips
* Range days: larger pivots (L/R 8–12), Bounce ON, ATR Multiplier \~0.30–0.40, EMA 100.
* Trend days: L/R 5–6, Breakout, Multiplier \~0.20–0.30, EMA 50, ATR trail 1.0–1.5.
* Match the TV Gann Fan drawing: turn ATR scale OFF, set ticks per bar = `(Δprice between anchor and 1×1 target) / (bars) / mintick`.
Repainting & testing notes
* Pivots require Right bars to confirm; anchors are set after confirmation (no look-ahead).
* Signals use the current bar close with TradingView strategy mechanics; real-time vs. bar-close can differ slightly, as with any strategy.
* Re-anchoring legitimately moves the structure when new pivots confirm—by design.
⚠️ Disclaimer
This script is provided for educational purposes only.
Past performance does not guarantee future results.
Trading involves risk, and users should exercise caution and use proper risk management when applying this strategy.

Supertrend [TradingConToto]Supertrend — ADX/DI + EMA Gap + Breakout (with Mobile UI)
What makes it original
Supertrend combines trend strength (ADX/DI), multi-timeframe bias (EMA63 and EMA 200D equivalent), a structural filter based on the distance between EMA2400 and EMA4800 expressed in ATR units, and a momentum confirmation through a previous high breakout.
This is not a random mashup — it’s a sequence of filters designed to reduce trades in ranging markets and prioritize mature trends:
Direction: +DI > -DI (trend led by buyers).
Strength: ADX > mean(ADX) (avoids weak, choppy phases).
Short-term bias: Close > EMA63.
Long-term bias: Close > EMA4800 ≈ EMA200 daily on H1.
Momentum: Close > High (immediate breakout).
Structure: (EMA2400 − EMA4800) > k·ATR (ensures separation in ATR units, filters out flat phases).
Entries & exits
Entry: when all six conditions are met and no open position exists.
Exit: if +DI < -DI or Close < EMA63.
Visuals: EMA63 is painted green while in position and red otherwise, with a supertrend-style band; “BUY” labels appear below the green band and “SELL” labels above the red band.
UI: includes a compact table (mobile-friendly) showing the state of each condition.
Default parameters used in this publication
Initial capital: 10,000
Position size: 10% of equity (≤10% per trade is considered sustainable).
Commission: 0.01% per side (adjust to your broker/market).
Slippage: 1 tick
Pyramiding: 0 (only one position at a time)
Adjust commission/slippage to match your market. For US equities, commissions are often per share; for spot crypto, 0.10–0.20% total is common. I publish with 0.01% per side as a conservative example to avoid overestimating results.
Recommended backtest dataset
Timeframe: H1
Multi-cycle window (e.g. 2015–today)
Symbols with high liquidity (e.g. NASDAQ-100 large caps, or BTC/ETH spot) to generate 100+ trades. Avoid cherry-picked short windows.
Why each filter matters
+DI > -DI + ADX > mean: reduce counter-trend trades and weak signals.
Close > EMA63 + Close > EMA4800: enforce trend alignment in short and long horizons.
Breakout High : requires immediate momentum, avoids early entries.
EMA gap in ATR units: blocks flat or compressed structures where EMA200D aligns with price.
Limitations
The breakout filter may skip healthy pullbacks; the design prioritizes continuation over perfect entry price.
No fixed trailing stop/TP; exits depend on trend degradation via DI/EMA63.
Results vary with real costs (commissions, slippage, funding). Adjust defaults to your broker.
How to use
Apply it on a clean chart (no other indicators when publishing).
Keep in mind the default parameters above; if you change them, mention it in your notes and use the same values in the Strategy Tester.
Ensure your dataset produces 100+ trades for statistical validity.

BE-Fib Channel 2 Sided Trading█ Overview:
"BE-Fib Channel 2 Sided Trading" indicator is built with the thought of 2 profound setups named "Cup & Handle (C&H)" and "Fibonacci Channel Trading (FCT)" with the context of "day trading" or with a minimum holding period.
█ Similarities, Day Trading Context & Error Patterns:
While the known fact is that both C&H and FCT provide setups with lesser risk with bigger returns, they both share the similar "Base Pattern".
Note: Inverse of the above Image shall switch the setups between long vs short.
Since the indicator is designed for smaller time-frame candles, there may be instances where the "base pattern" does not visually resemble a Cup & Handle (C&H) pattern. However, patterns are validated using pivot points. The points labeled "A" and "C" can be equal or slightly slanted. Settings of the Indicator allows traders a flexibility to control the angle of these points to spot the strategies according to set conditions. Therefore, understanding the nuances of these patterns is crucial for effective decision-making.
█ 2 Sided Edge: FCT suggests to take trade closer to the yellow line to get better RR ratio. this leaves a small chance of doubt as to; what if price is intended to break the Yellow line thereby activating the C&H.
Wait for the confirmation is a Big FOMO with a compromised RR.
Hence, This indicator is designed to handle both the patterns based on the strength, FIFO and pattern occurring delay.
█ How to Use this Indicator:
Step 1: Enable the Show Sample Sensitivity option to understand the angle of yellow line shown in the sample image. By enabling this option, On the last bar you shall see 4 lines being plotted depicting the max angle which is acceptable for both long and short trades.
Note: Angle can be controlled via setting "Sensitivity".
Higher Sensitivity --> Higher Setup identification --> can lead to failed setups due to 2 sided trading.
Lower Sensitivity --> Lower Setup identification --> can increase the changes of being right.
Step 2: Adjust the look back & look forward periods which shall be used for identifying patterns.
Note: Smaller values can lead to more setups being identified but can hamper the performance of the indicator while increasing the chances of failures. larger values identifies more significant setup but leads to more waiting period thereby compromising on the RR.
Step 3: Adjust the Base Range.
Note: Smaller values can lead to more setups being identified but can hamper the performance of the indicator while increasing the chances of failures. larger values identifies more significant setup but leads to more Risk on play.
Step 4: set the Entry level for FCT & Set the SL for Both FCT & C&H and Target Reward ratio for C&H.
█ Features of Indicator & How it works:
1. Patterns are being identified using Pivot Points method.
2. Tracks & validates both the setups simultaneously on every candle and traded one at a time based on FIFO, New setups found in-between, Defined Entry Levels while on wait for the other pattern to get activated.
3. Alerts added for trade events.
4. FCT setups are generally traded with trailed SL level and increasing Target level on every completed bar. while C&H has the standard SL & TP level with no Trail SL option.
DISCLAIMER: No sharing, copying, reselling, modifying, or any other forms of use are authorized for our documents, script / strategy, and the information published with them. This informational planning script / strategy is strictly for individual use and educational purposes only. This is not financial or investment advice. Investments are always made at your own risk and are based on your personal judgement. I am not responsible for any losses you may incur. Please invest wisely.
Happy to receive suggestions and feedback in order to improve the performance of the indicator better.

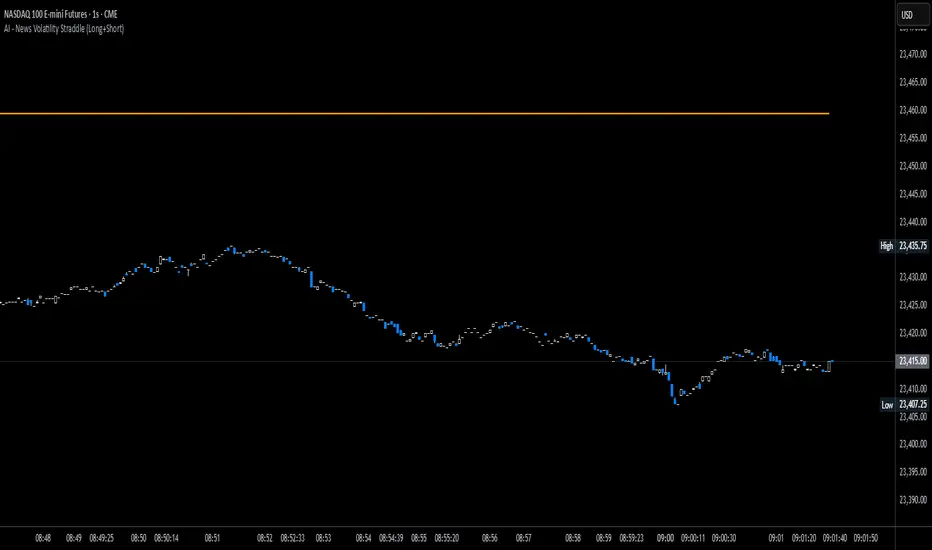
News Volatility Bracketing StrategyThis is a news-volatility bracketing strategy. Five seconds before a scheduled release, the strategy brackets price with a buy-stop above and a sell-stop below (OCO), then converts the untouched side into nothing while the filled side runs with a 1:1 TP/SL set the same distance from entry. Distances are configurable in USD or %, so it scales to the instrument and can run on 1-second data (or higher TF with bar-magnifier). The edge it’s trying to capture is the immediate, one-directional burst and liquidity vacuum that often follows market-moving news—entering on momentum rather than predicting direction. Primary risks are slippage/spread widening and whipsaws right after the print, which can trigger an entry then snap back to the stop.
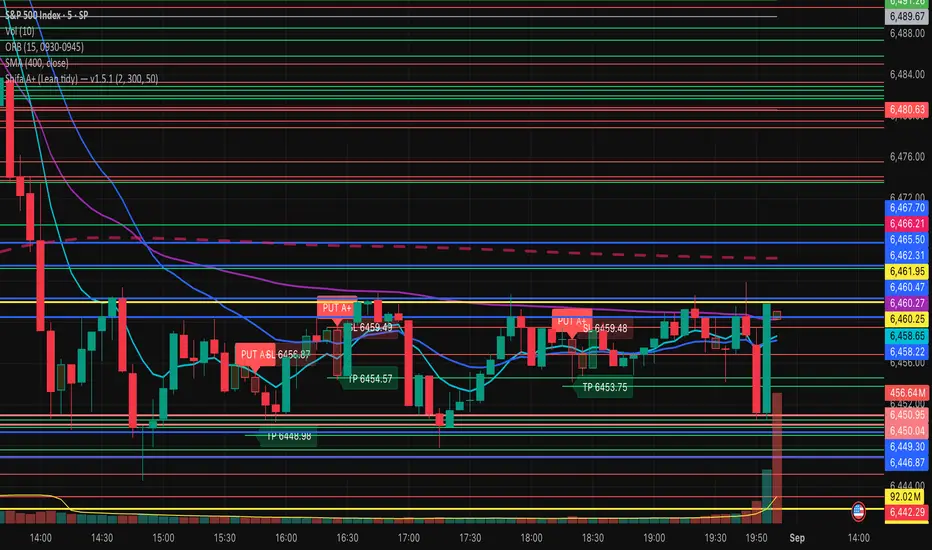
Shifa A+ (Lean tidy) — v1.5.1calls/puts indicator based on trend line, support based tp and resistance based sl
Maiko Range Scalper (Sideways BB + RSI) – v4 cleanPurpose
It’s a range scalping strategy for crypto. It tries to take small, repeatable trades inside a sideways market: buy near the bottom of the range, sell near the middle/top (and the reverse for shorts).
Core idea (two timeframes)
Define the trading range on a higher timeframe (HTF)
You choose the HTF (e.g., 15m or 1h).
The script finds the highest high and lowest low over a lookback window (e.g., last 96 HTF candles) → these become HTF Resistance and HTF Support.
It also calculates the midline (average of support/resistance).
Trade signals on your lower timeframe (LTF)
You run the strategy on a fast chart (e.g., 1m or 5m).
Entries are only allowed inside the HTF range.
Entry logic (mean reversion)
Indicators on the LTF:
Bollinger Bands (length & std dev configurable).
RSI (length & thresholds configurable).
Optional VWAP proximity filter (price must be within X% of VWAP).
Long setup:
Price touches/under-cuts the lower Bollinger band AND RSI ≤ threshold (default 30) AND price is inside the HTF range (and passes VWAP filter if enabled).
Short setup:
Price touches/exceeds the upper Bollinger band AND RSI ≥ threshold (default 70) AND price is inside the HTF range (and passes VWAP filter if enabled).
Exits and risk
Stop-loss: placed just outside the HTF range with a configurable buffer %:
Long SL = HTF Support × (1 − buffer).
Short SL = HTF Resistance × (1 + buffer).
Take-profit (selectable):
Mid band (the Bollinger basis) → conservative, faster exits.
Opposite band / HTF boundary → more aggressive, higher RR but more give-backs.
Position sizing
A simple cap: maximum position size = percent of account equity (e.g., 20%).
The script calculates quantity from that cap and current price.
Plots you’ll see on the chart
HTF Resistance (red) and HTF Support (green) via plot().
HTF Midline (gray dashed) drawn with a line.new() object (because plot() cannot do dashed).
Bollinger basis/upper/lower on the LTF.
Optional VWAP line (only shown if you enable the filter).
Signal markers (green triangle up for Long setups, red triangle down for Short setups).
Alerts
Two alertconditions:
“Long Setup” – when a long entry condition appears.
“Short Setup” – when a short entry condition appears.
Create alerts from these to get notified in real time.
How to use it (quick start)
Add to a 1m or 5m chart of a liquid coin (BTC, ETH, SOL).
Set HTF timeframe (start with 1h) and lookback (e.g., 96 = ~4 days on 1h).
Keep default Bollinger/RSI first; tune later.
Choose TP mode:
“Mid band” for quick scalps.
“Opposite band/Range” if the range is very clean and you want bigger targets.
Set SL buffer (0.15–0.30% is common; adjust for volatility).
Set Max position % to control size (e.g., 20%).
(Optional) Enable VWAP filter to skip stretched moves.
When it works best
Clearly sideways markets with visible support/resistance on the HTF.
High-liquidity pairs where spreads/fees are small relative to your scalp target.
Limitations & safety notes
True breakouts will invalidate mean-reversion logic—your SL outside the range is there to cut losses fast.
Fees can eat into small scalps—prefer limit orders, rebates, and liquid pairs.
Backtest results vary by exchange data; always forward-test on small size.
If you want, I can:
Add an ATR-based stop/target option.
Provide a study-only version (signals/alerts, no trading engine).
Pre-set risk to your €5,000 plan (e.g., ~0.5% max loss/trade) with calculated qty.

EMA inFusion Pro - Multiple SourcesEMA Fusion Pro: Dynamic Trend & Momentum Strategy with Three Exit Modes
EMA Fusion Pro is a highly customizable, multi-exit trend-following strategy designed for traders who value both precision and flexibility. By leveraging exponential moving averages (EMA), average directional index (ADX), and volume analysis, this strategy aims to capture trending market moves while offering three distinct exit modes for optimal risk management across varying market conditions.
Strategy Overview
This strategy systematically identifies potential entry points using a moving average crossover with highly configurable data sources (including price, volume, rate of change, or their Heikin Ashi versions) and filters signal quality with ADX trend strength and volume spikes. Each trade is managed with one of three advanced exit methodologies—reverse signal, ATR-based stop/take profit, or fixed percentage—giving you the control to adapt your risk profile to different market regimes.
Key Features
Customizable EMA Source: Calculate the core trend-filtering EMA from price (default), volume, rate of change, or their Heikin Ashi counterparts for unique market perspectives.
Trend Filter with ADX: Confirm entries only when the trend is strong, as measured by the user-adjustable ADX threshold.
Volume Spike Confirmation: Optional filter to only take trades with above-average volume activity, reducing false signals.
Three Exit Modes:
Reverse Signal: Exit trades when a new, opposite entry signal occurs.
ATR-Based Stop/Take Profit: Dynamic risk management using multiples of the average true range (ATR) for both take profit and stop loss.
Percent-Based Stop/Take Profit: Fixed-percentage risk management with user-defined thresholds.
Visual Annotations: Signal markers, EMA line color-coded by source, trend background coloring, and optional ATR/percent-based TP/SL levels.
Info Panel: Real-time display of all core indicators, current trading mode, exit parameters, and position status for quick oversight.
How It Works
Entry Logic: A crossover signal (above/below the EMA) triggers a new entry, but only if both ADX trend strength and (optionally) volume spike conditions are met.
Exit Logic: Three selectable modes allow you to exit trades on reverse signals, at a dynamic ATR-based profit or loss, or at a fixed percentage gain/loss.
Flexible Data Analysis: The EMA source can be chosen from six options—standard price, volume, rate of change, or their Heikin Ashi variants—allowing experimentation with different market dimensions.
Risk Management: All exits are precisely controlled, either by the next opposing signal, by volatility-adjusted levels, or by fixed risk/reward ratios.
Backtest & Optimization: The strategy is fully backtestable within TradingView’s Strategy Tester, with adjustable parameters for optimization.
Customization & Usage
Indicator Source: Select your preferred data type for EMA calculation, opening the door to creative strategy variations (e.g., volume momentum, pure price trend, rate of change divergence).
Filter Toggles: Enable/disable ADX and volume filters as desired—useful for different market environments.
Exit Mode Selection: Switch between reverse, ATR, or percent-based exits with a single parameter—ideal for adapting to ranging vs. trending markets.
Visual Clarity: The EMA line color reflects its underlying source, and the info panel summarizes all critical values for easy monitoring.
Who Should Use This Strategy?
Trend Followers seeking to ride strong moves with multiple exit options.
Experienced Traders who want to experiment with different data types (volume, momentum, Heikin Ashi) for trend analysis.
Algorithmic Traders looking for a robust, flexible base to build upon with their own ideas.
Getting Started
Apply the script to your chart and review default settings.
Customize parameters—EMA length, ADX threshold, volume settings, exit type—as desired.
Backtest on multiple instruments and timeframes to evaluate performance.
Optimize filters, exit rules, and risk parameters for your preferred trading style.
Monitor with the real-time info panel and trade alerts.
Disclaimer
This script is for educational and entertainment purposes only. It is not financial advice. Past performance is not indicative of future results. Always conduct thorough testing and consider your risk tolerance before trading real capital.
— Happy Trading —
Feel free to adapt, share, and contribute to this open-source strategy!

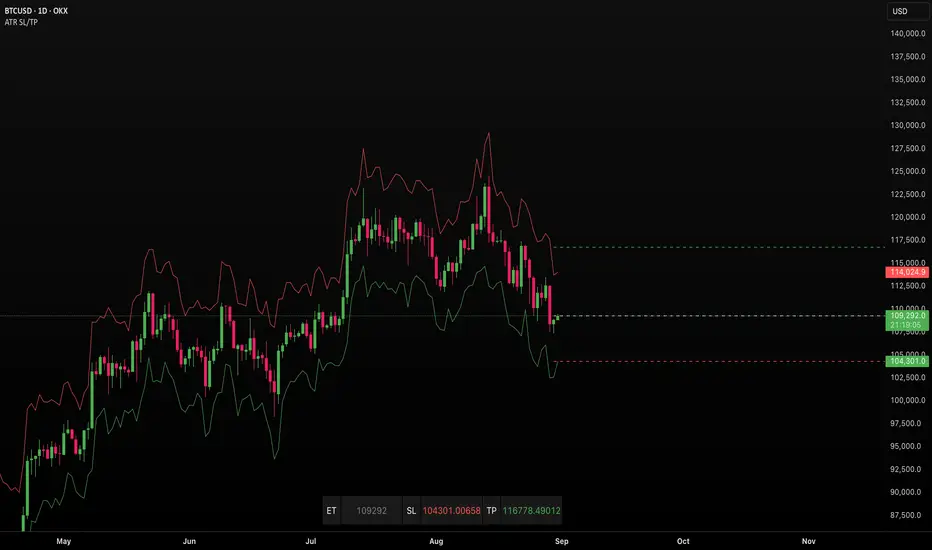
ATR SL/TPStop Loss Finder ATR
A Stop Loss Finder ATR indicator is a dynamic risk management tool leveraging the Average True Range (ATR) to identify and track optimal stop-loss levels based on current market volatility.
A stop hunt indicator is a technical tool designed to identify potential instances where large market participants, often referred to as "smart money," deliberately move the price to trigger a large number of stop-loss orders, creating a temporary price distortion before reversing the trend. These indicators aim to help traders detect these events to either avoid being stopped out or to enter trades in the direction of the anticipated reversal.
For example, a long wick below support with high volume may signal a bullish stop-hunt , indicating that the price has been driven down to trigger sell-stop orders before reversing upward. Conversely, a long wick above resistance with high volume may signal a bearish stop-hunt , suggesting the price was pushed up to trigger buy-stop orders before reversing downward. The presence of such wicks is often associated with candlestick patterns like hammers or shooting stars.
Unlike fixed stop-losses, this indicator adapts its distance from the current price using a customizable ATR multiplier, ensuring that stop-loss levels are neither too tight (prone to being triggered by normal market noise) nor too wide (exposing capital to excessive risk) . The core function calculates the true range—considering the current high-low range, gaps up, and gaps down—over a user-defined period (typically 14 bars), then applies a multiplier to generate a volatility-adjusted stop-loss distance . This approach allows the indicator to dynamically widen stops during high-volatility periods and tighten them during calm markets, providing a more responsive and context-aware exit strategy.
Simple MADSimple MAD is a lightweight and customizable indicator that calculates the Median Absolute Deviation (MAD) over a configurable period to measure market volatility. It dynamically displays Stop-Loss (SL) and Take-Profit (TP) levels based on MAD multipliers, both in absolute price and percentage terms.
The indicator includes a clean, watermark-style table with full layout controls — allowing you to adjust position, text size, alignment, and colors. It supports both manual entry price and automatic use of the latest close, making it ideal for traders who want to manage risk with precision and clarity.
Perfect for swing traders, volatility-based strategies, and anyone looking to integrate MAD into their decision-making.

Third Eye ORB Pro (0915-0930 IST, no-plot)Third Eye ORB Pro (Opening Range Breakout + Range Mode)
This indicator is designed specifically for Indian stocks and indices (NIFTY, BANKNIFTY, FINNIFTY, MIDCAP, etc.) to track the Opening Range (09:15–09:30 IST) and generate actionable intraday trade signals. It combines two key modes — Range Mode (mean reversion inside the opening range) and Breakout Mode (momentum trading beyond the range).
1. Opening Range Framework (09:15–09:30 IST)
The indicator automatically plots the Opening Range High (ORH) and Opening Range Low (ORL) after the first 15 minutes of market open.
The area between ORH and ORL acts as the intraday battlefield where most price action occurs (historically ~70–80% of the day is spent inside this zone).
A shaded box and horizontal lines mark this range, serving as a visual reference for support and resistance throughout the day.
2. Range Mode (Mean Reversion Inside OR)
When price trades inside the Opening Range, the indicator looks for edge rejections to capture range-bound trades.
Range BUY (RB): Triggered near ORL when a bullish rejection candle forms (strong body + long lower wick).
Range SELL (RS): Triggered near ORH when a bearish rejection candle forms (strong body + long upper wick).
Optional filters (toggleable in settings):
RSI Filter: Only allow range buys if RSI is oversold (≤45) and range sells if RSI is overbought (≥55).
VWAP Filter: Only allow range trades if price is not too far from VWAP (distance ≤ X% of OR size).
Labels show suggested Stop Loss (just outside the OR band) and Target (midline/VWAP).
Cooldown logic prevents consecutive whipsaw signals.
3. Breakout Mode (Directional Moves Beyond OR)
When price closes strongly outside the ORH/ORL with momentum, the indicator confirms a breakout/breakdown trade.
Buffers are applied to avoid false breakouts:
ATR Buffer: Price must extend at least ATR × multiplier beyond the range edge.
% Buffer: Price must extend at least a percentage of OR size (default 10%).
Confirmation Filters:
Candle must have a strong body (≥60% of total bar range).
Optional “two closes” rule: price must close outside the range for 2 consecutive candles.
BUY BO: Trigger when price closes above ORH + buffer with momentum.
SELL BD: Trigger when price closes below ORL – buffer with momentum.
Labels and alerts are plotted for quick action.
4. Practical Usage
Works best on 5-minute charts for intraday trading.
Designed to help traders capture both:
Range-bound moves during the day (mean reversion plays).
Strong directional breakouts when institutions push price beyond the opening range.
Particularly effective on expiry days, trending sessions, and major news days when breakouts are more likely.
On sideways days, Range Mode provides reliable scalp opportunities at the OR edges.
5. Features
Auto-plots Opening Range High, Low, Midline.
Box + line visuals (no repainting).
Buy/Sell labels for both Range Mode and Breakout Mode.
Customizable buffers (ATR, % of range) to suit volatility.
Alerts for all signals (breakouts and range plays).
Built with risk management in mind (suggested SL and TP shown on chart).
