Step Channel Momentum Trend [ChartPrime]OVERVIEW
Step Channel Momentum Trend is a momentum-based price filtering system that adapts to market structure using pivot levels and ATR volatility. It builds a dynamic channel around a stepwise midline derived from swing highs and lows. The system colors price candles based on whether price remains inside this channel (low momentum) or breaks out (strong directional flow). This allows traders to clearly distinguish ranging conditions from trending ones and take action accordingly.
⯁ STRUCTURAL MIDLNE (STEP CHANNEL CORE)
The midline acts as the backbone of the trend system and is based on structure rather than smoothing.
Calculated as the average of the most recent confirmed Pivot High and Pivot Low.
The result is a step-like horizontal line that only updates when new pivot points are confirmed.
This design avoids lag and makes the line "snap" to recent structural shifts.
It reflects the equilibrium level between recent bullish and bearish control.
This unique step logic creates clear regime shifts and prevents noise from distorting trend interpretation.
⯁ DYNAMIC VOLATILITY BANDS (ATR FILTERING)
To detect momentum strength, the script constructs upper and lower bands using the ATR (Average True Range):
The distance from the midline is determined by ATR × multiplier (default: 200-period ATR × 0.6).
These bands adjust dynamically to volatility, expanding in high-ATR environments and contracting in calm markets.
The area between upper and lower bands represents a neutral or ranging market state.
Breakouts outside the bands are treated as significant momentum shifts.
This filtering approach ensures that only meaningful breakouts are visually emphasized — not every candle fluctuation.
⯁ MOMENTUM-BASED CANDLE COLORING
The system visually transforms price candles into momentum indicators:
When price (hl2) is above the upper band, candles are green → bullish momentum.
When price is below the lower band, candles are red → bearish momentum.
When price is between the bands, candles are orange → low or no momentum (range).
The candle body, wick, and border are all colored uniformly for visual clarity.
This gives traders instant feedback on when momentum is expanding or fading — ideal for breakout, pullback, or trend-following strategies.
⯁ PIVOT-BASED SWING ANCHORS
Each confirmed pivot is plotted as a label ⬥ directly on the chart:
They also serve as potential manual entry zones, SL/TP anchors, or confirmation points.
⯁ MOMENTUM STATE LABEL
To reinforce the current market mode, a live label is displayed at the most recent candle:
Displays either:
“ Momentum Up ” when price breaks above the upper band.
“ Momentum Down ” when price breaks below the lower band.
“ Range ” when price remains between the bands.
Label color matches the candle color for quick identification.
Automatically updates on each bar close.
This helps discretionary traders filter trades based on market phase.
USAGE
Use the green/red zones to enter with momentum and ride trending moves.
Use the orange zone to stay out or fade ranges.
The step midline can act as a breakout base, pullback anchor, or bias reference.
Combine with other indicators (e.g., order blocks, divergences, or volume) to build high-confluence systems.
CONCLUSION
Step Channel Momentum Trend gives traders a clean, adaptive framework for identifying trend direction, volatility-based breakouts, and ranging environments — all from structural logic and ATR responsiveness. Its stepwise midline provides clarity, while its dynamic color-coded candles make momentum shifts impossible to miss. Whether you’re scalping intraday momentum or managing swing entries, this tool helps you trade with the market’s rhythm — not against it.
Cari dalam skrip untuk "tp"

LotSize Calculator - psyploThis indicator provides a convenient on-chart lot size calculator designed to assist traders with precise position sizing based on account balance, risk tolerance, and trade parameters.
Key Features:
Custom Account Sizing: Define your account size and risk percentage per trade.
Flexible Risk Units: Choose between percentage or fixed currency risk models.
Support for Multiple Currencies: Select from a wide range of currencies including USD, EUR, GBP, INR, and even crypto options like USDT.
Dual Sizing Methods: Configure position size using either quantity or lot-based models, with optional rounding.
Visual Trade Levels: Displays configurable entry, stop loss (SL), and take profit (TP) lines on the chart.
Style Customization: Customize the color, line style, and visibility of each level for better chart readability.
Ideal Use Case:
Designed for manual traders seeking real-time clarity and consistency in risk management without needing to calculate lot size externally.
Disclaimer:
This tool is for informational purposes only. Always practice responsible risk management and perform due diligence before trading.

BackTestLibLibrary "BackTestLib"
Allows backtesting indicator performance. Tracks typical metrics such as won/loss, profit factor, draw down, etc. Trading View strategy library provides similar (and more comprehensive)
functionality but only works with strategies. This libary was created to address performance tracking within indicators.
Two primary outputs are generated:
1. Summary Table: Displays overall performance metrics for the indicator over the chart's loaded timeframe and history
2. Details Table: Displays a table of individual trade entries and exits. This table can grow larger than the available chart space. It does have a max number of rows supported. I haven't
found a way to add scroll bars or scroll bar equivalents yet.
f_init(data, _defaultStopLoss, _defaultTakeProfit, _useTrailingStop, _useTraingStopToBreakEven, _trailingStopActivation, _trailingStopOffset)
f_init Initialize the backtest data type. Called prior to using the backtester functions
Parameters:
data (backtesterData) : backtesterData to initialize
_defaultStopLoss (float) : Default trade stop loss to apply
_defaultTakeProfit (float) : Default trade take profit to apply
_useTrailingStop (bool) : Trailing stop enabled
_useTraingStopToBreakEven (bool) : When trailing stop active, trailing stop will increase no further than the entry price
_trailingStopActivation (int) : When trailing stop active, trailing will begin once price exceeds base stop loss by this number of points
_trailingStopOffset (int) : When trailing stop active, it will trail the max price achieved by this number of points
Returns: Initialized data set
f_buildResultStr(_resultType, _price, _resultPoints, _numWins, _pointsWon, _numLoss, _pointsLost)
f_buildResultStr Helper function to construct a string of resutling data for exit tooltip labels
Parameters:
_resultType (string)
_price (float)
_resultPoints (float)
_numWins (int)
_pointsWon (float)
_numLoss (int)
_pointsLost (float)
f_buildResultLabel(data, labelVertical, labelOffset, long)
f_buildResultLabel Helper function to construct an Exit label for display on the chart
Parameters:
data (backtesterData)
labelVertical (bool)
labelOffset (int)
long (bool)
f_updateTrailingStop(_entryPrice, _curPrice, _sl, _tp, trailingStopActivationInput, trailingStopOffsetInput, useTrailingStopToBreakEven)
f_updateTrailingStop Helper function to advance the trailing stop as price action dictates
Parameters:
_entryPrice (float)
_curPrice (float)
_sl (float)
_tp (float)
trailingStopActivationInput (float)
trailingStopOffsetInput (float)
useTrailingStopToBreakEven (bool)
Returns: Updated stop loss for current price action
f_enterShort(data, entryPrice, fixedStopLoss)
f_enterShort Helper function to enter a short and collect data necessary for tracking the trade entry
Parameters:
data (backtesterData)
entryPrice (float)
fixedStopLoss (float)
Returns: Updated backtest data
f_enterLong(data, entryPrice, fixedStopLoss)
f_enterLong Helper function to enter a long and collect data necessary for tracking the trade entry
Parameters:
data (backtesterData)
entryPrice (float)
fixedStopLoss (float)
Returns: Updated backtest data
f_exitTrade(data)
f_enterLong Helper function to exit a trade and update/reset tracking data
Parameters:
data (backtesterData)
Returns: Updated backtest data
f_checkTradeConditionForExit(data, condition, curPrice, enableRealTime)
f_checkTradeConditionForExit Helper function to determine if provided condition indicates an exit
Parameters:
data (backtesterData)
condition (bool) : When true trade will exit
curPrice (float)
enableRealTime (bool) : When true trade will evaluate if barstate is relatime or barstate is confirmed; otherwise just checks on is confirmed
Returns: Updated backtest data
f_checkTrade(data, curPrice, curLow, curHigh, enableRealTime)
f_checkTrade Helper function to determine if current price action dictates stop loss or take profit exit
Parameters:
data (backtesterData)
curPrice (float)
curLow (float)
curHigh (float)
enableRealTime (bool) : When true trade will evaluate if barstate is relatime or barstate is confirmed; otherwise just checks on is confirmed
Returns: Updated backtest data
f_fillCell(_table, _column, _row, _title, _value, _bgcolor, _txtcolor, _text_size)
f_fillCell Helper function to construct result table cells
Parameters:
_table (table)
_column (int)
_row (int)
_title (string)
_value (string)
_bgcolor (color)
_txtcolor (color)
_text_size (string)
Returns: Table cell
f_prepareStatsTable(data, drawTesterSummary, drawTesterDetails, summaryTableTextSize, detailsTableTextSize, displayRowZero, summaryTableLocation, detailsTableLocation)
f_fillCell Helper function to populate result table
Parameters:
data (backtesterData)
drawTesterSummary (bool)
drawTesterDetails (bool)
summaryTableTextSize (string)
detailsTableTextSize (string)
displayRowZero (bool)
summaryTableLocation (string)
detailsTableLocation (string)
Returns: Updated backtest data
backtesterData
backtesterData - container for backtest performance metrics
Fields:
tradesArray (array) : Array of strings with entries for each individual trade and its results
pointsBalance (series float) : Running sum of backtest points won/loss results
drawDown (series float) : Running sum of backtest total draw down points
maxDrawDown (series float) : Running sum of backtest total draw down points
maxRunup (series float) : Running sum of max points won over the backtest
numWins (series int) : Number of wins of current backtes set
numLoss (series int) : Number of losses of current backtes set
pointsWon (series float) : Running sum of points won to date
pointsLost (series float) : Running sum of points lost to date
entrySide (series string) : Current entry long/short
tradeActive (series bool) : Indicates if a trade is currently active
tradeComplete (series bool) : Indicates if a trade just exited (due to stop loss or take profit)
entryPrice (series float) : Current trade entry price
entryTime (series int) : Current trade entry time
sl (series float) : Current trade stop loss
tp (series float) : Current trade take profit
defaultStopLoss (series float) : Default trade stop loss to apply
defaultTakeProfit (series float) : Default trade take profit to apply
useTrailingStop (series bool) : Trailing stop enabled
useTrailingStopToBreakEven (series bool) : When trailing stop active, trailing stop will increase no further than the entry price
trailingStopActivation (series int) : When trailing stop active, trailing will begin once price exceeds base stop loss by this number of points
trailingStopOffset (series int) : When trailing stop active, it will trail the max price achieved by this number of points
resultType (series string) : Current trade won/lost
exitPrice (series float) : Current trade exit price
resultPoints (series float) : Current trade points won/lost
summaryTable (series table) : Table to deisplay summary info
tradesTable (series table) : Table to display per trade info

Fibonacci Entry Bands [AlgoAlpha]OVERVIEW
This script plots Fibonacci Entry Bands, a trend-following and mean-reversion hybrid system built around dynamic volatility-adjusted bands scaled using key Fibonacci levels. It calculates a smoothed basis line and overlays multiple bands at fixed Fibonacci multipliers of either ATR or standard deviation. Depending on the trend direction, specific upper or lower bands become active, offering a clear framework for entry timing, trend identification, and profit-taking zones.
CONCEPTS
The core idea is to use Fibonacci levels—0.618, 1.0, 1.618, and 2.618—as multipliers on a volatility measure to form layered price bands around a trend-following moving average. Trends are defined by whether the basis is rising or falling. The trend determines which side of the bands is emphasized: upper bands for downtrends, lower bands for uptrends. This approach captures both directional bias and extreme price extensions. Take-profit logic is built in via crossovers relative to the outermost bands, scaled by user-selected aggressiveness.
FEATURES
Basis Line – A double EMA smoothing of the source defines trend direction and acts as the central mean.
Volatility Bands – Four levels per side (based on selected ATR or stdev) mark the Fibonacci bands. These become visible only when trend direction matches the side (e.g., only lower bands plot in an uptrend).
Bar Coloring – Bars are shaded with adjustable transparency depending on distance from the basis, with color intensity helping gauge overextension.
Entry Arrows – A trend shift triggers either a long or short signal, with a marker at the outermost band with ▲/▼ signs.
Take-Profit Crosses – If price rejects near the outer band (based on aggressiveness setting), a cross appears marking potential profit-taking.
Bounce Signals – Minor pullbacks that respect the basis line are marked with triangle arrows, hinting at continuation setups.
Customization – Users can toggle bar coloring, signal markers, and select between ATR/stdev as well as take-profit aggressiveness.
Alerts – All major signals, including entries, take-profits, and bounces, are available as alert conditions.
USAGE
To use this tool, load it on your chart, adjust the inputs for volatility method and aggressiveness, and wait for entries to form on trend changes. Use TP crosses and bounce arrows as potential exit or scale-in signals.

Donchian x WMA Crossover (2025 Only, Adjustable TP, Real OHLC)Short Description:
Long-only breakout system that goes long when the Donchian Low crosses up through a Weighted Moving Average, and closes when it crosses back down (with an optional take-profit), restricted to calendar year 2025. All signals use the instrument’s true OHLC data (even on Heikin-Ashi charts), start with 1 000 AUD of capital, and deploy 100 % equity per trade.
Ideal parameters configured for Temple & Webster on ASX 30 minute candles. Adjust parameter to suit however best to download candle interval data and have GPT test the pine script for optimum parameters for your trading symbol.
Detailed Description
1. Strategy Concept
This strategy captures trend-driven breakouts off the bottom of a Donchian channel. By combining the Donchian Low with a WMA filter, it aims to:
Enter when volatility compresses and price breaks above the recent Donchian Low while the longer‐term WMA confirms upward momentum.
Exit when price falls back below that same WMA (i.e. when the Donchian Low crosses back down through WMA), but only if the WMA itself has stopped rising.
Optional Take-Profit: you can specify a profit target in decimal form (e.g. 0.01 = 1 %).
2. Timeframe & Universe
In-sample period: only bars stamped between Jan 1 2025 00:00 UTC and Dec 31 2025 23:59 UTC are considered.
Any resolution (e.g. 30 m, 1 h, D, etc.) is supported—just set your preferred timeframe in the TradingView UI.
3. True-Price Execution
All indicator calculations (Donchian Low, WMA, crossover checks, take-profit) are sourced from the chart’s underlying OHLC via request.security(). This guarantees that:
You can view Heikin-Ashi or other styled candles, but your strategy will execute on the real OHLC bars.
Chart styling never suppresses or distorts your backtest results.
4. Position Sizing & Equity
Initial capital: 1 000 AUD
Size per trade: 100 % of available equity
No pyramiding: one open position at a time
5. Inputs (all exposed in the “Inputs” tab):
Input Default Description
Donchian Length 7 Number of bars to calculate the Donchian channel low
WMA Length 62 Period of the Weighted Moving Average filter
Take Profit (decimal) 0.01 Exit when price ≥ entry × (1 + take_profit_perc)
6. How It Works
Donchian Low: ta.lowest(low, DonchianLength) over the specified look-back.
WMA: ta.wma(close, WMALength) applied to true closes.
Entry: ta.crossover(DonchianLow, WMA) AND barTime ∈ 2025.
Exit:
Cross-down exit: ta.crossunder(DonchianLow, WMA) and WMA is not rising (i.e. momentum has stalled).
Take-profit exit: price ≥ entry × (1 + take_profit_perc).
Calendar exit: barTime falls outside 2025.
7. Usage Notes
After adding to your chart, open the Strategy Tester tab to review performance metrics, list of trades, equity curve, etc.
You can toggle your chart to Heikin-Ashi for visual clarity without affecting execution, thanks to the real-OHLC calls.

EMA Pullback System 1:5 RRR [SL]EMA Trend Pullback System (1:5 RRR)
Summary:
This indicator is designed to identify high-probability pullback opportunities along the main trend, providing trade signals that target a high 1:5 Risk/Reward Ratio. It is a trend-following strategy built for patient traders who wait for optimal setups.
Strategy Logic:
The system is based on three Exponential Moving Averages (EMAs): 21, 50, and 200.
BUY Signal:
Trend (Uptrend): The price must be above the 200 EMA.
Pullback: The price must pull back into the "Dynamic Support Zone" between the 21 EMA and 50 EMA.
Confirmation: A strong Bullish Confirmation Candle (e.g., Bullish Engulfing) must form within this zone.
SELL Signal:
Trend (Downtrend): The price must be below the 200 EMA.
Pullback: The price must rally back into the "Dynamic Resistance Zone" between the 21 EMA and 50 EMA.
Confirmation: A strong Bearish Confirmation Candle (e.g., Bearish Engulfing) must form within this zone.
Key Features:
Clearly plots the 21, 50, and 200 EMAs on the chart.
Displays BUY and SELL labels when the rules are met.
Automatically calculates and plots Stop Loss (SL) and Take Profit (TP) levels for each signal.
The Risk/Reward Ratio for the Take Profit level is customizable in the settings (Default: 1:5).
How to Use:
Best suited for higher timeframes like H1 and H4.
It is crucial to wait for the signal candle to close before considering an entry.
While this is an automated tool, for best results, combine its signals with your own analysis of Price Action and Market Structure.
Disclaimer:
This is an educational tool and not financial advice. Trading involves substantial risk. Always use proper risk management. It is essential to backtest any strategy before deploying it with real capital.

Codigo Trading 1.0📌Codigo Trading 1.0
This indicator strategically combines SuperTrend, multiple Exponential Moving Averages (EMAs), the Relative Strength Index (RSI), and the Average True Range (ATR) to offer clear entry and exit signals, as well as an in-depth view of market trends. Ideal for traders looking to optimize their operations with an all-in-one tool.
🔩How the Indicator Works:
This indicator relies on the interaction and confirmation of several key components to generate signals:
SuperTrend: Determines the primary trend direction. An uptrend SuperTrend signal (green line) indicates an upward trend, while a downtrend (red line) signals a downward trend. It also serves as a guide for setting Stop Loss and Take Profit levels.
EMAs: Includes EMAs of 10, 20, 55, 100, 200, and 325 periods. The relationship between the EMA 10 and EMA 20 is fundamental for confirming the strength and direction of movements. An EMA 10 above the EMA 20 suggests an uptrend, and vice versa. Longer EMAs act as dynamic support and resistance levels, offering a broader view of the market structure.
RSI: Used to identify overbought (RSI > 70/80) and oversold (RSI < 30/20) conditions, generating "Take Profit" alerts for potential trade closures.
ATR: Monitors market volatility to help you manage exits. ATR exit signals are triggered when volatility changes direction, indicating a possible exhaustion of the movement.
🗒️Entry and Exit Signals:
I designed specific alerts based on all the indicators I use in conjunction:
Long Entries: When SuperTrend is bullish and EMA 10 crosses above EMA 20.
Short Entries: When SuperTrend is bearish and EMA 10 crosses below EMA 20.
RSI Exits (Take Profit): Indicated by "TP" labels on the chart, when the RSI reaches extreme levels (overbought for longs, oversold for shorts).
EMA 20 Exits: When the price closes below EMA 20 (for longs) or above EMA 20 (for shorts).
ATR Exits: When the ATR changes direction, signaling a possible decrease in momentum.
📌Key Benefits:
Clarity in Trend: Quickly identifies market direction with SuperTrend and EMA alignment.
Strategic Entry and Exit Signals: Receive timely alerts to optimize your entry and exit points.
Assisted Trade Management: RSI and ATR help you consider when to take profits or exit a position.
Intuitive Visualization: Arrows, labels, and colored lines make analysis easy to interpret.
Disclaimer:
Trading in financial markets carries significant risks. This indicator is an analysis tool and should not be considered financial advice. Always conduct your own research and trade at your own risk.

Supply/Demand Zones + Engulfment-based ExecutionSupply/Demand Zones + Engulfment-Based Execution
Strategy Overview
This strategy combines institutional trading concepts—supply/demand zones and engulfing candle patterns—to generate high-probability long and short trade setups. The system uses aggregated price action to identify potential reversal zones and confirms entries with engulfing candle patterns, ensuring trades are only taken when market structure shows commitment in the direction of the trade.
Core Concepts
• Supply & Demand Zones: These are automatically detected by analyzing aggregated bullish and bearish candle structures over user-defined intervals. Supply zones are formed after bearish continuation patterns; demand zones appear after bullish continuation patterns.
• Engulfing Entries: Once price enters a zone, the strategy waits for a bullish engulfing pattern (in a demand zone) or a bearish engulfing pattern (in a supply zone) before executing a trade. This adds confirmation and reduces false signals.
• Risk Management: Stop-loss is placed at the low (for long trades) or high (for short trades) of the engulfed candle. Take-profit can be calculated using a fixed R-multiple (risk-to-reward ratio) or a user-defined target price.
Key Features
Fully customizable aggregation factor for zone detection
Visual zone boxes, entry/SL/TP boxes, and engulfing pattern labels
Optional removal of mitigated zones for cleaner charting
Configurable trade mode (Long only, Short only, or Both)
Support for trading sessions and date filtering
Alerts for price entering supply or demand zones
How to Use
Select Aggregation Factor: Choose how many candles to group together for identifying key zones (e.g., 4x timeframe).
Enable Zones: Turn on supply and/or demand zones as needed.
Set Execution Parameters:
– Choose R-multiple (e.g., 2:1 risk-reward)
– Or use a fixed take-profit price
Define Trade Time Window:
– Set the date and time ranges to restrict execution
– Use Start Hour and End Hour to limit trades to specific sessions (e.g., London/New York)
Run on Desired Timeframe: Typically used on 15m–4H charts, depending on your strategy and the asset’s volatility.
Ideal For
• Traders using Smart Money Concepts (SMC)
• Those who value high-confluence entries
• Intraday to swing traders looking for structure-based automation
⚠️ Important Notes
• The strategy requires engulfing confirmation within the zone to enter a position.
• This script does not repaint and executes trades on a bar close basis.
• Backtest results may vary based on session filters and aggregation factor.
© Attribution
This strategy was developed by The_Forex_Steward and is licensed under the Mozilla Public License 2.0.
You are free to use, modify, and distribute it under the terms of that license.

NY Opening Range Breakout - MA StopCore Concept
This strategy trades breakouts from the New York opening range (9:30-9:45 AM NY time) on intraday timeframes, designed for scalping and day trading.
Setup Requirements
Timeframe: Works on any timeframe under 15 minutes (1m, 2m, 3m, 5m, 10m)
Session: New York market hours
Range Period: 9:30-9:45 AM NY time (15-minute opening range)
Entry Rules
Long Entries:
Wait for a candle to close above the opening range high
Enter long on the next candle (before 12:00 PM NY time)
Must be above moving average if using MA-based take profit
Short Entries:
Wait for a candle to close below the opening range low
Enter short on the next candle (before 12:00 PM NY time)
Must be below moving average if using MA-based take profit
Risk Management
Stop Loss:
Long trades: Opening range low
Short trades: Opening range high
Take Profit Options:
Fixed Risk Reward: 1.5x the range size (customizable ratio)
Moving Average: Exit when price crosses back through MA
Both: Whichever comes first
Key Features
Trade Direction Options:
Long Only
Short Only
Both directions
Moving Average Filter:
Prevents entries that would immediately hit stop loss
Uses EMA/SMA/WMA/VWMA with customizable length
Acts as dynamic support/resistance
Time Restrictions:
No entries after 12:00 PM NY time (customizable cutoff)
One trade per direction per day
Daily reset of all variables
Visual Elements
Red/green lines showing opening range
Purple line for moving average
Entry and breakout signals with shapes
Take profit and stop loss levels plotted
Information table with current status
Strategy Logic Flow
Morning: Capture 9:30-9:45 range high/low
Wait: Monitor for breakout (previous candle close outside range)
Filter: Check MA condition if using MA-based exits
Enter: Trade on next candle after breakout
Manage: Exit at fixed TP, MA cross, or stop loss
Reset: Start fresh next trading day
This is a momentum-based breakout strategy that capitalizes on early market volatility while using the opening range as natural support/resistance levels.

CAFX Liquidity Pro V1CAFX Liquidity Pro Indicator
Precision Engineered for Smart Profit-Taking
The CAFX Liquidity Pro Indicator is a powerful trading tool designed to help traders pinpoint high-probability liquidity zones, making it ideal for setting accurate and strategic take profit levels. By identifying where institutional interest is likely to reside, this indicator highlights the areas where price is most likely to react, reverse, or pause—giving you the edge in locking in profits before the market shifts.
Whether you're scalping, day trading, or swing trading, the CAFX Liquidity Pro provides clear visual cues that simplify your decision-making process and enhance your trade management. With a focus on precision and reliability, it helps you avoid emotional exits and instead base your take profits on real market behavior and liquidity dynamics.
Use CAFX Liquidity Pro to stay one step ahead—because knowing where to exit is just as important as knowing when to enter.

Trend Surge with Pullback FilterTrend Surge with Pullback Filter
Overview
Trend Surge with Pullback Filter is a price action-based strategy designed to enter strong trends not at the breakout, but at the first controlled pullback after a surge. It filters out noise by requiring momentum confirmation and low volatility conditions, aiming for better entry prices and reduced risk exposure.
How It Works
A strong upward trend is identified when the Rate of Change (ROC) exceeds a defined percentage (e.g., 2%).
Instead of jumping into the trend immediately, the strategy waits for a pullback: the price must drop at least 1% below its recent high (over the past 3 candles).
A low volatility environment is also required for entry — measured using ATR being below its 20-period average multiplied by a safety factor.
If all three conditions are met (trend + pullback + quiet volatility), the system enters a long position.
The trade is managed using a dynamic ATR-based stop-loss and a take-profit at 2x ATR.
An automatic exit occurs after 30 bars if neither SL nor TP is hit.
Key Features
- Momentum-triggered trend detection via ROC
- Smart pullback filter avoids overbought entries
- Volatility-based filter to eliminate noise and choppy conditions
- Dynamic risk-reward ratio with ATR-driven exit logic
- Time-limited exposure using bar-based exit
Parameter Explanation
ROC Length (10): Looks for short-term price surges
ROC Threshold (2.0%): Trend is considered valid if price increased more than 2%
Pullback Lookback (3): Checks last 3 candles for price retracement
Minimum Pullback % (1.0%): Entry only if price pulled back at least 1%
ATR Length (14): Measures current volatility
Low Volatility Multiplier (1.2): ATR must be below this multiple of its 20-period average
Risk-Reward (2.0): Target is set at 2x the stop-loss distance
Max Bars (30): Trade is closed automatically after 30 bars
Originality Statement
This strategy doesn’t enter at the trend start, unlike many momentum bots. Instead, it waits for the first market hesitation — a minor pullback under low volatility — before entering. This logic mimics how real traders often wait for a better entry after a breakout, avoiding emotional overbought buys. The combined use of ROC, dynamic pullback detection, and ATR-based environment filters makes it both practical and original for real-world trading.
Disclaimer
This strategy is intended for educational and research purposes. Backtest thoroughly and understand the logic before using with real capital.

SuperTrend Confluence Signals [AlgoAlpha]OVERVIEW
This script enhances the classic SuperTrend indicator by integrating volume dynamics, retracement detection, and a multi-asset trend matrix—alongside an automatic mitigation-level drawing system. It's designed for traders who want to see not just trend direction, but the confluence of trend strength, volatility-adjusted retracements, and capital flow through volume pressure. It visually maps key transitions in market structure while offering a clean, color-coded overview of multiple symbols and timeframes in a single chart.
CONCEPTS
At the core is the traditional SuperTrend , which determines directional bias using Average True Range (ATR) with a volatility multiplier. This script overlays that with a dynamic volume histogram that scales relative to recent volume standard deviation, coloring volume bursts within the trend. Retracement signals are triggered when price pulls back toward the SuperTrend level but respects it—quantified through normalized distance sensitivity. On top of that, the indicator automatically draws and manages horizontal support/resistance zones that appear at key trend shifts. These levels persist and are cleared based on configurable rules such as wick/body sweeps or consecutive candle closes. A multi-asset, multi-timeframe table then gives an instant snapshot of trend status across five user-defined symbols and timeframes.
FEATURES
SuperTrend : Configurable ATR length and multiplier for flexible trend sensitivity.
Volumetric Histogram : Gradient-filled candles anchored to SuperTrend bands, scaled by relative volume to indicate activity intensity during trends.
Retracement Arrows : Signals printed when price nears the SuperTrend level without breaking it, allowing identification of high-probability continuation zones.
Volume TP Markers : Diamond markers flag high-volume events, contextualizing price moves with liquidity bursts.
Automatic Structure Levels : Draws clean horizontal lines at significant trend transitions, with optional volatility-based band fills. These levels self-update and clear based on price interaction logic.
Trend Table : Displays trend direction (▲/▼) across five assets and five timeframes. Each cell is colored according to trend bias, providing a compact overview for multi-market confluence.
USAGE
Start by loading the indicator on your main chart and adjusting the ATR Length and Multiplier to match your strategy timeframe. Use lower values for scalping and higher values for swing trading. The histogram bars will appear as colored candles above or below the SuperTrend level, indicating how strong volume is within that trend. Arrow signals suggest minor pullbacks within the trend, which can act as entry opportunities. The level system will automatically plot key price zones during trend flips; if "Body" is selected for mitigation, price must close through the level to invalidate it. If "Wick" is chosen, a single wick breach is enough. Adjust expiry and rejection settings to fine-tune how long levels stay on chart. Finally, enable the Multi-Asset Table to view live trend signals across popular symbols like AAPL or NVDA in different timeframes, helping spot macro-to-micro alignment for higher-confidence trades.

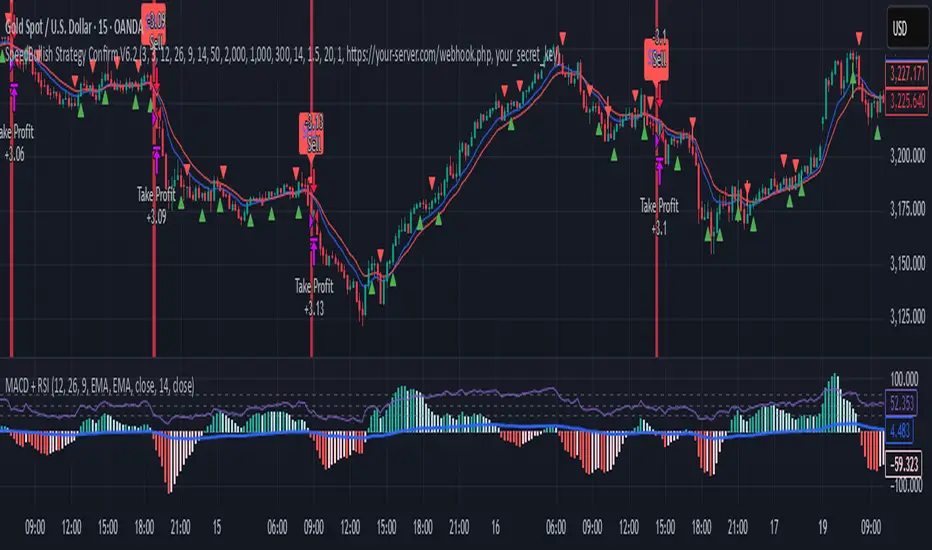
SpeedBullish Strategy Confirm V6.2SpeedBullish Strategy Confirm V6.2
SpeedBullish V6.2 is an advanced price-action + indicator-based strategy designed to confirm trend strength and signal entries with high precision. This version builds on the W/M pattern structure and adds dynamic filtering with EMA, MACD Histogram, RSI, ATR, and Volume.
✅ Signal Conditions
🔹 Buy Signal:
Price above EMA10 or EMA15
MACD Histogram crosses above 0
RSI > 50
(Optional) Higher low via Pivot Low
(Optional) ATR > ATR SMA * Multiplier
(Optional) Volume > SMA * Multiplier
🔻 Sell Signal:
Price below EMA10 or EMA15
MACD Histogram crosses below 0
RSI < 50
(Optional) Lower high via Pivot High
(Optional) Confirmed high volatility and volume
⚙️ Strategy Features
MACD Histogram for momentum shift detection
RSI filtering for momentum confirmation
EMA10/15 for trend direction
ATR-based volatility filter
Volume confirmation filter
Dynamic TP/SL + Trailing Stop
Webhook Integration for MT5 auto-trade
Visual signal markers + background highlight
🔔 Alerts
Alerts are sent in JSON format via alert() with the current symbol, action (buy/sell), and price. Webhook endpoint and secret key are configurable.
📈 How to Use
Attach the strategy to any symbol and timeframe
Customize filters and confirmations to fit your market conditions
Enable webhook alerts for integration with your MT5 Expert Advisor or trading bot
Backtest and optimize before live deployment
Momentum Long + Short Strategy (BTC 3H)Momentum Long + Short Strategy (BTC 3H)
🔍 How It Works, Step by Step
Detect the Trend (📈/📉)
Calculate two moving averages (100-period and 500-period), either EMA or SMA.
For longs, we require MA100 > MA500 (uptrend).
For shorts, we block entries if MA100 exceeds MA500 by more than a set percentage (to avoid fading a powerful uptrend).
Apply Momentum Filters (⚡️)
RSI Filter: Measures recent strength—only allow longs when RSI crosses above its smoothed average, and shorts when RSI dips below the oversold threshold.
ADX Filter: Gauges trend strength—ensures we only enter when a meaningful trend exists (optional).
ATR Filter: Confirms volatility—avoids choppy, low-volatility conditions by requiring ATR to exceed its smoothed value (optional).
Confirm Entry Conditions (✅)
Long Entry:
Price is above both MAs
Trend alignment & optional filters pass ✅
Short Entry:
Price is below both MAs and below the lower Bollinger Band
RSI is sufficiently oversold
Trend-blocker & ATR filter pass ✅
Position Sizing & Risk (💰)
Each trade uses 100 % of account equity by default.
One pyramid addition allowed, so you can scale in if the move continues.
Commission and slippage assumptions built in for realistic backtests.
Stops & Exits (🛑)
Long Stop-Loss: e.g. 3 % below entry.
Long Auto-Exit: If price falls back under the 500-period MA.
Short Stop-Loss: e.g. 3 % above entry.
Short Take-Profit: e.g. 4 % below entry.
🎨 Why It’s Powerful & Customizable
Modular Filters: Turn on/off RSI, ADX, ATR filters to suit different market regimes.
Adjustable Thresholds: Fine-tune stop-loss %, take-profit %, RSI lengths, MA gaps and more.
Multi-Timeframe Potential: Although coded for 3 h BTC, you can adapt it to stocks, forex or other cryptos—just recalibrate!
Backtest Fine-Tuned: Default settings were optimized via backtesting on historical BTC data—but they’re not guarantees of future performance.
⚠️ Warning & Disclaimer
This strategy is for educational purposes only and designed for a toy fund. Crypto markets are highly volatile—you can lose 100 % of your capital. It is not a predictive “holy grail” but a rules-based framework using past data. The parameters have been fine-tuned on historical data and are not valid for future trades without fresh calibration. Always practice with paper-trading first, use proper risk management, and do your own research before risking real money. 🚨🔒
Good luck exploring and experimenting! 🚀📊

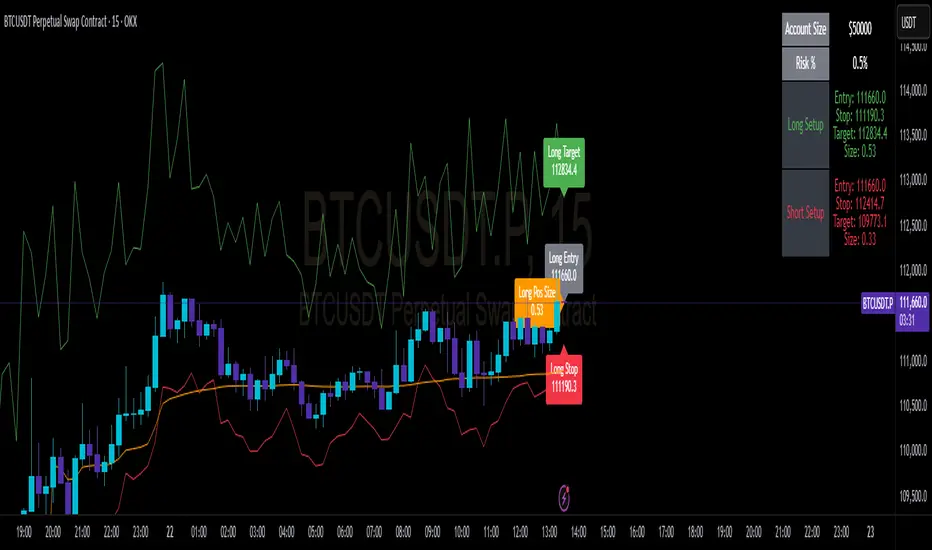
Perp R/R Toolcalculate lot size and automatically plot SL and TP and entry for quicker execution when scalping. SL is currently set to high of candle for shorts and low of candle for longs +1 ATR. can change ATR, risk per trade and r/r ratio in settings. change trade direction to show info for long, short or both.
10 Monday's 1H Avg Range + 30-Day Daily RangeWhat This Script Does
This indicator is designed for traders who want to monitor volatility and range behavior at the start of the trading week . It focuses specifically on the first four 15-minute candles of each Monday and tracks their combined high-low range over time.
How It Works
Monday 1H Range Detection:
Each week, it automatically detects and highlights the first 4 candles of Monday on a 15-minute chart (1 hour total). It calculates the range between the highest high and lowest low of these candles.
10-Week Average of Monday 1H Ranges:
It stores and averages the last 10 such ranges, displaying this average in a table for weekly comparison.
30-Day Daily Range Average:
Separately, it calculates the average daily range (high – low) of the last 30 daily candles. This value helps put the Monday 1H range into broader context and can guide Stop Loss or TP planning.
Dynamic Labeling & Visual Highlights:
The script visually highlights the first 4 candles of Monday and places a label showing the pip range once the 4 candles have completed. It also updates a small table with the two averages described above.
How to Use It
Use it on the 15-minute timeframe to activate the Monday 1H logic.
Compare the current week’s Monday range to the 10-week average to see if volatility is increasing or decreasing.
Use the 30-day daily range to determine if the Monday opening movement is unusually large or small.
Consider adjusting trade entries, stops, or targets if the Monday range is disproportionately large compared to recent historical behavior.
What Makes It Original?
This is not a typical volatility indicator like ATR or standard deviation. Instead, it’s a purpose-built tool combining:
Time-specific behavior (first hour of the week),
Historical contextualization (10-week average tracking),
A dual-timeframe analysis (15-min + daily),
A user-friendly table and visual interface.
This script helps intraday or swing traders spot abnormal volatility early in the week and adjust their strategies accordingly—especially in fast-moving Forex or Index markets.

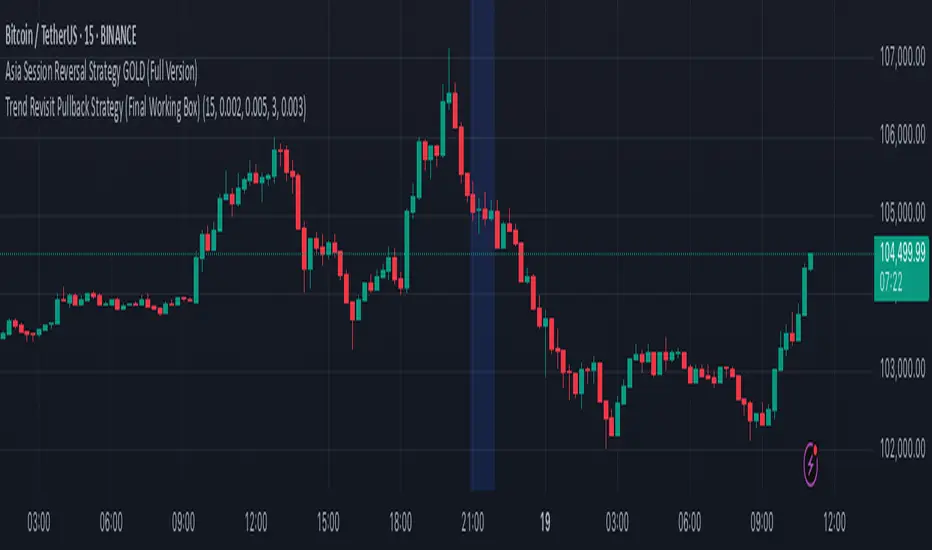
Trend Revisit Pullback Strategy (Final Working Box)📈 Trend Revisit Pullback Strategy
This TradingView Pine Script strategy identifies strong trend breakouts and accounts for natural pullbacks by:
Entering long or short on strong 1-bar breakouts
Allowing for pullback averaging if price retraces after entry
Expecting a revisit to the original entry price within 15 bars
Automatically exiting at break-even or using a custom TP/SL
Drawing a visual trade zone (entry → SL → revisit window) for easy reference
Optional labels and color-coded boxes to track each trade’s lifecycle
Ideal for trend traders who anticipate a pullback and prefer to manage risk with break-even exits or reward-to-risk parameters.
Gold Breakout Strategy - RR 4Strategy Name: Gold Breakout Strategy - RR 4
🧠 Main Objective
This strategy aims to capitalize on breakouts from the Donchian Channel on Gold (XAU/USD) by filtering trades with:
Volume confirmation,
A custom momentum indicator (LWTI - Linear Weighted Trend Index),
And a specific trading session (8 PM to 8 AM Quebec time — GMT-5).
It takes only one trade per day, either a buy or a sell, using a fixed stop-loss at the wick of the breakout candle and a 4:1 reward-to-risk (RR) ratio.
📊 Indicators Used
Donchian Channel
Length: 96
Detects breakouts of recent highs or lows.
Volume
Simple Moving Average (SMA) over 30 bars.
A breakout is only valid if the current volume is above the SMA.
LWTI (Linear Weighted Trend Index)
Measures momentum using price differences over 25 bars, smoothed over 5.
Used to confirm trend direction:
Buy when LWTI > its smoothed version (uptrend).
Sell when LWTI < its smoothed version (downtrend).
⏰ Time Filter
The strategy only allows entries between 8 PM and 8 AM (GMT-5 / Quebec time).
A timestamp-based filter ensures the system recognizes the correct trading session even across midnight.
📌 Entry Conditions
🟢 Buy (Long)
Price breaks above the previous Donchian Channel high.
The current channel high is higher than the previous one.
Volume is above its moving average.
LWTI confirms an uptrend.
The time is within the trading session (20:00 to 08:00).
No trade has been taken yet today.
🔴 Sell (Short)
Price breaks below the previous Donchian Channel low.
The current channel low is lower than the previous one.
Volume is above its moving average.
LWTI confirms a downtrend.
The time is within the trading session.
No trade has been taken yet today.
💸 Trade Management
Stop-Loss (SL):
For long entries: placed below the wick low of the breakout candle.
For short entries: placed above the wick high of the breakout candle.
Take-Profit (TP):
Set at a fixed 4:1 reward-to-risk ratio.
Calculated as 4x the distance between the entry price and stop-loss.
No trailing stop, no break-even, no scaling in/out.
🎨 Visuals
Green triangle appears below the candle on a buy signal.
Red triangle appears above the candle on a sell signal.
Donchian Channel lines are plotted on the chart.
The strategy is designed for the 5-minute timeframe.
🔄 One Trade Per Day Rule
Once a trade is taken (buy or sell), no more trades will be executed for the rest of the day. This prevents overtrading and limits exposure.

XAU/USD Scalping Bot [Jake-Style 1500+] FINALDescription:
This advanced scalping bot is engineered for XAU/USD using Jake-style visual overlays with predictive trade triggers, early entry signals, and multi-layer confirmation tools.
Key Features:
• EMA Cloud System with color-coded directional bias (5/13/21/55/144/377)
• PSAR Flip-Only Dots to highlight trend reversal moments without chart clutter
• Bollinger Band Zones to visualize volatility channels
• Predictive Entry Flags for early buy/sell signals before momentum candles (≥2 pip move)
• TRUE Candle Logic for confirmed trend-following entries
• Multi-Level TP/SL Lines with real-time alerts:
• TP1 / TP2 / TP3 with precise trigger logic
• Stop Loss hit detection
• Red Flag Warnings for exit caution during reversal zones (overbought TDI / failed breakouts)
Optimized For:
• 1m / 3m / 5m / 15m / 30m timeframes
• Scalping & intraday trading with high-precision entries
• Traders who prefer visual confirmation before committing to entries
Created by: @Livingstonedan
Powered by: ChatGPT x Jake-style automation logic

OB Sweeps ReversalOB Sweeps Reversal is a high-precision market structure tool that identifies and dynamically tracks bullish and bearish order blocks — key zones where institutional participants are likely to be active. These zones act as support and resistance levels, adapting to market behavior in real time.
The script monitors price interaction with each OB and classifies its status as:
Unmitigated (price has not yet returned)
Mitigating (price is testing the zone)
Invalidated (zone has been broken)
Traders can use these zones directly as actionable support/resistance — or wait for additional confirmation via the system’s liquidity sweep detection and optional filters.
🔍 Key Features:
Automatically detects and plots bullish and bearish OBs
Tracks mitigation status and updates visuals accordingly
Detects liquidity sweeps of recent highs/lows
Optional filters:
• 200 EMA trend direction
• Momentum of current or previous candle
Plots stop-loss and take-profit lines using ATR-based logic
Clean entry labels with full contextual data
Built-in alert system with constant-string messages (automation ready)
📈 How to Use:
Load the script on any timeframe (15m–4H recommended)
Observe the live OB zones as they develop
Trade based on price interaction:
• Bounce off a bullish OB = potential long setup
• Rejection from a bearish OB = potential short
• Sweep + snapback into an OB = optional trap reversal entry
SL/TP levels are drawn automatically for reference
Use alerts to automate or monitor high-conviction setups
The order blocks themselves are valuable on their own — even without waiting for a signal. They can be used as dynamic support and resistance zones, offering excellent structure-based trading opportunities.
🧠 Ideal For:
Traders who follow price action and market structure
Those using support/resistance, OBs, or supply/demand
Intraday and swing traders looking for cleaner structure alignment
Users who prefer low-frequency, high-quality setups
⚠️ Note:
This tool does not produce frequent signals. It is designed for precision and discipline, with a focus on clarity and confluence. It complements — not replaces — a trader’s decision-making process.
This script is open-source and designed with integrity, precision, and trader usability in mind. No links, no upsells, no promotions — just a reliable system for structural market analysis.

Apex Edge - MTF Confluence PanelApex Edge – MTF Confluence Panel
Description:
The Apex Edge – MTF Confluence Panel is a powerful multi-timeframe analysis tool built to streamline trade decision-making by aggregating key confluences across three user-defined timeframes. The panel visually presents the state of five core market signals—Trend, Momentum, Sweep, Structure, and Trap—alongside a unified Score column that summarizes directional bias with clarity.
Traders can customize the number of bullish/bearish conditions required to trigger a score signal, allowing the tool to be tailored for both conservative and aggressive trading styles. This script is designed for those who value a clean, structured, and objective approach to identifying market alignment—whether scalping or swing trading.
How it Works:
Across each of the three selected timeframes, the panel evaluates:
Trend: Based on a user-configurable Hull Moving Average (HMA), the script compares price relative to trend to determine bullish, bearish, or neutral bias.
Momentum: Uses OBV (On-Balance Volume) with volume spike detection to identify bursts of strong buying or selling pressure.
Sweep: Detects potential liquidity grabs by identifying price rejections beyond prior swing highs/lows. A break below a previous low with reversal signals bullish intent (and vice versa for bearish).
Structure: Uses dynamic pivot-based logic to identify market structure breaks (BOS) beyond recent confirmed swing levels.
Trap: Flags potential false moves by measuring RSI overbought/oversold signal clusters combined with minimal price movement—highlighting exhaustion or deceptive breaks.
Score: A weighted consensus of the above components. The number of required confluences to trigger a score (default: 3) can be set by the user via input, offering flexibility in signal sensitivity.
Why It’s Useful for Traders:
Quick Decision-Making: The color-coded panel provides instant visual feedback on whether confluences align across timeframes—ideal for fast-paced environments like scalping or high-volatility news sessions.
Multi-Timeframe Confidence: Helps eliminate guesswork by confirming whether higher and lower timeframe conditions support your trade idea.
Customizability: Adjustable confluence threshold means traders can fine-tune how sensitive the system is—more signals for faster entries, stricter confluence for higher conviction trades.
Built-In Alerts: Automated alerts for score alignment, trap detection, and liquidity sweeps allow traders to stay informed even when away from the screen.
Strategic Edge: Supports directional bias confirmation and trade filtering with logic designed to mimic professional decision-making workflows.
Features:
Clean, real-time confluence table across three user-selected timeframes
Configurable score sensitivity via “Minimum Confluences for Score” input
Cell-based colour coding for at-a-glance trade direction
Built-in alerts for score alignment, traps, and sweep triggers
Note - This Indicator works great in sync with Apex Edge - Session Sweep Pro
Useful levels for TP = previous session high/low boxes or fib levels.
⚠️ Disclaimer:
This script is for informational and educational purposes only and should not be considered financial advice. Always perform your own due diligence and practice proper risk management when trading.

UTSStrategyHelperLibrary "UTSStrategyHelper"
TODO: add library description here
stopLossPrice(sig, atr, factor, isLong)
Calculates the stop loss price using a distance determined by ATR multiplied by a factor. Example for Long trade SL: PRICE - (ATR * factor).
Parameters:
sig (float)
atr (float) : (float): The value of the atr.
factor (float)
isLong (bool) : (bool): The current trade direction.
Returns: (bool): A boolean value.
takeProfitPrice(sig, atr, factor, isLong)
Calculates the take profit price using a distance determined by ATR multiplied by a factor. Example for Long trade TP: PRICE + (ATR * factor). When take profit price is reached usually 50 % of the position is closed and the other 50 % get a trailing stop assigned.
Parameters:
sig (float)
atr (float) : (float): The value of the atr.
factor (float)
isLong (bool) : (bool): The current trade direction.
Returns: (bool): A boolean value.
trailingStopPrice(initialStopPrice, atr, factor, priceSource, isLong)
Calculates a trailing stop price using a distance determined by ATR multiplied by a factor. It takes an initial price and follows the price closely if it changes in a favourable way.
Parameters:
initialStopPrice (float) : (float): The initial stop price which, for consistency also should be ATR * factor behind price: e.g. Long trade: PRICE - (ATR * factor)
atr (float) : (float): The value of the atr. Ideally the ATR value at trade open is taken and used for subsequent calculations.
factor (float)
priceSource (float) : (float): The current price.
isLong (bool) : (bool): The current trade direction.
Returns: (bool): A boolean value.
hasGreaterPositionSize(positionSize)
Determines if the strategy's position size has grown since the last bar.
Parameters:
positionSize (float) : (float): The size of the position.
Returns: (bool): A boolean value.
hasSmallerPositionSize(positionSize)
Determines if the strategy's position size has decreased since the last bar.
Parameters:
positionSize (float) : (float): The size of the position.
Returns: (bool): A boolean value.
hasUnchangedPositionSize(positionSize)
Determines if the strategy's position size has changed since the last bar.
Parameters:
positionSize (float) : (float): The size of the position.
Returns: (bool): A boolean value.
exporthasLongPosition(positionSize)
Determines if the strategy has an open long position.
Parameters:
positionSize (float) : (float): The size of the position.
Returns: (bool): A boolean value.
hasShortPosition(positionSize)
Determines if the strategy has an open short position.
Parameters:
positionSize (float) : (float): The size of the position.
Returns: (bool): A boolean value.
hasAnyPosition(positionSize)
Determines if the strategy has any open position, regardless of short or long.
Parameters:
positionSize (float) : (float): The size of the position.
Returns: (bool): A boolean value.
hasSignal(value)
Determines if the given argument contains a valid value (means not 'na').
Parameters:
value (float) : (float): The actual value.
Returns: (bool): A boolean value.

Fibonacci + TP/SL Strategy [Backtest]✅ Key Features Added and Adjusted:
Fibonacci Retracement Levels:
Automatically calculated based on the last 100 bars' high/low
Plotted levels: 0%, 23.6%, 38.2%, 50%, 61.8%, 78.6%, 100%
Extension targets: 161.8%, 261.8%, 423.6%
Buy/Sell Signal Logic:
Buy: Price is between 78.6% and 38.2% levels
Sell: Price is between 61.8% and 23.6% levels
Both depend on a can_trade time filter to avoid overtrading
ATR-based Stop-Loss:
Stop-loss dynamically adapts to market volatility:
SL = Entry - ATR * 1.5 (long)
SL = Entry + ATR * 1.5 (short)
Fixed Take-Profit:
Configurable via input: default is 4%
Can be changed in TradingView UI
Golden/Death Cross Indicator (Visual Only):
EMA 50 crossing EMA 200 plotted on chart:
Golden Cross = Buy signal (green triangle)
Death Cross = Sell signal (red triangle)
Weekly Profit Cap:
Prevents new trades if weekly profit exceeds 15%
Resets at the start of every week
Visual Elements:
All Fibonacci levels are plotted
Buy/Sell signals are labeled on the chart (BUY, SELL)
