Risk Management Strategy TemplateThis strategy is intended to be used as a base template for building new strategies.
It incorporates the following features:
Risk management:
Configurable X% loss per stop loss
Configurable R:R ratio
Trade entry:
Calculated position size based on risk tolerance
Trade exit:
Stop Loss currently configurable ATR multiplier but can be replaced based on strategy
Take Profit calculated from Stop Loss using R:R ratio
Backtesting:
Configurable backtesting range by date
Trade drawings:
TP/SL boxes drawn for all trades. Can be turned on and off
Trade exit information labels. Can be turned on and off
NOTE: Trade drawings will only be applicable when using overlay strategies
Debugging:
Includes section with useful debugging techniques
Strategy conditions
Trade entry:
LONG
C1: Price is above EMA line
C2: RSI is crossing out of oversold area
SHORT
C1: Price is below EMA line
C2: RSI is crossing out of overbought area
Trade exit:
Stop Loss: Stop Loss ATR multiplier is hit
Take Profit: R:R multiplier * Stop Loss is hit
The idea is to use RSI to catch pullbacks within the main trend.
Note that this strategy is intended to be a simple base strategy for building upon. It was not designed to be traded in its current form.
Cari dalam skrip untuk "tp"

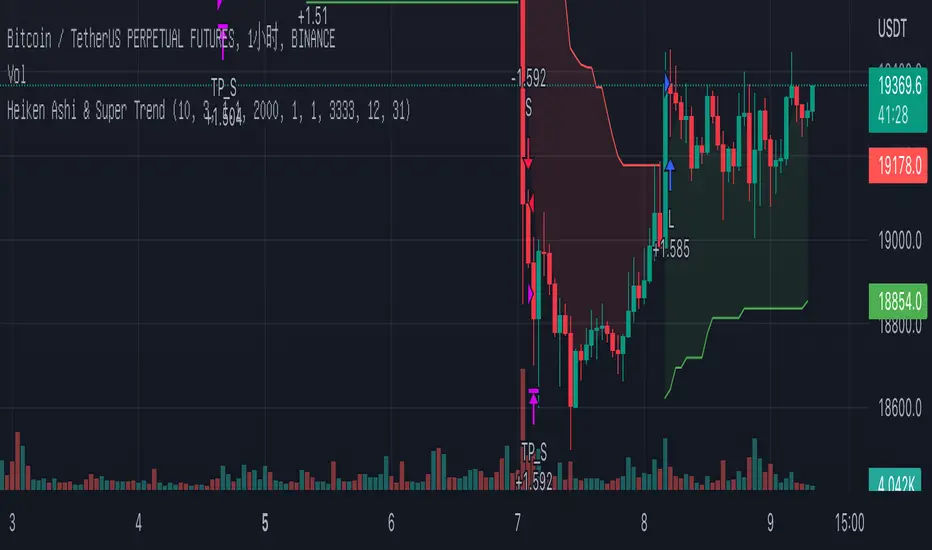
Heiken Ashi & Super TrendThis is one of my open source 1h strategies
It works on Binance: BTCUSDTPERP charts
This strategy involves two indicators
1. Heiken Ashi - a typical technical indicator to help highlight and clarify the current trend. This somehow allows the chart to ignore unnecessary fluctuations and make the trend more visible.
2.Super Trend - - One of the most common ATR-based indicators, the SuperTrend indicator is useful to help you catch big trends.
Buy entry conditions are as follows.
1. The Super Trend indicator running on the Heiken Ashi chart gives a buy signal.
2. Buy at the current market price and take profit at 1% of the normal k-line at this time.
Take profit
TP - 1%
Stop Loss
None
ALMA/EMA/SRSI Strategy + IndicatorBack with another great high hit rate strategy!!
Disclaimer* This strategy was sampled using source code written by @ClassicScott , as referred to in the script, there is a clear line where the source code was scripted by myself.
This Strategy consists of three key factors, the ALMA, EMA crossover, and a Stochastic Rsi
ALMA: The Alma is the step line shown, turning green and red at select times. This average value gives general oversight of the macro movement of price action. and this particular one was coded by Mr.ClassicScott.
EMA crossover: At the input screen you are given an option of the fast and slow ema's. The default is solely for the hit rate and correlation to the Alma of this strategy. The arrows you see depicted on the chart are the crossover events happening.
Stochastic Rsi: The Stochastic Rsi is a stochastic value, using data sampled from the rsi. The use of this indicator in my strategy is to prevent entries when too overbought and oversold, as well as closures and vice versa, to prevent holding bags either way.
Fixed % TP: In the input screen you are given a take profit and stop loss percentage, for good R/R the hit rate will take a notch down, but with no R/R it will be near perfect.
How to use this:
Add it to your chart to get the strategy inputs. (The strategy is really only useful on a 15min TF. However the indicator within it can be used on anything at anytime!)
Watch the yellow and aqua moving averages, these are your ema's and crossover's will trigger signals based on your integer inputs.
Find Correlation between other leading indicators, as well as crossover's down/up and a red/green alma.
DO NOT use the arrows as buy/sell signals. These are simply to show ema's are crossing under or over. Momentum indicator's paired with this can be useful to determine if it could be a buy signal or sell signal.
Cheat Code's Notes:
Almost at 1000 boosts!!! I appreciate the support from everyone and I will keep trying my best to deliver quality strategies for the people.
-Cheat Code
BYBIT:BTCUSDT

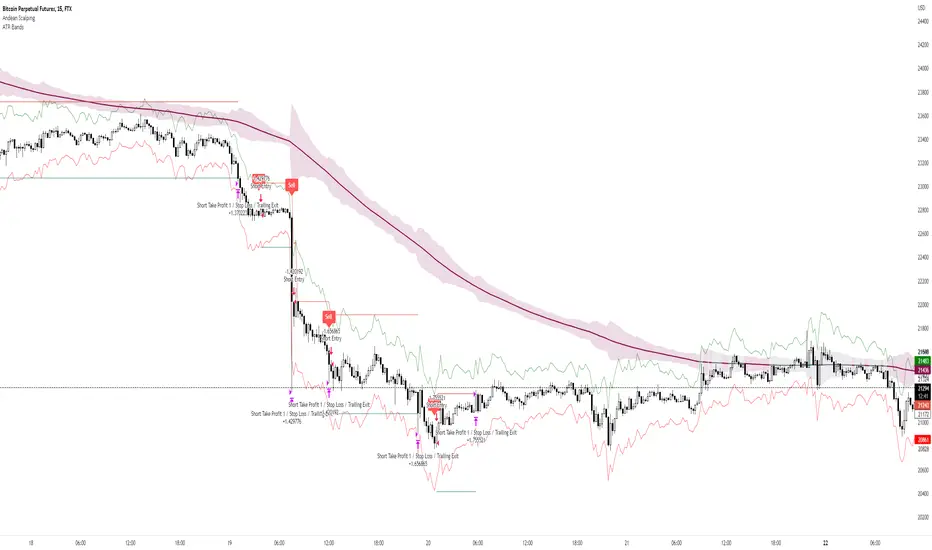
Andean ScalpingAndean Scalping Implementation - BETA
- Uses Andean Oscillator: alpaca.markets
- Implements a threshold moving average (SMA 1000) on the Andean Signal line at 1.1 factor to filter out small moves
- TP/SL using ATR bands at 3x multiplier
Stopping Volume Finder (Reversals)This indicator is used to identify possible reversals
(1) Green arrow means a possible bullish reversal
(2) Red arrow means a possible bearish reversal
(3) Green and Red arrows means it cleared liquidity from both sides and is likely to go to the nearest area of interest
-It finds high volume candles that likely cleared out stop losses which usually results in a reversal
-This indicator works best on the 5M and 15M during London and NY sessions
-Use it along with other indicators for example Cipher B Divergance
-Use support and resistance to find TP levels, such as previous lows/highs and 20, 50 and 200 emas
-SL goes above or below wick depending if its a buy or sell

Range Strat - MACD/RSIThis strategy uses a trend based indicator (MACD) for entry/exit signals with a momentum oscillator (RSI) to act as confirmation. Although relying on a trend based indicator this has been created for range bound crypto markets, which have been in a period of chop since June 2022.
Long/Short signals are generated from MACD with the RSI oscillator thresholds suppressing entries at price extremes. This is not a mean reversion RSI strategy! As the indicators are contrary to each other you will need to be generous with the RSI settings in order for signals to trigger.
Strategy is designed for use on the 4h timeframe, it may work well on higher timeframes, but lower time frames will lead to false signals. Use fixed percentage of equity for order size to capture the compounding effect. As a reversal strategy bear in mind that should market trend strongly in either direction stops will be required.
The RSI thresholds can be tailored to provide higher frequency or safer signals. Similarly tweaking MACD settings will provide earlier/more frequent or safer signals. As this is intended to enter near range high / low you should check the visual cues to ensure a ping-pong effect is observed, so that peaks and troughs are captured. Once an observable range is established the strategy works well across a range of crypto markets,
The script is open source, so feel free to amend as you wish. Using a different momentum oscillator may provide better results. I have prior coding experience, but first time using PineScript was last night, so it's not very tidy. I will update this with some additional customisation and TP/SL in the near future.
Usage: Range bound markets
Markets: Cryptocurrency Alts/BTC/ETH
Timeframe: 4h

VXD Cloud Edition for Python-Binance-bots.VXD Cloud Edition for Python-Binance-bots.
to overcome sideways market conditions this cloud configured for low timeframe.
every TA is same as VXD Cloud Edition but custom alert message for bots.
Risk:Reward Calculation
Risk of Ruin Setting can now selected between Fixed $ or %
if Buy your Stoploss will be Swing low
if Sell your Stoploss will be Swing high and can be setting at Pivot Setting
then Auto Position Sizing and TP line will be calculated form there and will show in Orange color line (Draw Position Box is available)
Tailing SL when price greater than RR=1
Alert Setting
{{strategy.order.alert_message}}
Python-Bot
github.com
There are 2 mode : one-way mode and hedge mode is different script in my Github profile.
read README.MD and there's video tutorial in thai language.
Pls study app.py and it's script before deploy for your own safty and your own risk, I'm NOT responsible for your loss.

The Impeccable by zyberalThis strategy works differently than others, it uses the IchimokuTenkan, Kijun, and Senkou periods to compute a general sense of market trend. Then I used the MACD fast, slow, and smooth with custom inputs to compute a optimum cross for finding macro bottoms and tops for any asset. This strategy doesn't trade on weekends and does not have a set TP (take profit) for each long or short.

Risk:RewardThis Indicator displays Entry and Exits levels. The display is done under 3 modes:
- Risk/Reward mode (the one by default. It is set to a 1:1 ratio)
- Multiples TP Levels
- Custom Levels
Click to Set entry Price on chart
The displaying is static by default
to make it dynamic disable the "Use custom Entry ?" input.
Disclaimer: Scripts that I post publicly are experimental. They are not financial advices. Always backtest your ideas using your own methodologies.

LevelsManagerLibrary "LevelsManager"
TODO: Track up to 6 TakeProfits and 1 StopLoss achievement for one or many of your buy/sell conditions.
manageTrade(bool, bool, bool, string, string, float, float, bool, bool, bool, bool, bool, bool, float, float, float, float, float, float, float)
Track TakeProfits and StopLoss achievement for one or many of your buy/sell conditions. CHECK the commented section: "Function @manageTrade" for Description
Parameters:
bool : useSignal.
bool : b_gameOVer.
bool : b_gameOVer.
string : bName.
string : sName.
float : buyEntrySource.
float : sellEntrySource.
bool : useTp1.
bool : useTp2.
bool : useTp3.
bool : useTp4.
bool : useTp5.
bool : useTp6.
float : tp1x.
float : tp2x.
float : tp3x.
float : tp4x.
float : tp5x.
float : tp6x.
float : slx.
Returns: check commented section: "Function @manageTrade".
showOnlyFirstOccurence(booleanInput)
Single out the occurence of a bool series between to 2 bool series.
Parameters:
booleanInput : to activate or deactivate occurences filtering.
Returns: filterred or not bool series.

3LS | 3 Line Strike Strategy [Kintsugi Trading]What is the 3LS | 3 Line Strike Strategy?
Incorporating the 3 Line Strike candlestick pattern into our strategy was inspired by Arty at The Moving Average and the amazing traders at TheTrdFloor .
The Three Line Strike is a trend continuation candlestick pattern consisting of four candles. Depending on their heights and collocation, a bullish or a bearish trend continuation can be predicted.
In a symphony of trend analysis, price action, and volume we can find and place high-probability trades with the 3LS Strategy.
How to use it!
----- First, start by choosing a Stop-Loss Strategy, Stop PIP Size, and Risk/Reward Ratio -----
- Stop-Loss Strategy
Fixed PIP Size – This uses the top/bottom of the indicator candle and places a TP based on the chosen Risk:Reward ratio.
ATR Trail (No set Target Profit, only uses ATR Stop)
ATR Trail-Stop (Has set Target Profit, however, stop is based on ATR inputs)
**If you choose an ATR Stop-Loss Strategy - input the desired ATR period and Multiple you would like the stop to be calculated at**
**ATR Stop-Loss Strategies have a unique alert setup for Auto-Trading. See Auto-Trading Section**
- Risk/Reward Ratio = If you have a .5 risk/reward, it means you are risking $100 to make $50.
- Additional Stop PIP Size = Number of PIPs over the default stop location of the top or bottom of the indicator candle.
----- Next, we set the Session Filter -----
Set the Timezone and Trade Session you desire. If no specific session is desired, simply set the Trade Session to 00:00 - 00:00.
----- Next, we set the Moving Average Cloud Fill -----
Enter the Fast and Slow Moving Average Length used to calculate trend direction:
MA Period Fast
MA Period Slow
These inputs will determine whether the strategy looks for Long or Short positions.
----- Next, we set the VSA – Volume Spread Analysis Settings -----
Check the box to show the indicator at the bottom of the chart if desired.
This is just a different visual output of the VSA | Volume Spread Analysis indicator available for free under the community indicators tab. You can add that indicator to your chart and see the same output in candle format.
In combination with the Moving Average Cloud, the Volume Spread Analysis will help us determine when to take a trade and in what direction.
The strategy is essentially looking for small reversals going against the overall trend and placing a trade once that reversal ends and the price moves back in the direction of the overall trend.
The 3LS Strategy utilizes confirmation between trend, volume, and price action to place high probability trades.
The VSA is completely customizable by:
Moving Average Length
MA-1 Multiplier
MA-2 Multiplier
MA-3 Multiplier
Check out the VSA | Volume Spread Analysis indicator in the community scripts section under the indicators tab to use this awesome resource on other strategies.
----- Next, we have the option to view the automated KT Bull/Bear Signals -----
Check the boxes to show the buy-sell signal on the chart if desired.
----- Next, we set the risk we want to use if Auto Trading the strategy -----
I always suggest using no more than 1-3% of your total account balance per trade. Remember, if you have multiple strategies triggering per day with each using 1%, the total percent at risk will be much larger.
For Example – if you have 10 strategies each risking 1% your total risk is 10% of your account, not 1%! Be mindful to only use 1-3% of your total account balance across all strategies, not just each individual one.
----- Finally, we backtest our ideas -----
After using the 'Strategy Tester' tab on TradingView to thoroughly backtest your predictions you are ready to take it to the next level - Automated Trading!
This was my whole reason for creating the script. If you work a full-time job, live in a time zone that is hard to trade, or just don't have the patience, this will be a game-changer for you as it was for me.
Auto-Trading
When it comes to auto-trading this strategy I have included two options in the script that utilize the alert messages generated by TradingView.
*Note: Please trade on a demo account until you feel comfortable enough to use real money, and then please stick to 1%-2% of your total account value in risk per trade.*
AutoView
PineConnector
**ATR Auto-Trading Alert Setup**
How to create alerts on 3 Line Strike Strategy
For Trailing Stops:
1) Adjust autoview/pineconnector settings
2) Click "add alert"
3) Select "Condition" = Strategy Name
4) Select "Order Fills Only" from the drop-down
3) Remove template message text from "message" box and place the exact text. '{{strategy.order.alert_message}}'
4) Click "create"
For Fixed Pip Stop:
1) Adjust autoview/pineconnector settings
2) Click "add alert"
3) Select "Condition" = Strategy Name
4) Select "alert() function calls only"
5) I like to title my Alert Name the same thing I named it as an Indicator Template to keep track
Good luck with your trading!

Grid Settings & MMThis script is designed to help you plan your grid trading or when averaging your position in the spot market.
The script has a small error (due to the simplification of the code), it does not take into account the size of the commission.
You can set any values on all parameters on any timeframe, except for the number of orders in the grid (from 2 to 5).
The usage algorithm is quite simple:
1. Connect the script
2. Install a Fibo grid on the chart - optional (settings at the bottom of the description)
3.On the selected pair, determine the HighPrice & LowPrice levels and insert their values
4.Evaluate grid data (levels, estimated profit ’%’, possible profit ‘$’...)
And it's all)
Block of variables for calculating grid and MM parameters
Variables used regularly
--- HighPrice and LowPrice - constant update when changing pairs
--- Deposit - deposit amount - periodically set the actual amount
Variables that do not require permanent changes
--- Grids - set the planned number of grids, default 5
--- Steps - the planned number of orders in the grid, by default 5
--- C_Order - coefficient of increasing the size of orders in the base coin, by default 1.2
--- C_Price - trading levels offset coefficient, default 1.1
--- FirstLevel - location of the first buy level, default 0.5
--- Back_HL - number of candles back, default 150
*** For C_Order and C_Price variables, the value 1 means the same order size and the same distance between buy levels.
The fibo grid is used for visualization, you can do without it, ! it is not tied to the script code !
You can calculate the levels of the Fibo grid using the formula:
(level price - minimum price) / (maximum price - minimum price)
For default values, grid levels are as follows:
1 ... 0.5
2...0.359
3 ... 0.211
4...0.0564
5...-0.1043
Short description:
in the upper right corner
--- indicator of the price movement for the last 150 candles, in % !!! there is no task here to "catch" the peak values - only a relative estimate.
in the upper left corner
--- total amount of the deposit
--- the planned number of grids
--- “cost” of one grid
--- the size of the estimated profit depending on the specified HighPrice & LowPrice
in the lower left corner
--- Buy - price levels for buy orders
--- Amount - the number of purchased coins in the corresponding order
--- Sell - levels of profit taking by the sum of market orders in the grid
--- $$$ - the sum of all orders in the grid, taking into account the last active order
--- TP - profit amount by the amount of orders in the grid

ATR MultiplierOVERVIEW
The Average True Range Multiplier (ATRX) is a simple technical indicator that takes the value of the ATR indicator and multiplies it by a user-specified amount.
CONCEPTS
This indicator is primarily used to set key levels based on historical volatility. The ATR indicator alone measures the historical volatility of the selected instrument, this indicator just multiplies that value to save the hassle of doing that yourself.

Sherry on Crypto - MACD ScalpingThis indicator is originally made by someone else, I just modified it to increase its win rate.
How to use this indicator?
Step 1: This indicator only works in 5 minutes timeframe (BTC) . Apply 5 minutes timeframe in Tradingview.
Step 2: Apply 2 EMA(s), 1st EMA length 50, 2nd EMA length 200.
Step 3: Draw support and resistance and understand price action as well.
Step 4: Use RSI along with this indicator.
Strategy: When you see a down tick on the MACD in 5 minutes timeframe,
you are allow to take a long position. When you see an up tick on the MACD in 5 minutes timeframe, you are allow to take a Short position,
but RSI should be Included (you can do your own settings of RSI).
Recommended TP 0.50 and SL 0.40.

Actieve Inversiones EMABBOL by EDOHEN
EMABBOL includes these indicators:
- triple emas (9,21,50)
- Bollinger Bands
- Also includes buying or selling signals
The following strategy is based on ema crosses and bollinger ma crosses, the Bollinger band gives us the target we could expect from our trades, using the upper and lower bands.
Trading criteria
Buy : Price crosses over the triple emas and also crosses under the Bollinger band ema. Looking for 3:1 PnL
Sell : Price crosses under the triple emas and also crosses under the Bollinger band ema. Looking for 3:1 PnL
Stop Loss Tips : set the SL above the crosses if Selling, below the crosses if buying
Take Profit Tips : set the TP below the Bollinger's lower Band band if Selling, or above the Bollinger's upper Band band if Buying

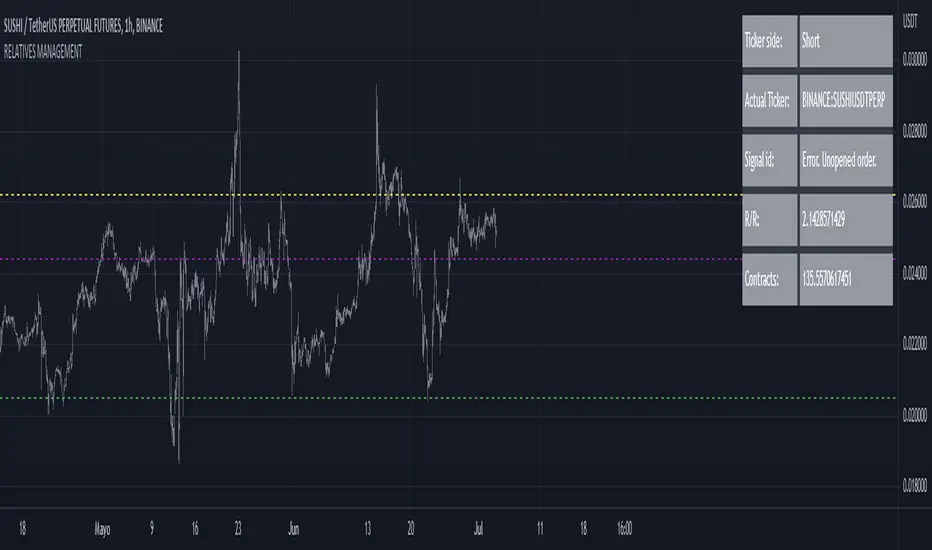
RELATIVE VALUE TRADE MANAGEMENT WEBHOOKThis script it's created to send open-close signals via webhook. It allows you to open a relative value position based in the relative graph. You can set the TP and SL levels and the script will send the signal to your exchange.
Due a pine limitations it is necessary apply the script in the 2 different actives and set the alerts. You can just do the relative analysis and then go to the first asset and set the script. Create your alert and then just go to the other asset and create the alert. It doesn't necessary to change anything in the script because the levels are the same.
It is also possible to do the analysis using the script, deploying the relative graph, but could be annoying sometimes due scales.
Positions will be placed at close always.
THIS IS IMPORTANT: I use Zignaly as a exhange so if you are using Binance or other YOU MUST CHANGE the code. If you know the JSON format that It requires would be easy.
Here is tips in all the important imputs. But let me explain the most important.
The MANDATORY fields are:
Ticker IDs: Here you must write the EXACT ID code for the active. Caps included.
Example : BINANCE:SUSHIUSDTPERP
It is also important select the correct market side. If you want to be long of ANY active you must write that ID in the LONG ID. For short positions is the same.
Time frame: Here you can select the time frame of the graph (not the current active graph, I mean the relative one.) The orders will be send using that time frame. I recommend to do the analysis in other window and then use the script to trigger the order in the time frame that you want.
Money management: In these fields you can select the qty that you will lose if the SL level is reach. Based in a determinated amount of currency or in a % of your capital.
Dates: It is important to select the start date. If the order is already open, we must look for the moment where the activation price was reached. If the order is unopened it is better to select the current date, so the order will be triggered when the entry level is reached.
Ids: If you have current open position you can set here that ID to send the correct order to the exchange.
To set the alert just call the function {{{strategy.order.alert_message}}}
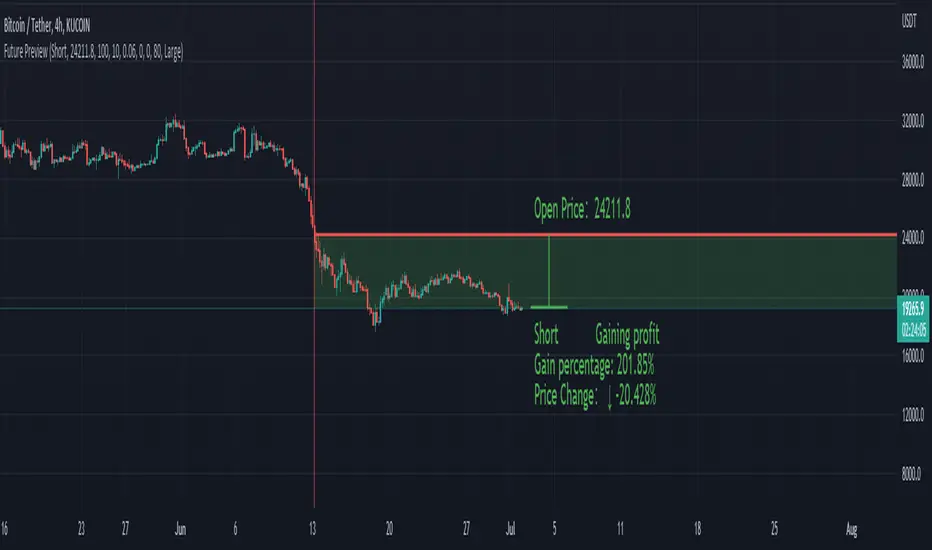
Future PreviewFuture Preview
Calculate real-time future order profit with open price, leverage and commission fee. Simple and straight forward. If you need any additional feature, please leave a comment below. I am glad to help.
Usage:
When adding Future Preview to chart, it will ask order open time and open price on the chart by clicking with left mouse on the desired value. These value can be changed lately, as well as the leverage and commission fee. Default leverage is 10 and default commission fee is 0.06% (taker).
There will be two horizontal lines. The solid longer line is the open price line, it shows the order open price. The shorter line moving with real-time price is the current price line, it shows the current price. There will be preview data shows on top or below the price line. Open price line is red for short order and green for long order. The current price line is red when the order is losing and it is green when it profiting. The back ground color follows the color of current price line. Background color transparency and gain/loss color can be changed in options.
There will be one horizontal line on the left if the option of showing open time is on (default is on). It shows the time stamp when current order opened.
After adding Future Preview to chart, there is option to add Taking Profit(TP) or Stop Loss(SL) to the chart.
Font size can be changed in option
Joker Trailing TP BotTrailing Take Profit is used by the traders to increase their gains when the prices moves in a favorable direction. Let’s have a look at what is Trailing Take Profit and how it works.
What Is a Trailing Take Profit?
Trailing Take Profit is a term largely used in crypto, whereas you may encounter the term Trailing Stop in traditional trading describing almost the same thing, So what’s the difference between Trailing Take Profit and Trailing Stop? Trailing Stop is a type of Stop Loss automatically moving in the same direction as the asset’s price. Trailing Take Profit is nothing else than Trailing Stop activated after initial Take Profit is reached.
The main difference between these two is that Trailing Take Profit takes the profit in any case (altough it might be later annihilated by Trailing Stop). Thus, Trailing Take Profit reduces the risks that might’ve occurred using Trailing Stop alone. Trailing Take Profit is bound to the maximum of Take Profit price instead of just a price increase/decrease.
As you might notice, the terms Trailing Take Profit and Stop Loss are quite similar. To avoid confusion, in this article we will be talking about Trailing Take Profit as defined above.
Trailing Take Profit only moves in one direction. It is designed to lock in profit and limit losses. The trailing profit only moves up (in case of a long strategy) once the price has surpassed previous high and a new high has been established. If the trailing take profit moves up, it cannot move back down, thus securing the profit and preventing losses.
Trailing Take Profit allows the trade to remain open and continue to profit as long as the price is moving in the investor’s favor. If the price changes direction and the change surpasses the previously set percentage the order will be closed.
How Does it Work?
For example if you buy BTC at the price of 10000, if you set a Take Profit at 11000 and a Trailing Take Profit at 5% :
If the price goes up to 10500, nothing happens because the Take Profit at 11000 has not been reached.
Then if the BTC price goes up top 11000, a Stop Order at 10450 will be set.
Then if the BTC price goes down to 10500, the Stop Order stays at 104500.
Then if the BTC price goes up to 12000, the Stop Order moves to 11400.
Then if the BTC price goes down to 11000, the Stop Order at 11400 is executed.
You see that without Trailing Take Profit, the buy order would have been sold at 11000. Thus, a trader would miss an earning opportunity at 11400.

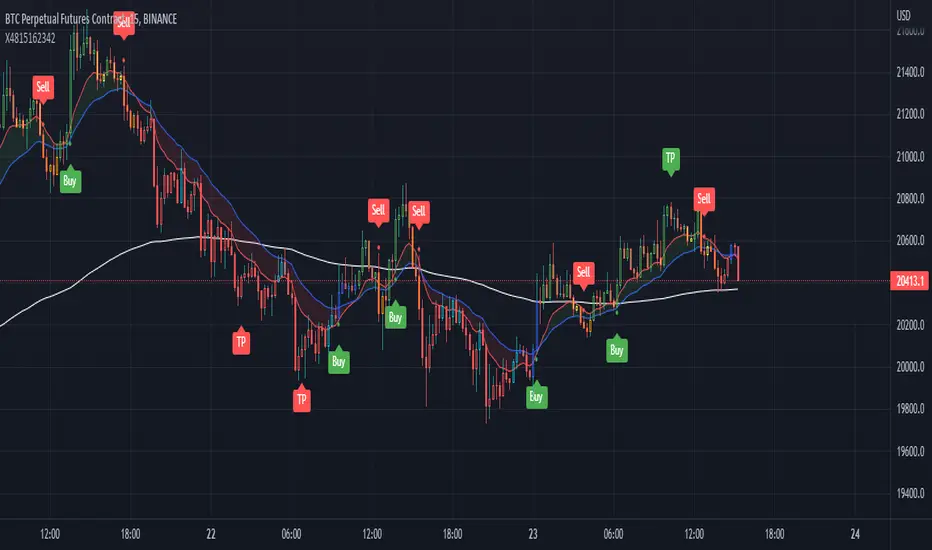
Super Combo TF15 Perfect (CDC+SuperTrend+ATR+EMA) by X4815162342Thank you for opensource code script
this script mix 4 indicator
1.ATR
2.SuperTrend
3.EMA 175 or 200
4.CDC Actionzone by piriya33
this great for TF 15 min Future and Spot
How to Use
------- Future ------
Short and Long by Buy and Sell Ribbon
You can take profit when see TP ribbon or SL when trend change
------- Spot --------
Green Candle Sign is Buy
Red Candle Sign is Sell
Time Anchored Intraday High/Low TrendlineOftentimes, intraday trendlines that are started at specific times, e.g. 8:00am or market open 9:30am, are well respected throughout the trading day.
This indicator draws up tp 3 intraday trendlines that are anchored at user defined times, respectively at the corresponding candle's high and low points.
From there, the line*s xy2 are connected in a way that all following candles are enclosed.
Zero Lag Detrended Price Oscillator (ZL DPO)This indicator attempts to create a zero lag Detrended price oscillator using 2 different scripts. I actually really like the results so far. I hope you all find it useful too.
Green>Red = long
Red>Green = short
The lines on the example chart are some of the signals that the indicator gave on default settings.
The greens are wins, reds are outright losses, and blues are "scratch" trades(signal for other side before hitting stop loss).
All of the signals tested were using NNFX money management to see if they are wins or losses(1.5x atr for SL and 1 Atr for TP).

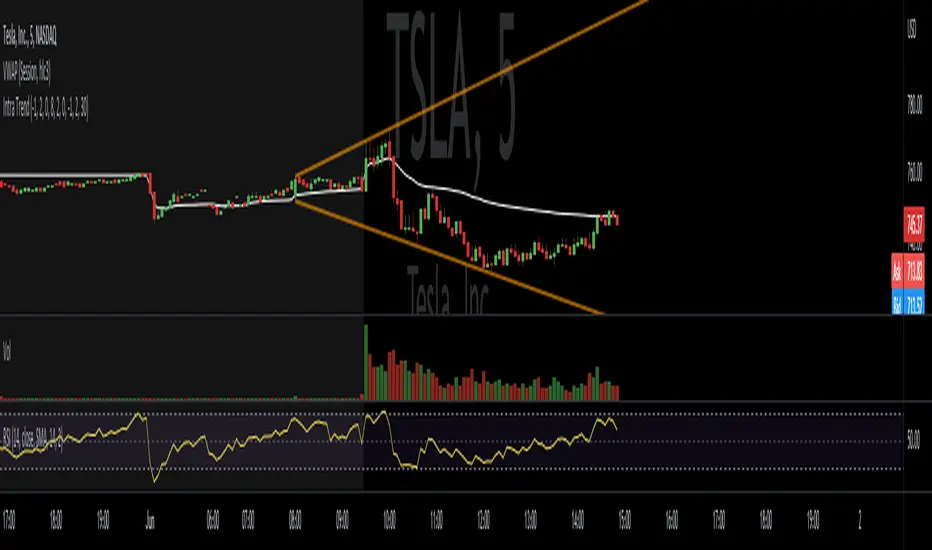
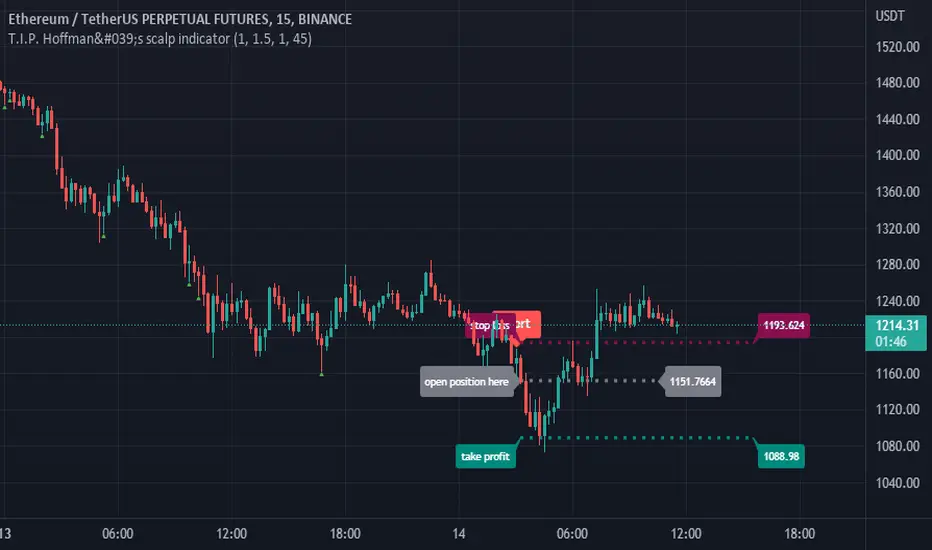
T.I.P. Hoffman's scalp indicatorThis script is based on Rob Hoffman's trading strategy. I do my best to implement and cover all necessary parts for the complete strategy, including multiple moving averages and Hoffman's retracement strategy according to bars (45%).
Difference that I do on my own is that my script follow the trend, based on SMA50, so script will not give you Long signals, including bar retracement signals, if price is not above the SMA50, while for Short signal is opposite rule. Long/Short signal will always show only in case if complete bar is away of SMA5, which means completely above for Long, or completely below SMA5 for Short. In that case SL will be on SMA5.
There is two ways to control take profit and stop loss lines, one with auto calculated - according to SMA5, and the other way is to put your desired % for SL and TP. First-Auto way is always calculate % differences between open position and SMA5, so in that case position of SMA5 will be SL while TP will be in size 1:1.5 .
I hope this script means something to someone. If there is some more tips-ways to improve it do not hesitate to contact me.
Best Regards to All of You!
SuperIchi StrategyTRADE CONDITIONS
Long entry:
Tenkan-Sen is above Kijun-Sen (blue line above red line)
Price closes above both Tenkan-Sen and Kijun-Sen (price closes above both blue and red lines)
Tenkan-Sen and Kijun-Sen is above Senkou Span (both blue and red lines are above cloud)
Senkou Span is green (cloud is green)
Price pulled back and closed below both Tenkan-Sen and Kijun-Sen within last X (configurable in settings) candles (price pulled back below blue and red lines)
Short entry:
Tenkan-Sen is below Kijun-Sen (blue line below red line)
Price closes below both Tenkan-Sen and Kijun-Sen (price closes below both blue and red lines)
Tenkan-Sen and Kijun-Sen is below Senkou Span (both blue and red lines are below cloud)
Senkou Span is red (cloud is red)
Price pulled back and closed above both Tenkan-Sen and Kijun-Sen within last X (configurable in settings) candles (price pulled back above blue and red lines)
Risk management:
Each trade risks 2% of account (configurable in settings)
SL size determined by swing low/high of previous X candles (configurable in settings) or using the ATR override (configurable in settings) where the max of swing high/low or ATR value will be used to calculate SL
TP is calculated by Risk:Reward ratio (configurable in settings)
TIPS
Timeframe: I have found best results running on anything 5M and above
CREDITS
SuperIchi by LuxAlgo
