Classic Wave: The Easy WayClassic Wave is a simple strategy with few rules and no over-optimization. Despite its simplicity, it is backed by a nearly century-long historical track record, delivering excellent returns on the weekly chart of the SPX (TVC).
I also recommend observing its strong performance on the SPY (weekly), which is the perfect instrument for executing this strategy with futures in the future.
Strategy Rules and Parameters
When a bullish candle closes above the 20-period EMA, we place the stop-loss below the low of that candle and target a risk-reward ratio of 1:1.
A second, more profitable variant is to change the risk-reward ratio in the code to 2:1.
-Total capital: $10,000
-We use 10% of the total capital per trade.
-Commissions: 0.1% per trade.
The code construction is simple and very well detailed within the script itself.
Risk-Reward Ratio 2:1
Using a 2:1 risk-reward ratio reduces the win rate but significantly increases profitability.
Across the full historical data of the SPX index (weekly), the system would have generated 236 trades, with a win rate of 51.27% and a profit factor of 2.53.
From January 1, 2023, to November 28, 2025, the system would have generated 5 trades, with an 80% win rate and a profit factor of 9.244.
What makes this system so good?
-It takes advantage of the long-term bullish bias of U.S. stock indices and traditional markets.
-It filters out a lot of noise thanks to the weekly timeframe.
-It uses simple parameters with no over-optimization.
Final Notes:
This strategy has consistently outperformed the returns offered by most traditional funds over time, with fewer drawdowns and significantly less stress. I hope you like it.
Cari dalam skrip untuk "track"

EMA 12-26-100 Momentum Strategy# Triple EMA Multi-Signal Momentum Strategy
## 📊 Overview
**Triple EMA Multi-Signal** is a comprehensive trend-following momentum strategy designed specifically for cryptocurrency markets. It combines multiple technical indicators and signal types to identify high-probability trading opportunities while maintaining strict risk management protocols.
The strategy excels in trending markets and uses adaptive position sizing with trailing stops to maximize profits during strong trends while protecting capital during choppy conditions.
## 🎯 Core Algorithm
### Triple EMA System
The strategy employs a three-layer EMA system to identify trend direction and strength:
- **Fast EMA (12)**: Quick response to price changes
- **Slow EMA (26)**: Confirmation of trend direction
- **Trend EMA (100)**: Overall market bias filter
Trades are only taken when all three EMAs align in the same direction, ensuring we trade with the dominant trend.
### Multi-Signal Confirmation (8 Signal Types)
The strategy requires at least 1-2 confirmed signals from multiple independent sources before entering a position:
1. **EMA Crossover** - Fast EMA crossing Slow EMA (primary signal)
2. **MACD Cross** - MACD line crossing signal line (momentum confirmation)
3. **RSI Reversal** - RSI bouncing from oversold/overbought zones
4. **Price Action** - Strong bullish/bearish candles (>60% of range)
5. **Volume Spike** - Above-average volume confirmation
6. **Breakout** - Price breaking 20-period high/low with volume
7. **Pullback to EMA** - Trend continuation after healthy retracement
8. **Bollinger Bounce** - Price bouncing from BB bands
This multi-signal approach significantly reduces false signals and improves win rate.
## 💰 Risk Management
### Position Sizing
- Default: 20-25% of equity per trade
- Adjustable based on risk tolerance
- Smaller positions recommended for leveraged trading
### Stop Loss & Take Profit
- **Stop Loss**: 2.0% (tight control of risk)
- **Take Profit**: 5.5% (2.75:1 reward-to-risk ratio)
- Both levels are fixed at entry to avoid emotional decisions
### Trailing Stop System
- Activates after 1.8% profit
- Trails at 1.3% below current price
- Locks in profits during extended trends
- Automatically adjusts as price moves in your favor
### Maximum Hold Time
- 36-48 hours maximum (configurable)
- Designed to minimize funding rate costs on futures
- Forces position closure to avoid excessive exposure
- Helps maintain capital velocity
## 📈 Key Features
### Trend Filters
- **ADX Filter**: Ensures sufficient trend strength (threshold: 20)
- **EMA Alignment**: All three EMAs must confirm trend direction
- **RSI Boundaries**: Avoids extreme overbought/oversold entries
### Volume Analysis
- Volume must exceed 20-period moving average
- Configurable multiplier (default: 1.0x)
- Helps identify institutional participation
### Automatic Exit Conditions
1. Take Profit target reached
2. Stop Loss triggered
3. Trailing stop activated
4. Trend reversal (EMA cross in opposite direction)
5. Maximum hold time exceeded
## 🎮 Recommended Settings
### For Spot Trading (Conservative)
```
Position Size: 15-20%
Stop Loss: 2.5%
Take Profit: 6.0%
Max Hold: 72 hours
Leverage: 1x
```
### For Futures 3-5x Leverage (Balanced)
```
Position Size: 12-15%
Stop Loss: 2.0%
Take Profit: 5.5%
Max Hold: 36 hours
Trailing: Active
```
### For Aggressive Trading 5-10x (High Risk)
```
Position Size: 8-12%
Stop Loss: 1.5%
Take Profit: 4.5%
Max Hold: 24 hours
ADX Filter: Disabled
```
## 📊 Performance Metrics
### Backtested Results (BTC/USDT 1H, 2 years)
- **Total Return**: ~19% (spot) / ~75% (5x leverage)*
- **Total Trades**: 240-300
- **Win Rate**: 49-52%
- **Profit Factor**: 1.25-1.50
- **Max Drawdown**: ~18-22%
- **Average Trade**: 0.5-3 days
*Leverage results exclude funding rates and real-world slippage
### Optimal Timeframes
- **1 Hour**: Best for active trading (recommended)
- **4 Hour**: More stable, fewer signals
- **15 Min**: High frequency (requires monitoring)
### Best Performing Assets
- BTC/USDT (most tested)
- ETH/USDT
- Major altcoins with good liquidity
- Not recommended for low-cap or illiquid pairs
## ⚙️ How to Use
1. **Add to Chart**: Apply strategy to 1H BTC/USDT chart
2. **Adjust Settings**: Configure risk parameters based on your preference
3. **Review Signals**: Green = Long, Red = Short, labels show signal count
4. **Monitor Performance**: Check strategy tester for detailed statistics
5. **Optimize**: Use strategy optimization to find best parameters for your market
## 🎨 Visual Indicators
The strategy provides clear visual feedback:
- **EMA Lines**: Blue (Fast), Red (Slow), Orange (Trend)
- **BUY/SELL Labels**: Show entry points with signal count
- **Stop/Target Lines**: Red (SL), Green (TP) displayed during active trades
- **Background Color**: Light green (long), light red (short) when in position
- **Info Panel**: Shows current trend, RSI, ADX, and volume status
## ⚠️ Important Notes
### Risk Disclaimer
- This strategy is for educational purposes only
- Past performance does not guarantee future results
- Cryptocurrency trading involves substantial risk
- Only trade with capital you can afford to lose
- Always use proper position sizing and risk management
### Limitations
- Performs poorly in sideways/choppy markets
- Requires sufficient liquidity for best execution
- Backtests do not include:
- Real-world slippage (especially during volatility)
- Funding rates (for perpetual futures)
- Exchange downtime or connection issues
- Emotional trading decisions
### For Futures Trading
If using this strategy on futures with leverage:
- Reduce position size proportionally to leverage
- Account for funding rates (~0.01% per 8h)
- Set max hold time to minimize funding costs
- Use lower leverage (3-5x max recommended)
- Monitor liquidation price carefully
## 🔧 Customization
All parameters are fully customizable:
- EMA periods (fast/slow/trend)
- MACD settings (12/26/9)
- RSI levels (30/70)
- Stop Loss / Take Profit percentages
- Trailing stop activation and offset
- Volume multiplier
- ADX threshold
- Maximum hold time
## 📚 Strategy Logic
The strategy follows this decision tree:
```
1. Check Trend Direction (EMA alignment)
↓
2. Scan for Entry Signals (8 types)
↓
3. Confirm with Filters (ADX, Volume, RSI)
↓
4. Enter Position with Fixed SL/TP
↓
5. Monitor for Exit Conditions:
- TP Hit → Close with profit
- SL Hit → Close with loss
- Trailing Active → Follow price
- Trend Reversal → Close position
- Max Time → Force close
```
## 🎓 Best Practices
1. **Start Conservative**: Use smaller position sizes initially
2. **Track Performance**: Monitor actual vs backtested results
3. **Optimize Regularly**: Market conditions change, adapt parameters
4. **Combine with Analysis**: Don't rely solely on automated signals
5. **Manage Emotions**: Stick to the system, avoid manual overrides
6. **Paper Trade First**: Test on demo before risking real capital
## 📞 Support & Updates
This strategy is actively maintained and updated based on:
- Market condition changes
- User feedback and suggestions
- Performance optimization
- Bug fixes and improvements
## 🏆 Conclusion
Triple EMA Multi-Signal Strategy offers a robust, systematic approach to cryptocurrency trading by combining trend following, momentum indicators, and strict risk management. Its multi-signal confirmation system helps filter false signals while the trailing stop mechanism captures extended trends.
The strategy is suitable for both manual traders looking for high-probability setups and algorithmic traders seeking a proven systematic approach.
**Remember**: No strategy wins 100% of the time. Success comes from consistent application, proper risk management, and continuous adaptation to changing market conditions.
---
*Version: 1.0*
*Last Updated: November 2025*
*Tested on: BTC/USDT, ETH/USDT (1H, 4H timeframes)*
*Recommended Capital: $5,000+ for optimal position sizing*

黃金5KCompelling Sales Description:
Unlock the Treasure of Consistent Profits!
Want to know where the market's hidden opportunities lie?
Go find them—with our powerful RSI + BB + Channel Automated Trading Strategy!
Tired of guessing when to enter or exit trades? Let our advanced algorithm do the heavy lifting for you. This strategy seamlessly combines:
RSI (Relative Strength Index) to identify overbought or oversold conditions.
Bollinger Bands (BB) to track volatility and pinpoint potential breakouts.
Channel Trading to capitalize on trending markets and price boundaries.
Fully automated, this system executes trades with precision, eliminating emotional decisions and saving you time. Whether you're a beginner or an experienced trader, this strategy adapts to market shifts to help you stay ahead.
Don't just chase profits—unlock the treasure of disciplined, data-driven trading.
Ready to transform your trading journey?
Contact us for details at: kbocc123@gmail.com
Seize the strategy. Secure your success. 🚀
Larry Williams Bonus Track PatternThis strategy trades the day immediately following an Inside Day, under specific directional and timing conditions. It is designed for daily-based setups but executed on intraday charts to ensure orders are placed exactly at the open of the following day, rather than at the daily bar close.
Entry Conditions
Only trades on Monday, Thursday, or Friday.
The previous day must be an Inside Day (its high is lower than the prior high and its low is higher than the prior low).
The bar before the Inside Day must be bullish (close > open).
On the following day (t):
The daily open must be below both the Inside Day’s high and the highest high of the two days before that.
A buy stop is placed at the highest high of the three previous days (Inside Day and the two days before it).
If the new day’s open is already above that level (gap up), the strategy enters long immediately at the open.
Exit Rules
Stop Loss: Fixed, defined in points or percentage (user input).
FPO (First Profitable Open): the position is closed at the first daily open after the entry day where the open price is above the average entry price (the first profitable open).
Notes
The script must be applied on an intraday timeframe (e.g., 15-minute or 1-hour) so that the strategy can:
Detect the Inside Day pattern using daily data (request.security).
Execute orders in real time at the next day’s open.
Running it directly on the daily timeframe will delay executions by one bar due to Pine Script’s evaluation model.

Diabolos Long What the strategy tries to do
It looks for RSI dips into oversold, then waits for RSI to recover above a chosen level before placing a limit buy slightly below the current price. If the limit doesn’t fill within a few bars, it cancels it. Once in a trade, it sets a fixed take-profit and stop-loss. It can pyramid up to 3 entries.
Step-by-step
1) Inputs you control
RSI Length (rsiLen), Oversold level (rsiOS), and a re-entry threshold (rsiEntryLevel) you want RSI to reach after oversold.
Entry offset % (entryOffset): how far below the current close to place your limit buy.
Cancel after N bars (cancelAfterBars): if still not filled after this many bars, the limit order is canceled.
Risk & compounding knobs: initialRisk (% of equity for first order), compoundRate (% to artificially grow the equity base after each signal), plus fixed TP% and SL%.
2) RSI logic (arming the setup)
It calculates rsi = ta.rsi(close, rsiLen).
If RSI falls below rsiOS, it sets a flag inOversold := true (this “arms” the next potential long).
A long signal (longCondition) happens only when:
inOversold is true (we were oversold),
RSI comes back above rsiOS,
and RSI is at least rsiEntryLevel.
So: dip into OS → recover above OS and to your threshold → signal fires.
3) Placing the entry order
When longCondition is true:
It computes a limit price: close * (1 - entryOffset/100) (i.e., below the current bar’s close).
It sizes the order as positionRisk / close, where:
positionRisk starts as accountEquity * (initialRisk/100).
accountEquity was set once at script start to strategy.equity.
It places a limit long: strategy.order("Long Entry", strategy.long, qty=..., limit=limitPrice).
It then resets inOversold := false (disarms until RSI goes oversold again).
It remembers the bar index (orderBarIndex := bar_index) so it can cancel later if unfilled.
Important nuance about “compounding” here
After signaling, it does:
compoundedEquity := compoundedEquity * (1 + compoundRate/100)
positionRisk := compoundedEquity * (initialRisk/100)
This means your future order sizes grow by a fixed compound rate every time a signal occurs, regardless of whether previous trades won or lost. It’s not tied to actual PnL; it’s an artificial growth curve. Also, accountEquity was captured only once at start, so it doesn’t automatically track live equity changes.
4) Auto-cancel the limit if it doesn’t fill
On each bar, if bar_index - orderBarIndex >= cancelAfterBars, it does strategy.cancel("Long Entry") and clears orderBarIndex.
If the order already filled, cancel does nothing (there’s nothing pending with that id).
Behavioral consequence: Because you set inOversold := false at signal time (not on fill), if a limit order never fills and later gets canceled, the strategy will not fire a new entry until RSI goes below oversold again to re-arm.
5) Managing the open position
If strategy.position_size > 0, it reads the avg entry price, then sets:
takeProfitPrice = avgEntryPrice * (1 + exitGainPercentage/100)
stopLossPrice = avgEntryPrice * (1 - stopLossPercentage/100)
It places a combined exit:
strategy.exit("TP / SL", from_entry="Long Entry", limit=takeProfitPrice, stop=stopLossPrice)
With pyramiding=3, multiple fills can stack into one net long position. Using the same from_entry id ties the TP/SL to that logical entry group (not per-layer). That’s OK in TradingView (it will manage TP/SL for the position), but you don’t get per-layer TP/SL.
6) Visuals & alerts
It plots a green triangle under the bar when the long signal condition occurs.
It exposes an alert you can hook to: “Покупка при достижении уровня”.
A quick example timeline
RSI drops below rsiOS → inOversold = true (armed).
RSI rises back above rsiOS and reaches rsiEntryLevel → signal.
Strategy places a limit buy a bit below current price.
4a) If price dips to fill within cancelAfterBars, you’re long. TP/SL are set as fixed % from avg entry.
4b) If price doesn’t dip enough, after N bars the limit is canceled. The system won’t re-try until RSI becomes oversold again.
Key quirks to be aware of
Risk sizing isn’t PnL-aware. accountEquity is frozen at start, and compoundedEquity grows on every signal, not on wins. So size doesn’t reflect real equity changes unless you rewrite it to use strategy.equity each time and (optionally) size by stop distance.
Disarm on signal, not on fill. If a limit order goes stale and is canceled, the system won’t try again unless RSI re-enters oversold. That’s intentional but can reduce fills.
Single TP/SL id for pyramiding. Works, but you can’t manage each add-on with different exits.

Triple Quad Frosty v4.5Triple Quad Frosty v4.5 is a Renko-friendly strategy that lets you trade from up to four signal sources per side. Orders are only placed when your chosen conditional filters (A/B/C) agree, giving you full control over when entries are valid. You decide how signals must line up — from simple single-source triggers to majority or full agreement across all four.
Renko-based, with customizable static stops, take profits, and trailing stops. Time/day filters, daily trade limits, and forced closures let you restrict trading to specific windows.
The HTF filters in Triple Quad Frosty v4.5 use a higher-timeframe Hull Moving Average (HMA) to confirm trend direction, while slope and distance settings on the local HMA help filter out weak or choppy setups. Longs only trigger when price is above the HTF HMA and meets slope/distance requirements, and shorts only when the opposite is true.
Color-coded labels mark each exit as a win or loss, with reversal trades labeled separately for clarity. Conditional bars plotted above and below the chart show when the A/B/C filters align on a long or short bias, giving clear visual confirmation of entry conditions. Stop loss and take profit levels are plotted directly on the chart with guide lines, so you can easily track active trade management in real time.

Tristan's Box: Pre-Market Range Breakout + RetestMarket Context:
This is designed for U.S. stocks, focusing on pre-market price action (4:00–9:30 AM ET) to identify key support/resistance levels before the regular session opens.
Built for 1 min and 5 min timelines, and is intended for day trading / scalping.
Core Idea:
Pre-market range (high/low) often acts as a magnet for price during regular hours.
The first breakout outside this range signals potential strong momentum in that direction.
Retest of the breakout level confirms whether the breakout is valid, avoiding false moves.
Step-by-Step Logic:
Pre-Market Range Identification:
Track high and low from 4:00–9:30 AM ET.
Draw a box spanning this range for visual reference and calculation.
Breakout Detection:
When the first candle closes above the pre-market high → long breakout.
When the first candle closes below the pre-market low → short breakout.
The first breakout candle is highlighted with a “YOLO” label for visual confirmation.
Retest Confirmation:
Identify the first candle whose wick touches the pre-market box (high touches top for short, low touches bottom for long).
Wait for the next candle: if it closes outside the box, it confirms the breakout.
Entry Execution:
Long entry: on the confirming candle after a wick-touch above the pre-market high.
Short entry: on the confirming candle after a wick-touch below the pre-market low.
Only the first valid entry per direction per day is taken.
Visuals & Alerts:
Box represents pre-market high/low.
Top/bottom box border lines show the pre-market high / low levels cleanly.
BUY/SELL markers are pinned to the confirming candle.
Added a "YOLO" marker on breakout candle.
Alert conditions trigger when a breakout is confirmed by the retest.
Strategy Type:
Momentum breakout strategy with confirmation retest.
Combines pre-market structure and risk-managed entries.
Designed to filter false breakouts by requiring confirmation on the candle after the wick-touch.
In short, it’s a pre-market breakout momentum strategy: it uses the pre-market high/low as reference, waits for a breakout, and then enters only after a confirmation retest, reducing the chance of entering on a false spike.
Always use good risk management.

Imbalance RSI Divergence Strategy# Imbalance RSI Divergence Strategy - User Guide
## What is This Strategy?
This strategy identifies **imbalance** zones in the market and combines them with **RSI divergence** to generate trading signals. It aims to capitalize on price gaps left by institutional investors and large volume movements.
### Main Settings
- **RSI Period (14)**: Period used for RSI calculation. Lower values = more sensitive, higher values = more stable signals.
- **ATR Period (10)**: Period for volatility measurement using Average True Range.
- **ATR Stop Loss Multiplier (2.0)**: How many ATR units to use for stop loss calculation.
- **Risk:Reward Ratio (4.0)**: Risk-reward ratio. 2.0 = 2 units of reward for 1 unit of risk.
- **Use RSI Divergence Filter (true)**: Enables/disables the RSI divergence filter.
### Imbalance Filters
- **Minimum Imbalance Size (ATR) (0.3)**: Minimum imbalance size in ATR units to filter out small imbalances.
- **Enable Lookback Limit (false)**: Activates historical lookback limitations.
- **Maximum Lookback Bars (300)**: Maximum number of bars to look back.
### Visual Settings
- **Show Imbalance Size**: Displays imbalance size in ATR units.
- **Show RSI Divergence Lines**: Shows/hides divergence lines.
- **Divergence Line Colors**: Colors for bullish/bearish divergence lines.
### Volatility-Based Adjustments
- **Low volatility markets**:
- Minimum Imbalance Size: 0.2-0.4 ATR
- ATR Stop Loss Multiplier: 1.5-2.0
- **High volatility markets**:
- Minimum Imbalance Size: 0.5-1.0 ATR
- ATR Stop Loss Multiplier: 2.5-3.5
### Risk Tolerance
- **Conservative approach**:
- Risk:Reward Ratio: 2.0-3.0
- RSI Divergence Filter: Enabled
- Minimum Imbalance Size: Higher (0.5+ ATR)
- **Aggressive approach**:
- Risk:Reward Ratio: 4.0-6.0
- Minimum Imbalance Size: Lower (0.2-0.3 ATR)
###Market Conditions
- **Trending markets**: Higher RSI Period (21-28)
- **Sideways markets**: Lower RSI Period (10-14)
- **Volatile markets**: Higher ATR Multiplier
## Recommended Testing Procedure
1. **Start with default settings** and backtest on 3-6 months of historical data
2. **Adjust RSI Period** to see which value produces better results
3. **Optimize ATR Multiplier** for stop loss levels
4. **Test different Risk:Reward ratios** comparatively
5. **Fine-tune Minimum Imbalance Size** to improve signal quality
## Important Considerations
- **False positive signals**: Imbalances may be less reliable during low volatility periods
- **Market openings**: First hours often produce more imbalances but can be riskier
- **News events**: Consider disabling strategy during major news releases
- **Backtesting**: Test across different market conditions (trending, sideways, volatile)
## Recommended Settings for Beginners
**Safe settings for new users:**
- RSI Period: 14
- ATR Period: 14
- ATR Stop Loss Multiplier: 2.5
- Risk:Reward Ratio: 3.0
- Minimum Imbalance Size: 0.5 ATR
- RSI Divergence Filter: Enabled
## Advanced Tips
### Signal Quality Improvement
- **Combine with market structure**: Look for imbalances near key support/resistance levels
- **Volume confirmation**: Higher volume during imbalance formation increases reliability
- **Multiple timeframe analysis**: Confirm signals on higher timeframes
### Risk Management
- **Position sizing**: Never risk more than 1-2% of account per trade
- **Maximum drawdown**: Set overall stop loss for the strategy
- **Market hours**: Consider avoiding low liquidity periods
### Performance Monitoring
- **Win rate**: Track percentage of profitable trades
- **Average R:R**: Monitor actual risk-reward achieved vs. target
- **Maximum consecutive losses**: Set alerts for strategy review
This strategy works best when combined with proper risk management and market analysis. Always backtest thoroughly before using real money and adjust parameters based on your specific market and trading style.

MarketTouch Pro – BankNifty & Nifty Toolkit🛍️ MarketTouch Pro – BankNifty & Nifty Toolkit
🎯 Perfect entries start with precision.
MarketTouch Pro is an advanced TradingView indicator designed for serious intraday traders in BankNifty and Nifty. This all-in-one toolkit combines dynamic pivot detection, VWAP/EMA analysis, candlestick pattern signals, and OI-based support/resistance – all optimized with custom touch detection, alerts, and time filters.
Whether you're scalping breakouts or catching reversals, MarketTouch Pro gives you clean levels, smart confirmations, and actionable alerts – before the move happens.
🔍 Key Features
🔸 VWAP + Dual EMA System
Track real-time momentum with optional VWAP and two customizable EMAs (ideal for 9/21 settings).
🔸 Dynamic Pivot System with Touch Logic
Auto-detect price interaction with Pivot, R1–R5, and S1–S5 zones. Includes breakout, reversal, and extreme touch-only filters.
🔸 OHLC + OI Level Lines (Manual & Auto)
Use previous session highs/lows or define your own manual support/resistance. Plus, add Open Interest levels as actionable zones.
🔸 Smart Candlestick Signals
Get alerts on classic price action patterns like:
Bullish/Bearish Engulfing
Hammer & Inverted Hammer
Bullish/Bearish Harami
🔸 Touch-Only Pattern Filtering
Avoid noisy signals – only see patterns when they happen near key levels.
🔸 Time Filtered Zones
Limit plots/signals to specific market hours or sessions for intraday clarity.
🔸 BankNifty & Nifty Auto Detection
No need to switch settings – script intelligently adapts to symbol.
🔸 Clean UI with Modular Toggles
Control every component: show/hide pivots, levels, patterns, and labels with ease.
🔸 In-Built Alerts Ready
Supports:
Pivot breakout / touch
OHLC interaction
OI level signals
Candlestick confirmations near levels
💼 Who is it for?
📉 Scalpers & Intraday Traders
💡 Price Action & Level-Based Traders
🧠 Algo Strategists building rule-based entries/exits
🛡️ Traders using VWAP / Pivots / OI confluence
📦 What's Included?
Setup guide + usage examples
Personal support for activation & onboarding

200 SMA (5%/-3% Buffer) for SPY & QQQ In my testing TQQQ is an absolute monster of an ETF that performs extremely well even from a buy and hold standpoint over long periods of time, its largest drawback is the massive drawdown exposure that it faces which can be easily sidestepped with this strategy.
This strategy is meant to basically abuse TQQQ's insane outperformance while augmenting the typical 200SMA strategy in a way that uses all of its strengths while avoiding getting whipsawed in sideways markets.
The strategy BUYS when price crosses 5% over the 200SMA and then SELLS when price drops 3% below the 200SMA. Between trades I'll be parking my entire account in SGOV.
So maximizing profit while minimizing risk.
You use the strategy based off of QQQ and then make the trades on TQQQ when it tells you to BUY/SELL.
Here are some reasons why I will be using this strategy:
Simple emotionless BUY and SELL signals where I don't care who the president is, what is happening in the world, who is bombing who, who the leadership team is, no attachment to individual companies and diversified across the NASDAQ.
~85% win percentage and when it does lose the loses are nothing compared to the wins and after a loss you're basically set up for a massive win in the next trade.
Max drawdown of around 53% when using TQQQ
You benefit massively when the market is doing well and when there is a recession you basically sit in SGOV for a year and then are set up for a monster recovery with a clear easy BUY signal. So as long as you're patient you win regardless of what happens.
The trades are often very long term resulting in you taking advantage of Long Term Capital Gains tax advantage which could mean saving up to 15-20% in taxes.
With only a few trades you can spend time doing other stuff and don't have to track or pay attention to anything that is happening.
Simple, easy, and massively profitable.

Enhanced Ichimoku Cloud Strategy V1 [Quant Trading]Overview
This strategy combines the powerful Ichimoku Kinko Hyo system with a 171-period Exponential Moving Average (EMA) filter to create a robust trend-following approach. The strategy is designed for traders seeking to capitalize on strong momentum moves while using the Ichimoku cloud structure to identify optimal entry and exit points.
This is a patient, low-frequency trading system that prioritizes quality over quantity. In backtesting on Solana, the strategy achieved impressive results with approximately 3600% profit over just 29 trades, demonstrating its effectiveness at capturing major trend movements rather than attempting to profit from every market fluctuation. The extended parameters and strict entry criteria are specifically optimized for Solana's price action characteristics, making it well-suited for traders who prefer fewer, higher-conviction positions over high-frequency trading approaches.
What Makes This Strategy Original
This implementation enhances the traditional Ichimoku system by:
Custom Ichimoku Parameters: Uses non-standard periods (Conversion: 7, Base: 211, Lagging Span 2: 120, Displacement: 41) optimized for different market conditions
EMA Confirmation Filter: Incorporates a 171-period EMA as an additional trend confirmation layer
State Memory System: Implements a sophisticated memory system to track buy/sell states and prevent false signals
Dual Trade Modes: Offers both traditional Ichimoku signals ("Ichi") and cloud-based signals ("Cloud")
Breakout Confirmation: Requires price to break above the 25-period high for long entries
How It Works
Core Components
Ichimoku Elements:
-Conversion Line (Tenkan-sen): 7-period Donchian midpoint
-Base Line (Kijun-sen): 211-period Donchian midpoint
-Span A (Senkou Span A): Average of Conversion and Base lines, plotted 41 periods ahead
-Span B (Senkou Span B): 120-period Donchian midpoint, plotted 41 periods ahead
-Lagging Span (Chikou Span): Current close plotted 41 periods back
EMA Filter: 171-period EMA acts as a long-term trend filter
Entry Logic (Ichi Mode - Default)
A long position is triggered when ALL conditions are met:
Cloud Bullish: Span A > Span B (41 periods ago)
Breakout Confirmation: Current close > 25-period high
Ichimoku Bullish: Conversion Line > Base Line
Trend Alignment: Current close > 171-period EMA
State Memory: No previous buy signal is still active
Exit Logic
Positions are closed when:
Ichimoku Bearish: Conversion Line < Base Line
Alternative Cloud Mode
When "Cloud" mode is selected, the strategy uses:
Entry: Span A crosses above Span B with additional cloud and EMA confirmations
Exit: Span A crosses below Span B with cloud and EMA confirmations
Default Settings Explained
Strategy Properties
Initial Capital: $1,000 (realistic for average traders)
Position Size: 100% of equity (appropriate for backtesting single-asset strategies)
Commission: 0.1% (realistic for most brokers)
Slippage: 3 ticks (accounts for realistic execution costs)
Date Range: January 1, 2018 to December 31, 2069
Key Parameters
Conversion Periods: 7 (faster than traditional 9, more responsive to price changes)
Base Periods: 211 (much longer than traditional 26, provides stronger trend confirmation)
Lagging Span 2 Periods: 120 (custom period for stronger support/resistance levels)
Displacement: 41 (projects cloud further into future than standard 26)
EMA Period: 171 (long-term trend filter, approximately 8.5 months of daily data)
How to Use This Strategy
Best Market Conditions
Trending Markets: Works best in clearly trending markets where the cloud provides strong directional bias
Medium to Long-term Timeframes: Optimized for daily charts and higher timeframes
Volatile Assets: The breakout confirmation helps filter out weak signals in choppy markets
Risk Management
The strategy uses 100% equity allocation, suitable for backtesting single strategies
Consider reducing position size when implementing with real capital
Monitor the 25-period high breakout requirement as it may delay entries in fast-moving markets
Visual Elements
Green/Red Cloud: Shows bullish/bearish cloud conditions
Yellow Line: Conversion Line (Tenkan-sen)
Blue Line: Base Line (Kijun-sen)
Orange Line: 171-period EMA trend filter
Gray Line: Lagging Span (Chikou Span)
Important Considerations
Limitations
Lagging Nature: Like all Ichimoku strategies, signals may lag significant price moves
Whipsaw Risk: Extended periods of consolidation may generate false signals
Parameter Sensitivity: Custom parameters may not work equally well across all market conditions
Backtesting Notes
Results are based on historical data and past performance does not guarantee future results
The strategy includes realistic slippage and commission costs
Default settings are optimized for backtesting and may need adjustment for live trading
Risk Disclaimer
This strategy is for educational purposes only and should not be considered financial advice. Always conduct your own analysis and risk management before implementing any trading strategy. The unique parameter combinations used may not be suitable for all market conditions or trading styles.
Customization Options
Trade Mode: Switch between "Ichi" and "Cloud" signal generation
Short Trading: Option to enable short positions (disabled by default)
Date Range: Customize backtesting period
All Ichimoku Parameters: Fully customizable for different market conditions
This enhanced Ichimoku implementation provides a structured approach to trend following while maintaining the flexibility to adapt to different trading styles and market conditions.

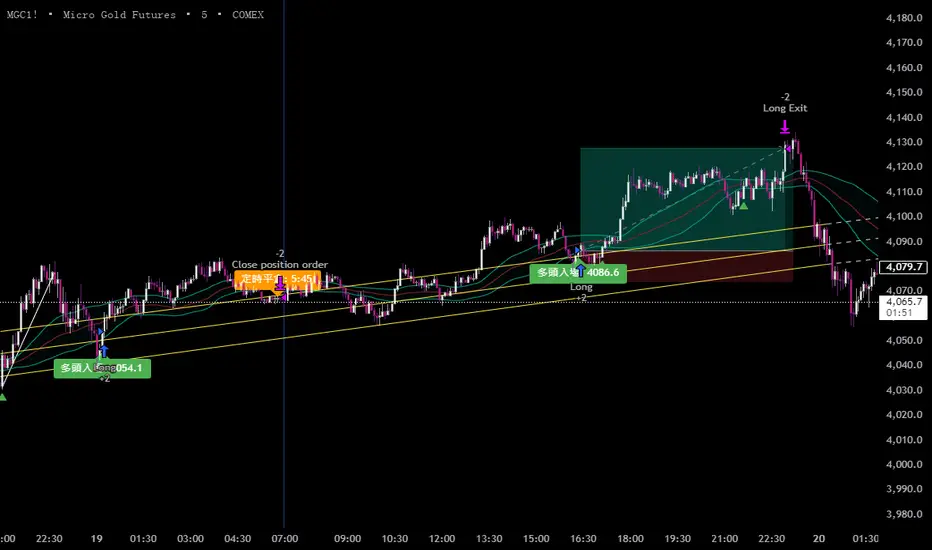
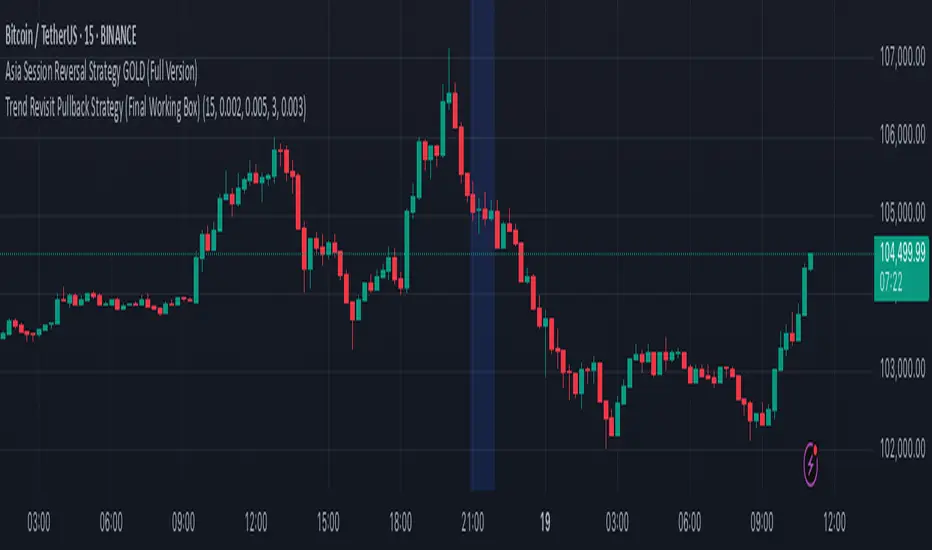
Trend Revisit Pullback Strategy (Final Working Box)📈 Trend Revisit Pullback Strategy
This TradingView Pine Script strategy identifies strong trend breakouts and accounts for natural pullbacks by:
Entering long or short on strong 1-bar breakouts
Allowing for pullback averaging if price retraces after entry
Expecting a revisit to the original entry price within 15 bars
Automatically exiting at break-even or using a custom TP/SL
Drawing a visual trade zone (entry → SL → revisit window) for easy reference
Optional labels and color-coded boxes to track each trade’s lifecycle
Ideal for trend traders who anticipate a pullback and prefer to manage risk with break-even exits or reward-to-risk parameters.
EMA 12/26 With ATR Volatility StoplossThe EMA 12/26 With ATR Volatility Stoploss
The EMA 12/26 With ATR Volatility Stoploss strategy is a meticulously designed systematic trading approach tailored for navigating financial markets through technical analysis. By integrating the Exponential Moving Average (EMA) and Average True Range (ATR) indicators, the strategy aims to identify optimal entry and exit points for trades while prioritizing disciplined risk management. At its core, it is a trend-following system that seeks to capitalize on price momentum, employing volatility-adjusted stop-loss mechanisms and dynamic position sizing to align with predefined risk parameters. Additionally, it offers traders the flexibility to manage profits either by compounding returns or preserving initial capital, making it adaptable to diverse trading philosophies. This essay provides a comprehensive exploration of the strategy’s underlying concepts, key components, strengths, limitations, and practical applications, without delving into its technical code.
=====
Core Philosophy and Objectives
The EMA 12/26 With ATR Volatility Stoploss strategy is built on the premise of capturing short- to medium-term price trends with a high degree of automation and consistency. It leverages the crossover of two EMAs—a fast EMA (12-period) and a slow EMA (26-period)—to generate buy and sell signals, which indicate potential trend reversals or continuations. To mitigate the inherent risks of trading, the strategy incorporates the ATR indicator to set stop-loss levels that adapt to market volatility, ensuring that losses remain within acceptable bounds. Furthermore, it calculates position sizes based on a user-defined risk percentage, safeguarding capital while optimizing trade exposure.
A distinctive feature of the strategy is its dual profit management modes:
SnowBall (Compound Profit): Profits from successful trades are reinvested into the capital base, allowing for progressively larger position sizes and potential exponential portfolio growth.
ZeroRisk (Fixed Equity): Profits are withdrawn, and trades are executed using only the initial capital, prioritizing capital preservation and minimizing exposure to market downturns.
This duality caters to both aggressive traders seeking growth and conservative traders focused on stability, positioning the strategy as a versatile tool for various market environments.
=====
Key Components of the Strategy
1. EMA-Based Signal Generation
The strategy’s trend-following mechanism hinges on the interaction between the Fast EMA (12-period) and Slow EMA (26-period). EMAs are preferred over simple moving averages because they assign greater weight to recent price data, enabling quicker responses to market shifts. The key signals are:
Buy Signal: Triggered when the Fast EMA crosses above the Slow EMA, suggesting the onset of an uptrend or bullish momentum.
Sell Signal: Occurs when the Fast EMA crosses below the Slow EMA, indicating a potential downtrend or the end of a bullish phase.
To enhance signal reliability, the strategy employs an Anchor Point EMA (AP EMA), a short-period EMA (e.g., 2 days) that smooths the input price data before calculating the primary EMAs. This preprocessing reduces noise from short-term price fluctuations, improving the accuracy of trend detection. Additionally, users can opt for a Consolidated EMA (e.g., 18-period) to display a single trend line instead of both EMAs, simplifying chart analysis while retaining trend insights.
=====
2. Volatility-Adjusted Risk Management with ATR
Risk management is a cornerstone of the strategy, achieved through the use of the Average True Range (ATR), which quantifies market volatility by measuring the average price range over a specified period (e.g., 10 days). The ATR informs the placement of stop-loss levels, which are set at a multiple of the ATR (e.g., 2x ATR) below the entry price for long positions. This approach ensures that stop losses are proportionate to current market conditions—wider during high volatility to avoid premature exits, and narrower during low volatility to protect profits.
For example, if a stock’s ATR is $1 and the multiplier is 2, the stop loss for a buy at $100 would be set at $98. This dynamic adjustment enhances the strategy’s adaptability, preventing stop-outs from normal market noise while capping potential losses.
=====
3. Dynamic Position Sizing
The strategy calculates position sizes to align with a user-defined Risk Per Trade, typically expressed as a percentage of capital (e.g., 2%). The position size is determined by:
The available capital, which varies depending on whether SnowBall or ZeroRisk mode is selected.
The distance between the entry price and the ATR-based stop-loss level, which represents the per-unit risk.
The desired risk percentage, ensuring that the maximum loss per trade does not exceed the specified threshold.
For instance, with a $1,000 capital, a 2% risk per trade ($20), and a stop-loss distance equivalent to 5% of the entry price, the strategy computes the number of units (shares or contracts) to ensure the total loss, if the stop loss is hit, equals $20. To prevent over-leveraging, the strategy includes checks to ensure that the position’s dollar value does not exceed available capital. If it does, the position size is scaled down to fit within the capital constraints, maintaining financial discipline.
=====
4. Flexible Capital Management
The strategy’s dual profit management modes—SnowBall and ZeroRisk—offer traders strategic flexibility:
SnowBall Mode: By compounding profits, traders can increase their capital base, leading to larger position sizes over time. This is ideal for those with a long-term growth mindset, as it harnesses the power of exponential returns.
ZeroRisk Mode: By withdrawing profits and trading solely with the initial capital, traders protect their gains and limit exposure to market volatility. This conservative approach suits those prioritizing stability over aggressive growth.
These options allow traders to tailor the strategy to their risk tolerance, financial goals, and market outlook, enhancing its applicability across different trading styles.
=====
5. Time-Based Trade Filtering
To optimize performance and relevance, the strategy includes an option to restrict trading to a specific time range (e.g., from 2018 onward). This feature enables traders to focus on periods with favorable market conditions, avoid historically volatile or unreliable data, or align the strategy with their backtesting objectives. By confining trades to a defined timeframe, the strategy ensures that performance metrics reflect the intended market context.
=====
Strengths of the Strategy
The EMA 12/26 With ATR Volatility Stoploss strategy offers several compelling advantages:
Systematic and Objective: By adhering to predefined rules, the strategy eliminates emotional biases, ensuring consistent execution across market conditions.
Robust Risk Controls: The combination of ATR-based stop losses and risk-based position sizing caps losses at user-defined levels, fostering capital preservation.
Customizability: Traders can adjust parameters such as EMA periods, ATR multipliers, and risk percentages, tailoring the strategy to specific markets or preferences.
Volatility Adaptation: Stop losses that scale with market volatility enhance the strategy’s resilience, accommodating both calm and turbulent market phases.
Enhanced Visualization: The use of color-coded EMAs (green for bullish, red for bearish) and background shading provides intuitive visual cues, simplifying trend and trade status identification.
=====
Limitations and Considerations
Despite its strengths, the strategy has inherent limitations that traders must address:
False Signals in Range-Bound Markets: EMA crossovers may generate misleading signals in sideways or choppy markets, leading to whipsaws and unprofitable trades.
Signal Lag: As lagging indicators, EMAs may delay entry or exit signals, causing traders to miss rapid trend shifts or enter trades late.
Overfitting Risk: Excessive optimization of parameters to fit historical data can impair the strategy’s performance in live markets, as past patterns may not persist.
Impact of High Volatility: In extremely volatile markets, wider stop losses may result in larger losses than anticipated, challenging risk management assumptions.
Data Reliability: The strategy’s effectiveness depends on accurate, continuous price data, and discrepancies or gaps can undermine signal accuracy.
=====
Practical Applications
The EMA 12/26 With ATR Volatility Stoploss strategy is versatile, applicable to diverse markets such as stocks, forex, commodities, and cryptocurrencies, particularly in trending environments. To maximize its potential, traders should adopt a rigorous implementation process:
Backtesting: Evaluate the strategy’s historical performance across various market conditions to assess its robustness and identify optimal parameter settings.
Forward Testing: Deploy the strategy in a demo account to validate its real-time performance, ensuring it aligns with live market dynamics before risking capital.
Ongoing Monitoring: Continuously track trade outcomes, analyze performance metrics, and refine parameters to adapt to evolving market conditions.
Additionally, traders should consider market-specific factors, such as liquidity and volatility, when applying the strategy. For instance, highly liquid markets like forex may require tighter ATR multipliers, while less liquid markets like small-cap stocks may benefit from wider stop losses.
=====
Conclusion
The EMA 12/26 With ATR Volatility Stoploss strategy is a sophisticated, systematic trading framework that blends trend-following precision with disciplined risk management. By leveraging EMA crossovers for signal generation, ATR-based stop losses for volatility adjustment, and dynamic position sizing for risk control, it offers a balanced approach to capturing market trends while safeguarding capital. Its flexibility—evident in customizable parameters and dual profit management modes—makes it suitable for traders with varying risk appetites and objectives. However, its limitations, such as susceptibility to false signals and signal lag, necessitate thorough testing and prudent application. Through rigorous backtesting, forward testing, and continuous refinement, traders can harness this strategy to achieve consistent, risk-adjusted returns in trending markets, establishing it as a valuable tool in the arsenal of systematic trading.

Titan X 📈 Titan X – Optimized Trend Strategy with Gradient ZLEMA, RMI, CCI, ROC, and Volume Confirmation
Titan X is a precision-engineered trend-following strategy designed for crypto markets and high-volatility assets. It is not just a combination of indicators, but a carefully constructed, non-repainting system where each component plays a specific role in confirming high-probability trade setups. The strategy detects strong directional moves, confirms them with momentum and volume, and manages trade exits without relying on traditional stop losses.
🔍 How the Indicators Work Together
✅ 1. ZLEMA Baseline + Gradient Filter
A Zero Lag Exponential Moving Average (ZLEMA) is used to track directional trend with minimal lag.
A gradient (slope) is calculated from the ZLEMA to measure trend acceleration. This confirms whether a trend is gaining strength or losing momentum.
Entries are only taken when the ZLEMA gradient exceeds a user-defined threshold, ensuring trades are only taken in strong, developing trends.
✅ 2. RMI – Relative Momentum Index (with Memory)
RMI captures sustained momentum direction over time.
It helps validate that price isn't just spiking, but truly trending.
Titan X uses RMI as a trend memory filter, requiring consistent momentum alignment before entry.
✅ 3. Momentum Timing – ROC + CCI
The Rate of Change (ROC) determines the strength and direction of recent momentum.
The Commodity Channel Index (CCI) checks price deviation from a moving average baseline, identifying whether momentum is aligned with market structure.
This combo prevents trades in weak, flat, or conflicting conditions.
✅ 4. Volume Spike Confirmation
Titan X uses a relative volume filter, requiring the current bar’s volume to exceed a moving average threshold.
This ensures trades are only triggered when there is clear breakout interest from market participants, helping avoid fakeouts and low-volume moves.
🎯 Trade Entry & Exit Rules
✅ Entry Conditions:
All five filters must align:
Trend direction (ZLEMA slope)
Momentum (ROC & CCI)
Trend memory (RMI)
Volume (Spike filter)
Trades are entered on the next bar after all confirmations, ensuring 100% non-repainting behavior.
✅ Take Profit System (Multi-Level TP):
TP1: Closes 50% of the position at a user-defined % gain (default: 2%)
TP2: Closes the remaining 50% of the position at a higher % gain (default: 4%)
Each TP is executed via limit order to ensure realistic and backtestable fills.
❌ No Stop Loss Used
Instead of using fixed stop losses, Titan X closes positions early when trend conditions weaken.
This dynamic exit logic is based on a reversal in ZLEMA gradient, which serves as a weak trend detection system.
⏱️ Cooldown Logic
A 1-bar cooldown is enforced between trades to avoid same-bar exit/entry violations on TradingView.
This improves execution accuracy and avoids overtrading on choppy price action.
📊 Real-Time Strategy Dashboard
Titan X includes a live dashboard that provides full transparency:
Current Position (Long / Short / Flat)
Entry Price
TP1 Hit? / TP2 Hit?
Bars Since Entry
Win Rate (%)
Profit Factor
Ideal for both manual monitoring and automated bot strategies.
🔔 Bot-Ready Multi-Exchange Alerts
Alerts can be configured for:
ENTER-LONG, ENTER-SHORT
EXIT-LONG, EXIT-SHORT
TP1 / TP2 targets
Messages are fully customizable and designed for platforms like:
WonderTrading
3Commas
TradingConnector
⚙️ Designed For:
Timeframes: 1H and 4H (optimized for crypto)
Markets: Altcoins, BTC/ETH, high-volatility pairs
Traders: Trend-followers, momentum scalpers, algo bot users
Goal: High accuracy entries, structured exits, zero repainting, and flexible trade management
⚠️ TradingView Disclosure
This strategy is provided for educational purposes only. It does not constitute investment advice, nor does it guarantee any returns. Trading carries risk; test thoroughly before using in live environments.

EMA 34 Crossover with Break Even Stop LossEMA 34 Crossover with Break Even Stop Loss Strategy
This trading strategy is based on the 34-period Exponential Moving Average (EMA) and aims to enter long positions when the price crosses above the EMA 34. The strategy is designed to manage risk effectively with a dynamic stop loss and take-profit mechanism.
Key Features:
EMA 34 Crossover:
The strategy generates a long entry signal when the closing price of the current bar crosses above the 34-period EMA, with the condition that the previous closing price was below the EMA. This crossover indicates a potential upward trend.
Risk Management:
Upon entering a trade, the strategy sets a stop loss at the low of the previous bar. This helps in controlling the downside risk.
A take profit level is set at a 10:1 risk-to-reward ratio, meaning the potential profit is ten times the amount risked on the trade.
Break-even Stop Loss:
As the price moves in favor of the trade and reaches a 3:1 risk-to-reward ratio, the strategy moves the stop loss to the entry price (break-even). This ensures that no loss will be incurred if the market reverses, effectively protecting profits.
Exit Conditions:
The strategy exits the trade when either the stop loss is hit (if the price drops below the stop loss level) or the take profit target is reached (if the price rises to the take profit level).
If the price reaches the break-even level (entry price), the stop loss is adjusted to lock in profits and prevent any loss.
Visualization:
The stop loss and take profit levels are plotted on the chart for easy visualization, helping traders track the status of their trade.
Trade Management Summary:
Long Entry: When price crosses above the 34-period EMA.
Stop Loss: Set to the low of the previous candle.
Take Profit: Set to a 10:1 risk-to-reward ratio.
Break-even: Stop loss is moved to entry price when a 3:1 risk-to-reward ratio is reached.
Exit: The trade is closed either when the stop loss or take profit levels are hit.
This strategy is designed to minimize losses by employing a dynamic stop loss and to maximize gains by setting a favorable risk-to-reward ratio, making it suitable for traders who prefer a structured, automated approach to risk management and trend-following.

Apex Trend SniperApex Trend Sniper - Advanced Trend Trading Strategy (Pine Script v5)
🚀 Overview
The Apex Trend Sniper is an advanced, fully automated trend-following strategy designed for crypto, forex, and stock markets. It combines momentum analysis, trend confirmation, volume validation, and adaptive risk management to capture high-probability trades. Unlike many strategies, this system is 100% non-repainting, ensuring reliable backtesting and real-time execution.
🔹 How This Strategy Works (Indicator Mashup)
The Apex Trend Sniper leverages multiple indicators to create a robust multi-layered confirmation system:
1️⃣ Trend Identification with RMI & McGinley Dynamic
📌 What It Does: Identifies the dominant trend and prevents trading against market conditions.
✔ McGinley Dynamic Baseline:
A highly adaptive moving average that dynamically reacts to price changes.
Price above the baseline = bullish trend.
Price below the baseline = bearish trend.
✔ Relative Momentum Index (RMI):
A refined Relative Strength Index (RSI) that filters out weak trends.
Above 50 = bullish confirmation.
Below 50 = bearish confirmation.
2️⃣ Trend Strength Confirmation with Vortex Indicator
📌 What It Does: Confirms that a detected trend is strong and valid.
✔ Vortex Indicator (VI):
Measures directional movement and trend strength.
A bullish trend is confirmed when VI+ > VI-.
A bearish trend is confirmed when VI- > VI+.
3️⃣ Volume Spike Detection for Trade Validation
📌 What It Does: Ensures that trades are placed only during strong market participation.
✔ Volume Confirmation:
A trade signal is only valid if volume spikes above the moving average.
Helps avoid false breakouts and weak trends.
4️⃣ Entry & Exit Strategy with Multi-Level Take Profits
📌 What It Does: Enters trades only when all conditions align and manages risk effectively.
✔ Entry Conditions (All must be met):
Price is above/below McGinley Dynamic.
RMI confirms trend direction.
Vortex indicator confirms trend strength.
Volume spike is detected.
✔ Exit Conditions:
Take Profit 1 (TP1): Secures 50% of the position at the first price target.
Take Profit 2 (TP2): Closes the remaining position at the second price target.
Exit Before Reversal: If an opposite trend signal appears, the position is closed early.
Trend Weakness Exit: If momentum weakens, the trade is exited automatically.
📌 Strategy Customization
🔧 Fully customizable to fit any trading style:
✔ McGinley Dynamic Length – Adjust baseline sensitivity.
✔ RMI & Vortex Settings – Fine-tune momentum filters.
✔ Volume Thresholds – Modify spike detection for better accuracy.
✔ Take Profit Levels – Set TP1 & TP2 based on market volatility.
📢 How to Use Apex Trend Sniper
1️⃣ Apply the strategy to any TradingView chart.
2️⃣ Customize the settings to fit your trading approach.
3️⃣ Use the backtest report to evaluate performance.
4️⃣ Monitor the dashboard to track real-time trade execution.
📌 Recommended Timeframes & Markets
✔ Best Markets:
✅ Crypto (BTC, ETH, SOL, etc.)
✅ Forex (EUR/USD, GBP/USD, JPY/USD, etc.)
✅ Stocks & Indices (S&P500, NASDAQ, etc.)
✔ Optimal Timeframes:
✅ Swing Trading: 1H – 4H – 1D
✅ Intraday & Scalping: 5M – 15M – 30M
📌 Backtest Settings for Realistic Performance
✔ Initial Capital: $1000 (or more for scaling).
✔ Commission: 0.05% (to simulate exchange fees).
✔ Slippage: 1-2 (to account for execution delay).
✔ Date Range: Test across different market conditions.
📢 TradingView Disclaimer
📌 This script is for educational purposes only and does not constitute financial advice. Trading carries significant risk, and past performance does not guarantee future results. Always test strategies thoroughly before applying them in a live market. Users are responsible for their own trading decisions.
🚀 Why Choose Apex Trend Sniper?
✅ Non-Repainting – No misleading signals.
✅ Multi-Layer Confirmation – Reduces false trades.
✅ Volume & Trend Strength Validation – Ensures high-probability entries.
✅ Adaptive Risk Management – Secures profits while maximizing trends.
✅ Versatile Across Markets & Timeframes – Works for crypto, forex, and stocks.
📢 Start Trading Smarter with Apex Trend Sniper! 🚀
🔗 Try it now on TradingView and optimize your trend-following strategy. 🔥

Buy on 5% dip strategy with time adjustment
This script is a strategy called "Buy on 5% Dip Strategy with Time Adjustment 📉💡," which detects a 5% drop in price and triggers a buy signal 🔔. It also automatically closes the position once the set profit target is reached 💰, and it has additional logic to close the position if the loss exceeds 14% after holding for 230 days ⏳.
Strategy Explanation
Buy Condition: A buy signal is triggered when the price drops 5% from the highest price reached 🔻.
Take Profit: The position is closed when the price hits a 1.22x target from the average entry price 📈.
Forced Sell Condition: If the position is held for more than 230 days and the loss exceeds 14%, the position is automatically closed 🚫.
Leverage & Capital Allocation: Leverage is adjustable ⚖️, and you can set the percentage of capital allocated to each trade 💸.
Time Limits: The strategy allows you to set a start and end time ⏰ for trading, making the strategy active only within that specific period.
Code Credits and References
Credits: This script utilizes ideas and code from @QuantNomad and jangdokang for the profit table and algorithm concepts 🔧.
Sources:
Monthly Performance Table Script by QuantNomad:
ZenAndTheArtOfTrading's Script:
Strategy Performance
This strategy provides risk management through take profit and forced sell conditions and includes a performance table 📊 to track monthly and yearly results. You can compare backtest results with real-time performance to evaluate the strategy's effectiveness.
The performance numbers shown in the backtest reflect what would have happened if you had used this strategy since the launch date of the SOXL (the Direxion Daily Semiconductor Bull 3x Shares ETF) 📅. These results are not hypothetical but based on actual performance from the day of the ETF’s launch 📈.
Caution ⚠️
No Guarantee of Future Results: The results are based on historical performance from the launch of the SOXL ETF, but past performance does not guarantee future results. It’s important to approach with caution when applying it to live trading 🔍.
Risk Management: Leverage and capital allocation settings are crucial for managing risk ⚠️. Make sure to adjust these according to your risk tolerance ⚖️.

ThinkTech AI SignalsThink Tech AI Strategy
The Think Tech AI Strategy provides a structured approach to trading by integrating liquidity-based entries, ATR volatility thresholds, and dynamic risk management. This strategy generates buy and sell signals while automatically calculating take profit and stop loss levels, boasting a 64% win rate based on historical data.
Usage
The strategy can be used to identify key breakout and retest opportunities. Liquidity-based zones act as potential accumulation and distribution areas and may serve as future support or resistance levels. Buy and sell zones are identified using liquidity zones and ATR-based filters. Risk management is built-in, automatically calculating take profit and stop loss levels using ATR multipliers. Volume and trend filtering options help confirm directional bias using a 50 EMA and RSI filter. The strategy also allows for session-based trading, limiting trades to key market hours for higher probability setups.
Settings
The risk/reward ratio can be adjusted to define the desired stop loss and take profit calculations. The ATR length and threshold determine ATR-based breakout conditions for dynamic entries. Liquidity period settings allow for customized analysis of price structure for support and resistance zones. Additional trend and RSI filters can be enabled to refine trade signals based on moving averages and momentum conditions. A session filter is included to restrict trade signals to specific market hours.
Style
The strategy includes options to display liquidity lines, showing key support and resistance areas. The first 15-minute candle breakout zones can also be visualized to highlight critical market structure points. A win/loss statistics table is included to track trade performance directly on the chart.
This strategy is intended for descriptive analysis and should be used alongside other confluence factors. Optimize your trading process with Think Tech AI today!

Liquidity + Internal Market Shift StrategyLiquidity + Internal Market Shift Strategy
This strategy combines liquidity zone analysis with the internal market structure, aiming to identify high-probability entry points. It uses key liquidity levels (local highs and lows) to track the price's interaction with significant market levels and then employs internal market shifts to trigger trades.
Key Features:
Internal Shift Logic: Instead of relying on traditional candlestick patterns like engulfing candles, this strategy utilizes internal market shifts. A bullish shift occurs when the price breaks previous bearish levels, and a bearish shift happens when the price breaks previous bullish levels, indicating a change in market direction.
Liquidity Zones: The strategy dynamically identifies key liquidity zones (local highs and lows) to detect potential reversal points and prevent trades in weak market conditions.
Mode Options: You can choose to run the strategy in "Both," "Bullish Only," or "Bearish Only" modes, allowing for flexibility based on market conditions.
Stop-Loss and Take-Profit: Customizable stop-loss and take-profit levels are integrated to manage risk and lock in profits.
Time Range Control: You can specify the time range for trading, ensuring the strategy only operates during the desired period.
This strategy is ideal for traders who want to combine liquidity analysis with internal structure shifts for precise market entries and exits.
This description clearly outlines the strategy's logic, the flexibility it provides, and how it works. You can adjust it further to match your personal trading style or preferences!

ThePawnAlgoPROThe Pawn algo PRO is an automated strategy that is useful to trade retracements and expansions using any higher timeframe reference.
Why is useful?
This algorithm is helpful to trade with the higher timeframe Bias and to see the HTF manipulations of the highs or lows once the candle open, usually in a normal buy candle will be a manipulation lower to end up higher. In a normal sell candle will be a manipulation higher to close lower. Once the potential direction of the Higher time frame candle is clear the algo will just enter on a trade on the lower timeframe aligned with the higher timeframe trend.
You can select any HTF you want from 1-365Days, 1-12Months or 1-52W ranges. Making this algorithm very flexible to adapt to any trader specialized timeframe.
How it works and how it does it?
It works with a simple but powerful pattern a close above previous candle high means higher prices and a close below previous candle low means lower prices, Close inside previous candle range means price is going to consolidate do some kind of retracement or reversal. The algo plots the candles with different colors to identify each of these states. And it does this in the HTF range plot.
This algo is similar to the previously released Pawn algo with the additional features that is an automated strategy that can take trade using desired risk reward and different entry types and trade management options. When the simple pattern is detected.
Also this version allows to plot the current developing HTF levels meaning the high, low and the 50%, plus the first created FVG(fair value gap introduced by ICT) in the range allowing to easily track any change in the potential direction of the HTF candle.
How to use it?
First select a higher timeframe reference and then select a lower timeframe, to visualize it better is recommended that the LTF is at least 10 times lower. Default HTF is 1 Week and LTF is 60min for trading the weekly expansions intraday.
Then we configure the HTF visualization it can be configure to show different HTF levels the premium/discount, wicks midpoints, previous levels, actual developing range or both. The Shade of the HTF range can be the body or the whole HTF range.
After that we configure the automated entries we can chose between buys only ,sell only entries or both and minimum risk reward to take a trade. Default value is 1.8RR and both entries selected. We can choose the maximum Risk Reward to avoid unrealistic targets default is 10RR. The maximum trades per HTF candle is also possible to select around this section.
Then we got the option to select which type of trade you want to take a trade around the open, the 50% or 75-80% or around the previous High for shorts or Low for longs. And off course the breakout entry that is for taking expansions outside previous HTF range. The picture below showcase an option using only entries on previous candles High or lows and 1Day as a HTF. You can also see the actual and previous HTF levels plotted.
Is important to take into account that these default settings are optimized for the MNQ! the 1W and 1H timeframes, but traders can adjust these settings to their desire timeframes or market and find a profitable configuration adjusting the parameters as they prefer. Initial balance, order size and commissions might be needed to be configured properly depending of the market. The algo provides a dashboard that make it easy to find a profitable configuration. It specifies the total trades, ARR that is an approximate value of the accumulative risk reward assuming all loses are 1R. The profit factor(PF) and percent profitable trades(PP) values are also available plus consecutives take profits and consecutives loses experimented in the simulation.
Finally there is an option to allow the algo to just trade following the direction of the trend if you just want to use it for sentiment or potential trend detection, this will place a trade in the most probable direction using the HTF reference levels, first FVG and LTF price action.
In the picture below you can see it in action in the 1min chart using 1H as HTF. When its trending works pretty well but when is consolidating is better to avoid using this option. Configuration below uses a time filter with the macro times specified by ICT that is also an available filter for taking trades. And the risk reward is set to minimum 2RR.
The cyan dotted line is the stop loss and the blue one above is the take profit level. The algo allows for different ways to exit in this case is using exit on a reversal, but can also be when the take profit is hit, or in a retracement. For the stop loss we can chose to exit on a close, reversal or when price hit the level.
Strategy Results
The results are obtained using 2000usd in the MNQ! 1 contract per trade. Commission are set to 2USD,slippage to 1tick,
The backtesting range is from April 19 2021 to the present date that is march 2025 for a total of 180 trades, this Strategy default settings are designed to take trades on retracements only, in any of the available options meaning around 50% to the extreme HTF high or low following the HTF trend, but can only take 2 trades per HTF candle and the risk reward must be minimum 1.8RR and maximum 8RR. Break even is set when price reaches 2RR and the exit on profit is on a reversal, and for loses when the stop is hit. The HTF range is 1 Week and LTF is 1H. The strategy give decent results, makes around 2 times the money is lost with around 30% profitable. It experiments drawdown when the market makes quick market structure shifts or consolidates for long periods of time. So should be used with caution, remember entries constitute only a small component of a complete winning strategy. Other factors like risk management, position-sizing, trading frequency, trading fees, and many others must also be properly managed to achieve profitability. Past performance doesn’t guarantee future results.
Summary of features
-Take advantage of market fractality select HTF from 1-365Days, 1-12Months or 1-52W ranges
-Easily identify manipulations in the LTF using any HTF key levels, from previous or actual HTF range
-LTF Candles and shaded HTF boxes change color depending of previous candle close and price action
-Plot the first presented FVG of the selected HTF range plus 50% developing range of the HTF
-Configurable automated trades for retracements into the previous close, around 50%,75-80% or using the HTF high or low
-Option to enable automated breakout entries for expansions of the HTF range
-Trend follower algo that automatically place a trade where is likely to expand.
-Time filter to allow only entries around the times you trade or the macro times.
-Risk Reward filter to take the automated trades with visible stop and take profit levels
- Customizable trade management take profit, stop, breakeven level with standard deviations
-Option to exit on a close, retracement or reversal after hitting the take profit level
-Option to exit on a close or reversal after hitting stop loss
-Dashboard with instant statistics about the strategy current settings

Ultimate Trading BotHow the "Ultimate Trading Bot" Works:
This Pine Script trading bot executes buy and sell trades based on a combination of technical indicators:
Indicators Used:
RSI (Relative Strength Index)
Measures momentum and determines overbought (70) and oversold (30) levels.
A crossover above 30 suggests a potential buy, and a cross below 70 suggests a potential sell.
Moving Average (MA)
A simple moving average (SMA) of 50 periods to track the trend.
Prices above the MA indicate an uptrend, while prices below indicate a downtrend.
Stochastic Oscillator (%K and %D)
Identifies overbought and oversold conditions using a smoothed stochastic formula.
A crossover of %K above %D signals a buy, and a crossover below %D signals a sell.
MACD (Moving Average Convergence Divergence)
Uses a 12-period fast EMA and a 26-period slow EMA, with a 9-period signal line.
A crossover of MACD above the signal line suggests a bullish move, and a cross below suggests bearish movement.
Trade Execution:
Buy (Long Entry) Conditions:
RSI crosses above 30 (indicating recovery from an oversold state).
The closing price is above the 50-period moving average (showing an uptrend).
The MACD line crosses above the signal line (indicating upward momentum).
The Stochastic %K crosses above %D (indicating bullish momentum).
→ If all conditions are met, the bot enters a long (buy) position.
Sell (Exit Trade) Conditions:
RSI crosses below 70 (indicating overbought conditions).
The closing price is below the 50-period moving average (downtrend).
The MACD line crosses below the signal line (bearish signal).
The Stochastic %K crosses below %D (bearish momentum).
→ If all conditions are met, the bot closes the long position.
Visuals:
The bot plots the moving average, RSI, MACD, and Stochastic indicators for reference.
It also displays buy/sell signals with arrows:
Green arrow (Buy Signal) → When all buy conditions are met.
Red arrow (Sell Signal) → When all sell conditions are met.
How to Use It in TradingView:

ChronoSync | QuantEdgeB Introducing ChronoSync by QuantEdgeB
🛠️ Overview
ChronoSync is a multi-layered universal strategy designed for adaptability across various assets, timeframes, and market conditions. By integrating five high-quality indicators, it generates a dynamic, aggregated signal that enhances decision-making and optimizes performance in trending and mean-reverting environments.
📊 Key Strengths
✔️ Multi-indicator fusion for enhanced accuracy
✔️ Built-in adaptive filtering techniques
✔️ Works across varied market regimes
✔️ Provides quantifiable, rule-based signals
_____
✨ Key Features
🔹 Universal Signal Aggregation
Combines five complementary indicators to form a balanced, adaptive signal, ensuring robust performance across different market conditions.
🔹 Advanced Filtering Techniques
Utilizes Gaussian smoothing, average true range and standard deviation filtering, indicator normalization, and other non-lagging filters to refine trend detection and minimize noise.
🔹 Dynamic Market Adaptation
Employs percentile-based filtering and normalization techniques, allowing it to adjust dynamically to volatility shifts.
🔹 Modular & Customizable
Each indicator can be toggled independently, allowing traders to fine-tune the strategy based on their specific market outlook.
_____
📊 How It Works & Signal Generation
⚙ Multi-Layer Signal Aggregation: ChronoSync calculates individual trend signals from five indicators, combining their outputs into a Final Strategy Score to determine trade signals.
✅ Long Entry: Triggered when the aggregated final score surpasses the long threshold
❌ Short Entry (Cash Mode): Triggered when the final signal falls below the short threshold
🎨 Color Visualization: Changes dynamically to reflect market conditions
🔹 Volatility Adaptable: Traders can adjust the long and short signal thresholds to fine-tune sensitivity to volatility—wider thresholds reduce false signals in choppy markets, while narrower thresholds increase responsiveness in high-momentum trends.
🖥️ Dashboard & Signal Display:
• Displays individual indicator values and final aggregation score
• Signals (Long / Cash) appear directly on the chart when the label display is turned on
• Customizable visual settings to match user preferences
______
👥 Who is this for?
✔ Swing & Medium-Term Traders → Ideal for multi-day to multi-week trades.
✔Long-Term Investors & Trend Followers – Designed for traders and investors with a months-to-years horizon who seek to capture market trends on a cycle basis.
✔ Quantitative Traders → Structured, rules-based approach for systematic execution
_____
📊 Expanded Explanation : How the Five Indicators Work Together in ChronoSync
The ChronoSync strategy is built upon five carefully selected indicators, each fulfilling a crucial role in trend detection, volatility adaptation, and signal refinement. The synergy between these components ensures that signals are both robust and adaptable to different market conditions.
🔗 The Five-Indicator Synergy
Each indicator plays a specific role in the trend-following system, working together to enhance the strength, reliability, and adaptability of trade signals:
1️⃣ VIDYA ATR Gaussian Filter → Noise-Reduced Trend Detection
✔ What it Does:
The VIDYA ATR Gaussian Filter combines a volatility-adjusted moving average (VIDYA) with Gaussian smoothing to enhance trend clarity while minimizing market noise.
✔ Why It's Important:
• VIDYA dynamically adjusts to price fluctuations, ensuring smoother trend signals.
• Gaussian filtering eliminates erratic price movements that could otherwise trigger false entries/exits.
• By applying ATR filtering, the indicator remains adaptive to different volatility environments.
✔ How It Works With Others:
• Works in tandem with Kijun ATR & Dual SD Kijun to confirm long-term price trends while filtering out market noise.
• Enhances signal stability by reducing whipsaws in choppy conditions.
2️⃣ Kijun ATR & Dual SD Kijun → Trend Confirmation & Volatility Filtering
✔ What it Does:
The Kijun ATR and Dual SD Kijun components combine trend structure with volatility adjustments to capture sustained price moves.
✔ Why It's Important:
• The Kijun ATR dynamically adjusts to price swings, allowing the system to filter out market noise and identify valid breakout conditions.
• The Dual SD Kijun introduces an extra layer of confirmation by incorporating a standard deviation-based volatility filter to assess trend strength.
✔ How It Works With Others:
• Confirms trends initiated by VIDYA ATR Gaussian Filter, ensuring signals are based on structural price movements rather than short-term fluctuations.
• Complements PRC-ALMA Adaptive Bands in detecting price deviations and trend shifts.
3️⃣ VIDYA Loop Function → Iterative Trend Reinforcement
✔ What it Does:
The VIDYA Loop Function applies a recursive method to track sustained trends, using a loop-based iterative calculation.
✔ Why It's Important:
• Identifies persistent trends by aggregating historical VIDYA changes over a defined loop window.
• Helps eliminate short-lived price movements by smoothing trend signals over time.
✔ How It Works With Others:
• Enhances Bollinger Bands % SD by providing an additional trend strength confirmation.
• Strengthens Kijun ATR signals by filtering out weak or temporary price movements.
4️⃣ PRC-ALMA Adaptive Bands → Mean Reversion & Trend Filtering
✔ What it Does:
The PRC-ALMA Adaptive Bands combine a percentile-based ranking system with an adaptive smoothing function (ALMA) to define overbought/oversold zones within trend movements.
✔ Why It's Important:
• Adaptive percentile-based ranking ensures the indicator adjusts to market shifts dynamically.
• ALMA filtering ensures non-lagging trend detection, reducing delays in trade signals.
• Acts as a contrarian filter for trend exhaustion signals.
✔ How It Works With Others:
• Complements VIDYA ATR & Kijun ATR by refining trend-following entries.
• Provides mean-reverting insights to balance aggressive trend-following signals.
5️⃣ Bollinger Bands % SD → Volatility Expansion & Trend Strength Evaluation
✔ What it Does:
The Bollinger Bands % SD indicator measures price positioning relative to standard deviation bounds, helping assess volatility-driven trend strength.
✔ Why It's Important:
• Measures price movements relative to historical volatility thresholds.
• Helps determine when price action is statistically stretched (i.e., strong trend moves vs. mean-reverting pullbacks).
• Allows dynamic market adaptation, ensuring that signals remain relevant across different volatility phases.
✔ How It Works With Others:
• Enhances PRC-ALMA by confirming whether a price move is an actual breakout or a short-term deviation.
• Validates VIDYA ATR & Kijun ATR signals by ensuring the trend has sufficient strength to continue.
The ChronoSync strategy ensures a balanced fusion of trend-following and volatility adaptation. Each component adds a distinct layer of analysis, reducing false signals and improving robustness:
✅ Trend Identification → VIDYA ATR, Kijun ATR, & Dual SD Kijun
✅ Noise Reduction & Trend Confirmation → VIDYA Loop Function & Gaussian Smoothing
✅ Volatility Adaptation & Overbought/Oversold Conditions → PRC-ALMA Adaptive Bands & Bollinger Bands % SD
This multi-layered approach ensures that no single indicator dominates the strategy, allowing it to adapt dynamically to various market conditions.
📌 Conclusion
ChronoSync is a universal trend aggregation strategy, built on adaptive multi-indicator filtering and robust risk management. Designed for dynamic market conditions, it offers a rule-based, quantifiable approach to trend identification. Whether used as a standalone trading system or an auxiliary confirmation tool, it provides a scientific, data-driven edge for traders navigating volatile markets.
🔹 Disclaimer: Past performance is not indicative of future results. No trading strategy can guarantee success in financial markets.
🔹 Strategic Advice: Always backtest, optimize, and align parameters with your trading objectives and risk tolerance before live trading.

[SHORT ONLY] Consecutive Bars Above MA Strategy█ STRATEGY DESCRIPTION
The "Consecutive Bars Above MA Strategy" is a contrarian trading system aimed at exploiting overextended bullish moves in stocks and ETFs. It monitors the number of consecutive bars that close above a chosen short-term moving average (which can be either a Simple Moving Average or an Exponential Moving Average). Once the count reaches a preset threshold and the current bar’s close exceeds the previous bar’s high within a designated trading window, a short entry is initiated. An optional EMA filter further refines entries by requiring that the current close is below the 200-period EMA, helping to ensure that trades are taken in a bearish environment.
█ HOW ARE THE CONSECUTIVE BULLISH COUNTS CALCULATED?
The strategy utilizes a counter variable, `bullCount`, to track consecutive bullish bars based on their relation to the short-term moving average. Here’s how the count is determined:
Initialize the Counter
The counter is initialized at the start:
var int bullCount = na
Bullish Bar Detection
For each bar, if the close is above the selected moving average (either SMA or EMA, based on user input), the counter is incremented:
bullCount := close > signalMa ? (na(bullCount) ? 1 : bullCount + 1) : 0
Reset on Non-Bullish Condition
If the close does not exceed the moving average, the counter resets to zero, indicating a break in the consecutive bullish streak.
█ SIGNAL GENERATION
1. SHORT ENTRY
A short signal is generated when:
The number of consecutive bullish bars (i.e., bars closing above the short-term MA) meets or exceeds the defined threshold (default: 3).
The current bar’s close is higher than the previous bar’s high.
The signal occurs within the specified trading window (between Start Time and End Time).
Additionally, if the EMA filter is enabled, the entry is only executed when the current close is below the 200-period EMA.
2. EXIT CONDITION
An exit signal is triggered when the current close falls below the previous bar’s low, prompting the strategy to close the short position.
█ ADDITIONAL SETTINGS
Threshold: The number of consecutive bullish bars required to trigger a short entry (default is 3).
Trading Window: The Start Time and End Time inputs define when the strategy is active.
Moving Average Settings: Choose between SMA and EMA, and set the MA length (default is 5), which is used to assess each bar’s bullish condition.
EMA Filter (Optional): When enabled, this filter requires that the current close is below the 200-period EMA, supporting entries in a downtrend.
█ PERFORMANCE OVERVIEW
This strategy is designed for stocks and ETFs and can be applied across various timeframes.
It seeks to capture mean reversion by shorting after a series of bullish bars suggests an overextended move.
The approach employs a contrarian short entry by waiting for a breakout (close > previous high) following consecutive bullish bars.
The adjustable moving average settings and optional EMA filter allow for further optimization based on market conditions.
Comprehensive backtesting is recommended to fine-tune the threshold, moving average parameters, and filter settings for optimal performance.
