Range Trading StrategyOVERVIEW
The Range Trading Strategy is a systematic trading approach that identifies price ranges
from higher timeframe candles or trading sessions, tracks pivot points, and generates
trading signals when range extremes are mitigated and confirmed by pivot levels.
CORE CONCEPT
The strategy is based on the principle that when a candle (or session) closes within the
range of the previous candle (or session), that previous candle becomes a "range" with
identifiable high and low extremes. When price breaks through these extremes, it creates
trading opportunities that are confirmed by pivot levels.
RANGE DETECTION MODES
1. HTF (Higher Timeframe) Mode:
Automatically selects a higher timeframe based on the current chart timeframe
Uses request.security() to fetch HTF candle data
Range is created when an HTF candle closes within the previous HTF candle's range
The previous HTF candle's high and low become the range extremes
2. Sessions Mode:
- Divides the trading day into 4 sessions (UTC):
* Session 1: 00:00 - 06:00 (6 hours)
* Session 2: 06:00 - 12:00 (6 hours)
* Session 3: 12:00 - 20:00 (8 hours)
* Session 4: 20:00 - 00:00 (4 hours, spans midnight)
- Tracks high, low, and close for each session
- Range is created when a session closes within the previous session's range
- The previous session's high and low become the range extremes
PIVOT DETECTION
Pivots are detected based on candle color changes (bullish/bearish transitions):
1. Pivot Low:
Created when a bullish candle appears after a bearish candle
Pivot low = minimum of the current candle's low and previous candle's low
The pivot bar is the actual bar where the low was formed (current or previous bar)
2. Pivot High:
Created when a bearish candle appears after a bullish candle
Pivot high = maximum of the current candle's high and previous candle's high
The pivot bar is the actual bar where the high was formed (current or previous bar)
IMPORTANT: There is always only ONE active pivot high and ONE active pivot low at any
given time. When a new pivot is created, it replaces the previous one.
RANGE CREATION
A range is created when:
(HTF Mode) An HTF candle closes within the previous HTF candle's range AND a new HTF
candle has just started
(Sessions Mode) A session closes within the previous session's range AND a new session
has just started
Or Range Can Be Created when the Extreme of Another Range Gets Mitigated and We Have a Pivot low Just Above the Range Low or Pivot High just Below the Range High
Range Properties:
rangeHigh: The high extreme of the range
rangeLow: The low extreme of the range
highStartTime: The timestamp when the range high was actually formed (found by looping
backwards through bars)
lowStartTime: The timestamp when the range low was actually formed (found by looping
backwards through bars)
highMitigated / lowMitigated: Flags tracking whether each extreme has been broken
isSpecial: Flag indicating if this is a "special range" (see Special Ranges section)
RANGE MITIGATION
A range extreme is considered "mitigated" when price interacts with it:
High is mitigated when: high >= rangeHigh (any interaction at or above the level)
Low is mitigated when: low <= rangeLow (any interaction at or below the level)
Mitigation can happen:
At the moment of range creation (if price is already beyond the extreme)
At any point after range creation when price touches the extreme
SIGNAL GENERATION
1. Pending Signals:
When a range extreme is mitigated, a pending signal is created:
a) BEARISH Pending Signal:
- Triggered when: rangeHigh is mitigated
- Confirmation Level: Current pivotLow
- Signal is confirmed when: close < pivotLow
- Stop Loss: Current pivotHigh (at time of confirmation)
- Entry: Short position
Signal Confirmation
b) BULLISH Pending Signal:
- Triggered when: rangeLow is mitigated
- Confirmation Level: Current pivotHigh
- Signal is confirmed when: close > pivotHigh
- Stop Loss: Current pivotLow (at time of confirmation)
- Entry: Long position
IMPORTANT: There is only ever ONE pending bearish signal and ONE pending bullish signal
at any given time. When a new pending signal is created, it replaces the previous one
of the same type.
2. Signal Confirmation:
- Bearish: Confirmed when price closes below the pivot low (confirmation level)
- Bullish: Confirmed when price closes above the pivot high (confirmation level)
- Upon confirmation, a trade is entered immediately
- The confirmation line is drawn from the pivot bar to the confirmation bar
TRADE EXECUTION
When a signal is confirmed:
1. Position Management:
- Any existing position in the opposite direction is closed first
- Then the new position is entered
2. Stop Loss:
- Bearish (Short): Stop at pivotHigh
- Bullish (Long): Stop at pivotLow
3. Take Profit:
- Calculated using Risk:Reward Ratio (default 2:1)
- Risk = Distance from entry to stop loss
- Target = Entry ± (Risk × R:R Ratio)
- Can be disabled with "Stop Loss Only" toggle
4. Trade Comments:
- "Range Bear" for short trades
- "Range Bull" for long trades
SPECIAL RANGES
Special ranges are created when:
- A range high is mitigated AND the current pivotHigh is below the range high
- A range low is mitigated AND the current pivotLow is above the range low
In these cases:
- The pivot value is stored in an array (storedPivotHighs or storedPivotLows)
- A "special range" is created with only ONE extreme:
* If pivotHigh < rangeHigh: Creates a range with rangeHigh = pivotLow, rangeLow = na
* If pivotLow > rangeLow: Creates a range with rangeLow = pivotHigh, rangeHigh = na
- Special ranges can generate signals just like normal ranges
- If a special range is mitigated on the creation bar or the next bar, it is removed
entirely without generating signals (prevents false signals)
Special Ranges
REVERSE ON STOP LOSS
When enabled, if a stop loss is hit, the strategy automatically opens a trade in the
opposite direction:
1. Long Stop Loss Hit:
- Detects when: position_size > 0 AND position_size <= 0 AND low <= longStopLoss
- Action: Opens a SHORT position
- Stop Loss: Current pivotHigh
- Trade Comment: "Reverse on Stop"
2. Short Stop Loss Hit:
- Detects when: position_size < 0 AND position_size >= 0 AND high >= shortStopLoss
- Action: Opens a LONG position
- Stop Loss: Current pivotLow
- Trade Comment: "Reverse on Stop"
The reverse trade uses the same R:R ratio and respects the "Stop Loss Only" setting.
VISUAL ELEMENTS
1. Range Lines:
- Drawn from the time when the extreme was formed to the mitigation point (or current
time if not mitigated)
- High lines: Blue (or mitigated color if mitigated)
- Low lines: Red (or mitigated color if mitigated)
- Style: SOLID
- Width: 1
2. Confirmation Lines:
- Drawn when a signal is confirmed
- Extends from the pivot bar to the confirmation bar
- Bearish: Red, solid line
- Bullish: Green, solid line
- Width: 1
- Can be toggled on/off
STRATEGY SETTINGS
1. Range Detection Mode:
- HTF: Uses higher timeframe candles
- Sessions: Uses trading session boundaries
2. Auto HTF:
- Automatically selects HTF based on current chart timeframe
- Can be disabled to use manual HTF selection
3. Risk:Reward Ratio:
- Default: 2.0 (2:1)
- Minimum: 0.5
- Step: 0.5
4. Stop Loss Only:
- When enabled: Trades only have stop loss (no take profit)
- Trades close on stop loss or when opposite signal confirms
5. Reverse on Stop Loss:
- When enabled: Hitting a stop loss opens opposite trade with stop at opposing pivot
6. Max Ranges to Display:
- Limits the number of ranges kept in memory
- Oldest ranges are purged when limit is exceeded
KEY FEATURES
1. Dynamic Pivot Tracking:
- Pivots update on every candle color change
- Always maintains one high and one low pivot
2. Range Lifecycle:
- Ranges are created when price closes within previous range
- Ranges are tracked until mitigated
- Mitigation creates pending signals
- Signals are confirmed by pivot levels
3. Signal Priority:
- Only one pending signal of each type at a time
- New signals replace old ones
- Confirmation happens on close of bar
4. Position Management:
- Closes opposite positions before entering new trades
- Tracks stop loss levels for reverse functionality
- Respects pyramiding = 1 (only one position per direction)
5. Time-Based Drawing:
- Uses time coordinates instead of bar indices for line drawing
- Prevents "too far from current bar" errors
- Lines can extend to any historical point
USAGE NOTES
- Best suited for trending and ranging markets
- Works on any timeframe, but HTF mode adapts automatically
- Sessions mode is ideal for intraday trading
- Pivot detection requires clear candle color changes
- Range detection requires price to close within previous range
- Signals are generated on bar close, not intra-bar
The strategy combines range identification, pivot tracking, and signal confirmation to
create a systematic approach to trading breakouts and reversals based on price structure, past performance does not in any way predict future performance
Cari dalam skrip untuk "track"

Pressure Pivots - MPI (Strategy)⇋ PRESSURE PIVOTS — MARKET PRESSURE INDEX STRATEGY
A comprehensive reversal trading system that combines order flow pressure analysis, multi-factor confluence detection, and adaptive machine learning to identify high-probability turning points in liquid markets.
━━━━━━━━━━━━━━━━━━━━━━━━━━━━━━━━━━━━━
CORE INNOVATION: MARKET PRESSURE INDEX (MPI)
Traditional indicators measure price movement. The Market Pressure Index measures the force behind the movement.
How MPI Works:
Every bar tells two stories through volume distribution:
• Buy Pressure: Volume × (Close - Low) / (High - Low)
• Sell Pressure: Volume × (High - Close) / (High - Low)
• Net Pressure: Buy Pressure - Sell Pressure
This raw pressure is then normalized against baseline activity to create the bounded MPI (-1.0 to +1.0):
• Smooth Pressure: EMA(Net Pressure, period)
• Baseline Activity: SMA(|Net Pressure|, period × 2)
• MPI: (Smooth Pressure / Baseline) × Sensitivity
What MPI Reveals:
MPI > +0.7: Extreme buy pressure → Exhaustion potential
MPI = +0.2 to +0.7: Healthy bullish momentum
MPI = -0.2 to +0.2: Neutral/balanced pressure
MPI = -0.7 to -0.2: Healthy bearish momentum
MPI < -0.7: Extreme sell pressure → Exhaustion potential
Why It Works:
Two bars can both move 10 points, but if one closes at the high on high volume (aggressive buying) and the other closes mid-range on average volume (weak buying), only MPI distinguishes between sustainable momentum and exhaustion. This volume-weighted pressure analysis reveals conviction behind price moves—the key to timing reversals.
━━━━━━━━━━━━━━━━━━━━━━━━━━━━━━━━━━━━━
SEVEN-FACTOR CONFLUENCE SYSTEM
MPI extremes alone aren't enough. The system requires multiple independent confirmations through weighted scoring:
1. DIVERGENCE (Weight: 3.0) — Premium Signal Type: DIV
Price makes new high but MPI makes lower high (or inverse for bullish)
• Detection: Tracks pivots with 5-bar lookback, compares price vs MPI at pivot points
• Signal: Purple triangles, highest weight (pressure weakening while price extends)
2. LIQUIDITY SWEEP (Weight: 2.5) — Premium Signal Type: LIQ
Price breaks swing high/low within 0.3 ATR then reverses
• Detection: Break within tolerance + close back through level
• Signal: Orange triangles, second-highest weight (stop hunt reversal)
3. ORDER FLOW IMBALANCE (Weight: 2.0) — Premium Signal Type: OF
Aggressive buying/selling 50% above normal
• Detection: EMA(aggressive volume) vs SMA(imbalance) threshold
• Signal: Aqua triangles, institutional positioning
4. VELOCITY EXHAUSTION (Weight: 1.5)
Parabolic move (2+ ATRs in 3 bars) + extreme MPI
• Detection: |3-bar price change / ATR| > threshold + MPI > ±0.5
• Indicates: Momentum deceleration, blow-off top/bottom
5. WICK REJECTION (Weight: 1.5)
Single bar: wick > 60% of range, or sequence: 2 bars with 40% + 30% wicks
• Detection: Shooting stars (bearish) or hammers (bullish)
• Indicates: Intrabar rejection, battle won by opposing side
6. VOLUME SPIKE (Weight: 1.0)
Volume > 20-bar average × multiplier (default: 2.0x)
• Detection: Participation surge confirmation
• Lowest weight: Can be manipulated, better as confirmation
7. POSITION FACTOR (Weight: 1.0)
At 10-bar highest (bearish) or lowest (bullish)
• Detection: Structural positioning for reversal
• Base requirement: Must be at extreme to score
Scoring Logic:
Premium Signals (DIV/LIQ/OF): Must score ≥6.0 (default premiumThreshold)
Standard Signals (STD): Must score ≥4.0 (default standardThreshold)
Example Scoring:
Divergence (3.0) + Liquidity Sweep (2.5) + Volume (1.0) = 6.5 → FIRES (DIV signal)
Recent High (1.0) + Wick (1.5) + Volume (1.0) + Velocity (1.5) = 5.0 → FIRES (STD signal)
━━━━━━━━━━━━━━━━━━━━━━━━━━━━━━━━━━━━━
ADAPTIVE LEARNING ENGINE
Unlike static strategies, this system learns from every trade and optimizes itself.
Performance Tracking:
Every trade records:
• Entry Score: Confluence level at entry
• Signal Type: DIV / LIQ / OF / STD
• Win/Loss: Boolean outcome
• R-Multiple: (Exit - Entry) / (Entry - Stop)
• MAE: Maximum Adverse Excursion (worst drawdown)
• MFE: Maximum Favorable Excursion (best profit reached)
Three Adaptive Parameters:
1. Signal Threshold Adaptation
If Win Rate < Target (45%): RAISE threshold → fewer signals, better quality
If Win Rate > Target + 10% AND good R: LOWER threshold → more signals, profitable
2. Stop Distance Adaptation
If Avg MAE > 0.85 AND WR < 50%: WIDEN stops → reduce premature exits
If Avg MAE < 0.4 AND WR > 55%: TIGHTEN stops → reduce risk
3. Target Distance Adaptation
If Avg MFE > Target × 1.5: EXTEND targets → capture more of runners
If Avg MFE < Target × 0.7: SHORTEN targets → take profits faster
Signal Type Filtering:
The system tracks performance by type (DIV/LIQ/OF/STD):
• If Type WR < 40% AND Avg R < 0.8: Type DISABLED
• If Type WR ≥ 40% OR Avg R ≥ 0.8: Type RE-ENABLED
Example: If OF signals consistently lose while DIV signals win, system automatically stops taking OF signals and focuses on DIV.
Warmup Period:
First 30 trades (default) gather baseline data with relaxed thresholds. After warmup, full adaptation activates.
━━━━━━━━━━━━━━━━━━━━━━━━━━━━━━━━━━━━━
COMPLETE POSITION MANAGEMENT
Dynamic Position Sizing:
Base Contracts = (Equity × Risk%) / (Stop Distance × Point Value)
Then multiplied by:
• Score Bonus: Up to +50% for highest-scoring signals
• Signal Type Bonus: DIV signals +50%, LIQ signals +30%
• Streak Multiplier: After 3 losses: 50% reduction, After 3 wins: 25% increase
Example: High-scoring DIV signal on winning streak = 3-4× larger position than weak STD signal on losing streak
Entry Modes:
Single Entry: Full size at once, exit at TP2 (or partial at TP1)
Tiered Entry: 40% at TP1 (2R), 60% at TP2 (4R adaptive)
Stop Management (3 Modes):
Structural: Beyond recent 20-bar swing high/low + buffer
ATR: Fixed ATR multiplier (default: 2.0 ATR, then adapts)
Hybrid: Attempt structural, fallback to ATR if invalid
Plus:
• Breakeven: Move stop to entry ± 1 tick when 1R reached
• Trailing: Activate when 1.5R reached, trail 0.8R behind price
• Max Loss Override: Cap dollar risk regardless of calculation
Target Management:
Fixed Mode: TP1 = 2R, TP2 = 4R
Adaptive Mode: TP1 = 2R fixed, TP2 adapts based on MFE analysis
Partial Exits: Default 50% at TP1, remainder at TP2 or trailing stop
━━━━━━━━━━━━━━━━━━━━━━━━━━━━━━━━━━━━━
COMPREHENSIVE RISK CONTROLS
Daily Limits:
• Max Daily Loss: $2,000 default → HALT trading
• Max Daily Trades: 15 default → prevent overtrading
• Max Concurrent: 2 positions → limit correlation risk
Session Controls:
• Trading Hours: Specify start/end times + timezone
• Weekend Block: Optional (avoid crypto weekend volatility)
Prop Firm Protection (Live Trading Only):
• Daily Loss Limit: Stricter of general or prop limit ($1,000 default)
• Trailing Drawdown: Tracks high water mark, HALTS if breach ($2,500 default)
• Reset on Reload: Optional high water mark reset
Liquidity Filter (Optional):
• Time-Based: Avoid first/last X minutes of session
• Volume-Based: Require minimum volume ratio (0.5× average default)
Market Regime Filter (Optional):
• ADX-Based: Only trade when ADX > threshold (trending)
• Block: Consolidation (ADX < 20) or Transitional regimes
━━━━━━━━━━━━━━━━━━━━━━━━━━━━━━━━━━━━━
REAL-TIME DASHBOARD
MPI Gauge Section:
Shows current pressure: 🟢 STRONG BUY (+0.5 to +1.0), 🟩 BUY PRESSURE (+0.2 to +0.5), ⚪ NEUTRAL (-0.2 to +0.2), 🟥 SELL PRESSURE (-0.5 to -0.2), 🔴 STRONG SELL (-1.0 to -0.5)
Signal Status Section:
• Active Signals: "🔴 DIV SELL" (purple background), "🟢 LIQ BUY" (orange), "🔵 OF SELL" (aqua), "🟢 STD BUY" (green)
• Warnings: "⚠️ BEAR WARNING" / "⚠️ BULL WARNING" (yellow) — setup forming, not full signal
• Scanning: "⏳ SCANNING..." (gray) — no signal active
• Confidence Bar: Visual score display "██████░░░░" showing confluence strength
Divergence Indicator:
"🟣 BEARISH DIVERGENCE" or "🟡 BULLISH DIVERGENCE" when detected
Performance Statistics:
• Overall Win Rate: Wins/Total with visual bar (lime ≥70%, yellow 50-70%, red <50%)
• Directional: Bearish vs Bullish win rates separately
• By Signal Type: DIV / LIQ / OF / STD individual performance tracking
━━━━━━━━━━━━━━━━━━━━━━━━━━━━━━━━━━━━━
KEY PARAMETERS EXPLAINED
🎯 Pressure Engine:
• MPI Period (5-50, default: 14): Smoothing period — lower for scalping, higher for position trading
• MPI Sensitivity (0.5-5.0, default: 1.5): Amplification — lower compresses range, higher more extremes
🔍 Detection:
• Wick Threshold (0.3-0.9, default: 0.6): Minimum wick-to-range ratio for rejection
• Volume Spike (1.2-3.0x, default: 2.0): Multiplier above average for spike
• Aggressive Ratio (0.5-0.9, default: 0.65): Close position in range for aggressive orders
• Velocity Threshold (1.0-5.0 ATR, default: 2.0): ATR-normalized move for exhaustion
• MPI Extreme (0.5-0.95, default: 0.7): Level considered overbought/oversold
⚖️ Weights:
• Divergence: 3.0 (highest — pressure weakening)
• Liquidity: 2.5 (second — stop hunts)
• Order Flow: 2.0 (institutional positioning)
• Velocity: 1.5 (momentum exhaustion)
• Wick: 1.5 (rejection patterns)
• Volume: 1.0 (lowest — can be manipulated)
🎚️ Thresholds:
• Premium (4.0-15.0, default: 6.0): Score for DIV/LIQ/OF signals
• Standard (2.0-8.0, default: 4.0): Score for STD signals
• Warning Confluence (1-4, default: 2): Factors for yellow diamond warnings
🧬 Adaptive:
• Enable (true/false, default: true): Master learning switch
• Warmup Trades (5-100, default: 30): Data collection before adaptation
• Lookback (20-200, default: 50): Recent trades for performance calculation
• Adapt Speed (0.05-0.50, default: 0.15): Parameter adjustment rate
• Target Win Rate (30-70%, default: 45%): Optimization goal
• Target R-Multiple (0.5-5.0, default: 1.5): Risk/reward goal
💼 Position:
• Base Risk (0.1-10.0%, default: 1.5%): Equity risked per trade
• Max Contracts (1-100, default: 10): Hard position limit
• DIV Bonus (1.0-3.0x, default: 1.5): Size multiplier for divergence signals
• LIQ Bonus (1.0-3.0x, default: 1.3): Size multiplier for liquidity signals
🛡️ Stops:
• Mode (Structural/ATR/Hybrid, default: ATR): Stop placement method
• ATR Multiplier (0.5-5.0, default: 2.0): Stop distance in ATRs (adapts)
• Breakeven at (0.3-3.0R, default: 1.0R): When to move stop to entry
• Trail Trigger (0.5-5.0R, default: 1.5R): When to activate trailing
• Trail Offset (0.3-3.0R, default: 0.8R): Distance behind price
🎯 Targets:
• Mode (Fixed/Adaptive, default: Fixed): Target placement method
• TP1 (0.5-10.0R, default: 2.0R): First target for partial exit
• TP2 (1.0-15.0R, default: 4.0R): Final target (adapts in adaptive mode)
• Partial % (0-100%, default: 50%): Position percentage to exit at TP1
━━━━━━━━━━━━━━━━━━━━━━━━━━━━━━━━━━━━━
PROFESSIONAL USAGE PROTOCOL
Phase 1: Paper Trading (Weeks 1-4)
• Setup: Default settings, all adaptive features ON, 0.5% base risk
• Goal: 30+ trades for warmup, observe MPI behavior and signal frequency
• Adjust: MPI sensitivity if stuck near neutral or always at extremes
• Threshold: Raise/lower if too many/few signals
Phase 2: Micro Live (Weeks 5-8)
• Requirements: WR >43%, at least one type >55%, Avg R >0.8
• Setup: 10-25% intended size, 0.5-1.0% risk, 1 position max
• Focus: Execution quality, match dashboard performance
• Journal: Screenshot every signal, track outcomes
Phase 3: Full Scale (Month 3+)
• Requirements: WR >45% over 50+ trades, Avg R >1.2, drawdown <15%
• Progression: Months 3-4 (1.0-1.5% risk), 5-6 (1.5-2.0%), 7+ (1.5-2.5%)
• Maintenance: Weekly dashboard review, monthly deep analysis
• Warnings: Reduce size if WR drops >10%, consecutive losses >7, or drawdown >20%
━━━━━━━━━━━━━━━━━━━━━━━━━━━━━━━━━━━━━
DEVELOPMENT INSIGHTS
The Pressure Insight: Emerged from analyzing intrabar volume distribution. Within every candlestick, volume accumulates at different price levels. MPI deconstructs this to reveal conviction behind moves.
The Confluence Challenge: Early versions using MPI extremes alone achieved only 42% win rate. The seven-factor confluence system emerged from testing which combinations produced reliable reversals. Divergence + liquidity sweep became the strongest setup (68% win rate in isolation).
The Adaptive Breakthrough: Per-signal-type performance tracking revealed DIV signals winning at 71% while OF signals languished at 38%. Adaptive filtering disabled weak types automatically, recovering win rate from 39% to 54% during the 2022 volatility spike.
The Position Sizing Revelation: Dynamic sizing based on signal quality and recent performance increased Sharpe ratio from 1.2 to 1.9 while decreasing max drawdown from 18% to 12% over 500 trades. Bigger positions on better signals = geometric edge amplification.
The Risk Control Lesson: Testing with $50K accounts revealed catastrophic failure modes: daily loss cascades, overtrading commission bleed, weekend gap blowouts. Multi-layer controls (daily limits, concurrent caps, prop firm protection) became essential.
━━━━━━━━━━━━━━━━━━━━━━━━━━━━━━━━━━━━━
LIMITATIONS & ASSUMPTIONS
What This Is NOT:
• NOT a Holy Grail: Typical performance 52-58% WR, 1.3-1.8 avg R, probabilistic edge
• NOT Predictive: Identifies high-probability conditions, doesn't forecast prices
• NOT Market-Agnostic: Best on liquid auction-driven markets (futures, forex, major crypto)
• NOT Hands-Off: Requires oversight for news events, gaps, system anomalies
• NOT Immune to Regime Changes: Adaptive engine helps but cannot predict black swans
Critical Assumptions:
1. Volume reflects intent (valid for regulated markets, violated by wash trading)
2. Pressure extremes mean-revert (true in ranging/exhaustion, fails in paradigm shifts)
3. Stop hunts exist (valid in liquid markets, less in thin/random walk periods)
4. Past patterns persist (valid in stable regimes, fails when structure fundamentally changes)
Works Best On: Major futures (ES, NQ, CL), liquid forex pairs (EUR/USD, GBP/USD), large-cap stocks, BTC
Performs Poorly On: Low-volume stocks, illiquid crypto pairs, news-driven headline events
━━━━━━━━━━━━━━━━━━━━━━━━━━━━━━━━━━━━━
RISK DISCLOSURE
Trading futures, forex, and leveraged instruments involves substantial risk of loss and is not suitable for all investors. Past performance is not indicative of future results. This strategy is provided for educational purposes only and should not be construed as financial advice.
The adaptive engine learns from historical data—there is no guarantee that past relationships will persist. Market conditions change, volatility regimes shift, and black swan events occur. No strategy can eliminate the risk of loss.
Users must validate performance on their specific instruments and timeframes before risking capital. The developer makes no warranties regarding profitability or suitability. Users assume all responsibility for trading decisions and outcomes.
"The market doesn't care about your indicators. It only cares about pressure—who's willing to pay more, who's desperate to sell. Find the exhaustion. Trade the reversal. Let the system learn the rest."
Taking you to school. — Dskyz, Trade with insight. Trade with anticipation.

ATH대비 지정하락률에 도착 시 매수 - 장기홀딩 선물 전략(ATH Drawdown Re-Buy Long Only)본 스크립트는 과거 하락 데이터를 이용하여, 정해진 하락 %가 발생하는 경우 자기 자본의 정해진 %만큼을 진입하게 설계되어진 스트레티지입니다.
레버리지를 사용할 수 있으며 기본적으로 셋팅해둔 값이 내장되어있습니다.(자유롭게 바꿔서 쓰시면 됩니다.) 추가적으로 2번의 진입 외에도 다른 진입 기준, 진입 %를 설정하실 수 있으며 - ChatGPT에게 요청하면 수정해줄 것입니다.
실제 사용용도로는 KillSwitch 기능을 꺼주세요. 바 돋보기 기능을 켜주세요.
ATH Drawdown Re-Buy Long Only 전략 설명
1. 전략 개요
ATH Drawdown Re-Buy Long Only 전략은 자산의 역대 최고가(ATH, All-Time High)를 기준으로 한 하락폭(드로우다운)을 활용하여,
특정 구간마다 단계적으로 롱 포지션을 구축하는 자동 재매수(Long Only) 전략입니다.
본 전략은 다음과 같은 목적을 가지고 설계되었습니다.
급격한 조정 구간에서 체계적인 분할 매수 및 레버리지 활용
ATH를 기준으로 한 명확한 진입 규칙 제공
실시간으로
평단가
레버리지
청산가 추정
계좌 MDD
수익률
등을 시각적으로 제공하여 리스크와 포지션 상태를 직관적으로 확인할 수 있도록 지원
※ 본 전략은 교육·연구·백테스트 용도로 제공되며,
어떠한 형태의 투자 권유 또는 수익을 보장하지 않습니다.
2. 전략의 핵심 개념
2-1. ATH(역대 최고가) 기준 드로우다운
전략은 차트 상에서 항상 가장 높은 고가(High)를 ATH로 기록합니다.
새로운 고점이 형성될 때마다 ATH를 갱신하고, 해당 ATH를 기준으로 다음을 계산합니다.
현재 바의 저가(Low)가 ATH에서 몇 % 하락했는지
현재 바의 종가(Close)가 ATH에서 몇 % 하락했는지
그리고 사전에 설정한 두 개의 드로우다운 구간에서 매수를 수행합니다.
1차 진입 구간: ATH 대비 X% 하락 시
2차 진입 구간: ATH 대비 Y% 하락 시
각 구간은 ATH가 새로 갱신될 때마다 한 번씩만 작동하며,
새로운 ATH가 생성되면 다시 “1차 / 2차 진입 가능 상태”로 초기화됩니다.
2-2. 첫 포지션 100% / 300% 특수 규칙
이 전략의 중요한 특징은 **“첫 포지션 진입 시의 예외 규칙”**입니다.
전략이 현재 어떠한 포지션도 들고 있지 않은 상태에서
최초로 롱 포지션을 진입하는 시점(첫 포지션)에 대해:
기본적으로는 **자산의 100%**를 기준으로 포지션을 구축하지만,
만약 그 순간의 가격이 ATH 대비 설정값 이상(예: 약 –72.5% 이상 하락한 상황) 이라면
→ 자산의 300% 규모로 첫 포지션을 진입하도록 설계되어 있습니다.
이 규칙은 다음과 같이 동작합니다.
첫 진입이 1차 드로우다운 구간에서 발생하든,
첫 진입이 2차 드로우다운 구간에서 발생하든,
현재 하락폭이 설정된 기준 이상(예: –72.5% 이상) 이라면
→ “이 정도 하락이면 첫 진입부터 더 공격적으로 들어간다”는 의미로 300% 규모로 진입
그 이하의 하락폭이라면
→ 첫 진입은 100% 규모로 제한
즉, 전략은 다음 두 가지 모드로 동작합니다.
일반적인 상황의 첫 진입: 자산의 100%
심각한 드로우다운 구간에서의 첫 진입: 자산의 300%
이 특수 규칙은 깊은 하락에서는 공격적으로, 평소에는 상대적으로 보수적으로 진입하도록 설계된 것입니다.
3. 전략 동작 구조
3-1. 매수 조건
차트 상 High 기준으로 ATH를 추적합니다.
각 바마다 해당 ATH에서의 하락률을 계산합니다.
사용자가 설정한 두 개의 드로우다운 구간(예시):
1차 구간: 예를 들어 ATH – 50%
2차 구간: 예를 들어 ATH – 72.5%
각 구간에 대해 다음과 같은 조건을 확인합니다.
“이번 ATH 구간에서 아직 해당 구간 매수를 한 적이 없는 상태”이고,
현재 바의 저가(Low)가 해당 구간 가격 이하를 찍는 순간
→ 해당 바에서 매수 조건 충족으로 간주
실제 주문은:
해당 구간 가격에 맞춰 롱 포지션 진입(리밋/시장가 기반 시뮬레이션) 으로 처리됩니다.
3-2. ATH 갱신과 진입 기회 리셋
차트 상에서 새로운 고점(High)이 기존 ATH를 넘어서는 순간,
ATH가 갱신되고,
1차 / 2차 진입 여부를 나타내는 내부 플래그가 초기화됩니다.
이를 통해, 시장이 새로운 고점을 돌파해 나갈 때마다,
해당 구간에서 다시 한 번씩 1차·2차 드로우다운 진입 기회를 갖게 됩니다.
4. 포지션 사이징 및 레버리지
4-1. 계좌 자산(Equity) 기준 포지션 크기 결정
전략은 현재 계좌 자산을 다음과 같이 정의하여 사용합니다.
현재 자산 = 초기 자본 + 실현 손익 + 미실현 손익
각 진입 구간에서의 포지션 가치는 다음과 같이 결정됩니다.
1차 진입 구간:
“자산의 몇 %를 사용할지”를 설정값으로 입력
설정된 퍼센트를 계좌 자산에 곱한 뒤,
다시 전략 내 레버리지 배수(Leverage) 를 곱하여 실제 포지션 가치를 계산
2차 진입 구간:
동일한 방식으로, 독립된 퍼센트 설정값을 사용
즉, 포지션 가치는 다음과 같이 계산됩니다.
포지션 가치 = 현재 자산 × (해당 구간 설정 % / 100) × 레버리지 배수
그리고 이를 해당 구간의 진입 가격으로 나누어 실제 수량(토큰 단위) 를 산출합니다.
4-2. 첫 포지션의 예외 처리 (100% / 300%)
첫 포지션에 대해서는 위의 일반적인 퍼센트 설정 대신,
다음과 같은 고정 비율이 사용됩니다.
기본: 자산의 100% 규모로 첫 포지션 진입
단, 진입 시점의 ATH 대비 하락률이 설정값 이상(예: –72.5% 이상) 일 경우
→ 자산의 300% 규모로 첫 포지션 진입
이때 역시 다음 공식을 사용합니다.
포지션 가치 = 현재 자산 × (100% 또는 300%) × 레버리지
그리고 이를 가격으로 나누어 실제 진입 수량을 계산합니다.
이 규칙은:
첫 진입이 1차 구간이든 2차 구간이든 동일하게 적용되며,
“충분히 깊은 하락 구간에서는 첫 진입부터 더 크게,
평소에는 비교적 보수적으로” 라는 운용 철학을 반영합니다.
4-3. 실레버리지(Real Leverage)의 추적
전략은 각 바 단위로 다음을 추적합니다.
바가 시작할 때의 기존 포지션 크기
해당 바에서 새로 진입한 수량
이를 바탕으로, 진입이 발생한 시점에 다음을 계산합니다.
실제 레버리지 = (포지션 가치 / 현재 자산)
그리고 차트 상에 예를 들어:
Lev 2.53x 와 같은 형식의 레이블로 표시합니다.
이를 통해, 매수 시점마다 실제 계좌 레버리지가 어느 정도였는지를 직관적으로 확인할 수 있습니다.
5. 시각화 및 모니터링 요소
5-1. 차트 상 시각 요소
전략은 차트 위에 다음과 같은 정보를 직접 표시합니다.
ATH 라인
High 기준으로 계산된 역대 최고가를 주황색 선으로 표시
평단가(평균 진입가) 라인
현재 보유 포지션이 있을 때,
해당 포지션의 평균 진입가를 노란색 선으로 표시
추정 청산가(고정형 청산가) 라인
포지션 수량이 변화하는 시점을 감지하여,
당시의 평단가와 실제 레버리지를 이용해 근사적인 청산가를 계산
이를 빨간색 선으로 차트에 고정 표시
포지션이 없거나 레버리지가 1배 이하인 경우에는 청산가 라인을 제거
매수 마커 및 레이블
1차/2차 매수 조건이 충족될 때마다 해당 지점에 매수 마커를 표시
"Buy XX% @ 가격", "Lev XXx" 형태의 라벨로
진입 비율과 당시 레버리지를 함께 시각화
레이블의 위치는 설정에서 선택 가능:
바 아래 (Below Bar)
바 위 (Above Bar)
실제 가격 위치 (At Price)
5-2. 우측 상단 정보 테이블
차트 우측 상단에는 현재 계좌·포지션 상태를 요약한 정보 테이블이 표시됩니다.
대표적으로 다음 항목들이 포함됩니다.
Pos Qty (Token)
현재 보유 중인 포지션 수량(토큰 기준, 절대값 기준)
Pos Value (USDT)
현재 포지션의 시장 가치 (수량 × 현재 가격)
Leverage (Now)
현재 실레버리지 (포지션 가치 / 현재 자산)
DD from ATH (%)
현재 가격 기준, 최근 ATH에서의 하락률(%)
Avg Entry
현재 포지션의 평균 진입 가격
PnL (%)
현재 포지션 기준 미실현 손익률(%)
Max DD (Equity %)
전략 전체 기간 동안 기록된 계좌 기준 최대 손실(MDD, Max Drawdown)
Last Entry Price
가장 최근에 포지션을 추가로 진입한 직후의 평균 진입 가격
Last Entry Lev
위 “Last Entry Price” 시점에서의 실레버리지
Liq Price (Fixed)
위에서 설명한 고정형 추정 청산가
Return from Start (%)
전략 시작 시점(초기 자본) 대비 현재 계좌 자산의 총 수익률(%)
이 테이블을 통해 사용자는:
현재 계좌와 포지션의 상태
리스크 수준
누적 성과
를 직관적으로 파악할 수 있습니다.
6. 시간 필터 및 라벨 옵션
6-1. 전략 동작 기간 설정
전략은 옵션으로 특정 기간에만 전략을 동작시키는 시간 필터를 제공합니다.
“Use Date Range” 옵션을 활성화하면:
시작 시각과 종료 시각을 지정하여
해당 구간에 한해서만 매매가 발생하도록 제한
옵션을 비활성화하면:
전략은 전체 차트 구간에서 자유롭게 동작
6-2. 진입 라벨 위치 설정
사용자는 매수/레버리지 라벨의 위치를 선택할 수 있습니다.
바 아래 (Below Bar)
바 위 (Above Bar)
실제 가격 위치 (At Price)
이를 통해 개인 취향 및 차트 가독성에 맞추어
시각화 방식을 유연하게 조정할 수 있습니다.
7. 활용 대상 및 사용 예시
본 전략은 다음과 같은 목적에 적합합니다.
현물 또는 선물 롱 포지션 기준 장기·스윙 관점 추매 전략 백테스트
“고점 대비 하락률”을 기준으로 한 규칙 기반 운용 아이디어 검증
레버리지 사용 시
계좌 레버리지·청산가·MDD를 동시에 모니터링하고자 하는 경우
특정 자산에 대해
“새로운 고점이 형성될 때마다
일정한 규칙으로 깊은 조정 구간에서만 분할 진입하고자 할 때”
실거래에 그대로 적용하기보다는,
전략 아이디어 검증 및 리스크 프로파일 분석,
자신의 성향에 맞는 파라미터 탐색 용도로 사용하는 것을 권장합니다.
8. 한계 및 유의사항
백테스트 결과는 미래 성과를 보장하지 않습니다.
과거 데이터에 기반한 시뮬레이션일 뿐이며,
실제 시장에서는
유동성
슬리피지
수수료 체계
강제청산 규칙
등 다양한 변수가 존재합니다.
청산가는 단순화된 공식에 따른 추정치입니다.
거래소별 실제 청산 규칙, 유지 증거금, 수수료, 펀딩비 등은
본 전략의 계산과 다를 수 있으며,
청산가 추정 라인은 참고용 지표일 뿐입니다.
레버리지 및 진입 비율 설정에 따라 손실 폭이 매우 커질 수 있습니다.
특히 **“첫 포지션 300% 진입”**과 같이 매우 공격적인 설정은
시장 급락 시 계좌 손실과 청산 리스크를 크게 증가시킬 수 있으므로
신중한 검토가 필요합니다.
실거래 연동 시에는 별도의 리스크 관리가 필수입니다.
개별 손절 기준
포지션 상한선
전체 포트폴리오 내 비중 관리 등
본 전략 외부에서 추가적인 안전장치가 필요합니다.
9. 결론
ATH Drawdown Re-Buy Long Only 전략은 단순한 “저가 매수”를 넘어서,
ATH 기준으로 드로우다운을 구조적으로 활용하고,
첫 포지션에 대한 **특수 규칙(100% / 300%)**을 적용하며,
레버리지·청산가·MDD·수익률을 통합적으로 시각화함으로써,
하락 구간에서의 규칙 기반 롱 포지션 구축과
리스크 모니터링을 동시에 지원하는 전략입니다.
사용자는 본 전략을 통해:
자신의 시장 관점과 리스크 허용 범위에 맞는
드로우다운 구간
진입 비율
레버리지 설정
다양한 시나리오에 대한 백테스트와 분석
을 수행할 수 있습니다.
다시 한 번 강조하지만,
본 전략은 연구·학습·백테스트를 위한 도구이며,
실제 투자 판단과 책임은 전적으로 사용자 본인에게 있습니다.
/ENG Version.
This script is designed to use historical drawdown data and automatically enter positions when a predefined percentage drop from the all-time high occurs, using a predefined percentage of your account equity.
You can use leverage, and default parameter values are provided out of the box (you can freely change them to suit your style).
In addition to the two main entry levels, you can add more entry conditions and custom entry percentages – just ask ChatGPT to modify the script.
For actual/live usage, please turn OFF the KillSwitch function and turn ON the Bar Magnifier feature.
ATH Drawdown Re-Buy Long Only Strategy
1. Strategy Overview
The ATH Drawdown Re-Buy Long Only strategy is an automatic re-buy (Long Only) system that builds long positions step-by-step at specific drawdown levels, based on the asset’s all-time high (ATH) and its subsequent drawdown.
This strategy is designed with the following goals:
Systematic scaled buying and leverage usage during sharp correction periods
Clear, rule-based entry logic using drawdowns from ATH
Real-time visualization of:
Average entry price
Leverage
Estimated liquidation price
Account MDD (Max Drawdown)
Return / performance
This allows traders to intuitively monitor both risk and position status.
※ This strategy is provided for educational, research, and backtesting purposes only.
It does not constitute investment advice and does not guarantee any profits.
2. Core Concepts
2-1. Drawdown from ATH (All-Time High)
On the chart, the strategy always tracks the highest high as the ATH.
Whenever a new high is made, ATH is updated, and based on that ATH the following are calculated:
How many percent the current bar’s Low is below the ATH
How many percent the current bar’s Close is below the ATH
Using these, the strategy executes buys at two predefined drawdown zones:
1st entry zone: When price drops X% from ATH
2nd entry zone: When price drops Y% from ATH
Each zone is allowed to trigger only once per ATH cycle.
When a new ATH is created, the “1st / 2nd entry possible” flags are reset, and new opportunities open up for that ATH leg.
2-2. Special Rule for the First Position (100% / 300%)
A key feature of this strategy is the special rule for the very first position.
When the strategy currently holds no position and is about to open the first long position:
Under normal conditions, it builds the position using 100% of account equity.
However, if at that moment the price has dropped by at least a predefined threshold from ATH (e.g. around –72.5% or more),
→ the strategy will open the first position using 300% of account equity.
This rule works as follows:
Whether the first entry happens at the 1st drawdown zone or at the 2nd drawdown zone,
If the current drawdown from ATH is at or below the threshold (e.g. –72.5% or worse),
→ the strategy interprets this as “a sufficiently deep crash” and opens the initial position with 300% of equity.
If the drawdown is less severe than the threshold,
→ the first entry is capped at 100% of equity.
So the strategy has two modes for the first entry:
Normal market conditions: 100% of equity
Deep drawdown conditions: 300% of equity
This special rule is intended to be aggressive in extremely deep crashes while staying more conservative in normal corrections.
3. Strategy Logic & Execution
3-1. Entry Conditions
The strategy tracks the ATH using the High price.
For each bar, it calculates the drawdown from ATH.
The user defines two drawdown zones, for example:
1st zone: ATH – 50%
2nd zone: ATH – 72.5%
For each zone, the strategy checks:
If no buy has been executed yet for that zone in the current ATH leg, and
If the current bar’s Low touches or falls below that zone’s price level,
→ That bar is considered to have triggered a buy condition.
Order simulation:
The strategy simulates entering a long position at that zone’s price level
(using a limit/market-like approximation for backtesting).
3-2. ATH Reset & Entry Opportunity Reset
When a new High goes above the previous ATH:
The ATH is updated to this new high.
Internal flags that track whether the 1st and 2nd entries have been used are reset.
This means:
Each time the market makes a new ATH,
The strategy once again has a fresh opportunity to execute 1st and 2nd drawdown entries for that new ATH leg.
4. Position Sizing & Leverage
4-1. Position Size Based on Account Equity
The strategy defines current equity as:
Current Equity = Initial Capital + Realized PnL + Unrealized PnL
For each entry zone, the position value is calculated as follows:
The user inputs:
“What % of equity to use at this zone”
The strategy:
Multiplies current equity by that percentage
Then multiplies by the strategy’s leverage factor
Thus:
Position Value = Current Equity × (Zone % / 100) × Leverage
Finally, this position value is divided by the entry price to determine the actual position size in tokens.
4-2. Exception for the First Position (100% / 300%)
For the very first position (when there is no open position),
the strategy does not use the zone % parameters. Instead, it uses fixed ratios:
Default: Enter the first position with 100% of equity.
If the drawdown from ATH at that moment is greater than or equal to a predefined threshold (e.g. –72.5% or more)
→ Enter the first position with 300% of equity.
The position value is computed as:
Position Value = Current Equity × (100% or 300%) × Leverage
Then it is divided by the entry price to obtain the token quantity.
This rule:
Applies regardless of whether the first entry occurs at the 1st zone or 2nd zone.
Embeds the philosophy:
“In very deep crashes, go much larger on the first entry; otherwise, stay more conservative.”
4-3. Tracking Real Leverage
On each bar, the strategy tracks:
The existing position size at the start of the bar
The newly added size (if any) on that bar
When a new entry occurs, it calculates the real leverage at that moment:
Real Leverage = (Position Value / Current Equity)
This is then displayed on the chart as a label, for example:
Lev 2.53x
This makes it easy to see the actual leverage level at each entry point.
5. Visualization & Monitoring
5-1. On-Chart Visual Elements
The strategy plots the following directly on the chart:
ATH Line
The all-time high (based on High) is plotted as an orange line.
Average Entry Price Line
When a position is open, the average entry price of that position is plotted as a yellow line.
Estimated Liquidation Price (Fixed) Line
The strategy detects when the position size changes.
At each size change, it uses the current average entry price and real leverage to compute an approximate liquidation price.
This “fixed liquidation price” is then plotted as a red line on the chart.
If there is no position, or if leverage is 1x or lower, the liquidation line is removed.
Entry Markers & Labels
When 1st/2nd entry conditions are met, the strategy:
Marks the entry point on the chart.
Displays labels such as "Buy XX% @ Price" and "Lev XXx",
showing both entry percentage and real leverage at that time.
The label placement is configurable:
Below Bar
Above Bar
At Price
5-2. Information Table (Top-Right Panel)
In the top-right corner of the chart, the strategy displays a summary table of the current account and position status. It typically includes:
Pos Qty (Token)
Absolute size of the current position (in tokens)
Pos Value (USDT)
Market value of the current position (qty × current price)
Leverage (Now)
Current real leverage (position value / current equity)
DD from ATH (%)
Current drawdown (%) from the latest ATH, based on current price
Avg Entry
Average entry price of the current position
PnL (%)
Unrealized profit/loss (%) of the current position
Max DD (Equity %)
The maximum equity drawdown (MDD) recorded over the entire backtest period
Last Entry Price
Average entry price immediately after the most recent add-on entry
Last Entry Lev
Real leverage at the time of the most recent entry
Liq Price (Fixed)
The fixed estimated liquidation price described above
Return from Start (%)
Total return (%) of equity compared to the initial capital
Through this table, users can quickly grasp:
Current account and position status
Current risk level
Cumulative performance
6. Time Filters & Label Options
6-1. Strategy Date Range Filter
The strategy provides an option to restrict trading to a specific time range.
When “Use Date Range” is enabled:
You can specify start and end timestamps.
The strategy will only execute trades within that range.
When this option is disabled:
The strategy operates over the entire chart history.
6-2. Entry Label Placement
Users can customize where entry/leverage labels are drawn:
Below Bar (Below Bar)
Above Bar (Above Bar)
At the actual price level (At Price)
This allows you to adjust visualization according to personal preference and chart readability.
7. Use Cases & Applications
This strategy is suitable for the following purposes:
Long-term / swing-style re-buy strategies for spot or futures long positions
Testing rule-based strategies that rely on “drawdown from ATH” as a main signal
Monitoring account leverage, liquidation price, and MDD when using leverage
Handling situations where, for a given asset:
“Every time a new ATH is formed,
you want to wait for deep corrections and enter only at specific drawdown zones”
It is generally recommended to use this strategy not as a direct plug-and-play live system, but as a tool for:
Strategy idea validation
Risk profile analysis
Parameter exploration to match your personal risk tolerance and style
8. Limitations & Warnings
Backtest results do not guarantee future performance.
They are based on historical data only.
In live markets, additional factors exist:
Liquidity
Slippage
Fee structures
Exchange-specific liquidation rules
Funding fees, etc.
The liquidation price is only an approximate estimate, derived from a simplified formula.
Actual liquidation rules, maintenance margin requirements, fees, and other details differ by exchange.
The liquidation line should be treated as a reference indicator, not an exact guarantee.
Depending on the configured leverage and entry percentages, losses can be very large.
In particular, extremely aggressive settings such as “first position 300% of equity” can greatly increase the risk of large account drawdowns and liquidation during sharp market crashes.
Use such settings with extreme caution.
For live trading, additional risk management is essential:
Your own stop-loss rules
Maximum position size limits
Portfolio-level exposure controls
And other external safety mechanisms beyond this strategy
9. Conclusion
The ATH Drawdown Re-Buy Long Only strategy goes beyond simple “buy the dip” logic. It:
Systematically utilizes drawdowns from ATH as a structural signal
Applies a special first-position rule (100% / 300%)
Integrates visualization of leverage, liquidation price, MDD, and returns
All of this supports rule-based long position building in drawdown phases and comprehensive risk monitoring.
With this strategy, users can:
Explore different:
Drawdown zones
Entry percentages
Leverage levels
Run various backtests and scenario analyses
Better understand the risk/return profile that fits their own market view and risk tolerance
Once again, this strategy is intended for research, learning, and backtesting only.
All real trading decisions and their consequences are solely the responsibility of the user.

Daily Performance Analysis [Mr_Rakun]The Daily Performance Analysis indicator is a comprehensive trading performance tracker that analyzes your strategy's success rate and profitability across different days of the week and month. This powerful tool provides detailed statistics to help traders identify patterns in their trading performance and optimize their strategies accordingly.
Weekly Performance Analysis:
Tracks wins/losses for each day of the week (Monday through Sunday)
Calculates net profit/loss for each trading day
Shows profit factor (gross profit ÷ gross loss) for each day
Displays win rate percentage for each day
Monthly Performance Analysis:
Monitors performance for each day of the month (1-31)
Provides the same detailed metrics as weekly analysis
Helps identify monthly patterns and trends
Add to Your Strategy:
Copy the performance analysis code and integrate it into your existing Pine Script strategy
Optimize Strategy: Use insights to refine entry/exit timing or avoid trading on poor-performing days
Pattern Recognition: Identify which days of the week/month work best for your strategy
Risk Management: Avoid trading on historically poor-performing days
Strategy Optimization: Fine-tune your approach based on empirical data
Performance Tracking: Monitor long-term trends in your trading success
Data-Driven Decisions: Make informed adjustments to your trading schedule

Strategy Stats [presentTrading]Hello! it's another weekend. This tool is a strategy performance analysis tool. Looking at the TradingView community, it seems few creators focus on this aspect. I've intentionally created a shared version. Welcome to share your idea or question on this.
█ Introduction and How it is Different
Strategy Stats is a comprehensive performance analytics framework designed specifically for trading strategies. Unlike standard strategy backtesting tools that simply show cumulative profits, this analytics suite provides real-time, multi-timeframe statistical analysis of your trading performance.
Multi-timeframe analysis: Automatically tracks performance metrics across the most recent time periods (last 7 days, 30 days, 90 days, 1 year, and 4 years)
Advanced statistical measures: Goes beyond basic metrics to include Information Coefficient (IC) and Sortino Ratio
Real-time feedback: Updates performance statistics with each new trade
Visual analytics: Color-coded performance table provides instant visual feedback on strategy health
Integrated risk management: Implements sophisticated take profit mechanisms with 3-step ATR and percentage-based exits
BTCUSD Performance
The table in the upper right corner is a comprehensive performance dashboard showing trading strategy statistics.
Note: While this presentation uses Vegas SuperTrend as the underlying strategy, this is merely an example. The Stats framework can be applied to any trading strategy. The Vegas SuperTrend implementation is included solely to demonstrate how the analytics module integrates with a trading strategy.
⚠️ Timeframe Limitations
Important: TradingView's backtesting engine has a maximum storage limit of 10,000 bars. When using this strategy stats framework on smaller timeframes such as 1-hour or 2-hour charts, you may encounter errors if your backtesting period is too long.
Recommended Timeframe Usage:
Ideal for: 4H, 6H, 8H, Daily charts and above
May cause errors on: 1H, 2H charts spanning multiple years
Not recommended for: Timeframes below 1H with long history
█ Strategy, How it Works: Detailed Explanation
The Strategy Stats framework consists of three primary components: statistical data collection, performance analysis, and visualization.
🔶 Statistical Data Collection
The system maintains several critical data arrays:
equityHistory: Tracks equity curve over time
tradeHistory: Records profit/loss of each trade
predictionSignals: Stores trade direction signals (1 for long, -1 for short)
actualReturns: Records corresponding actual returns from each trade
For each closed trade, the system captures:
float tradePnL = strategy.closedtrades.profit(tradeIndex)
float tradeReturn = strategy.closedtrades.profit_percent(tradeIndex)
int tradeType = entryPrice < exitPrice ? 1 : -1 // Direction
🔶 Performance Metrics Calculation
The framework calculates several key performance metrics:
Information Coefficient (IC):
The correlation between prediction signals and actual returns, measuring forecast skill.
IC = Correlation(predictionSignals, actualReturns)
Where Correlation is the Pearson correlation coefficient:
Correlation(X,Y) = (nΣXY - ΣXY) / √
Sortino Ratio:
Measures risk-adjusted return focusing only on downside risk:
Sortino = (Avg_Return - Risk_Free_Rate) / Downside_Deviation
Where Downside Deviation is:
Downside_Deviation = √
R_i represents individual returns, T is the target return (typically the risk-free rate), and n is the number of observations.
Maximum Drawdown:
Tracks the largest percentage drop from peak to trough:
DD = (Peak_Equity - Trough_Equity) / Peak_Equity * 100
🔶 Time Period Calculation
The system automatically determines the appropriate number of bars to analyze for each timeframe based on the current chart timeframe:
bars_7d = math.max(1, math.round(7 * barsPerDay))
bars_30d = math.max(1, math.round(30 * barsPerDay))
bars_90d = math.max(1, math.round(90 * barsPerDay))
bars_365d = math.max(1, math.round(365 * barsPerDay))
bars_4y = math.max(1, math.round(365 * 4 * barsPerDay))
Where barsPerDay is calculated based on the chart timeframe:
barsPerDay = timeframe.isintraday ?
24 * 60 / math.max(1, (timeframe.in_seconds() / 60)) :
timeframe.isdaily ? 1 :
timeframe.isweekly ? 1/7 :
timeframe.ismonthly ? 1/30 : 0.01
🔶 Visual Representation
The system presents performance data in a color-coded table with intuitive visual indicators:
Green: Excellent performance
Lime: Good performance
Gray: Neutral performance
Orange: Mediocre performance
Red: Poor performance
█ Trade Direction
The Strategy Stats framework supports three trading directions:
Long Only: Only takes long positions when entry conditions are met
Short Only: Only takes short positions when entry conditions are met
Both: Takes both long and short positions depending on market conditions
█ Usage
To effectively use the Strategy Stats framework:
Apply to existing strategies: Add the performance tracking code to any strategy to gain advanced analytics
Monitor multiple timeframes: Use the multi-timeframe analysis to identify performance trends
Evaluate strategy health: Review IC and Sortino ratios to assess predictive power and risk-adjusted returns
Optimize parameters: Use performance data to refine strategy parameters
Compare strategies: Apply the framework to multiple strategies to identify the most effective approach
For best results, allow the strategy to generate sufficient trade history for meaningful statistical analysis (at least 20-30 trades).
█ Default Settings
The default settings have been carefully calibrated for cryptocurrency markets:
Performance Tracking:
Time periods: 7D, 30D, 90D, 1Y, 4Y
Statistical measures: Return, Win%, MaxDD, IC, Sortino Ratio
IC color thresholds: >0.3 (green), >0.1 (lime), <-0.1 (orange), <-0.3 (red)
Sortino color thresholds: >1.0 (green), >0.5 (lime), <0 (red)
Multi-Step Take Profit:
ATR multipliers: 2.618, 5.0, 10.0
Percentage levels: 3%, 8%, 17%
Short multiplier: 1.5x (makes short take profits more aggressive)
Stop loss: 20%

Parent Session Sweeps + Alert Killzone Ranges with Parent Session Sweep
Key Features:
1. Multiple Session Support: The script tracks three major trading sessions - Asia, London, and New York. Users can customize the timing of these sessions.
2. Killzone Visualization: The strategy visually represents each session's range, either as filled boxes or lines, allowing traders to easily identify key price levels.
3. Parent Session Logic: The core of the strategy revolves around identifying a "parent" session - a session that encompasses the range of the following session. This parent session becomes the basis for potential trade setups.
4. Sweep and Reclaim Setups: The strategy looks for price movements that sweep (break above or below) the parent session's high or low, followed by a reclaim of that level. This price action often indicates a potential reversal.
5. Risk-Reward Filtering: Each potential setup is evaluated based on a user-defined minimum risk-reward ratio, ensuring that only high-quality trade opportunities are considered.
6. Candle Close Filter: An optional filter that checks the characteristics of the candle that reclaims the parent session level, adding an extra layer of confirmation to the setup.
7. Performance Tracking: The strategy keeps track of bullish and bearish setup success rates, providing valuable feedback on its performance over time.
8. Visual Aids: The script draws lines to mark the parent session's high and low, making it easy for traders to identify key levels.
How It Works:
1. The script continuously monitors price action across the defined sessions.
2. When a session fully contains the range of the next session, it's identified as a potential parent session.
3. The strategy then waits for price to sweep either the high or low of this parent session.
4. If a sweep occurs, it looks for a reclaim of the swept level within the parameters set by the user.
5. If a valid setup is identified, the script generates an alert and places a trade (if backtesting or running live).
6. The strategy continues to monitor the trade for either reaching the target (opposite level of the parent session) or hitting the stop loss.
Considerations for Signals:
- Sweep: A break of the parent session's high or low.
- Reclaim: A close back inside the parent session range after a sweep.
- Candle Characteristics: Optional filter for the reclaim candle (e.g., bullish candle for long setups).
- Risk-Reward: Each setup must meet or exceed the user-defined minimum risk-reward ratio.
- Session Timing: The strategy is sensitive to the defined session times, which should be set according to the trader's preferred time zone.
This strategy aims to capitalize on institutional order flow and liquidity patterns in the forex market, providing traders with a systematic approach to identifying potential reversal points with favorable risk-reward profiles.

SigmaKernel - AdaptiveSigmaKernel - Adaptive Self-Optimizing Multi-Factor Trading System
SigmaKernel - Adaptive is a self-learning algorithmic trading strategy that combines four distinct analytical dimensions—momentum, market structure, volume flow, and reversal patterns—within a machine-learning-inspired framework that continuously adjusts its own parameters based on realized trading performance. Unlike traditional fixed-parameter strategies that maintain static weightings regardless of market conditions or results, this system implements a feedback loop that tracks which signal types, directional biases, and market conditions produce profitable outcomes, then mathematically adjusts component weightings, minimum score thresholds, position sizing multipliers, and trade spacing requirements to optimize future performance.
The strategy is designed for futures traders operating on prop firm accounts or live capital, incorporating realistic execution mechanics including configurable entry modes (stop breakout orders, limit pullback entries, or market-on-open), commission structures calibrated to retail futures contracts ($0.62 per contract default), one-tick slippage modeling, and professional risk controls including trailing drawdown guards, daily loss limits, and weekly profit targets. The system features universal futures compatibility—it automatically detects and adapts to any futures contract by reading the instrument's tick size and point value directly from the chart, eliminating the need for manual configuration across different markets.
What Makes This Approach Different
Adaptive Weight Optimization System
The core differentiation is the adaptive learning architecture. The strategy maintains four independent scoring components: momentum analysis (using RSI multi-timeframe, MACD histogram, and DMI/ADX), market structure detection (breakout identification via pivot-based support/resistance and moving average positioning), volume flow analysis (Volume Price Trend indicator with standard deviation confirmation), and reversal pattern recognition (oversold/overbought conditions combined with structural levels).
Each component generates a directional score that is multiplied by its current weight. After every closed trade, the system performs a retrospective analysis on the last N trades (configurable Learning Period, default 15 trades) to calculate win rates for each signal type independently. For example, if momentum-driven trades won 65% of the time while reversal trades won only 35%, the adaptive algorithm increases the momentum weight and decreases the reversal weight proportionally. The adjustment formula is:
New_Weight = Current_Weight + (Component_Win_Rate - Average_Win_Rate) × Adaptation_Speed
This creates a self-correcting mechanism where successful signal generators receive more influence in future composite scores, while underperforming components are de-emphasized. The system separately tracks long versus short win rates and applies directional bias corrections—if shorts consistently outperform longs, the strategy applies a 10% reduction to bullish signals to prevent fighting the prevailing market character.
Dynamic Parameter Adjustment
Beyond component weightings, three critical strategy parameters self-adjust based on performance:
Minimum Signal Score: The threshold required to trigger a trade. If overall win rate falls below 45%, the system increments this threshold by 0.10 per adjustment cycle, making the strategy more selective. If win rate exceeds 60%, the threshold decreases to allow more opportunities. This prevents the strategy from overtrading during unfavorable conditions and capitalizes on high-probability environments.
Risk Multiplier: Controls position sizing aggression. When drawdown exceeds 5%, risk per trade reduces by 10% per cycle. When drawdown falls below 2%, risk increases by 5% per cycle. This implements the professional risk management principle of "bet small when losing, bet bigger when winning" algorithmically.
Bars Between Trades: Spacing filter to prevent overtrading. Base value (default 9 bars) multiplies by drawdown factor and losing streak factor. During drawdown or consecutive losses, spacing expands up to 2x to allow market conditions to change before re-entering.
All adaptation operates during live forward-testing or real trading—there is no in-sample optimization applied to historical data. The system learns solely from its own realized trades.
Universal Futures Compatibility
The strategy implements universal futures instrument detection that automatically adapts to any futures contract without requiring manual configuration. Instead of hardcoding specific contract specifications, the system reads three critical values directly from TradingView's symbol information:
Tick Size Detection: Uses `syminfo.mintick` to obtain the minimum price increment for the current instrument. This value varies widely across markets—ES trades in 0.25 ticks, crude oil (CL) in 0.01 ticks, gold (GC) in 0.10 ticks, and treasury futures (ZB) in increments of 1/32nds. The strategy adapts all entry buffer calculations and stop placement logic to the detected tick size.
Point Value Detection: Uses `syminfo.pointvalue` to determine the dollar value per full point of price movement. For ES, one point equals $50; for crude oil, one point equals $1,000; for gold, one point equals $100. This automatic detection ensures accurate P&L calculations and risk-per-contract measurements across all instruments.
Tick Value Calculation: Combines tick size and point value to compute dollar value per tick: Tick_Value = Tick_Size × Point_Value. This derived value drives all position sizing calculations, ensuring the risk management system correctly accounts for each instrument's economic characteristics.
This universal approach means the strategy functions identically on emini indices (ES, MES, NQ, MNQ), micro indices, energy contracts (CL, NG, RB), metals (GC, SI, HG), agricultural futures (ZC, ZS, ZW), treasury futures (ZB, ZN, ZF), currency futures (6E, 6J, 6B), and any other futures contract available on TradingView. No parameter adjustments or instrument-specific branches exist in the code—the adaptation happens automatically through symbol information queries.
Stop-Out Rate Monitoring System
The strategy includes an intelligent stop-out rate tracking system that monitors the percentage of your last 20 trades (or available trades if fewer than 20) that were stopped out. This metric appears in the dashboard's Performance section with color-coded guidance:
Green (<30% stop-out rate): Very few trades are being stopped out. This suggests either your stops are too loose (giving back profits on reversals) or you're in an exceptional trending market. Consider tightening your Stop Loss ATR multiplier to lock in profits more efficiently.
Orange (30-65% stop-out rate): Healthy range. Your stop placement is appropriately sized for current market conditions and the strategy's risk-reward profile. No adjustment needed.
Red (>65% stop-out rate): Too many trades are being stopped out prematurely. Your stops are likely too tight for the current volatility regime. Consider widening your Stop Loss ATR multiplier to give trades more room to develop.
Critical Design Philosophy: Unlike some systems that automatically adjust stops based on performance statistics, this strategy intentionally keeps stop-loss control in the user's hands. Automatic stop adjustment creates dangerous feedback loops—widening stops increases risk per contract, which forces position size reduction, which distorts performance metrics, leading to incorrect adaptations. Instead, the dashboard provides visibility into stop performance, empowering you to make informed manual adjustments when warranted. This preserves the integrity of the adaptive system while giving you the critical data needed for stop optimization.
Execution Kernel Architecture
The entry system offers three distinct execution modes to match trader preference and market character:
StopBreakout Mode: Places buy-stop orders above the prior bar's high (for longs) or sell-stop orders below the prior bar's low (for shorts), plus a 2-tick buffer. This ensures entries only occur when price confirms directional momentum by breaking recent structure. Ideal for trending and momentum-driven markets.
LimitPullback Mode: Places limit orders at a pullback price calculated as: Entry_Price = Close - (ATR × Pullback_Multiplier) for longs, or Close + (ATR × Pullback_Multiplier) for shorts. Default multiplier is 0.5 ATR. This waits for mean-reversion before entering in the signal direction, capturing better prices in volatile or oscillating markets.
MarketNextOpen Mode: Executes at market on the bar immediately following signal generation. This provides fastest execution but sacrifices the filtering effect of requiring price confirmation.
All pending entry orders include a configurable Time-To-Live (TTL, default 6 bars). If an order is not filled within the TTL period, it cancels automatically to prevent stale signals from executing in changed market conditions.
Professional Exit Management
The exit system implements a three-stage progression: initial stop loss, breakeven adjustment, and dynamic trailing stop.
Initial Stop Loss: Calculated as entry price ± (ATR × User_Stop_Multiplier × Volatility_Adjustment). Users have direct control via the Stop Loss ATR multiplier (default 1.25). The system then applies volatility regime adjustments: ×1.2 in high-volatility environments (stops automatically widen), ×0.8 in low volatility (stops tighten), ×1.0 in normal conditions. This ensures stops adapt to market character while maintaining user control over baseline risk tolerance.
Breakeven Trigger: When profit reaches a configurable multiple of initial risk (default 1.0R), the stop loss automatically moves to breakeven (entry price). This locks in zero-loss status once the trade demonstrates favorable movement.
Trailing Stop Activation: When profit reaches the Trail_Trigger_R multiple (default 1.2R), the system cancels the fixed stop and activates a dynamic trailing stop. The trail uses Step and Offset parameters defined in R-multiples. For example, with Trail_Offset_R = 1.0 and Trail_Step_R = 1.5, the stop trails 1.0R behind price and moves in 1.5R increments. This captures extended moves while protecting accumulated profit.
Additional failsafes include maximum time-in-trade (exits after N bars if specified) and end-of-session flatten (automatically closes all positions X minutes before session end to avoid overnight exposure).
Core Calculation Methodology
Signal Component Scoring
Momentum Component:
- Calculates 14-period DMI (Directional Movement Index) with ADX strength filter (trending when ADX > 25)
- Computes three RSI timeframes: fast (7-period), medium (14-period), slow (21-period)
- Analyzes MACD (12/26/9) histogram for directional acceleration
- Bullish momentum: uptrend (DI+ > DI- with ADX > 25) + MACD histogram rising above zero + RSI fast between 50-80 = +1.6 score
- Bearish momentum: downtrend (DI- > DI+ with ADX > 25) + MACD histogram falling below zero + RSI fast between 20-50 = -1.6 score
- Score multiplies by volatility adjustment factor: ×0.8 in high volatility (momentum less reliable), ×1.2 in low volatility (momentum more persistent)
Structure Component:
- Identifies swing highs and lows using 10-bar pivot lookback on both sides
- Maintains most recent swing high as dynamic resistance, most recent swing low as dynamic support
- Detects breakouts: bullish when close crosses above resistance with prior bar below; bearish when close crosses below support with prior bar above
- Breakout score: ±1.0 for confirmed break
- Moving average alignment: +0.5 when price > SMA20 > SMA50 (bullish structure); -0.5 when price < SMA20 < SMA50 (bearish structure)
- Total structure range: -1.5 to +1.5
Volume Component:
- Calculates Volume Price Trend: VPT = Σ [(Close - Close ) / Close × Volume]
- Compares VPT to its 10-period EMA as signal line (similar to MACD logic)
- Computes 20-period volume moving average and standard deviation
- High volume event: current volume > (volume_average + 1× std_dev)
- Bullish volume: VPT > VPT_signal AND high_volume = +1.0
- Bearish volume: VPT < VPT_signal AND high_volume = -1.0
- No score if volume is not elevated (filters out low-conviction moves)
Reversal Component:
- Identifies extreme RSI conditions: RSI slow < 30 (oversold) or > 70 (overbought)
- Requires structural confluence: price at or below support level for bullish reversal; at or above resistance for bearish reversal
- Requires momentum shift: RSI fast must be rising (for bull) or falling (for bear) to confirm reversal in progress
- Bullish reversal: RSI < 30 AND price ≤ support AND RSI rising = +1.0
- Bearish reversal: RSI > 70 AND price ≥ resistance AND RSI falling = -1.0
Composite Score Calculation
Final_Score = (Momentum × Weight_M) + (Structure × Weight_S) + (Volume × Weight_V) + (Reversal × Weight_R)
Initial weights: Momentum = 1.0, Structure = 1.2, Volume = 0.8, Reversal = 0.6
These weights adapt after each trade based on component-specific performance as described above.
The system also applies directional bias adjustment: if recent long trades have significantly lower win rate than shorts, bullish scores multiply by 0.9 to reduce aggressive long entries. Vice versa for underperforming shorts.
Position Sizing Algorithm
The position sizing calculation incorporates multiple confidence factors and automatically scales to any futures contract:
1. Base risk amount = Account_Size × Base_Risk_Percent × Adaptive_Risk_Multiplier
2. Stop distance in price units = ATR × User_Stop_Multiplier × Volatility_Regime_Multiplier × Entry_Buffer
3. Risk per contract = Stop_Distance × Dollar_Per_Point (automatically detected from instrument)
4. Raw position size = Risk_Amount / Risk_Per_Contract
Then applies confidence scaling:
- Signal confidence = min(|Weighted_Score| / Min_Score_Threshold, 2.0) — higher scores receive larger size, capped at 2×
- Direction confidence = Long_Win_Rate (for bulls) or Short_Win_Rate (for bears)
- Type confidence = Win_Rate of dominant signal type (momentum/structure/volume/reversal)
- Total confidence = (Signal_Confidence + Direction_Confidence + Type_Confidence) / 3
Adjusted size = Raw_Size × Total_Confidence × Losing_Streak_Reduction
Losing streak reduction = 0.5 if losing_streak ≥ 5, otherwise 1.0
Universal Maximum Position Calculation: Instead of hardcoded limits per instrument, the system calculates maximum position size as: Max_Contracts = Account_Size / 25000, clamped between 1 and 10 contracts. This means a $50,000 account allows up to 2 contracts, a $100,000 account allows up to 4 contracts, regardless of which futures contract is being traded. This universal approach maintains consistent risk exposure across different instruments while preventing overleveraging.
Final size is rounded to integer and bounded by the calculated maximum.
Session and Risk Management System
Timezone-Aware Session Control
The strategy implements timezone-correct session filtering. Users specify session start hour, end hour, and timezone from 12 supported zones (New York, Chicago, Los Angeles, London, Frankfurt, Moscow, Tokyo, Hong Kong, Shanghai, Singapore, Sydney, UTC). The system converts bar timestamps to the selected timezone before applying session logic.
For split sessions (e.g., Asian session 18:00-02:00), the logic correctly handles time wraparound. Weekend trading can be optionally disabled (default: disabled) to avoid low-liquidity weekend price action.
Multi-Layer Risk Controls
Daily Loss Limit: Strategy ceases all new entries when daily P&L reaches negative threshold (default $2,000). This prevents catastrophic drawdown days. Resets at timezone-corrected day boundary.
Weekly Profit Target: Strategy ceases trading when weekly profit reaches target (default $10,000). This implements the professional principle of "take the win and stop pushing luck." Resets on timezone-corrected Monday.
Maximum Daily Trades: Hard cap on entries per day (default 20) to prevent overtrading during volatile conditions when many signals may generate.
Trailing Drawdown Guard: Optional prop-firm-style trailing stop on account equity. When enabled, if equity drops below (Peak_Equity - Trailing_DD_Amount), all trading halts. This simulates the common prop firm rule where exceeding trailing drawdown results in account termination.
All limits display status in the real-time dashboard, showing "MAX LOSS HIT", "WEEKLY TARGET MET", or "ACTIVE" depending on current state.
How To Use This Strategy
Initial Setup
1. Apply the strategy to your desired futures chart (tested on 5-minute through daily timeframes)
2. The strategy will automatically detect your instrument's specifications—no manual configuration needed for different contracts
3. Configure your account size and risk parameters in the Core Settings section
4. Set your trading session hours and timezone to match your availability
5. Adjust the Stop Loss ATR multiplier based on your risk tolerance (0.8-1.2 for tighter stops, 1.5-2.5 for wider stops)
6. Select your preferred entry execution mode (recommend StopBreakout for beginners)
7. Enable adaptation (recommended) or disable for fixed-parameter operation
8. Review the strategy's Properties in the Strategy Tester settings and verify commission/slippage match your broker's actual costs
The universal futures detection means you can switch between ES, NQ, CL, GC, ZB, or any other futures contract without changing any strategy parameters—the system will automatically adapt its calculations to each instrument's unique specifications.
Dashboard Interpretation
The strategy displays a comprehensive real-time dashboard in the top-right corner showing:
Market State Section:
- Trend: Shows UPTREND/DOWNTREND/CONSOLIDATING/NEUTRAL based on ADX and DMI analysis
- ADX Value: Current trend strength (>25 = strong trend, <20 = consolidating)
- Momentum: BULL/BEAR/NEUTRAL classification with current momentum score
- Volatility: HIGH/LOW/NORMAL regime with ATR percentage of price
Volume Profile Section (Large dashboard only):
- VPT Flow: Directional bias from volume analysis
- Volume Status: HIGH/LOW/NORMAL with relative volume multiplier
Performance Section:
- Daily P&L: Current day's profit/loss with color coding
- Daily Trades: Number of completed trades today
- Weekly P&L: Current week's profit/loss
- Target %: Progress toward weekly profit target
- Stop-Out Rate: Percentage of last 20 trades (or available trades if <20) that were stopped out. Includes all stop types: initial stops, breakeven stops, trailing stops, timeout exits, and EOD flattens. Color coded with actionable guidance:
- Green (<30%): Shows "TIGHTEN" guidance. Very few stop-outs suggests stops may be too loose or exceptional market conditions. Consider reducing Stop Loss ATR multiplier.
- Orange (30-65%): Shows "OK" guidance. Healthy stop-out rate indicating appropriate stop placement for current conditions.
- Red (>65%): Shows "WIDEN" guidance. Too many premature stop-outs. Consider increasing Stop Loss ATR multiplier to give trades more room.
- Status: Overall trading status (ACTIVE/MAX LOSS HIT/WEEKLY TARGET MET/FILTERS ACTIVE)
Adaptive Engine Section:
- Min Score: Current minimum threshold for trade entry (higher = more selective)
- Risk Mult: Current position sizing multiplier (adjusts with performance)
- Bars BTW: Current minimum bars required between trades
- Drawdown: Current drawdown percentage from equity peak
- Weights: M/S/V/R showing current component weightings
Win Rates Section:
- Type: Win rates for Momentum, Structure, Volume, Reversal signal types
- Direction: Win rates for Long vs Short trades
Color coding shows green for >50% win rate, red for <50%
Session Info Section:
- Session Hours: Active trading window with timezone
- Weekend Trading: ENABLED/DISABLED status
- Session Status: ACTIVE/INACTIVE based on current time
Signal Generation and Entry
The strategy generates entries when the weighted composite score exceeds the adaptive minimum threshold (initial value configurable, typically 1.5 to 2.5). Entries display as layered triangle markers on the chart:
- Long Signal: Three green upward triangles below the entry bar
- Short Signal: Three red downward triangles above the entry bar
Triangle tooltip shows the signal score and dominant signal type (MOMENTUM/STRUCTURE/VOLUME/REVERSAL).
Position Management and Stop Optimization
Once entered, the strategy automatically manages the position through its three-stage exit system. Monitor the Stop-Out Rate metric in the dashboard to optimize your stop placement:
If Stop-Out Rate is Green (<30%): You're rarely being stopped out. This could mean:
- Your stops are too loose, allowing trades to give back too much profit on reversals
- You're in an exceptional trending market where tight stops would work better
- Action: Consider reducing your Stop Loss ATR multiplier by 0.1-0.2 to tighten stops and lock in profits more efficiently
If Stop-Out Rate is Orange (30-65%): Optimal range. Your stops are appropriately sized for the strategy's risk-reward profile and current market volatility. No adjustment needed.
If Stop-Out Rate is Red (>65%): You're being stopped out too frequently. This means:
- Your stops are too tight for current market volatility
- Trades need more room to develop before reaching profit targets
- Action: Increase your Stop Loss ATR multiplier by 0.1-0.3 to give trades more breathing room
Remember: The stop-out rate calculation includes all exit types (initial stops, breakeven stops, trailing stops, timeouts, EOD flattens). A trade that reaches breakeven and gets stopped out at entry price counts as a stop-out, even though it didn't lose money. This is intentional—it indicates the stop placement didn't allow the trade to develop into profit.
Optimization Workflow
For traders wanting to customize the strategy for their specific instrument and timeframe:
Week 1-2: Run with defaults, adaptation enabled
Allow the system to execute at least 30-50 trades (the Learning Period plus additional buffer). Monitor which session periods, signal types, and market conditions produce the best results. Observe your stop-out rate—if it's consistently red or green, plan to adjust Stop Loss ATR multiplier after the learning period. Do not adjust parameters yet—let the adaptive system establish baseline performance data.
Week 3-4: Analyze adaptation behavior and optimize stops
Review the dashboard's adaptive weights and win rates. If certain signal types consistently show <40% win rate, consider slightly reducing their base weight. If a particular entry mode produces better fill quality and win rate, switch to that mode. If you notice the minimum score threshold has climbed very high (>3.0), market conditions may not suit the strategy's logic—consider switching instruments or timeframes.
Based on your Stop-Out Rate observations:
- Consistently <30%: Reduce Stop Loss ATR multiplier by 0.2-0.3
- Consistently >65%: Increase Stop Loss ATR multiplier by 0.2-0.4
- Oscillating between zones: Leave stops at default and let volatility regime adjustments handle it
Ongoing: Fine-tune risk and execution
Adjust the following based on your risk tolerance and account type:
- Base Risk Per Trade: 0.5% for conservative, 0.75% for moderate, 1.0% for aggressive
- Stop Loss ATR Multiplier: 0.8-1.2 for tight stops (scalping), 1.5-2.5 for wide stops (swing trading)
- Bars Between Trades: Lower (5-7) for more opportunities, higher (12-20) for more selective
- Entry Mode: Experiment between modes to find best fit for current market character
- Session Hours: Narrow to specific high-performance session windows if certain hours consistently underperform
Never adjust: Do not manually modify the adaptive weights, minimum score, or risk multiplier after the system has begun learning. These parameters are self-optimizing and manual interference defeats the adaptive mechanism.
Parameter Descriptions and Optimization Guidelines
Adaptive Intelligence Group
Enable Self-Optimization (default: true): Master switch for the adaptive learning system. When enabled, component weights, minimum score, risk multiplier, and trade spacing adjust based on realized performance. Disable to run the strategy with fixed parameters (useful for comparing adaptive vs non-adaptive performance).
Learning Period (default: 15 trades): Number of most recent trades to analyze for performance calculations. Shorter values (10-12) adapt more quickly to recent conditions but may overreact to variance. Longer values (20-30) produce more stable adaptations but respond slower to regime changes. For volatile markets, use shorter periods. For stable trends, use longer periods.
Adaptation Speed (default: 0.25): Controls the magnitude of parameter adjustments per learning cycle. Lower values (0.05-0.15) make gradual, conservative changes. Higher values (0.35-0.50) make aggressive adjustments. Faster adaptation helps in rapidly changing markets but increases parameter instability. Start with default and increase only if you observe the system failing to adapt quickly enough to obvious performance patterns.
Performance Memory (default: 100 trades): Maximum number of historical trades stored for analysis. This array size does not affect learning (which uses only Learning Period trades) but provides data for future analytics features including stop-out rate tracking. Higher values consume more memory but provide richer historical dataset. Typical users should not need to modify this.
Core Settings Group
Account Size (default: $50,000): Starting capital for position sizing calculations. This should match your actual account size for accurate risk per trade. The strategy uses this value to calculate dollar risk amounts and determine maximum position size (1 contract per $25,000).
Weekly Profit Target (default: $10,000): When weekly P&L reaches this value, the strategy stops taking new trades for the remainder of the week. This implements a "quit while ahead" rule common in professional trading. Set to a realistic weekly goal—20% of account size per week ($10K on $50K) is very aggressive; 5-10% is more sustainable.
Max Daily Loss (default: $2,000): When daily P&L reaches this negative threshold, strategy stops all new entries for the day. This is your maximum acceptable daily loss. Professional traders typically set this at 2-4% of account size. A $2,000 loss on a $50,000 account = 4%.
Base Risk Per Trade % (default: 0.5%): Initial percentage of account to risk on each trade before adaptive multiplier and confidence scaling. 0.5% is conservative, 0.75% is moderate, 1.0-1.5% is aggressive. Remember that actual risk per trade = Base Risk × Adaptive Risk Multiplier × Confidence Factors, so the realized risk will vary.
Trade Filters Group
Base Minimum Signal Score (default: 1.5): Initial threshold that composite weighted score must exceed to generate a signal. Lower values (1.0-1.5) produce more trades with lower average quality. Higher values (2.0-3.0) produce fewer, higher-quality setups. This value adapts automatically when adaptive mode is enabled, but the base sets the starting point. For trending markets, lower values work well. For choppy markets, use higher values.
Base Bars Between Trades (default: 9): Minimum bars that must elapse after an entry before another signal can trigger. This prevents overtrading and allows previous trades time to develop. Lower values (3-6) suit scalping on lower timeframes. Higher values (15-30) suit swing trading on higher timeframes. This value also adapts based on drawdown and losing streaks.
Max Daily Trades (default: 20): Hard limit on total trades per day regardless of signal quality. This prevents runaway trading during extremely volatile days when many signals may generate. For 5-minute charts, 20 trades/day is reasonable. For 1-hour charts, 5-10 trades/day is more typical.
Session Group
Session Start Hour (default: 5): Hour (0-23 format) when trading is allowed to begin, in the timezone specified. For US futures trading in Chicago time, session typically starts at 5:00 or 6:00 PM (17:00 or 18:00) Sunday evening.
Session End Hour (default: 17): Hour when trading stops and no new entries are allowed. For US equity index futures, regular session ends at 4:00 PM (16:00) Central Time.
Allow Weekend Trading (default: false): Whether strategy can trade on Saturday/Sunday. Most futures have low volume on weekends; keeping this disabled is recommended unless you specifically trade Sunday evening open.
Session Timezone (default: America/Chicago): Timezone for session hour interpretation. Select your local timezone or the timezone of your instrument's primary exchange. This ensures session logic aligns with your intended trading hours.
Prop Guards Group
Trailing Drawdown Guard (default: false): Enables prop-firm-style trailing maximum drawdown. When enabled, if equity drops below (Peak Equity - Trailing DD Amount), all trading halts for the remainder of the backtest/live session. This simulates rules used by funded trader programs where exceeding trailing drawdown terminates the account.
Trailing DD Amount (default: $2,500): Dollar amount of drawdown allowed from equity peak. If your equity reaches $55,000, the trailing stop sets at $52,500. If equity then drops to $52,499, the guard triggers and trading ceases.
Execution Kernel Group
Entry Mode (default: StopBreakout):
- StopBreakout: Places stop orders above/below signal bar requiring price confirmation
- LimitPullback: Places limit orders at pullback prices seeking better fills
- MarketNextOpen: Executes immediately at market on next bar
Limit Offset (default: 0.5x ATR): For LimitPullback mode, how far below/above current price to place the limit order. Smaller values (0.3-0.5) seek minor pullbacks. Larger values (0.8-1.2) wait for deeper retracements but may miss trades.
Entry TTL (default: 6 bars, 0=off): Bars an entry order remains pending before cancelling. Shorter values (3-4) keep signals fresh. Longer values (8-12) allow more time for fills but risk executing stale signals. Set to 0 to disable TTL (orders remain active indefinitely until filled or opposite signal).
Exits Group
Stop Loss (default: 1.25x ATR): Base stop distance as a multiple of the 14-period ATR. This is your primary risk control parameter and directly impacts your stop-out rate. Lower values (0.8-1.0) create tighter stops that reduce risk per trade but may get stopped out prematurely in volatile conditions—expect stop-out rates above 65% (red zone). Higher values (1.5-2.5) give trades more room to breathe but increase risk per contract—expect stop-out rates below 30% (green zone). The system applies additional volatility regime adjustments on top of this base: ×1.2 in high volatility environments (stops widen automatically), ×0.8 in low volatility (stops tighten), ×1.0 in normal conditions. For scalping on lower timeframes, use 0.8-1.2. For swing trading on higher timeframes, use 1.5-2.5. Monitor the Stop-Out Rate metric in the dashboard and adjust this parameter to keep it in the healthy 30-65% orange zone.
Move to Breakeven at (default: 1.0R): When profit reaches this multiple of initial risk, stop moves to breakeven. 1.0R means after price moves in your favor by the distance you risked, you're protected at entry price. Lower values (0.5-0.8R) lock in breakeven faster. Higher values (1.5-2.0R) allow more room before protection.
Start Trailing at (default: 1.2R): When profit reaches this multiple, the fixed stop transitions to a dynamic trailing stop. This should be greater than the BE trigger. Values typically range 1.0-2.0R depending on how much profit you want secured before trailing activates.
Trail Offset (default: 1.0R): How far behind price the trailing stop follows. Tighter offsets (0.5-0.8R) protect profit more aggressively but may exit prematurely. Wider offsets (1.5-2.5R) allow more room for profit to run but risk giving back more on reversals.
Trail Step (default: 1.5R): How far price must move in profitable direction before the stop advances. Smaller steps (0.5-1.0R) move the stop more frequently, tightening protection continuously. Larger steps (2.0-3.0R) move the stop less often, giving trades more breathing room.
Max Bars In Trade (default: 0=off): Maximum bars allowed in a position before forced exit. This prevents trades from "going stale" during periods of no meaningful price action. For 5-minute charts, 50-100 bars (4-8 hours) is reasonable. For daily charts, 5-10 bars (1-2 weeks) is typical. Set to 0 to disable.
Flatten near Session End (default: true): Whether to automatically close all positions as session end approaches. Recommended to avoid carrying positions into off-hours with low liquidity.
Minutes before end (default: 5): How many minutes before session end to flatten. 5-15 minutes provides buffer for order execution before the session boundary.
Visual Effects Configuration Group
Dashboard Size (default: Normal): Controls information density in the dashboard. Small shows only critical metrics (excludes stop-out rate). Normal shows comprehensive data including stop-out rate. Large shows all available metrics including weights, session info, and volume analysis. Larger sizes consume more screen space but provide complete visibility.
Show Quantum Field (default: true): Displays animated grid pattern on the chart indicating market state. Disable if you prefer cleaner charts or experience performance issues on lower-end hardware.
Show Wick Pressure Lines (default: true): Draws dynamic lines from bars with extreme wicks, indicating potential support/resistance or liquidity absorption zones. Disable for simpler visualization.
Show Morphism Energy Beams (default: true): Displays directional beams showing momentum energy flow. Beams intensify during strong trends. Disable if you find this visually distracting.
Show Order Flow Clouds (default: true): Draws translucent boxes representing volume flow bullish/bearish bias. Disable for cleaner price action visibility.
Show Fractal Grid (default: true): Displays multi-timeframe support/resistance levels based on fractal price structure at 10/20/30/40/50 bar periods. Disable if you only want to see primary pivot levels.
Glow Intensity (default: 4): Controls the brightness and thickness of visual effects. Lower values (1-2) for subtle visualization. Higher values (7-10) for maximum visibility but potentially cluttered charts.
Color Theme (default: Cyber): Visual color scheme. Cyber uses cyan/magenta futuristic colors. Quantum uses aqua/purple. Matrix uses green/red terminal style. Aurora uses pastel pink/purple gradient. Choose based on personal preference and monitor calibration.
Show Watermark (default: true): Displays animated watermark at bottom of chart with creator credit and current P&L. Disable if you want completely clean charts or need screen space.
Performance Characteristics and Best Use Cases
Optimal Conditions
This strategy performs best in markets exhibiting:
Trending phases with periodic pullbacks: The combination of momentum and structure components excels when price establishes directional bias but provides retracement opportunities for entries. Markets with 60-70% trending bars and 30-40% consolidation produce the highest win rates.
Medium to high volatility: The ATR-based stop sizing and dynamic risk adjustment require sufficient price movement to generate meaningful profit relative to risk. Instruments with 2-4% daily ATR relative to price work well. Extremely low volatility (<1% daily ATR) generates too many scratch trades.
Clear volume patterns: The VPT volume component adds significant edge when volume expansions align with directional moves. Instruments and timeframes where volume data reflects actual transaction flow (versus tick volume proxies) perform better.
Regular session structure: Futures markets with defined opening and closing hours, consistent liquidity throughout the session, and clear overnight/day session separation allow the session controls and time-based failsafes to function optimally.
Sufficient liquidity for stop execution: The stop breakout entry mode requires that stop orders can fill without significant slippage. Highly liquid contracts work better than illiquid instruments where stop orders may face adverse fills.
Suboptimal Conditions
The strategy may struggle with:
Extreme chop with no directional persistence: When ADX remains below 15 for extended periods and price oscillates rapidly without establishing trends, the momentum component generates conflicting signals. Win rate typically drops below 40% in these conditions, triggering the adaptive system to increase minimum score thresholds until conditions improve. Stop-out rates may also spike into the red zone.
Gap-heavy instruments: Markets with frequent overnight gaps disrupt the continuous price assumptions underlying ATR stops and EMA-based structure analysis. Gaps can also cause stop orders to fill at prices far from intended levels, distorting stop-out rate metrics.
Very low timeframes with excessive noise: On 1-minute or tick charts, the signal components react to micro-structure noise rather than meaningful price swings. The strategy works best on 5-minute through daily timeframes where price movements reflect actual order flow shifts.
Extended low-volatility compression: During historically low volatility periods, profit targets become difficult to reach before mean-reversion occurs. The trail offset, even when set to minimum, may be too wide for the compressed price environment. Stop-out rates may drop to green zone indicating stops should be tightened.
Parabolic moves or climactic exhaustion: Vertical price advances or selloffs where price moves multiple ATRs in single bars can trigger momentum signals at exhaustion points. The structure and reversal components attempt to filter these, but extreme moves may override normal logic.
The adaptive learning system naturally reduces signal frequency and position sizing during unfavorable conditions. If you observe multiple consecutive days with zero trades and "FILTERS ACTIVE" status, this indicates the strategy has self-adjusted to avoid poor conditions rather than forcing trades.
Instrument Recommendations
Emini Index Futures (ES, MES, NQ, MNQ, YM, RTY): Excellent fit. High liquidity, clear volatility patterns, strong volume signals, defined session structure. These instruments have been extensively tested and the universal detection handles all contract specifications automatically.
Micro Index Futures (MES, MNQ, M2K, MYM): Excellent fit for smaller accounts. Same market characteristics as the standard eminis but with reduced contract sizes allowing proper risk management on accounts below $50,000.
Energy Futures (CL, NG, RB, HO): Good to mixed fit. Crude oil (CL) works well due to strong trends and reasonable volatility. Natural gas (NG) can be extremely volatile—consider reducing Base Risk to 0.3-0.4% and increasing Stop Loss ATR multiplier to 1.8-2.2 for NG. The strategy automatically detects the $10/tick value for CL and adjusts position sizing accordingly.
Metal Futures (GC, SI, HG, PL): Good fit. Gold (GC) and silver (SI) exhibit clear trending behavior and work well with the momentum/structure components. The strategy automatically handles the different point values ($100/point for gold, $5,000/point for silver).
Agricultural Futures (ZC, ZS, ZW, ZL): Good fit. Grain futures often trend strongly during seasonal periods. The strategy handles the unique tick sizes (1/4 cent increments) and point values ($50/point for corn/wheat, $60/point for soybeans) automatically.
Treasury Futures (ZB, ZN, ZF, ZT): Good fit for trending rates environments. The strategy automatically handles the fractional tick sizing (32nds for ZB/ZN, halves of 32nds for ZF/ZT) through the universal detection system.
Currency Futures (6E, 6J, 6B, 6A, 6C): Good fit. Major currency pairs exhibit smooth trending behavior. The strategy automatically detects point values which vary significantly ($12.50/tick for 6E, $12.50/tick for 6J, $6.25/tick for 6B).
Cryptocurrency Futures (BTC, ETH, MBT, MET): Mixed fit. These markets have extreme volatility requiring parameter adjustment. Increase Base Risk to 0.8-1.2% and Stop Loss ATR multiplier to 2.0-3.0 to account for wider stop distances. Enable 24-hour trading and weekend trading as these markets have no traditional sessions.
The universal futures compatibility means you can apply this strategy to any of these markets without code modification—simply open the chart of your desired contract and the strategy will automatically configure itself to that instrument's specifications.
Important Disclaimers and Realistic Expectations
This is a sophisticated trading strategy that combines multiple analytical methods within an adaptive framework designed for active traders who will monitor performance and market conditions. It is not a "set and forget" fully automated system, nor should it be treated as a guaranteed profit generator.
Backtesting Realism and Limitations
The strategy includes realistic trading costs and execution assumptions:
- Commission: $0.62 per contract per side (accurate for many retail futures brokers)
- Slippage: 1 tick per entry and exit (conservative estimate for liquid futures)
- Position sizing: Realistic risk percentages and maximum contract limits based on account size
- No repainting: All calculations use confirmed bar data only—signals do not change retroactively
However, backtesting cannot fully capture live trading reality:
- Order fill delays: In live trading, stop and limit orders may not fill instantly at the exact tick shown in backtest
- Volatile periods: During high volatility or low liquidity (news events, rollover days, pre-holidays), slippage may exceed the 1-tick assumption significantly
- Gap risk: The backtest assumes stops fill at stop price, but gaps can cause fills far beyond intended exit levels
- Psychological factors: Seeing actual capital at risk creates emotional pressures not present in backtesting, potentially leading to premature manual intervention
The strategy's backtest results should be viewed as best-case scenarios. Real trading will typically produce 10-30% lower returns than backtest due to the above factors.
Risk Warnings
All trading involves substantial risk of loss. The adaptive learning system can improve parameter selection over time, but it cannot predict future price movements or guarantee profitable performance. Past wins do not ensure future wins.
Losing streaks are inevitable. Even with a 60% win rate, you will encounter sequences of 5, 6, or more consecutive losses due to normal probability distributions. The strategy includes losing streak detection and automatic risk reduction, but you must have sufficient capital to survive these drawdowns.
Market regime changes can invalidate learned patterns. If the strategy learns from 50 trades during a trending regime, then the market shifts to a ranging regime, the adapted parameters may initially be misaligned with the new environment. The system will re-adapt, but this transition period may produce suboptimal results.
Prop firm traders: understand your specific rules. Every prop firm has different rules regarding maximum drawdown, daily loss limits, consistency requirements, and prohibited trading behaviors. While this strategy includes common prop guardrails, you must verify it complies with your specific firm's rules and adjust parameters accordingly.
Never risk capital you cannot afford to lose. This strategy can produce substantial drawdowns, especially during learning periods or market regime shifts. Only trade with speculative capital that, if lost, would not impact your financial stability.
Recommended Usage
Paper trade first: Run the strategy on a simulated account for at least 50 trades or 1 month before committing real capital. Observe how the adaptive system behaves, identify any patterns in losing trades, monitor your stop-out rate trends, and verify your understanding of the entry/exit mechanics.
Start with minimum position sizing: When transitioning to live trading, reduce the Base Risk parameter to 0.3-0.4% initially (vs 0.5-1.0% in testing) to reduce early impact while the system learns your live broker's execution characteristics.
Monitor daily, but do not micromanage: Check the dashboard daily to ensure the strategy is operating normally and risk controls have not triggered unexpectedly. Pay special attention to the Stop-Out Rate metric—if it remains in the red or green zones for multiple days, adjust your Stop Loss ATR multiplier accordingly. However, resist the urge to manually adjust adaptive weights or disable trades based on short-term performance. Allow the adaptive system at least 30 trades to establish patterns before making manual changes.
Combine with other analysis: While this strategy can operate standalone, professional traders typically use systematic strategies as one component of a broader approach. Consider using the strategy for trade execution while applying your own higher-timeframe analysis or fundamental view for trade filtering or sizing adjustments.
Keep a trading journal: Document each week's results, note market conditions (trending vs ranging, high vs low volatility), record stop-out rates and any Stop Loss ATR adjustments you made, and document any manual interventions. Over time, this journal will help you identify conditions where the strategy excels versus struggles, allowing you to selectively enable or disable trading during certain environments.
Technical Implementation Notes
All calculations execute on closed bars only (`calc_on_every_tick=false`) ensuring that signals and values do not repaint. Once a bar closes and a signal generates, that signal is permanent in the history.
The strategy uses fixed-quantity position sizing (`default_qty_type=strategy.fixed, default_qty_value=1`) with the actual contract quantity determined by the position sizing function and passed to the entry commands. This approach provides maximum control over risk allocation.
Order management uses Pine Script's native `strategy.entry()` and `strategy.exit()` functions with appropriate parameters for stops, limits, and trailing stops. All orders include explicit from_entry references to ensure they apply to the correct position.
The adaptive learning arrays (trade_returns, trade_directions, trade_types, trade_hours, trade_was_stopped) are maintained as circular buffers capped at PERFORMANCE_MEMORY size (default 100 trades). When a new trade closes, its data is added to the beginning of the array using `array.unshift()`, and the oldest trade is removed using `array.pop()` if capacity is exceeded. The stop-out tracking system analyzes the trade_was_stopped array to calculate the rolling percentage displayed in the dashboard.
Dashboard rendering occurs only on the confirmed bar (`barstate.isconfirmed`) to minimize computational overhead. The table is pre-created with sufficient rows for the selected dashboard size and cells are populated with current values each update.
Visual effects (fractal grid, wick pressure, morphism beams, order flow clouds, quantum field) recalculate on each bar for real-time chart updates. These are computationally intensive—if you experience chart lag, disable these visual components. The core strategy logic continues to function identically regardless of visual settings.
Timezone conversions use Pine Script's built-in timezone parameter on the `hour()`, `minute()`, and `dayofweek()` functions. This ensures session logic and daily/weekly resets occur at correct boundaries regardless of the chart's default timezone or the server's timezone.
The universal futures detection queries `syminfo.mintick` and `syminfo.pointvalue` on each strategy initialization to obtain the current instrument's specifications. These values remain constant throughout the strategy's execution on a given chart but automatically update when the strategy is applied to a different instrument.
The strategy has been tested on TradingView across timeframes from 5-minute through daily and across multiple futures instrument types including equity indices, energy, metals, agriculture, treasuries, and currencies. It functions identically on all instruments due to the percentage-based risk model and ATR-relative calculations which adapt automatically to price scale and volatility, combined with the universal futures detection system that handles contract-specific specifications.

Fusion Trend Pulse V2SCRIPT TITLE
Adaptive Fusion Trend Pulse V2 - Multi-Regime Strategy
DETAILED DESCRIPTION FOR PUBLICATION
🚀 INNOVATION SUMMARY
The Adaptive Fusion Trend Pulse V2 represents a breakthrough in algorithmic trading by introducing real-time market regime detection that automatically adapts strategy parameters based on current market conditions. Unlike static indicator combinations, this system dynamically adjusts its behavior across trending, choppy, and volatile market environments, providing a sophisticated multi-layered approach to market analysis.
🎯 CORE INNOVATIONS JUSTIFYING PROTECTED STATUS
1. Adaptive Market Regime Engine
Trending Market Detection: Uses ADX >25 with directional movement analysis
Volatile Market Classification: ATR-based volatility regime scoring (>1.2 threshold)
Choppy Market Identification: ADX <20 combined with volatility patterns
Dynamic Parameter Adjustment: All thresholds adapt based on detected regime
2. Multi-Component Fusion Algorithm
McGinley Dynamic Trend Baseline: Self-adjusting moving average that adapts to price velocity
Adaptive RMI (Relative Momentum Index): Enhanced RSI with momentum period adaptation
Zero-Lag EMA Smoothed CCI: Custom implementation reducing lag while maintaining signal quality
Hull MA Gradient Analysis: Slope strength normalized by ATR for trend confirmation
Volume Spike Detection: Regime-adjusted volume confirmation (0.8x-1.3x multipliers)
3. Intelligence Layer Features
Cooldown System: Prevents overtrading with regime-specific waiting periods (1-3 bars)
Performance Tracking: Real-time adaptation based on recent trade outcomes
Multi-Exchange Alert Integration: JSON-formatted alerts for automated trading
Comprehensive Dashboard: 16-metric real-time performance monitoring
📊 TECHNICAL SPECIFICATIONS
Market Regime Detection Philosophy:
The system continuously monitors market structure through volatility analysis and directional strength measurements. Rather than applying fixed thresholds, it creates dynamic response profiles that adjust the strategy's sensitivity, timing, and filtering based on the current market environment.
Adaptive Parameter Concept:
All strategy components modify their behavior based on regime classification. Volume requirements become more or less stringent, momentum thresholds shift to match market character, and exit timing adjusts to prevent whipsaws in different market conditions.
Entry Conditions (Both Long/Short):
McGinley trend alignment (close vs trend line)
Hull MA slope confirmation with ATR-normalized strength
Adaptive CCI above/below regime-specific thresholds
RMI momentum confirmation (>50 for long, <50 for short)
Volume spike exceeding regime-adjusted threshold
Regime-specific additional filters
Exit Strategy:
Dual take-profit system (2% and 4% default, customizable)
Momentum weakness detection (CCI reversal)
Trend breakdown (close below/above McGinley line)
Regime-specific urgency multipliers for faster exits in choppy markets
🎛️ USER CUSTOMIZATION OPTIONS
Core Parameters:
RMI Length & Momentum periods
CCI smoothing length
McGinley Dynamic length
Hull MA period for gradient analysis
Volume spike detection (length & multiplier)
Take profit levels (separate for long/short)
Adaptive Settings:
Market regime detection period (21 bars default)
Adaptation period for performance tracking (60 bars)
Volatility adaptation toggle
Trend strength filtering toggle
Momentum sensitivity multiplier (0.5-2.0 range)
Dashboard & Alerts:
Dashboard position (4 corners)
Dashboard size (Small/Normal/Large)
Transparency settings (0-100%)
Custom alert messages for bot integration
Date range filtering
🏆 UNIQUE VALUE PROPOSITIONS
1. Market Intelligence: First Pine Script strategy to implement comprehensive regime detection with parameter adaptation - most strategies use static settings regardless of market conditions.
2. Fusion Methodology: Combines 5+ distinct technical approaches (trend-following, momentum, volatility, volume, regime analysis) in a cohesive adaptive framework rather than simple indicator stacking.
3. Performance Optimization: Built-in learning system tracks recent performance and adjusts sensitivity - providing evolution rather than static rule-following.
4. Professional Integration: Enterprise-ready with JSON alert formatting, multi-exchange compatibility, and comprehensive performance tracking suitable for institutional use.
5. Visual Intelligence: Advanced dashboard provides 16 real-time metrics including regime classification, signal strength, and performance analytics - far beyond basic P&L displays.
🔧 TECHNICAL IMPLEMENTATION HIGHLIGHTS
Primary Applications:
Swing Trading: 4H-1D timeframes with regime-adapted entries
Algorithmic Trading: Automated execution via webhook alerts
Portfolio Management: Multi-timeframe analysis across different market conditions
Risk Management: Regime-aware position sizing and exit timing
Target Markets:
Cryptocurrency pairs (high volatility adaptation)
Forex majors (trending market optimization)
Stock indices (choppy market handling)
Commodities (volatile regime management)
🎯 WHY THIS ISN'T JUST AN INDICATOR MASHUP
Integrated Adaptation Framework: Unlike scripts that simply combine multiple indicators with static settings, this system creates a unified intelligence layer where each component influences and adapts to the others. The McGinley trend baseline doesn't just provide signals - it dynamically adjusts its sensitivity based on market regime detection. The momentum components modify their thresholds based on trend strength analysis.
Feedback Loop Architecture: The strategy incorporates a closed-loop learning system where recent performance influences future parameter selection. This creates evolution rather than static rule application. Most indicator combinations lack this adaptive learning capability.
Contextual Decision Making: Rather than treating each signal independently, the system uses contextual analysis where the same technical setup may generate different responses based on the current market regime. A momentum signal in a trending market triggers different behavior than the identical signal in choppy conditions.
Unified Risk Management: The regime detection doesn't just affect entries - it creates a comprehensive risk framework that adjusts exit timing, cooldown periods, and position management based on market character. This holistic approach distinguishes it from simple indicator stacking.
Custom Implementation Depth: Each component uses proprietary implementations (custom McGinley calculation, zero-lag CCI smoothing, enhanced RMI) rather than standard built-in functions, creating a cohesive algorithmic ecosystem rather than disconnected indicator outputs.
Custom Functions:
mcginley(): Proprietary implementation of McGinley Dynamic MA
rmi(): Enhanced Relative Momentum Index with custom parameters
zlema(): Zero-lag EMA for CCI smoothing
Regime classification algorithms with multi-factor analysis
Performance Optimizations:
Efficient variable management with proper scoping
Minimal repainting through careful historical referencing
Optimized calculations to prevent timeout issues
Memory-efficient tracking systems
Alert System:
JSON-formatted messages for API integration
Dynamic symbol/exchange substitution
Separate entry/exit/TP alert conditions
Customizable message formatting
⚡ WHY THIS REQUIRES PROTECTION
This strategy represents months of research into adaptive trading systems and market regime analysis. The specific combination of:
Proprietary regime detection algorithms
Custom adaptive parameter calculations
Multi-indicator fusion methodology
Performance-based learning system
Professional-grade implementation
Creates intellectual property that provides genuine competitive advantage. The methodology is not available in existing open-source scripts and represents original research into algorithmic trading adaptation.
🎯 EDUCATIONAL VALUE
Users gain exposure to:
Advanced market regime analysis techniques
Adaptive parameter optimization concepts
Multi-timeframe indicator fusion
Professional strategy development practices
Automated trading integration methods
The comprehensive dashboard and parameter explanations serve as a learning tool for understanding how professional algorithms adapt to changing market conditions.
CATEGORY SELECTION
Primary: Strategy
Secondary: Trend Analysis
SUGGESTED TAGS
adaptive, trend, momentum, regime, strategy, alerts, dashboard, mcginley, rmi, cci, professional
MANDATORY DISCLAIMER
Disclaimer: This strategy is for educational and informational purposes only. It does not constitute financial advice. Trading cryptocurrencies involves substantial risk, and past performance is not indicative of future results. Always backtest and forward-test before using on a live account. Use at your own risk.

Signalgo Strategy ISignalgo Strategy I: Technical Overview
Signalgo Strategy I is a systematically engineered TradingView strategy script designed to automate, test, and manage trend-following trades using multi-timeframe price/volume logic, volatility-based targets, and multi-layered exit management. This summary covers its operational structure, user inputs, entry and exit methodology, unique technical features, and practical application.
Core Logic and Workflow
Multi-Timeframe Data Synthesis
User-Defined Timeframe: The user chooses a timeframe (e.g., 1H, 4H, 1D, etc.), on which all strategy signals are based.
Cross-Timeframe Inputs: The strategy imports closing price, volume, and Average True Range (ATR) for the selected interval, independently from the chart’s native timeframe, enabling robust multi-timeframe analysis.
Price Change & Volume Ratio: It calculates the percent change of price per bar and computes a volume ratio by comparing current volume to its 20-bar moving average—enabling detection of true “event” moves vs. normal market noise.
Hype Filtering
Anti-Hype Mechanism: An entry is automatically filtered out if abnormal high volume occurs without corresponding price movement, commonly observed during manipulation or announcement periods. This helps isolate genuine market-driven momentum.
User Inputs
Select Timeframe: Choose which interval drives signal generation.
Backtest Start Date: Specify from which date historical signals are included in the strategy (for precise backtests).
Take-Profit/Stop-Loss Configuration: Internally, risk levels are set as multiples of ATR and allow for three discrete profit targets.
Entry Logic
Trade Signal Criteria:
Price change magnitude in the current bar must exceed a fixed sensitivity threshold.
Volume for the bar must be significantly elevated compared to average, indicating meaningful participation.
Anti-hype check must not be triggered.
Bullish/Bearish Determination: If all conditions are met and price change direction is positive, a long signal triggers. If negative, a short signal triggers.
Signal Debouncing: Ensures a signal triggers only when a new condition emerges, avoiding duplicate entries on flat or choppy bars.
State Management: The script tracks whether an active long or short is open to avoid overlapping entries and to facilitate clean reversals.
Exit Strategy
Take-Profits: Three distinct profit targets (TP1, TP2, TP3) are calculated as fixed multiples of the ATR-based stop loss, adapting dynamically to volatility.
Reversals: If a buy signal appears while a short is open (or vice versa), the existing trade is closed and reversed in a single step.
Time-Based Exit: If, 49 bars after entry, the trade is in-profit but hasn’t reached TP1, it exits to avoid stagnation risk.
Adverse Move Exit: The position is force-closed if it suffers a 10% reversal from entry, acting as a catastrophic stop.
Visual Feedback: Each TP/SL/exit is plotted as a clear, color-coded line on the chart; no hidden logic is used.
Alerts: Built-in TradingView alert conditions allow automated notification for both entries and strategic exits.
Distinguishing Features vs. Traditional MA Strategies
Event-Based, Not Just Slope-Based: While classic moving average strategies enter trades on MA crossovers or slope changes, Signalgo Strategy I demands high-magnitude price and volume confirmation on the chosen timeframe.
Volume Filtering: Very few MA strategies independently filter for meaningful volume spikes.
Real Market Event Focus: The anti-hype filter differentiates organic market trends from manipulated “high-volume, no-move” sessions.
Three-Layer Exit Logic: Instead of a single trailing stop or fixed RR, this script manages three profit targets, time-based closures, and hard adverse thresholds.
Multi-Timeframe, Not Chart-Dependent: The “main” analytical interval can be set independently from the current chart, allowing for in-depth cross-timeframe backtests and system runs.
Reversal Handling: Automatic handling of signal reversals closes and flips positions precisely, reducing slippage and manual error.
Persistent State Tracking: Maintains variables tracking entry price, trade status, and target/stop levels independently of chart context.
Trading Application
Strategy Sandbox: Designed for robust backtesting, allowing users to simulate performance across historical data for any major asset or interval.
Active Risk Management: Trades are consistently managed for both fixed interval “stall” and significant loss, not just via trailing stops or fixed-day closes.
Alert Driven: Can power algorithmic trading bots or notify discretionary traders the moment a qualifying market event occurs.

RSI Risk | AlgoFy TraderRSI Risk | AlgoFy Trader
Overview
The RSI Risk | AlgoFy Trader is a trading system that combines RSI-based entry signals with automated capital management. This strategy identifies potential momentum shifts while controlling risk through calculated position sizing.
Key Features
Dynamic Risk Management:
Fixed Risk Per Trade: Users set maximum risk percentage per trade.
Automatic Position Sizing: Calculates position size based on stop-loss distance.
Capital Protection: Limits each trade's risk to user-defined percentage.
RSI Entry System:
Momentum Detection: Uses RSI crossovers above/below defined thresholds.
Clear Signals: Provides long/short entries on momentum transitions.
Multiple Exit Layers:
Dynamic Stop Loss: Stop based on recent price structure.
Fixed Safety Stop: Optional percentage-based stop loss.
Partial Take Profit: Optional early profit-taking.
Trailing Stop: Optional dynamic profit protection.
Performance Tracking:
Trade Statistics: Tracks win/loss streaks and performance metrics.
Monthly Dashboard: Shows monthly/yearly P&L with equity views.
Trade Details: Displays risk percentage and position size.
How It Works
Signal Detection: Monitors RSI for crossover events.
Risk Calculation: Determines stop-loss based on recent volatility.
Position Sizing: Calculates exact position to match risk percentage.
Example:
Account: $10,000 | Risk: 2% ($200 max)
Stop loss at 4% distance
Position size: $5,000
Result: 4% loss on $5,000 = $200 (2% of account)
Recommended Settings
Risk: 1-2% per trade
Enable fixed stop at 3-4%
Consider trailing stop activation
This script provides disciplined RSI trading with automated risk control, adjusting exposure while maintaining strict risk limits.

Dskyz (DAFE) Adaptive Regime - Quant Machine ProDskyz (DAFE) Adaptive Regime - Quant Machine Pro:
Buckle up for the Dskyz (DAFE) Adaptive Regime - Quant Machine Pro, is a strategy that’s your ultimate edge for conquering futures markets like ES, MES, NQ, and MNQ. This isn’t just another script—it’s a quant-grade powerhouse, crafted with precision to adapt to market regimes, deliver multi-factor signals, and protect your capital with futures-tuned risk management. With its shimmering DAFE visuals, dual dashboards, and glowing watermark, it turns your charts into a cyberpunk command center, making trading as thrilling as it is profitable.
Unlike generic scripts clogging up the space, the Adaptive Regime is a DAFE original, built from the ground up to tackle the chaos of futures trading. It identifies market regimes (Trending, Range, Volatile, Quiet) using ADX, Bollinger Bands, and HTF indicators, then fires trades based on a weighted scoring system that blends candlestick patterns, RSI, MACD, and more. Add in dynamic stops, trailing exits, and a 5% drawdown circuit breaker, and you’ve got a system that’s as safe as it is aggressive. Whether you’re a newbie or a prop desk pro, this strat’s your ticket to outsmarting the markets. Let’s break down every detail and see why it’s a must-have.
Why Traders Need This Strategy
Futures markets are a gauntlet—fast moves, volatility spikes (like the April 28, 2025 NQ 1k-point drop), and institutional traps that punish the unprepared. Meanwhile, platforms are flooded with low-effort scripts that recycle old ideas with zero innovation. The Adaptive Regime stands tall, offering:
Adaptive Intelligence: Detects market regimes (Trending, Range, Volatile, Quiet) to optimize signals, unlike one-size-fits-all scripts.
Multi-Factor Precision: Combines candlestick patterns, MA trends, RSI, MACD, volume, and HTF confirmation for high-probability trades.
Futures-Optimized Risk: Calculates position sizes based on $ risk (default: $300), with ATR or fixed stops/TPs tailored for ES/MES.
Bulletproof Safety: 5% daily drawdown circuit breaker and trailing stops keep your account intact, even in chaos.
DAFE Visual Mastery: Pulsing Bollinger Band fills, dynamic SL/TP lines, and dual dashboards (metrics + position) make signals crystal-clear and charts a work of art.
Original Craftsmanship: A DAFE creation, built with community passion, not a rehashed clone of generic code.
Traders need this because it’s a complete, adaptive system that blends quant smarts, user-friendly design, and DAFE flair. It’s your edge to trade with confidence, cut through market noise, and leave the copycats in the dust.
Strategy Components
1. Market Regime Detection
The strategy’s brain is its ability to classify market conditions into five regimes, ensuring signals match the environment.
How It Works:
Trending (Regime 1): ADX > 20, fast/slow EMA spread > 0.3x ATR, HTF RSI > 50 or MACD bullish (htf_trend_bull/bear).
Range (Regime 2): ADX < 25, price range < 3% of close, no HTF trend.
Volatile (Regime 3): BB width > 1.5x avg, ATR > 1.2x avg, HTF RSI overbought/oversold.
Quiet (Regime 4): BB width < 0.8x avg, ATR < 0.9x avg.
Other (Regime 5): Default for unclear conditions.
Indicators: ADX (14), BB width (20), ATR (14, 50-bar SMA), HTF RSI (14, daily default), HTF MACD (12,26,9).
Why It’s Brilliant:
Regime detection adapts signals to market context, boosting win rates in trending or volatile conditions.
HTF RSI/MACD add a big-picture filter, rare in basic scripts.
Visualized via gradient background (green for Trending, orange for Range, red for Volatile, gray for Quiet, navy for Other).
2. Multi-Factor Signal Scoring
Entries are driven by a weighted scoring system that combines candlestick patterns, trend, momentum, and volume for robust signals.
Candlestick Patterns:
Bullish: Engulfing (0.5), hammer (0.4 in Range, 0.2 else), morning star (0.2), piercing (0.2), double bottom (0.3 in Volatile, 0.15 else). Must be near support (low ≤ 1.01x 20-bar low) with volume spike (>1.5x 20-bar avg).
Bearish: Engulfing (0.5), shooting star (0.4 in Range, 0.2 else), evening star (0.2), dark cloud (0.2), double top (0.3 in Volatile, 0.15 else). Must be near resistance (high ≥ 0.99x 20-bar high) with volume spike.
Logic: Patterns are weighted higher in specific regimes (e.g., hammer in Range, double bottom in Volatile).
Additional Factors:
Trend: Fast EMA (20) > slow EMA (50) + 0.5x ATR (trend_bull, +0.2); opposite for trend_bear.
RSI: RSI (14) < 30 (rsi_bull, +0.15); > 70 (rsi_bear, +0.15).
MACD: MACD line > signal (12,26,9, macd_bull, +0.15); opposite for macd_bear.
Volume: ATR > 1.2x 50-bar avg (vol_expansion, +0.1).
HTF Confirmation: HTF RSI < 70 and MACD bullish (htf_bull_confirm, +0.2); RSI > 30 and MACD bearish (htf_bear_confirm, +0.2).
Scoring:
bull_score = sum of bullish factors; bear_score = sum of bearish. Entry requires score ≥ 1.0.
Example: Bullish engulfing (0.5) + trend_bull (0.2) + rsi_bull (0.15) + htf_bull_confirm (0.2) = 1.05, triggers long.
Why It’s Brilliant:
Multi-factor scoring ensures signals are confirmed by multiple market dynamics, reducing false positives.
Regime-specific weights make patterns more relevant (e.g., hammers shine in Range markets).
HTF confirmation aligns with the big picture, a quant edge over simplistic scripts.
3. Futures-Tuned Risk Management
The risk system is built for futures, calculating position sizes based on $ risk and offering flexible stops/TPs.
Position Sizing:
Logic: Risk per trade (default: $300) ÷ (stop distance in points * point value) = contracts, capped at max_contracts (default: 5). Point value = tick value (e.g., $12.5 for ES) * ticks per point (4) * contract multiplier (1 for ES, 0.1 for MES).
Example: $300 risk, 8-point stop, ES ($50/point) → 0.75 contracts, rounded to 1.
Impact: Precise sizing prevents over-leverage, critical for micro contracts like MES.
Stops and Take-Profits:
Fixed: Default stop = 8 points, TP = 16 points (2:1 reward/risk).
ATR-Based: Stop = 1.5x ATR (default), TP = 3x ATR, enabled via use_atr_for_stops.
Logic: Stops set at swing low/high ± stop distance; TPs at 2x stop distance from entry.
Impact: ATR stops adapt to volatility, while fixed stops suit stable markets.
Trailing Stops:
Logic: Activates at 50% of TP distance. Trails at close ± 1.5x ATR (atr_multiplier). Longs: max(trail_stop_long, close - ATR * 1.5); shorts: min(trail_stop_short, close + ATR * 1.5).
Impact: Locks in profits during trends, a game-changer in volatile sessions.
Circuit Breaker:
Logic: Pauses trading if daily drawdown > 5% (daily_drawdown = (max_equity - equity) / max_equity).
Impact: Protects capital during black swan events (e.g., April 27, 2025 ES slippage).
Why It’s Brilliant:
Futures-specific inputs (tick value, multiplier) make it plug-and-play for ES/MES.
Trailing stops and circuit breaker add pro-level safety, rare in off-the-shelf scripts.
Flexible stops (ATR or fixed) suit different trading styles.
4. Trade Entry and Exit Logic
Entries and exits are precise, driven by bull_score/bear_score and protected by drawdown checks.
Entry Conditions:
Long: bull_score ≥ 1.0, no position (position_size <= 0), drawdown < 5% (not pause_trading). Calculates contracts, sets stop at swing low - stop points, TP at 2x stop distance.
Short: bear_score ≥ 1.0, position_size >= 0, drawdown < 5%. Stop at swing high + stop points, TP at 2x stop distance.
Logic: Tracks entry_regime for PNL arrays. Closes opposite positions before entering.
Exit Conditions:
Stop-Loss/Take-Profit: Hits stop or TP (strategy.exit).
Trailing Stop: Activates at 50% TP, trails by ATR * 1.5.
Emergency Exit: Closes if price breaches stop (close < long_stop_price or close > short_stop_price).
Reset: Clears stop/TP prices when flat (position_size = 0).
Why It’s Brilliant:
Score-based entries ensure multi-factor confirmation, filtering out weak signals.
Trailing stops maximize profits in trends, unlike static exits in basic scripts.
Emergency exits add an extra safety layer, critical for futures volatility.
5. DAFE Visuals
The visuals are pure DAFE magic, blending function with cyberpunk flair to make signals intuitive and charts stunning.
Shimmering Bollinger Band Fill:
Display: BB basis (20, white), upper/lower (green/red, 45% transparent). Fill pulses (30–50 alpha) by regime, with glow (60–95 alpha) near bands (close ≥ 0.995x upper or ≤ 1.005x lower).
Purpose: Highlights volatility and key levels with a futuristic glow.
Visuals make complex regimes and signals instantly clear, even for newbies.
Pulsing effects and regime-specific colors add a DAFE signature, setting it apart from generic scripts.
BB glow emphasizes tradeable levels, enhancing decision-making.
Chart Background (Regime Heatmap):
Green — Trending Market: Strong, sustained price movement in one direction. The market is in a trend phase—momentum follows through.
Orange — Range-Bound: Market is consolidating or moving sideways, with no clear up/down trend. Great for mean reversion setups.
Red — Volatile Regime: High volatility, heightened risk, and larger/faster price swings—trade with caution.
Gray — Quiet/Low Volatility: Market is calm and inactive, with small moves—often poor conditions for most strategies.
Navy — Other/Neutral: Regime is uncertain or mixed; signals may be less reliable.
Bollinger Bands Glow (Dynamic Fill):
Neon Red Glow — Warning!: Price is near or breaking above the upper band; momentum is overstretched, watch for overbought conditions or reversals.
Bright Green Glow — Opportunity!: Price is near or breaking below the lower band; market could be oversold, prime for bounce or reversal.
Trend Green Fill — Trending Regime: Fills between bands with green when the market is trending, showing clear momentum.
Gold/Yellow Fill — Range Regime: Fills with gold/aqua in range conditions, showing the market is sideways/oscillating.
Magenta/Red Fill — Volatility Spike: Fills with vivid magenta/red during highly volatile regimes.
Blue Fill — Neutral/Quiet: A soft blue glow for other or uncertain market states.
Moving Averages:
Display: Blue fast EMA (20), red slow EMA (50), 2px.
Purpose: Shows trend direction, with trend_dir requiring ATR-scaled spread.
Dynamic SL/TP Lines:
Display: Pulsing colors (red SL, green TP for Trending; yellow/orange for Range, etc.), 3px, with pulse_alpha for shimmer.
Purpose: Tracks stops/TPs in real-time, color-coded by regime.
6. Dual Dashboards
Two dashboards deliver real-time insights, making the strat a quant command center.
Bottom-Left Metrics Dashboard (2x13):
Metrics: Mode (Active/Paused), trend (Bullish/Bearish/Neutral), ATR, ATR avg, volume spike (YES/NO), RSI (value + Oversold/Overbought/Neutral), HTF RSI, HTF trend, last signal (Buy/Sell/None), regime, bull score.
Display: Black (29% transparent), purple title, color-coded (green for bullish, red for bearish).
Purpose: Consolidates market context and signal strength.
Top-Right Position Dashboard (2x7):
Metrics: Regime, position side (Long/Short/None), position PNL ($), SL, TP, daily PNL ($).
Display: Black (29% transparent), purple title, color-coded (lime for Long, red for Short).
Purpose: Tracks live trades and profitability.
Why It’s Brilliant:
Dual dashboards cover market context and trade status, a rare feature.
Color-coding and concise metrics guide beginners (e.g., green “Buy” = go).
Real-time PNL and SL/TP visibility empower disciplined trading.
7. Performance Tracking
Logic: Arrays (regime_pnl_long/short, regime_win/loss_long/short) track PNL and win/loss by regime (1–5). Updated on trade close (barstate.isconfirmed).
Purpose: Prepares for future adaptive thresholds (e.g., adjust bull_score min based on regime performance).
Why It’s Brilliant: Lays the groundwork for self-optimizing logic, a quant edge over static scripts.
Key Features
Regime-Adaptive: Optimizes signals for Trending, Range, Volatile, Quiet markets.
Futures-Optimized: Precise sizing for ES/MES with tick-based risk inputs.
Multi-Factor Signals: Candlestick patterns, RSI, MACD, and HTF confirmation for robust entries.
Dynamic Exits: ATR/fixed stops, 2:1 TPs, and trailing stops maximize profits.
Safe and Smart: 5% drawdown breaker and emergency exits protect capital.
DAFE Visuals: Shimmering BB fill, pulsing SL/TP, and dual dashboards.
Backtest-Ready: Fixed qty and tick calc for accurate historical testing.
How to Use
Add to Chart: Load on a 5min ES/MES chart in TradingView.
Configure Inputs: Set instrument (ES/MES), tick value ($12.5/$1.25), multiplier (1/0.1), risk ($300 default). Enable ATR stops for volatility.
Monitor Dashboards: Bottom-left for regime/signals, top-right for position/PNL.
Backtest: Run in strategy tester to compare regimes.
Live Trade: Connect to Tradovate or similar. Watch for slippage (e.g., April 27, 2025 ES issues).
Replay Test: Try April 28, 2025 NQ drop to see regime shifts and stops.
Disclaimer
Trading futures involves significant risk of loss and is not suitable for all investors. Past performance does not guarantee future results. Backtest results may differ from live trading due to slippage, fees, or market conditions. Use this strategy at your own risk, and consult a financial advisor before trading. Dskyz (DAFE) Trading Systems is not responsible for any losses incurred.
Backtesting:
Frame: 2023-09-20 - 2025-04-29
Slippage: 3
Fee Typical Range (per side, per contract)
CME Exchange $1.14 – $1.20
Clearing $0.10 – $0.30
NFA Regulatory $0.02
Firm/Broker Commis. $0.25 – $0.80 (retail prop)
TOTAL $1.60 – $2.30 per side
Round Turn: (enter+exit) = $3.20 – $4.60 per contract
Final Notes
The Dskyz (DAFE) Adaptive Regime - Quant Machine Pro is more than a strategy—it’s a revolution. Crafted with DAFE’s signature precision, it rises above generic scripts with adaptive regimes, quant-grade signals, and visuals that make trading a thrill. Whether you’re scalping MES or swinging ES, this system empowers you to navigate markets with confidence and style. Join the DAFE crew, light up your charts, and let’s dominate the futures game!
(This publishing will most likely be taken down do to some miscellaneous rule about properly displaying charting symbols, or whatever. Once I've identified what part of the publishing they want to pick on, I'll adjust and repost.)
Use it with discipline. Use it with clarity. Trade smarter.
**I will continue to release incredible strategies and indicators until I turn this into a brand or until someone offers me a contract.
Created by Dskyz, powered by DAFE Trading Systems. Trade smart, trade bold.

GRASS Purple Cloud [MMD] MTFThis Pine Script code is a trading strategy designed for use on the TradingView platform. It implements a multi-timeframe (MTF) strategy called "GRASS Purple Cloud " that utilizes various technical indicators to generate buy and sell signals. Below is a breakdown of the key components of the script:
Key Components of the Strategy
Inputs:
HTF (Higher Time Frame): Allows the user to select a higher time frame for analysis.
ATR and Supertrend Parameters: Inputs for the Average True Range (ATR) and Supertrend indicator, which are used to determine market volatility and trend direction.
Buying and Selling Pressure Thresholds: These thresholds help define conditions for entering trades based on buying and selling pressure.
Backtest Date Range: Users can specify a date range for backtesting the strategy.
HTF Logic:
The htfLogic function calculates various values based on the selected higher time frame, including buying and selling conditions, which are then used to generate signals.
Signal State Tracking:
The script tracks the state of buy and sell signals using a variable xs, which changes based on the conditions defined in the htfLogic function.
Coloring and Labels:
The bars on the chart are colored green for buy signals and red for sell signals. Additionally, labels are plotted to indicate strong buy and sell signals.
EMA Plotting:
The script includes optional plotting of Exponential Moving Averages (EMAs) for 20, 50, and 200 periods, which can help traders identify trends.
Trade Management:
The strategy includes parameters for take profit (TP) and stop loss (SL) levels, allowing for risk management. The user can specify the percentage for TP and SL, as well as the number of units to sell at each level.
Entries and Exits:
The script defines conditions for entering long and short positions based on the buy and sell signals. It also manages exits based on TP and SL levels.
Trendline Logic:
The script identifies the last two significant highs to draw a trendline, which can help visualize market structure.
TP/SL Plotting:
The script plots the TP and SL levels on the chart for visual reference.
Reset After Exit:
After a trade is closed, the script resets the relevant variables to prepare for the next trade.
Usage
To use this strategy:
Adjust the input parameters as needed for your trading preferences.
Add the strategy to a chart to visualize the signals and performance.
Considerations
As with any trading strategy, it's essential to backtest and validate the performance over historical data before using it in live trading.
Market conditions can change, and past performance is not indicative of future results. Always use risk management practices when trading.

Sunil BB Blast Heikin Ashi StrategySunil BB Blast Heikin Ashi Strategy
The Sunil BB Blast Heikin Ashi Strategy is a trend-following trading strategy that combines Bollinger Bands with Heikin-Ashi candles for precise market entries and exits. It aims to capitalize on price volatility while ensuring controlled risk through dynamic stop-loss and take-profit levels based on a user-defined Risk-to-Reward Ratio (RRR).
Key Features:
Trading Window:
The strategy operates within a user-defined time window (e.g., from 09:20 to 15:00) to align with market hours or other preferred trading sessions.
Trade Direction:
Users can select between Long Only, Short Only, or Long/Short trade directions, allowing flexibility depending on market conditions.
Bollinger Bands:
Bollinger Bands are used to identify potential breakout or breakdown zones. The strategy enters trades when price breaks through the upper or lower Bollinger Band, indicating a possible trend continuation.
Heikin-Ashi Candles:
Heikin-Ashi candles help smooth price action and filter out market noise. The strategy uses these candles to confirm trend direction and improve entry accuracy.
Risk Management (Risk-to-Reward Ratio):
The strategy automatically adjusts the take-profit (TP) level and stop-loss (SL) based on the selected Risk-to-Reward Ratio (RRR). This ensures that trades are risk-managed effectively.
Automated Alerts and Webhooks:
The strategy includes automated alerts for trade entries and exits. Users can set up JSON webhooks for external execution or trading automation.
Active Position Tracking:
The strategy tracks whether there is an active position (long or short) and only exits when price hits the pre-defined SL or TP levels.
Exit Conditions:
The strategy exits positions when either the take-profit (TP) or stop-loss (SL) levels are hit, ensuring risk management is adhered to.
Default Settings:
Trading Window:
09:20-15:00
This setting confines the strategy to the specified hours, ensuring trading only occurs during active market hours.
Strategy Direction:
Default: Long/Short
This allows for both long and short trades depending on market conditions. You can select "Long Only" or "Short Only" if you prefer to trade in one direction.
Bollinger Band Length (bbLength):
Default: 19
Length of the moving average used to calculate the Bollinger Bands.
Bollinger Band Multiplier (bbMultiplier):
Default: 2.0
Multiplier used to calculate the upper and lower bands. A higher multiplier increases the width of the bands, leading to fewer but more significant trades.
Take Profit Multiplier (tpMultiplier):
Default: 2.0
Multiplier used to determine the take-profit level based on the calculated stop-loss. This ensures that the profit target aligns with the selected Risk-to-Reward Ratio.
Risk-to-Reward Ratio (RRR):
Default: 1.0
The ratio used to calculate the take-profit relative to the stop-loss. A higher RRR means larger profit targets.
Trade Automation (JSON Webhooks):
Allows for integration with external systems for automated execution:
Long Entry JSON: Customizable entry condition for long positions.
Long Exit JSON: Customizable exit condition for long positions.
Short Entry JSON: Customizable entry condition for short positions.
Short Exit JSON: Customizable exit condition for short positions.
Entry Logic:
Long Entry:
The strategy enters a long position when:
The Heikin-Ashi candle shows a bullish trend (green close > open).
The price is above the upper Bollinger Band, signaling a breakout.
The previous candle also closed higher than it opened.
Short Entry:
The strategy enters a short position when:
The Heikin-Ashi candle shows a bearish trend (red close < open).
The price is below the lower Bollinger Band, signaling a breakdown.
The previous candle also closed lower than it opened.
Exit Logic:
Take-Profit (TP):
The take-profit level is calculated as a multiple of the distance between the entry price and the stop-loss level, determined by the selected Risk-to-Reward Ratio (RRR).
Stop-Loss (SL):
The stop-loss is placed at the opposite Bollinger Band level (lower for long positions, upper for short positions).
Exit Trigger:
The strategy exits a trade when either the take-profit or stop-loss level is hit.
Plotting and Visuals:
The Heikin-Ashi candles are displayed on the chart, with green candles for uptrends and red candles for downtrends.
Bollinger Bands (upper, lower, and basis) are plotted for visual reference.
Entry points for long and short trades are marked with green and red labels below and above bars, respectively.
Strategy Alerts:
Alerts are triggered when:
A long entry condition is met.
A short entry condition is met.
A trade exits (either via take-profit or stop-loss).
These alerts can be used to trigger notifications or webhook events for automated trading systems.
Notes:
The strategy is designed for use on intraday charts but can be applied to any timeframe.
It is highly customizable, allowing for tailored risk management and trading windows.
The Sunil BB Blast Heikin Ashi Strategy combines two powerful technical analysis tools (Bollinger Bands and Heikin-Ashi candles) with strong risk management, making it suitable for both beginners and experienced traders.
Feebacks are welcome from the users.

Khaled Tamim's Avellaneda-Stoikov StrategyDescription:
This strategy applies the Avellaneda-Stoikov (A-S) model to generate buy and sell signals for underlying assets based on option pricing theory. The A-S model estimates bid and ask quotes for options contracts considering factors like volatility (sigma), time to expiration (T), and risk aversion (gamma).
Key Concepts:
Avellaneda-Stoikov Model: A mathematical framework for option pricing that incorporates volatility, time decay, and risk tolerance.
Bid-Ask Quotes: The theoretical buy and sell prices for an option contract.
Inventory Management: The strategy tracks its long or short position based on signals.
How it Works:
A-S Model Calculation: The avellanedaStoikov function calculates bid and ask quotes using the underlying asset's closing price, user-defined parameters (gamma, sigma, T, k, and M), and a small fee (adjustable).
Signal Generation: The strategy generates long signals when the closing price falls below the adjusted bid quote and short signals when it exceeds the adjusted ask quote.
Trade Execution: Buy and sell orders are triggered based on the generated signals (long for buy, short for sell).
Inventory Tracking: The strategy's net profit reflects the current inventory level (long or short position).
Customization:
Gamma (γ): Controls risk aversion in the A-S model (higher values imply lower risk tolerance).
Sigma (σ): Represents the underlying asset's expected volatility.
T: Time to expiration for the hypothetical option (defaults to a short-term option).
k: A constant factor in the A-S model calculations.
M: Minimum price buffer for buy/sell signals (prevents excessive churn).
Important Note:
This strategy simulates option pricing behavior for a theoretical option and does not directly trade options contracts. Backtesting results may not reflect actual market conditions.
Further Considerations:
The 0.1% fee is a placeholder and may need adjustment based on real-world trading costs.
Consider using realistic timeframes for T (e.g., expiry for a real option)
Disclaimer: This strategy is for educational purposes only and does not constitute financial advice.

Killzones SMT + IFVG detectorKillzones SMT + IFVG Detector
Summary
This strategy implements a specific intraday workflow inspired by ICT-style concepts.
It combines:
Killzone session levels (recording untouched highs/lows)
SMT divergence between NQ and ES (exclusive sweep logic)
IFVG confirmation (3-bar imbalance + width filter + inversion guard)
and an optional smart exit engine
The components are not simply mashed together: they interact in sequence.
A setup only confirms if all conditions line up (time window → untouched level sweep → divergence → valid IFVG → confirmation candle → risk filter).
Workflow
Killzones & session levels
Tracks highs/lows inside default killzones (19:00–23:00, 01:00–04:00, 08:30–10:00, 11:00–12:00, 12:30–15:00, chart timezone).
Stores untouched levels forward; sweeps trigger candidate signals.
SMT divergence (exclusive sweep)
Bullish SMT : one index sweeps its low while the other remains above its session low.
Bearish SMT : one index sweeps its high while the other remains below its session high.
Detection supports “Sweep (Cross)” or “Exact Tick.”
Session IDs are tracked so once a side has fired, later re-touches can’t re-trigger .
IFVG confirmation
Locks the first valid 3-bar IFVG after SMT.
Confirmation requires a candle close beyond the IFVG boundary in the direction of the close.
IFVGs must meet a minimum width filter (default 1.0 point).
Inversion guard: ignores IFVGs already inverted before SMT.
Optional “re-lock” keeps tracking the latest IFVG until confirmation/expiry.
Smart exit engine
Initial stop from opposite wick (+ buffer).
Fixed TP (default 40 points).
Dynamic stop escalation at progress thresholds (BE → 50% → 80% of target).
Safety gates
Weekend lockout (Fri 16:40 → Sun 18:00).
Same-bar sweep of high & low cancels setups.
Max initial stop filter skips oversized setups.
Optional cooldown bars.
Alerts
SMT Bullish/Bearish : divergence detected this bar.
Confirm Long/Short : IFVG confirmation triggered.
Default Strategy Properties (used in screenshots/backtests)
Initial capital: $25,000
Order size: 1 contract
Commission: $1.25 per contract per side
Slippage: 2 ticks
Backtest window: Jun 16, 2025 – Sep 14, 2025
These settings are intentionally conservative. If you change them, your results will differ.
How to use
Apply on an NQ or ES futures chart (1–5 min).
Choose your killzones and detection mode.
Select confirmation symbol (NQ, ES, or “Sweeper”).
Enable/disable IFVG re-lock.
Review signals and use alerts for automation if desired.
Limitations
Strict filters reduce trade count; extend backtest window for more samples.
Works best on NQ/ES; not validated elsewhere.
Past performance is not indicative of future results.
This is an educational tool ; not financial advice.

VWAP & Band Cross Strategy v6 - AdvancedThese are a few updates made to the original script. The daily take profit and stop loss functions correctly for 1 contract but because of the pyramiding input even if not used you'll need to multiply the values by the number of contracts to keep consistent results. I have been unable to correct that function. Let me know if you test the script and have any recommendations for improvement. If trading an actual account I do recommend setting hard daily limits with your provider because there is still slippage from the original exit alerts even with the daily stop loss in place.
1. Real-Time Execution & Hard PnL Limits (The Focus)
The most critical changes were implemented to ensure the daily profit and loss limits act as hard, real-time barriers instead of waiting for the candle to close.
• Intrabar Tick Execution: The parameter calc_on_every_tick=true was added to the strategy() declaration. This forces the entire script to re-evaluate its logic on every single price update (tick), enabling immediate action.
• Real-Time PnL Tracking: The PnL calculation was updated to track the total_daily_pnl by summing the realized profit/loss (from closed trades) and the unrealized profit/loss (strategy.openprofit) on every tick.
• Immediate Closure: The script now checks the total_daily_pnl against the user-defined limits (daily_take_profit_value, daily_stop_loss_value) and immediately executes strategy.close_all() the moment the threshold is breached, preventing further trading.
• Combined Risk Enforcement: The user-defined "Max Intraday Risk ($)" and the "Daily Stop Loss (Value)" are compared, and the script enforces the tighter of the two limits.
2. Visibility and External Alerting
To address the unavoidable issue of slippage (which causes price overshoot in fast markets even with tick execution), dedicated alert mechanisms were added.
• Dedicated Alert Condition: An alertcondition named DAILY PNL LIMIT REACHED was added. This allows you to set up a TradingView alert that triggers the instant the daily_limit_reached variable turns true, giving you the fastest possible notification.
• Visual Marker: A large red triangle (\u25b2) is plotted on the chart using plotchar at the exact moment the daily limit condition is met, providing a clear visual confirmation of the trigger bar.
3. Strategy Features and Input Flexibility
Several user-requested features were integrated to make the strategy more robust and customizable.
• Trailing Stop / Breakeven (TSL/BE): A new exit option, Fixed Ticks + TSL, was added, allowing you to set a fixed profit target while also deploying a trailing stop or breakeven level based on points/ticks gained.
• Multiple Exit Types: The exit strategy was expanded to include logic for several types: Fixed Ticks, ATR-based, Capped ATR-based, VWAP Cross, and Price/Band Crosses.
• Pyramiding Control: An input Max Pyramiding Entries was introduced to control how many positions the strategy can have open at the same time.
• Confirmation Logic Toggle: Added an input to choose how multiple confirmation indicators (RSI, SMMA, MACD) are combined: "AND" (all must be true) or "OR" (at least one must be true).
• Indicator Confirmations: Logic for three external indicators—RSI, SMMA (EMA), and MACD—was fully integrated to act as optional filters for entry.
• VWAP Reset Anchors: Logic was corrected to properly reset the VWAP calculation based on the selected period ("Daily", "Weekly", or "Session") by using Pine Script v6's required anchor series.
Trading Day Filters: Inputs were added to select which specific days of the week the strategy is allowed to trade.

Algoway V4.2📌 Algoway V4.2 — Multi-layered Strategy Powered by ADX, MACD & PSO
Overview
Algoway V4.2 is a layered algorithmic strategy designed for volatility-rich assets like cryptocurrencies. While some core components (such as PSO, MACD, and ADX oscillators) are adapted from known indicator models, the original logic, state tracking, and Candle Strength Oscillator (CSO) are fully custom-developed.
This strategy is not a simple combination of tools — it implements a conditional entry-exit logic system based on ADX zone transitions, momentum structure, and MACD/PSO signal synchronization, enhanced by custom-built CSO filtering.
🧠 Key Modules and How They Work Together
PSO (Premium Stochastic Oscillator)
Used to confirm local oversold/overbought pressure. Acts as a directional filter.
MACD (Normalized)
Volatility-normalized MACD values allow consistent signal detection even on volatile pairs. It triggers entries when momentum begins shifting.
ADX Zonal Logic
Divides the market into Range / MidRange / Trend Peak zones. Entries are allowed only under specific transitions — e.g., long entries only in yellow (low volatility) zones or in trend climax zones under certain pullbacks.
CSO (Candle Strength Oscillator) — Custom Module
Designed to measure real candle momentum and price structure consistency. It avoids false breakouts and filters trend fatigue.
🔁 How Logic Works
Strategy maintains state variables to track entry type and zone.
Exit conditions depend on the entry origin: entries from "Range" exit in "Peak", while "Peak" entries exit during pullbacks or mid-strength trend reversals.
Additional logic prevents entries when signals are not aligned across modules, minimizing noise.
Optional CSO module acts as a final microstructure confirmation before executing MACD-based midpoint entries.
📊 Example Parameters (for 5M crypto scalping)
Each module is tuned to respond to 5-minute crypto volatility:
Stochastic: fast response, tight thresholds
MACD: shortened EMAs, normalized
ADX: traditional smoothing, custom thresholds for zone switching
CSO: candle-based dynamic filter with visual zone mapping
🧪 Conclusion
Algoway V4.2 is not a script merger — it is a custom logic engine using familiar technical components but governed by a proprietary decision model, with additional filters and dynamic variable tracking.
It’s suitable for scalping or swing setups, and the internal logic is optimized for real trading conditions, not just visual backtests.

Trend Harvester PRO Trend Harvester PRO – Adaptive Trend-Following Strategy for Crypto
Trend Harvester PRO is a fully systematic trend-following strategy built for cryptocurrency markets on intraday timeframes — particularly optimized for the 1-hour chart. The script combines ZLEMA-based trend tracking, momentum confirmation, and a volatility-aware filter to detect high-probability directional moves with clarity and precision.
This is not a mashup of random indicators — each component serves a specific purpose in validating trends, avoiding choppy zones, and timing entries responsibly.
🔍 Strategy Logic Overview
The core objective is to detect sustainable, real-time trends and exit with multi-stage profit targets. To do this, the script uses several layers of confirmation:
1. 📊 ZLEMA Trend Engine (Zero Lag EMA)
This is the backbone of the strategy.
ZLEMA (Zero-Lag EMA) is a moving average that minimizes lag by adjusting for past data offset.
The strategy uses a fast ZLEMA and a slow ZLEMA, combined with a slope calculation, to assess the current trend.
When:
Fast ZLEMA > Slow ZLEMA
The ZLEMA is rising (positive slope)
→ The market is considered in an uptrend.
Conversely, if:
Fast ZLEMA < Slow ZLEMA
The slope is negative
→ The market is considered in a downtrend.
This setup detects not just direction, but also whether the trend has meaningful acceleration.
2. ⚡ Momentum Confirmation
Trend direction alone isn’t enough — we also need momentum agreement.
The script calculates a smoothed Rate of Change (ROC) to evaluate if momentum supports the direction of the ZLEMA trend.
For long trades: ROC must be positive
For short trades: ROC must be negative
This prevents taking trades where price is crossing moving averages but lacks follow-through power.
3. 🌪️ Volatility Filter
Choppy markets are common in crypto. To reduce false signals:
The script compares short-term volatility (10-bar standard deviation of price changes) to longer-term volatility.
If the ratio is too high (i.e., short-term volatility is spiking), the strategy avoids entry.
This ensures trades are only taken when the market is relatively calm and directional — avoiding false breakouts.
4. 🧠 Confirmation Bars + Trend State
Signals only trigger after a certain number of consecutive bars confirm trend direction (confirmBars).
This prevents reacting to just 1 candle and requires consistent evidence of trend.
A state machine is used to track current trend status:
+1 = confirmed uptrend
-1 = confirmed downtrend
0 = neutral / no trade
This trend state changes only after all conditions are met and confirmation bars pass.
5. 🧊 Cooldown Enforcement
After a trade exits (from TP or a trend reversal), the strategy enforces a cooldown period before new entries are allowed. This:
Prevents back-to-back entries on trend flips
Reduces overtrading
Helps avoid whipsaws or same-bar reversal trades
6. 🎯 Multi-Level Take Profits (TP1 & TP2)
Once a trade is entered:
Two limit exits are set automatically:
TP1: Closes 50% of the position at a configurable profit level
TP2: Closes the remaining 50%
If the trend weakens before TP2 is reached, the position is closed early.
Both long and short trades use the same logic, with user-defined percentages.
This system allows for partial profit-taking while keeping a portion of the trade running.
7. 🧾 Built-in Dashboard
The script includes a real-time dashboard showing:
Trend direction: Bullish, Bearish, or Neutral
Whether TP1 / TP2 was hit
Entry price
If currently in a trade
How many bars the trade has been open
This helps monitor strategy performance at a glance without needing extra labels.
8. 🔔 Webhook-Compatible Alerts
The strategy includes custom alerts that can be used for:
Long and Short entries
TP1 and TP2 hits
Exiting trades
These can be integrated into automated bot systems or used manually.
🔒 Non-Repainting Logic
The strategy uses only confirmed bar data (i.e., values from closed bars).
There are no repainting indicators.
Entries and exits are placed using strategy.entry and strategy.exit on confirmed conditions.
✅ How to Use It
Apply the strategy to 1H altcoin charts (BTC, ETH, SOL, etc.).
Tune the TP percentages (longTP1Pct, longTP2Pct, etc.) based on volatility.
Use the dashboard to monitor trend state and trade progress.
Combine with additional tools (like support/resistance or volume) for higher confluence.
Use the date filter to run backtests over defined periods.
⚠️ Risk Management Notice
This strategy does not include stop losses by default. It is designed to exit based on trend reversal or take-profit limits.
Always backtest thoroughly and use realistic sizing.
Do not risk more than 5–10% of your account on any trade.
Past results do not guarantee future performance. This tool is for educational and research purposes.
🧬 What Makes This Original
Trend Harvester PRO was built from scratch with tightly integrated logic:
ZLEMA tracks early trend direction with low lag
ROC confirms momentum in the same direction
Volatility filter avoids false setups
Multi-bar confirmation and cooldown logic control trade pacing
Dual TP exits manage partial profit-taking
A live dashboard makes real-time tracking intuitive
Unlike mashups of indicators with no synergy, each component here directly supports the quality of trade decisions, and the logic is modular, transparent, and non-repainting.
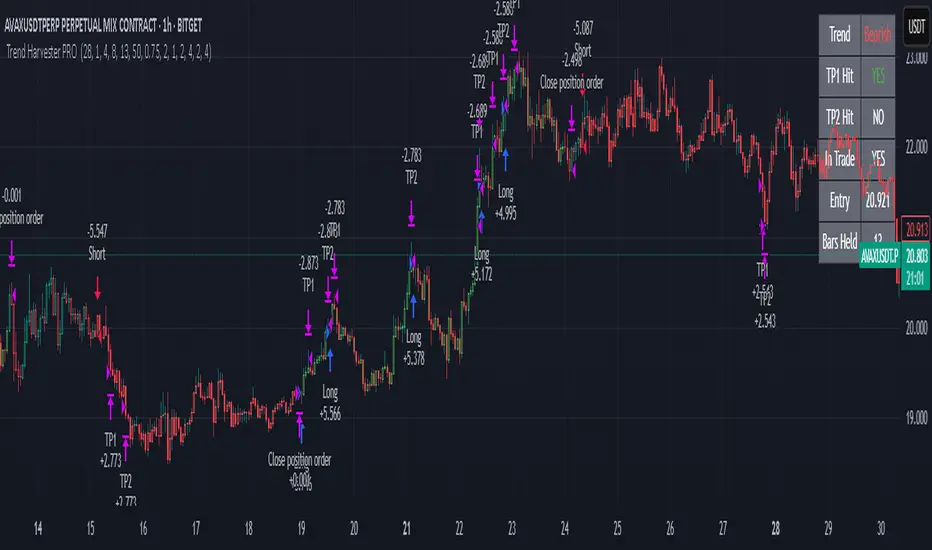
FTMO Rules MonitorFTMO Rules Monitor: Stay on Track with Your FTMO Challenge Goals
TLDR; You can test with this template whether your strategy for one asset would pass the FTMO challenges step 1 then step 2, then with real money conditions.
Passing a prop firm challenge is ... challenging.
I believe a toolkit allowing to test in minutes whether a strategy would have passed a prop firm challenge in the past could be very powerful.
The FTMO Rules Monitor is designed to help you stay within FTMO’s strict risk management guidelines directly on your chart. Whether you’re aiming for the $10,000 or the $200,000 account challenge, this tool provides real-time tracking of your performance against FTMO’s rules to ensure you don’t accidentally breach any limits.
NOTES
The connected indicator for this post doesn't matter.
It's just a dummy double supertrends (see below)
The strategy results for this script post does not matter as I'm posting a FTMO rules template on which you can connect any indicator/strategy.
//@version=5
indicator("Supertrends", overlay=true)
// Supertrend 1 Parameters
var string ST1 = "Supertrend 1 Settings"
st1_atrPeriod = input.int(10, "ATR Period", minval=1, maxval=50, group=ST1)
st1_factor = input.float(2, "Factor", minval=0.5, maxval=10, step=0.5, group=ST1)
// Supertrend 2 Parameters
var string ST2 = "Supertrend 2 Settings"
st2_atrPeriod = input.int(14, "ATR Period", minval=1, maxval=50, group=ST2)
st2_factor = input.float(3, "Factor", minval=0.5, maxval=10, step=0.5, group=ST2)
// Calculate Supertrends
= ta.supertrend(st1_factor, st1_atrPeriod)
= ta.supertrend(st2_factor, st2_atrPeriod)
// Entry conditions
longCondition = direction1 == -1 and direction2 == -1 and direction1 == 1
shortCondition = direction1 == 1 and direction2 == 1 and direction1 == -1
// Optional: Plot Supertrends
plot(supertrend1, "Supertrend 1", color = direction1 == -1 ? color.green : color.red, linewidth=3)
plot(supertrend2, "Supertrend 2", color = direction2 == -1 ? color.lime : color.maroon, linewidth=3)
plotshape(series=longCondition, location=location.belowbar, color=color.green, style=shape.triangleup, title="Long")
plotshape(series=shortCondition, location=location.abovebar, color=color.red, style=shape.triangledown, title="Short")
signal = longCondition ? 1 : shortCondition ? -1 : na
plot(signal, "Signal", display = display.data_window)
To connect your indicator to this FTMO rules monitor template, please update it as follow
Create a signal variable to store 1 for the long/buy signal or -1 for the short/sell signal
Plot it in the display.data_window panel so that it doesn't clutter your chart
signal = longCondition ? 1 : shortCondition ? -1 : na
plot(signal, "Signal", display = display.data_window)
In the FTMO Rules Monitor template, I'm capturing this external signal with this input.source variable
entry_connector = input.source(close, "Entry Connector", group="Entry Connector")
longCondition = entry_connector == 1
shortCondition = entry_connector == -1
🔶 USAGE
This indicator displays essential FTMO Challenge rules and tracks your progress toward meeting each one. Here’s what’s monitored:
Max Daily Loss
• 10k Account: $500
• 25k Account: $1,250
• 50k Account: $2,500
• 100k Account: $5,000
• 200k Account: $10,000
Max Total Loss
• 10k Account: $1,000
• 25k Account: $2,500
• 50k Account: $5,000
• 100k Account: $10,000
• 200k Account: $20,000
Profit Target
• 10k Account: $1,000
• 25k Account: $2,500
• 50k Account: $5,000
• 100k Account: $10,000
• 200k Account: $20,000
Minimum Trading Days: 4 consecutive days for all account sizes
🔹 Key Features
1. Real-Time Compliance Check
The FTMO Rules Monitor keeps track of your daily and total losses, profit targets, and trading days. Each metric updates in real-time, giving you peace of mind that you’re within FTMO’s rules.
2. Color-Coded Visual Feedback
Each rule’s status is shown clearly with a ✓ for compliance or ✗ if the limit is breached. When a rule is broken, the indicator highlights it in red, so there’s no confusion.
3. Completion Notification
Once all FTMO requirements are met, the indicator closes all open positions and displays a celebratory message on your chart, letting you know you’ve successfully completed the challenge.
4. Easy-to-Read Table
A table on your chart provides an overview of each rule, your target, current performance, and whether you’re meeting each goal. The table adjusts its color scheme based on your chart settings for optimal visibility.
5. Dynamic Position Sizing
Integrated ATR-based position sizing helps you manage risk and avoid large drawdowns, ensuring each trade aligns with FTMO’s risk management principles.
Daveatt

Sathya: Short the highShort the High
This script has been developed as a professional service and is published only for customer verification/acceptance.
If you are interested in development services, either PM me or visit the Backtest-Rookies website (.com)
Summary
This strategy will attempt to take a short position within a time window only after X consecutive up days. Once X consecutive up days have been detected, two windows will open up. The first window tracks the high of the day. The second window will attempt to short the high of the day if price retests it.
Features
Tracking of consecutive up days using intra-day data
Opening a trade window when consecutive up days are detected
Tracking the high of a sub-session (user definable)
Shorting the high during a second sub-session (user definable)
Stop losses and take profits
End of sub-session close out option.
Buffer range from high of the day. So price does not need to retouch the high but can come with x rupees.
Background coloring of sub-sessions so it is easy to track trades
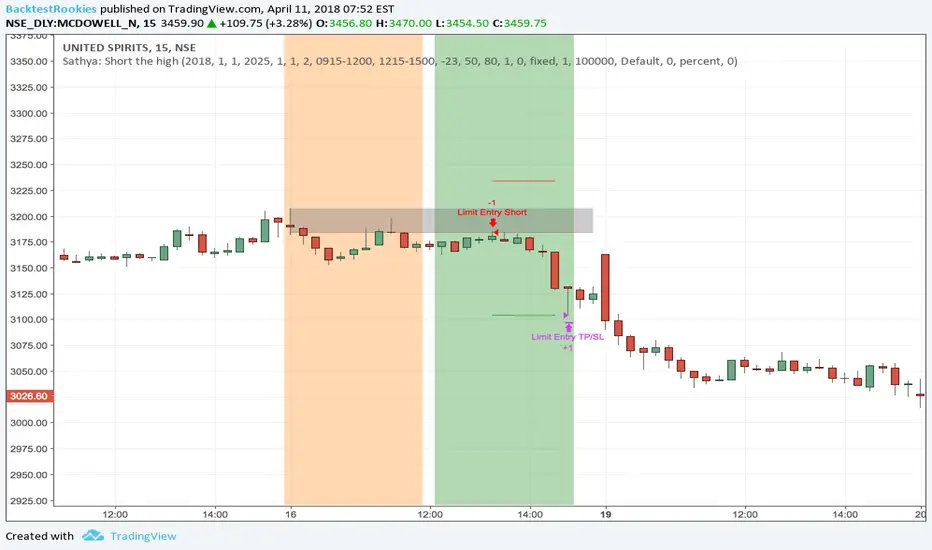
ORB Fusion Adaptive🎯 ORB Fusion Adaptive Strategy
Professional Opening Range Breakout Trading System
═══════════════════════════════════════════════════════════════════════════════
The first fully-automated, multi-instrument ORB strategy on TradingView.
💡 WHAT IT DOES:
Automatically trades Opening Range breakouts and failed breakout reversals with intelligent position sizing, professional risk management, and complete trade lifecycle tracking. Built for serious backtesting and live trading.
⚡ KEY FEATURES:
✓ Automated Entry & Exit (breakouts + reversals)
✓ Adaptive Position Sizing (3 modes: Fixed, Risk-Based, Risk-Based Initial)
✓ Multi-Instrument Support (Futures, Forex, Crypto, Stocks)
✓ Advanced Risk Management (daily limits, drawdown protection)
✓ ML-Powered Breakout Filtering (pContinue/pFail scoring)
✓ Failed Breakout Detection (high-probability reversals)
✓ Native Trailing Stops (Pine Script v5)
✓ Multi-Target Management (T1, T2, T3)
✓ Real-Time Performance Dashboard
✓ Comprehensive Backtesting (5+ years tested)
🎯 STRATEGY LOGIC:
Entry Signals
The strategy enters trades on two high-probability setups:
1. ORB Breakouts
• Detects when price breaks above/below Opening Range
• Confirms with volume (configurable threshold)
• ML filter scores probability of continuation
• Enters within 3 bars of breakout (no late entries)
• Stop placed at ORB midpoint or ATR-based
• Targets at Fibonacci extensions (1.0x, 1.618x, 2.5x ORB range)
2. Failed Breakout Reversals
• Monitors for breakouts that fail and reverse
• Confirms failure after price returns inside ORB
• Automatic reversal entry with tight stops
• Three profit targets (0.5x, 1.0x, 1.5x ORB range)
• Historical 65-75% win rate on reversals
Exit Management
• Stop Loss: Multiple methods (ATR, ORB Mid, ORB Opposite, Hybrid)
• Native Trailing Stop: Activates after configurable R-multiple profit
• Profit Targets: Single target or scaled exits at T1/T2/T3
• Daily Stop: Halts trading after max daily loss
• Drawdown Protection: Circuit breaker at max drawdown threshold
🔧 ADAPTIVE POSITION SIZING:
The strategy's most powerful feature - intelligent position sizing that adapts to your instrument and account:
Mode 1: Fixed
• Simple contract/lot size
• Best for: Testing, stable position sizing
• Use case: "Always trade 2 contracts"
Mode 2: Risk-Based (Current Equity)
• Size = (Current Equity × Risk%) / (Stop Distance × Point Value)
• Compounds with wins, reduces with losses
• Best for: Aggressive compounding
• Use case: Maximize geometric growth
Mode 3: Risk-Based (Initial Capital)
• Size = (Initial Capital × Risk%) / (Stop Distance × Point Value)
• No compounding - consistent risk exposure
• Best for: Professional risk management
• Use case: Live trading with stable risk
Multi-Instrument Intelligence
Auto-detects and calculates correctly for:
• Futures: Uses contract point value (ES $50/pt, NQ $20/pt, MES $5/pt, MNQ $2/pt)
• Forex: Uses pip value per lot (Standard/Mini/Micro/Nano)
• Crypto: Uses contract multiplier (1.0 BTC, 0.001 BTC, etc)
• Stocks: Uses $1 per share
Manual override available if auto-detect fails.
📊 RISK MANAGEMENT:
Multi-Layer Protection
• Per-Trade Risk: 0.5-2% of capital (configurable)
• Daily Risk Limit: Max 4% loss per day (halts trading)
• Max Drawdown Pause: Circuit breaker at 12% drawdown
• Position Size Limits: Min/max contracts enforced
• Max Stop Distance: ATR-based hard limit (prevents catastrophic losses)
Trailing Stop System
• Uses Pine Script's native trail_price and trail_offset
• Activates after configurable R-multiple profit (default 0.5R)
• Trail distance: ATR-based (tight 0.5 ATR to loose 2.0 ATR)
• Works reliably in backtesting AND live trading
• No manual stop management needed
🌍 GLOBAL MARKET SUPPORT:
Configurable Sessions
Unlike basic ORB indicators, this strategy works globally:
• US Equities: 9:30 AM ET default
• Forex London: Custom session 08:00-08:30 GMT
• Forex NY: Custom session 13:30-14:00 GMT
• Asian Markets: Custom session with Tokyo timezone
• Crypto: 24/7 support with custom ORB windows
Timezone support includes:
America/New_York, Europe/London, Asia/Tokyo, Asia/Hong_Kong, UTC, and more.
Session ORBs
• Asian Session ORB (Tokyo open)
• London Session ORB (Forex primary)
• NY Session ORB (US market hours)
Critical for Forex traders working multiple sessions.
📈 BACKTESTING CAPABILITIES:
Realistic Simulation
• Commission: Configurable (default $1 per order)
• Slippage: 2 ticks default (adjustable)
• Volume Confirmation: Prevents unrealistic fills
• RTH Filtering: Optional Regular Trading Hours only
• Bar Magnifier: Improved intrabar execution
Performance Metrics Dashboard
Real-time statistics displayed:
• Total Trades & Win Rate
• Net P&L & Profit Factor
• Current Drawdown
• Daily P&L tracking
• Position details (if in trade)
• Position sizing mode & current size
Historical Testing
• Supports 5000+ bars of history
• Test across multiple market conditions
• Bull markets, bear markets, range-bound periods
• Optimize by day type (trend vs rotation)
🎛️ CUSTOMIZATION OPTIONS:
ORB Settings
• Timeframe: 5, 15, 30, or 60 minutes
• Confirmation: Close, Wick, or Body
• Volume: On/off with multiplier threshold
• LTF Precision: Sub-minute high/low detection
• RTH Filter: Regular Trading Hours only option
Breakout Detection
• ML Filtering: Enable/disable with thresholds
• Failed Breakout: Sensitivity (2-10 bars)
• Failure Buffer: ATR-based confirmation
• Entry Window: Bars after signal (prevents late entries)
Stop Methods
• ATR: Tight dynamic stops (recommended)
• ORB Mid: Structural stop at midpoint
• ORB Opposite: Wide stop at opposite boundary
• Hybrid: Best of ATR and structural
Target Methods
• Single: One target, full exit
• Scaled: Partial exits at T1/T2/T3 (recommended)
• Trail Only: No fixed targets, trail to exit
🔬 OPTIMIZATION GUIDE:
For Futures (ES, NQ, MNQ, MES)
• ORB: 30 min
• Confirmation: Close
• Volume: ON (1.5x)
• Stop Method: ATR (1.0x multiplier)
• Position Mode: Risk-Based (Initial)
• Risk Per Trade: 1.5%
• Failed Breakouts: ENABLE
For Forex Majors
• ORB: 60 min (or 15 min at London open)
• Confirmation: Close
• Volume: OFF (tick volume unreliable)
• Stop Method: ATR (1.5x multiplier)
• Position Mode: Risk-Based (Initial)
• Risk Per Trade: 1.0%
• Custom Session: 0800-0900 GMT
• Timezone: Europe/London
For Crypto (BTC, ETH)
• ORB: 60 min
• Confirmation: Close
• Volume: OFF or ON (1.2x)
• Stop Method: ATR (2.0x wider stops)
• Position Mode: Fixed or Risk-Based
• Risk Per Trade: 2.0% (higher volatility)
• Custom Session: Define your preferred window
For Stocks/ETF
• ORB: 15-30 min
• Confirmation: Body (most conservative)
• Volume: ON (2.0x threshold)
• Stop Method: Hybrid
• Position Mode: Risk-Based (Initial)
• Risk Per Trade: 1.0%
• RTH Only: ENABLED
• Gap Analysis: ENABLED
💎 ADVANCED FEATURES:
Initial Balance Analysis
• First hour range tracking (A + B periods)
• IB extensions at 0.5x, 1.0x, 1.5x, 2.0x
• Day type classification (Trend/Normal/Rotation)
• Adjusts strategy behavior by day type
ORB Extensions
• Fibonacci targets: 1.272x, 1.5x, 1.618x, 2.0x, 2.618x, 3.0x
• Dynamic monitoring for take-profit zones
• Extension tracking in statistics
VWAP Integration
• Institutional benchmark reference
• Standard deviation bands (1σ and 2σ)
• Breakout alignment scoring
• Context for trade quality
Gap Analysis
• Overnight gap detection
• Gap fill target projection
• Gap fill rate statistics
• Direction bias from gap type
Comprehensive Statistics
• Bull/Bear breakout win rates
• Reversal win rate (typically 65-75%)
• Day type distribution
• Extension statistics
• Gap fill rate
• Real-time performance tracking
🎨 VISUAL FEEDBACK:
Enhanced Plots
• ORB levels (High/Low/Mid continuous lines)
• Entry markers (L for long, S for short, 🔥 for reversals)
• Extension levels with labels
• Session ORBs (Asian/London/NY)
• IB levels and extensions
• VWAP with bands
• Failed breakout markers
Color-Coded Momentum Boxes
• Blue: Inside ORB (consolidation)
• Green: Above ORB (bullish momentum)
• Red: Below ORB (bearish momentum)
• Orange: Failed breakout zones
• Variable intensity based on distance
Dynamic Dashboards
• Main Dashboard: ORB status, breakout info, setup details, market context
• Strategy Dashboard: Trades, Win%, P&L, Profit Factor, Daily P&L, Drawdown, Position info
• Narrative Dashboard: Plain-language market interpretation
Three Display Modes
• Simple: Clean chart, essential ORB only
• Standard: ORB + IB + Sessions + VWAP (recommended)
• Advanced: All features + statistics
🔔 ALERT SYSTEM:
Strategy Alerts
• Breakout Entry (with ML probabilities)
• Failed Breakout Entry (with targets)
• Stop Hit (position closed)
• Target Hit (T1, T2, T3 partials)
• Extension Reached (profit zone)
• IB Break (potential trend day)
All alerts include:
• Direction and setup type
• Entry price and position size
• Stop and target levels
• ML scores (if enabled)
• Setup grade (A+ to D)
• Win rate context
⏱️ TIMEFRAMES: 1m-15m optimal (works on all)
💎 INSTRUMENTS: Futures, Forex, Crypto, Stocks, Indices
🎓 SKILL LEVEL: Intermediate to Advanced
📚 WHAT'S INCLUDED:
Comprehensive Documentation
• 200+ lines of detailed tooltips
• Every setting fully explained
• Optimization guides by market
• Position sizing calculator explanations
• Risk management framework
• Best practices and common pitfalls
Ready-to-Use Configurations
• Default settings optimized for ES/NQ
• Recommended settings for each instrument type
• Conservative vs Aggressive profiles
• Scalping vs Swing configurations
Full Transparency
• All calculations shown in dashboard
• Position sizing visible in real-time
• Strategy performance metrics live
• No black boxes or hidden logic
🚨 RISK DISCLAIMERS:
CRITICAL INFORMATION - PLEASE READ:
• This is a trading strategy that executes real trades in backtesting
• Past performance does NOT guarantee future results
• All trading involves substantial risk of loss
• Never risk money you cannot afford to lose
• This is NOT financial advice - for educational purposes only
• Requires understanding of ORB methodology and risk management
• Test thoroughly on paper/demo account before live trading
• Position sizing must be configured correctly for your account
• Stop losses are NOT guaranteed in all market conditions
• Slippage and commissions will affect live results
• Volatile markets may trigger circuit breakers (drawdown pause)
Strategy-Specific Risks:
• Opening range breakouts can fail (hence the reversal system)
• Volume confirmation may limit signals in low-volume instruments
• Custom sessions must match your market's actual hours
• Multi-instrument support requires correct point value configuration
• Trailing stops may exit early in volatile conditions
• Daily limits may prevent recovery trades
• Backtesting results may not match live execution
Position Sizing Warnings:
• Risk-Based modes can size large positions if stops are tight
• Always set max position size limits appropriate for your account
• Verify point values are correct for your instrument
• Test with small size first
• Monitor position size in dashboard before every trade
🎓 WHO THIS IS FOR:
Best Suited For:
• Traders with ORB methodology knowledge
• Those seeking a fully-automated system
• Backtesting enthusiasts
• Multi-instrument traders
• Risk-conscious systematic traders
• Traders who understand position sizing
Not Recommended For:
• Complete beginners to trading
• Those seeking "set and forget" with zero monitoring
• Traders unwilling to backtest first
• Those who don't understand risk management
• Accounts under $5,000 (position sizing too small)
💡 PRO TIPS:
Backtesting Best Practices
• Start with 2+ years of data
• Include both bull and bear markets
• Test on same timeframe you'll trade (5-min for 5-min ORB)
• Account for commissions/slippage realistically
• Verify win rate >45% and profit factor >1.3
Position Sizing
• Use Risk-Based (Initial Capital) for most consistent results
• Start with 1% risk per trade, increase to 1.5-2% if comfortable
• Set max position size to prevent oversizing
• Verify point values are correct before live trading
• Monitor dashboard for actual size before each trade
Risk Management
• NEVER disable daily loss limit
• Keep max drawdown pause at 12% or lower
• Use ATR stop method for best R:R
• Enable trailing stops for trend capturing
• Take partial profits at T1 (at least 30-40%)
Failed Breakout Trading
• These are your highest win-rate setups (65-75%)
• Always enable this feature
• Use tighter stops on reversals than breakouts
• Don't chase if you miss the entry window
• Three targets allow you to scale out profitably
ML Filtering
• Dramatically improves breakout quality
• Reduce signals but increase win rate
• Start with default thresholds (pCont≥0.55, pFail≤0.35)
• Lower signals = higher quality in choppy markets
• Can disable for more signals in strong trends
⚙️ TECHNICAL DETAILS:
Strategy Engine
• Pine Script v5
• Native strategy.entry() and strategy.exit()
• Trailing stops use trail_price/trail_offset (no repainting)
• Proper position sizing with strategy.position_size
• Realistic fills with commission and slippage
• Bar magnifier for improved intrabar execution
Performance
• Optimized for 1-minute to 15-minute charts
• Supports 5000+ bars of history
• Efficient calculations (no arrays in hot loops)
• Max 500 visual objects (boxes/lines/labels)
• No repainting - all signals confirmed on bar close
Position Sizing Engine
• Auto-detects Futures, Forex, Crypto, Stocks
• Uses syminfo.pointvalue when available
• Falls back to manual configuration
• Proper rounding to exchange increments
• Min/max limits enforced
Risk System
• Per-trade risk percentage enforced
• Daily P&L tracking
• Drawdown from peak equity
• Circuit breakers halt trading when limits hit
• Resets daily for fresh start
🔄 VERSION HISTORY:
Current Version: 1.0 (Initial Release)
• Complete ORB breakout + reversal strategy
• Adaptive position sizing (3 modes)
• Multi-instrument support
• Advanced risk management
• Native trailing stops
• ML filtering integration
• Comprehensive backtesting
• Real-time performance dashboard
Planned Updates:
• Additional session templates (Tokyo, Sydney)
• More stop methods
• Enhanced ML model training
• Volatility regime detection
• Trade journal export
═══════════════════════════════════════════════════════════════════════════════
Trade the opening range with institutional precision.
Automated entries. Intelligent sizing. Professional risk management.
Test first. Trade smart. Scale safely.
Taking you to school. — Dskyz, Trade with insight. Trade with anticipation.

Quantum Flux Universal Strategy Summary in one paragraph
Quantum Flux Universal is a regime switching strategy for stocks, ETFs, index futures, major FX pairs, and liquid crypto on intraday and swing timeframes. It helps you act only when the normalized core signal and its guide agree on direction. It is original because the engine fuses three adaptive drivers into the smoothing gains itself. Directional intensity is measured with binary entropy, path efficiency shapes trend quality, and a volatility squash preserves contrast. Add it to a clean chart, watch the polarity lane and background, and trade from positive or negative alignment. For conservative workflows use on bar close in the alert settings when you add alerts in a later version.
Scope and intent
• Markets. Large cap equities and ETFs. Index futures. Major FX pairs. Liquid crypto
• Timeframes. One minute to daily
• Default demo used in the publication. QQQ on one hour
• Purpose. Provide a robust and portable way to detect when momentum and confirmation align, while dampening chop and preserving turns
• Limits. This is a strategy. Orders are simulated on standard candles only
Originality and usefulness
• Unique concept or fusion. The novelty sits in the gain map. Instead of gating separate indicators, the model mixes three drivers into the adaptive gains that power two one pole filters. Directional entropy measures how one sided recent movement has been. Kaufman style path efficiency scores how direct the path has been. A volatility squash stabilizes step size. The drivers are blended into the gains with visible inputs for strength, windows, and clamps.
• What failure mode it addresses. False starts in chop and whipsaw after fast spikes. Efficiency and the squash reduce over reaction in noise.
• Testability. Every component has an input. You can lengthen or shorten each window and change the normalization mode. The polarity plot and background provide a direct readout of state.
• Portable yardstick. The core is normalized with three options. Z score, percent rank mapped to a symmetric range, and MAD based Z score. Clamp bounds define the effective unit so context transfers across symbols.
Method overview in plain language
The strategy computes two smoothed tracks from the chart price source. The fast track and the slow track use gains that are not fixed. Each gain is modulated by three drivers. A driver for directional intensity, a driver for path efficiency, and a driver for volatility. The difference between the fast and the slow tracks forms the raw flux. A small phase assist reduces lag by subtracting a portion of the delayed value. The flux is then normalized. A guide line is an EMA of a small lead on the flux. When the flux and its guide are both above zero, the polarity is positive. When both are below zero, the polarity is negative. Polarity changes create the trade direction.
Base measures
• Return basis. The step is the change in the chosen price source. Its absolute value feeds the volatility estimate. Mean absolute step over the window gives a stable scale.
• Efficiency basis. The ratio of net move to the sum of absolute step over the window gives a value between zero and one. High values mean trend quality. Low values mean chop.
• Intensity basis. The fraction of up moves over the window plugs into binary entropy. Intensity is one minus entropy, which maps to zero in uncertainty and one in very one sided moves.
Components
• Directional Intensity. Measures how one sided recent bars have been. Smoothed with RMA. More intensity increases the gain and makes the fast and slow tracks react sooner.
• Path Efficiency. Measures the straightness of the price path. A gamma input shapes the curve so you can make trend quality count more or less. Higher efficiency lifts the gain in clean trends.
• Volatility Squash. Normalizes the absolute step with Z score then pushes it through an arctangent squash. This caps the effect of spikes so they do not dominate the response.
• Normalizer. Three modes. Z score for familiar units, percent rank for a robust monotone map to a symmetric range, and MAD based Z for outlier resistance.
• Guide Line. EMA of the flux with a small lead term that counteracts lag without heavy overshoot.
Fusion rule
• Weighted sum of the three drivers with fixed weights visible in the code comments. Intensity has fifty percent weight. Efficiency thirty percent. Volatility twenty percent.
• The blend power input scales the driver mix. Zero means fixed spans. One means full driver control.
• Minimum and maximum gain clamps bound the adaptive gain. This protects stability in quiet or violent regimes.
Signal rule
• Long suggestion appears when flux and guide are both above zero. That sets polarity to plus one.
• Short suggestion appears when flux and guide are both below zero. That sets polarity to minus one.
• When polarity flips from plus to minus, the strategy closes any long and enters a short.
• When flux crosses above the guide, the strategy closes any short.
What you will see on the chart
• White polarity plot around the zero line
• A dotted reference line at zero named Zen
• Green background tint for positive polarity and red background tint for negative polarity
• Strategy long and short markers placed by the TradingView engine at entry and at close conditions
• No table in this version to keep the visual clean and portable
Inputs with guidance
Setup
• Price source. Default ohlc4. Stable for noisy symbols.
• Fast span. Typical range 6 to 24. Raising it slows the fast track and can reduce churn. Lowering it makes entries more reactive.
• Slow span. Typical range 20 to 60. Raising it lengthens the baseline horizon. Lowering it brings the slow track closer to price.
Logic
• Guide span. Typical range 4 to 12. A small guide smooths without eating turns.
• Blend power. Typical range 0.25 to 0.85. Raising it lets the drivers modulate gains more. Lowering it pushes behavior toward fixed EMA style smoothing.
• Vol window. Typical range 20 to 80. Larger values calm the volatility driver. Smaller values adapt faster in intraday work.
• Efficiency window. Typical range 10 to 60. Larger values focus on smoother trends. Smaller values react faster but accept more noise.
• Efficiency gamma. Typical range 0.8 to 2.0. Above one increases contrast between clean trends and chop. Below one flattens the curve.
• Min alpha multiplier. Typical range 0.30 to 0.80. Lower values increase smoothing when the mix is weak.
• Max alpha multiplier. Typical range 1.2 to 3.0. Higher values shorten smoothing when the mix is strong.
• Normalization window. Typical range 100 to 300. Larger values reduce drift in the baseline.
• Normalization mode. Z score, percent rank, or MAD Z. Use MAD Z for outlier heavy symbols.
• Clamp level. Typical range 2.0 to 4.0. Lower clamps reduce the influence of extreme runs.
Filters
• Efficiency filter is implicit in the gain map. Raising efficiency gamma and the efficiency window increases the preference for clean trends.
• Micro versus macro relation is handled by the fast and slow spans. Increase separation for swing, reduce for scalping.
• Location filter is not included in v1.0. If you need distance gates from a reference such as VWAP or a moving mean, add them before publication of a new version.
Alerts
• This version does not include alertcondition lines to keep the core minimal. If you prefer alerts, add names Long Polarity Up, Short Polarity Down, Exit Short on Flux Cross Up in a later version and select on bar close for conservative workflows.
Strategy has been currently adapted for the QQQ asset with 30/60min timeframe.
For other assets may require new optimization
Properties visible in this publication
• Initial capital 25000
• Base currency Default
• Default order size method percent of equity with value 5
• Pyramiding 1
• Commission 0.05 percent
• Slippage 10 ticks
• Process orders on close ON
• Bar magnifier ON
• Recalculate after order is filled OFF
• Calc on every tick OFF
Honest limitations and failure modes
• Past results do not guarantee future outcomes
• Economic releases, circuit breakers, and thin books can break the assumptions behind intensity and efficiency
• Gap heavy symbols may benefit from the MAD Z normalization
• Very quiet regimes can reduce signal contrast. Use longer windows or higher guide span to stabilize context
• Session time is the exchange time of the chart
• If both stop and target can be hit in one bar, tie handling would matter. This strategy has no fixed stops or targets. It uses polarity flips for exits. If you add stops later, declare the preference
Open source reuse and credits
• None beyond public domain building blocks and Pine built ins such as EMA, SMA, standard deviation, RMA, and percent rank
• Method and fusion are original in construction and disclosure
Legal
Education and research only. Not investment advice. You are responsible for your decisions. Test on historical data and in simulation before any live use. Use realistic costs.
Strategy add on block
Strategy notice
Orders are simulated by the TradingView engine on standard candles. No request.security() calls are used.
Entries and exits
• Entry logic. Enter long when both the normalized flux and its guide line are above zero. Enter short when both are below zero
• Exit logic. When polarity flips from plus to minus, close any long and open a short. When the flux crosses above the guide line, close any short
• Risk model. No initial stop or target in v1.0. The model is a regime flipper. You can add a stop or trail in later versions if needed
• Tie handling. Not applicable in this version because there are no fixed stops or targets
Position sizing
• Percent of equity in the Properties panel. Five percent is the default for examples. Risk per trade should not exceed five to ten percent of equity. One to two percent is a common choice
Properties used on the published chart
• Initial capital 25000
• Base currency Default
• Default order size percent of equity with value 5
• Pyramiding 1
• Commission 0.05 percent
• Slippage 10 ticks
• Process orders on close ON
• Bar magnifier ON
• Recalculate after order is filled OFF
• Calc on every tick OFF
Dataset and sample size
• Test window Jan 2, 2014 to Oct 16, 2025 on QQQ one hour
• Trade count in sample 324 on the example chart
Release notes template for future updates
Version 1.1.
• Add alertcondition lines for long, short, and exit short
• Add optional table with component readouts
• Add optional stop model with a distance unit expressed as ATR or a percent of price
Notes. Backward compatibility Yes. Inputs migrated Yes.

Game Theory Trading StrategyGame Theory Trading Strategy: Explanation and Working Logic
This Pine Script (version 5) code implements a trading strategy named "Game Theory Trading Strategy" in TradingView. Unlike the previous indicator, this is a full-fledged strategy with automated entry/exit rules, risk management, and backtesting capabilities. It uses Game Theory principles to analyze market behavior, focusing on herd behavior, institutional flows, liquidity traps, and Nash equilibrium to generate buy (long) and sell (short) signals. Below, I'll explain the strategy's purpose, working logic, key components, and usage tips in detail.
1. General Description
Purpose: The strategy identifies high-probability trading opportunities by combining Game Theory concepts (herd behavior, contrarian signals, Nash equilibrium) with technical analysis (RSI, volume, momentum). It aims to exploit market inefficiencies caused by retail herd behavior, institutional flows, and liquidity traps. The strategy is designed for automated trading with defined risk management (stop-loss/take-profit) and position sizing based on market conditions.
Key Features:
Herd Behavior Detection: Identifies retail panic buying/selling using RSI and volume spikes.
Liquidity Traps: Detects stop-loss hunting zones where price breaks recent highs/lows but reverses.
Institutional Flow Analysis: Tracks high-volume institutional activity via Accumulation/Distribution and volume spikes.
Nash Equilibrium: Uses statistical price bands to assess whether the market is in equilibrium or deviated (overbought/oversold).
Risk Management: Configurable stop-loss (SL) and take-profit (TP) percentages, dynamic position sizing based on Game Theory (minimax principle).
Visualization: Displays Nash bands, signals, background colors, and two tables (Game Theory status and backtest results).
Backtesting: Tracks performance metrics like win rate, profit factor, max drawdown, and Sharpe ratio.
Strategy Settings:
Initial capital: $10,000.
Pyramiding: Up to 3 positions.
Position size: 10% of equity (default_qty_value=10).
Configurable inputs for RSI, volume, liquidity, institutional flow, Nash equilibrium, and risk management.
Warning: This is a strategy, not just an indicator. It executes trades automatically in TradingView's Strategy Tester. Always backtest thoroughly and use proper risk management before live trading.
2. Working Logic (Step by Step)
The strategy processes each bar (candle) to generate signals, manage positions, and update performance metrics. Here's how it works:
a. Input Parameters
The inputs are grouped for clarity:
Herd Behavior (🐑):
RSI Period (14): For overbought/oversold detection.
Volume MA Period (20): To calculate average volume for spike detection.
Herd Threshold (2.0): Volume multiplier for detecting herd activity.
Liquidity Analysis (💧):
Liquidity Lookback (50): Bars to check for recent highs/lows.
Liquidity Sensitivity (1.5): Volume multiplier for trap detection.
Institutional Flow (🏦):
Institutional Volume Multiplier (2.5): For detecting large volume spikes.
Institutional MA Period (21): For Accumulation/Distribution smoothing.
Nash Equilibrium (⚖️):
Nash Period (100): For calculating price mean and standard deviation.
Nash Deviation (0.02): Multiplier for equilibrium bands.
Risk Management (🛡️):
Use Stop-Loss (true): Enables SL at 2% below/above entry price.
Use Take-Profit (true): Enables TP at 5% above/below entry price.
b. Herd Behavior Detection
RSI (14): Checks for extreme conditions:
Overbought: RSI > 70 (potential herd buying).
Oversold: RSI < 30 (potential herd selling).
Volume Spike: Volume > SMA(20) x 2.0 (herd_threshold).
Momentum: Price change over 10 bars (close - close ) compared to its SMA(20).
Herd Signals:
Herd Buying: RSI > 70 + volume spike + positive momentum = Retail buying frenzy (red background).
Herd Selling: RSI < 30 + volume spike + negative momentum = Retail selling panic (green background).
c. Liquidity Trap Detection
Recent Highs/Lows: Calculated over 50 bars (liquidity_lookback).
Psychological Levels: Nearest round numbers (e.g., $100, $110) as potential stop-loss zones.
Trap Conditions:
Up Trap: Price breaks recent high, closes below it, with a volume spike (volume > SMA x 1.5).
Down Trap: Price breaks recent low, closes above it, with a volume spike.
Visualization: Traps are marked with small red/green crosses above/below bars.
d. Institutional Flow Analysis
Volume Check: Volume > SMA(20) x 2.5 (inst_volume_mult) = Institutional activity.
Accumulation/Distribution (AD):
Formula: ((close - low) - (high - close)) / (high - low) * volume, cumulated over time.
Smoothed with SMA(21) (inst_ma_length).
Accumulation: AD > MA + high volume = Institutions buying.
Distribution: AD < MA + high volume = Institutions selling.
Smart Money Index: (close - open) / (high - low) * volume, smoothed with SMA(20). Positive = Smart money buying.
e. Nash Equilibrium
Calculation:
Price mean: SMA(100) (nash_period).
Standard deviation: stdev(100).
Upper Nash: Mean + StdDev x 0.02 (nash_deviation).
Lower Nash: Mean - StdDev x 0.02.
Conditions:
Near Equilibrium: Price between upper and lower Nash bands (stable market).
Above Nash: Price > upper band (overbought, sell potential).
Below Nash: Price < lower band (oversold, buy potential).
Visualization: Orange line (mean), red/green lines (upper/lower bands).
f. Game Theory Signals
The strategy generates three types of signals, combined into long/short triggers:
Contrarian Signals:
Buy: Herd selling + (accumulation or down trap) = Go against retail panic.
Sell: Herd buying + (distribution or up trap).
Momentum Signals:
Buy: Below Nash + positive smart money + no herd buying.
Sell: Above Nash + negative smart money + no herd selling.
Nash Reversion Signals:
Buy: Below Nash + rising close (close > close ) + volume > MA.
Sell: Above Nash + falling close + volume > MA.
Final Signals:
Long Signal: Contrarian buy OR momentum buy OR Nash reversion buy.
Short Signal: Contrarian sell OR momentum sell OR Nash reversion sell.
g. Position Management
Position Sizing (Minimax Principle):
Default: 1.0 (10% of equity).
In Nash equilibrium: Reduced to 0.5 (conservative).
During institutional volume: Increased to 1.5 (aggressive).
Entries:
Long: If long_signal is true and no existing long position (strategy.position_size <= 0).
Short: If short_signal is true and no existing short position (strategy.position_size >= 0).
Exits:
Stop-Loss: If use_sl=true, set at 2% below/above entry price.
Take-Profit: If use_tp=true, set at 5% above/below entry price.
Pyramiding: Up to 3 concurrent positions allowed.
h. Visualization
Nash Bands: Orange (mean), red (upper), green (lower).
Background Colors:
Herd buying: Red (90% transparency).
Herd selling: Green.
Institutional volume: Blue.
Signals:
Contrarian buy/sell: Green/red triangles below/above bars.
Liquidity traps: Red/green crosses above/below bars.
Tables:
Game Theory Table (Top-Right):
Herd Behavior: Buying frenzy, selling panic, or normal.
Institutional Flow: Accumulation, distribution, or neutral.
Nash Equilibrium: In equilibrium, above, or below.
Liquidity Status: Trap detected or safe.
Position Suggestion: Long (green), Short (red), or Wait (gray).
Backtest Table (Bottom-Right):
Total Trades: Number of closed trades.
Win Rate: Percentage of winning trades.
Net Profit/Loss: In USD, colored green/red.
Profit Factor: Gross profit / gross loss.
Max Drawdown: Peak-to-trough equity drop (%).
Win/Loss Trades: Number of winning/losing trades.
Risk/Reward Ratio: Simplified Sharpe ratio (returns / drawdown).
Avg Win/Loss Ratio: Average win per trade / average loss per trade.
Last Update: Current time.
i. Backtesting Metrics
Tracks:
Total trades, winning/losing trades.
Win rate (%).
Net profit ($).
Profit factor (gross profit / gross loss).
Max drawdown (%).
Simplified Sharpe ratio (returns / drawdown).
Average win/loss ratio.
Updates metrics on each closed trade.
Displays a label on the last bar with backtest period, total trades, win rate, and net profit.
j. Alerts
No explicit alertconditions defined, but you can add them for long_signal and short_signal (e.g., alertcondition(long_signal, "GT Long Entry", "Long Signal Detected!")).
Use TradingView's alert system with Strategy Tester outputs.
3. Usage Tips
Timeframe: Best for H1-D1 timeframes. Shorter frames (M1-M15) may produce noisy signals.
Settings:
Risk Management: Adjust sl_percent (e.g., 1% for volatile markets) and tp_percent (e.g., 3% for scalping).
Herd Threshold: Increase to 2.5 for stricter herd detection in choppy markets.
Liquidity Lookback: Reduce to 20 for faster markets (e.g., crypto).
Nash Period: Increase to 200 for longer-term analysis.
Backtesting:
Use TradingView's Strategy Tester to evaluate performance.
Check win rate (>50%), profit factor (>1.5), and max drawdown (<20%) for viability.
Test on different assets/timeframes to ensure robustness.
Live Trading:
Start with a demo account.
Combine with other indicators (e.g., EMAs, support/resistance) for confirmation.
Monitor liquidity traps and institutional flow for context.
Risk Management:
Always use SL/TP to limit losses.
Adjust position_size for risk tolerance (e.g., 5% of equity for conservative trading).
Avoid over-leveraging (pyramiding=3 can amplify risk).
Troubleshooting:
If no trades are executed, check signal conditions (e.g., lower herd_threshold or liquidity_sensitivity).
Ensure sufficient historical data for Nash and liquidity calculations.
If tables overlap, adjust position.top_right/bottom_right coordinates.
4. Key Differences from the Previous Indicator
Indicator vs. Strategy: The previous code was an indicator (VP + Game Theory Integrated Strategy) focused on visualization and alerts. This is a strategy with automated entries/exits and backtesting.
Volume Profile: Absent in this strategy, making it lighter but less focused on high-volume zones.
Wick Analysis: Not included here, unlike the previous indicator's heavy reliance on wick patterns.
Backtesting: This strategy includes detailed performance metrics and a backtest table, absent in the indicator.
Simpler Signals: Focuses on Game Theory signals (contrarian, momentum, Nash reversion) without the "Power/Ultra Power" hierarchy.
Risk Management: Explicit SL/TP and dynamic position sizing, not present in the indicator.
5. Conclusion
The "Game Theory Trading Strategy" is a sophisticated system leveraging herd behavior, institutional flows, liquidity traps, and Nash equilibrium to trade market inefficiencies. It’s designed for traders who understand Game Theory principles and want automated execution with robust risk management. However, it requires thorough backtesting and parameter optimization for specific markets (e.g., forex, crypto, stocks). The backtest table and visual aids make it easy to monitor performance, but always combine with other analysis tools and proper capital management.
If you need help with backtesting, adding alerts, or optimizing parameters, let me know!
