Combo Backtest 123 Reversal & Extracting The Trend This is combo strategies for get a cumulative signal.
First strategy
This System was created from the Book "How I Tripled My Money In The
Futures Market" by Ulf Jensen, Page 183. This is reverse type of strategies.
The strategy buys at market, if close price is higher than the previous close
during 2 days and the meaning of 9-days Stochastic Slow Oscillator is lower than 50.
The strategy sells at market, if close price is lower than the previous close price
during 2 days and the meaning of 9-days Stochastic Fast Oscillator is higher than 50.
Second strategy
Extracting The Trend
The related article is copyrighted material from Stocks & Commodities Mar 2010
WARNING:
- For purpose educate only
- This script to change bars colors.
Cari dalam skrip untuk "trend"

Combo Strategy 123 Reversal & Extracting The Trend This is combo strategies for get a cumulative signal.
First strategy
This System was created from the Book "How I Tripled My Money In The
Futures Market" by Ulf Jensen, Page 183. This is reverse type of strategies.
The strategy buys at market, if close price is higher than the previous close
during 2 days and the meaning of 9-days Stochastic Slow Oscillator is lower than 50.
The strategy sells at market, if close price is lower than the previous close price
during 2 days and the meaning of 9-days Stochastic Fast Oscillator is higher than 50.
Second strategy
Extracting The Trend
The related article is copyrighted material from Stocks & Commodities Mar 2010
WARNING:
- For purpose educate only
- This script to change bars colors.
[RS]Standardized Trend Mapnothing excessively new here..
a map of standardized trend over multiple lengths, extra parameter for smoothing the input source(close) will remove noise.

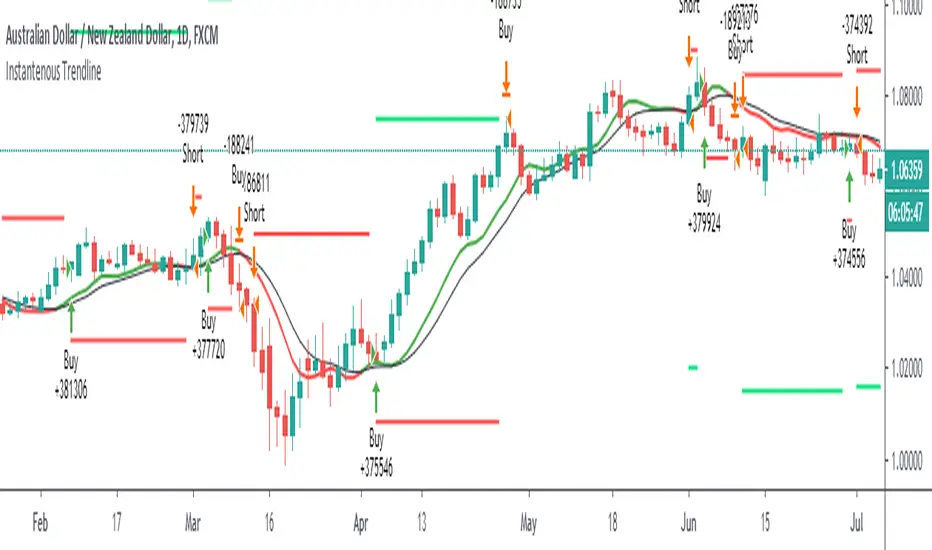
Etlers Instantenous TrendlineThis script uses @cheatcountry script to calculate Ehlers Instantenous Trendline .
Backtest offers 3 capital management tools. One that will always calculate order size as initial capital/close, one that uses the same calculation but adds or substracts profit. The last one allows you to enter manually the size you want to trade.
Green and red horizontal lines are profit/stop values.
Optimized Trend Tracker - Strategy VersionA brand new indicator from the developer of MOST (Moving Stop Loss) indicator Anıl Özekşi.
Optimized Trend Tracker OTT is an indicator that provides traders to find an existing trend or in another words to ser which side of the current trend we are on.
The original indicator was coded and published by Kıvanç Özbilgiç. You can access it from this link:
I transformed the indicator into a strategy and made some changes:
- You can run two different strategies. In the Settings section, you can test two different strategies, "Support Line Crossing Signals" and "Price / OTT Crossing Signals".
- Fixed the issue where BUY/SELL labels from the indicator script would hang in the air.
- I added a setting where you can hide BUY/SELL labels if you want.
- I painted the bars for BUY/SELL states, you can open and close in the settings section.
- As I do with every strategy script, I added a start and end date for the strategy test. You can specify the range you want to see working in the Settings section.
In addition, there were cases when the OTT line was reduced to zero in non-voluminous symbols; I changed this situation by making a small change in the code. I asked Kıvanç about the subject, I can update according to his answer.
Note : Strategy BUY / SELL tags and indicator BUY / SELL tags do not operate in the same bar because indicator tags are added when the next bar occurs. If you replay bars, you can observe label formations.
TÜRKÇE AÇIKLAMA
Orjinal indikatör Kıvanç Özbilgiç tarafından kodlanmış ve yayımlanmıştır. Bu linkten erişebilirsiniz:
İndikatörü strateji dönüştürdüm ve bazı değişiklikler yaptım:
- İki farklı strateji çalıştırabilirsiniz. Ayarlar kısmında Condition bölümünde "Support Line Crossing Signals" ve "Price/OTT Crossing Signals" olarak iki farklı stratejiyi test edebilirsiniz.
- İndikatör scriptinden gelen BUY/SELL etiketlerinin havada durması sorununu düzelttim.
- İsterseniz BUY/SELL etiketleri gizleyebileceğiniz bir ayar ekledim.
- BUY/SELL durumları için barları boyadım, ayarlar bölümünden açıp kapatabilirsiniz.
- Her strateji scriptinde yaptığım gibi, strateji testi için başlangıç ve bitiş tarihi ekledim. Ayarlar bölümünden çalışmasını görmek istediğiniz aralığı belirleyebilirsiniz.
- Ek olarak hacimsiz sembollerde OTT çizgisinin sıfıra indiği durumlar mevcuttu; kodda ufak bir değişiklik yaparak bu durumu değiştirdim. Kıvanç Bey'e konu ile ilgili soru sordum, cevabına göre güncelleme yapabilirim.
Not : Strateji BUY/SELL etiketleri ile indikatör BUY/SELL etiketleri aynı barda işlem yapmamaktadır çünkü indikatör etiketleri kendisinden sonraki bar oluşunca eklenmektedir. Barları replay yaptırırsanız oluşumlarını gözlemleyebilirsiniz.

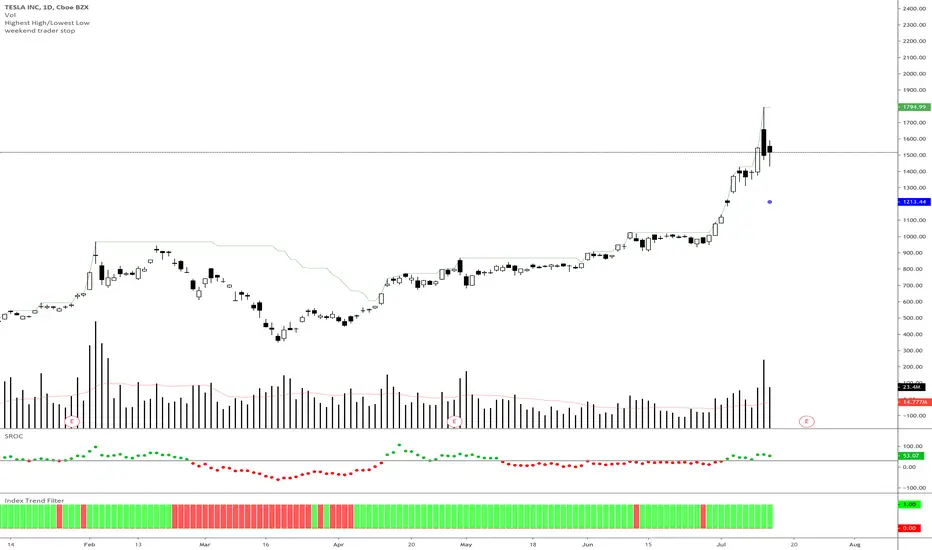
Index Trend Filter - Weekend Trend TraderThis little script simply gives you a quick visual cue of where price is compared to a particular EMA of another security or underlying index.
It is based on Nick Radge's broader market filter weekend trend trader system, but can be applied to other timeframes if you want to confirm if the index is in an up trend or down trend.
• Green means the underlying index price is above the EMA
• Red means the underlying index price is below the EMA
EMAs MultiTimeFrames + Trends - BeloTradeThis is an indicator thats allows us to see the trend in diferent time frames, we use the 72EMA. (4h,1h, 15min).
When the price is above all the EMAs is an clear uptrend. When is below is a clear downtrend. In the middle we are in a consolidation phase.
Green = Bullish
Red = Bearish
Emas MultiTameFrames : EMA 72 (15m) + EMA 72 (1H) + EMA 72 (4H).
Color Change: Cross EMA 72 (1H) - EMA 72 (4H).
The cross tends to be a confirmation off the trend change.

Trend Risk Indicator (TRI)The Trend Risk Indicator is a simple bands indicator made of 2 custom averages of candlesticks ranges calculated within the variable “ BandBars ” period.
Upper and lower channel bands width can be adjusted with the “ Deviation ” variable, which act as a simple factor to enlarge the spread between them.
When Close crosses over the upper band, it is a bearish signal and candlesticks are painted in Red.
When Close crosses under the lower band, it’s a bullish signal and candlesticks are painted in Green.
One of the most interesting indicators for 1 minute scalping. Recommended to use on Renko bars.
*drag to chart and pin to scale, also remove borders from candlesticks.

Arnaud Legoux Trend IndicatorArnaud Legoux Trend Indicator (ALTI) was designed for Identifying the primary trend, secondary trend and minor trend in a clearer way. Using the trend for continuation trade and detect potential reversals are two common ways to use it. However, combining ALTI with good volume indicators also has special results.Good luck, traders.

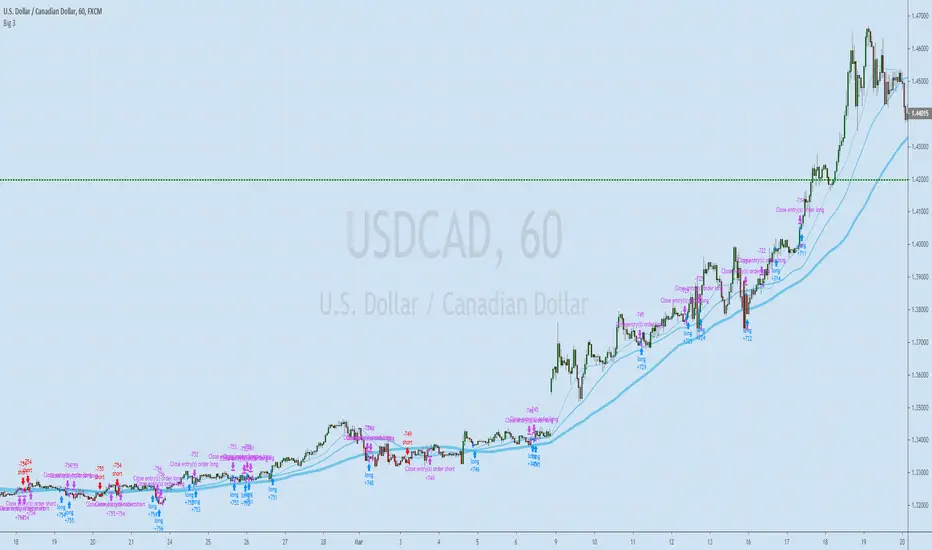
EMA Slope Trend Follower StrategyThis strategy is based on the slope of the EMA130.
Over that slope, the script calculates two EMAs (9,21) which are used to generate the main entry and exit signal.
In particular, the strategy enters a LONG position when EMA9 > EMA21. On the contrary, it closes the LONG and opens a SHORT when EMA9 < EMA21.
When the slope of the EMA130 is rising, it means that the price is accelerating upwards, fueling an uptrend. Conversely, when the slope is falling, it means that the price is slowing down, falling into a possible downtrend.
Calculating and analyzing two EMAs (fast and slow) over the slope of a medium length EMA instead of the price anticipates a lot the signal. In this way, the strategy never miss a trend.
In order to minimize false positives (entering useless positions), I included two filters, which can be optionally turned on:
- Trend Filter: When the price is above EMA200, the strategy opens ONLY LONG positions. If price < EMA200, only shorts allowed. If the slope gives a long signal and price is below EMA200, for example, the eventual SHORT position is closed, but the LONG entry is postponed to the moment when both conditions (slope uptrending and price > ema200) are met.
I recommend always turning on this filter, as it dramatically decreases drawdown.
- Volatility Filter: When the standard deviation of the last 20 candles is below its 50 samples moving average, no positions are opened, as market is going sideways. The purpose of this filter is to prevent false positives (positions which open and close in a matter of candles due to false signals in sideways market).
I recommend turning on this filter only on low time frames.
This strategy works great on medium time frames (like 4h, 6h, daily), since it spends way less in fees, opening less positions.
It works good on low TFs too (up to 1h, didn't test lower ones), provided Volatility filter is turned on and parameters are set according to the asset.
Commission included in calculations: 0.06% (it's the taker commission on BitMEX with the 10% discount obtainable with any referral link)
Slippage included in calculations: 2 ticks (BitMEX has very liquid order books, and slippage doesn't happen very often unless a huge position size is used).

Super trend-SARJust bored today , so I try this combination of sar and a slight modified super trend with ema
buy and sell are shown up
alerts included
i set to to 1 hour candles on btc/ for other time frames or assets you need to tweek it by your own


Derivative Based TrendsUses a combination of moving averages to establish trends, and finite-difference derivative approximations to predict possible reversals. Seems to work best on 1 hour charts of less volatile currency pairs.
TWAP TrendHere we are experimenting with using TWAP for trend analysis. It appears to work better than VWAP on lower timeframes.
TWAP is a tool used by algorithm based traders that allows them to distribute their orders throughout the day without disturbing price or having their positions known to rival traders in the market. It's similar to VWAP and serves the same function, except it lacks the volume aspect. This can be an issue when position entry/exit may be affected by slippage.
The main benefit of TWAP is deciding how to distribute orders throughout the chosen timeframe. However, just like the VWAP traders will normally use it as a moving average or target for price action to pull into.
There is an option to change the timeframe that TWAP is calculated from.
Originally by NeoButane:

Trend Balance Point System by Welles WilderThis is the original Trend Balance Point System created by Welles Wilders in 1978, rules can be found in his book New Concepts in Technical Trading Systems.

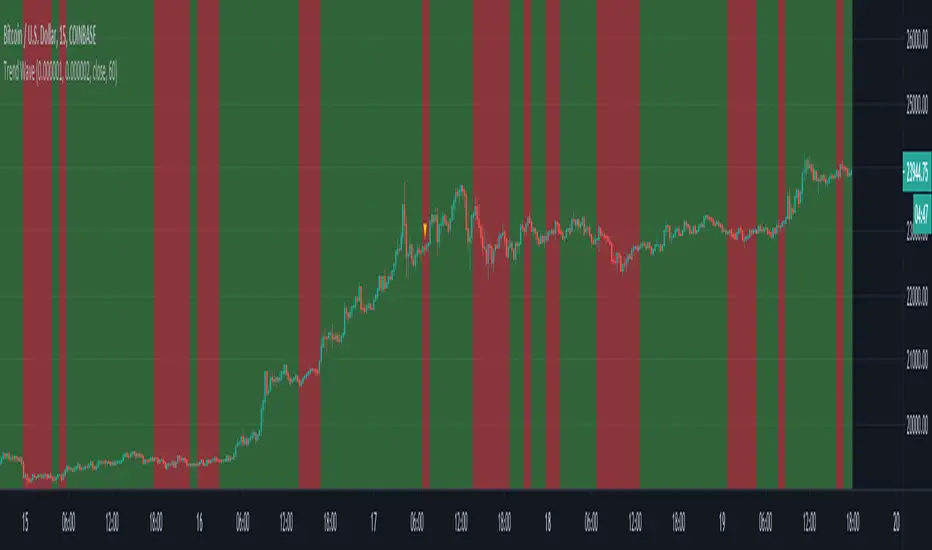
Trend WaveHello Traders!
You know, I can sill remember the first time I started tinkering with Pinescript. As I had no prior programming experience, I learned by experimenting with other open-source scripts on TradingViews Marketplace. Tearing apart and combining interesting scripts to see what the output would be. @ChrisMoody was a huge source of inspiration for learning, and I wanted to thank him, as well as @TheLark for the concept behind this script.
The Trend Wave is based on @ChrisMoody's PPO-PercentileRank-Mkt-Tops-Bottoms , which also happens to be based on @TheLark's TheLark-Laguerre-PPO/ .
Within my experimentation, I found that if I isolate the ppoT & ppoB variables and plot them calculated from extremely small decimals, you can get an extremely fast reacting, mirroring trend detector.
Within the script, you have the ability to plot the background colors based on trend to make it easier to see where crossovers occured, as well as a Mirror Input to view the mirrored version of the script.
-@DayTradingOil
Donato Trend Stength IndexThis indicator is a basic way to look at longer periods of time and look for exhaustion based on closes above or below RSI50. The first output is RSI14 the second is a rolling 100 day aggregate of closes where 50 acts as 0. As of now it appears totals of 1200+ /-1200- could be considered overbought / oversold, respectively. Totals near or above / below 2000 / -2000 (respectively) could be great indicators of extreme trend exhaustion and impending reversal.

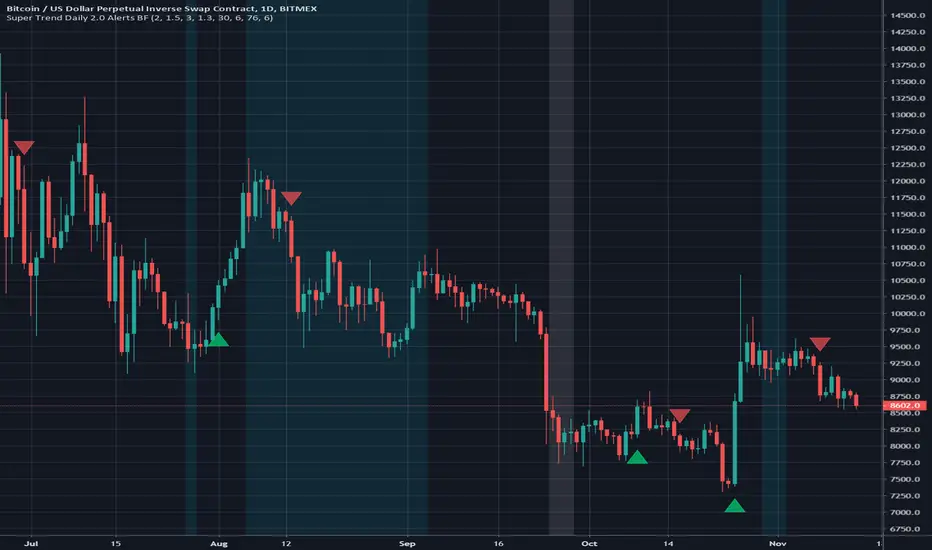
Super Trend Daily 2.0 Alerts BFThis is an alerts script for my Super Trend 2.0 indicator . It is intended as a companion script so you can backtest using the Strategy script and generate alerts using this Study script.
This Study script has the same default settings as the Strategy script and its only purpose is to provide alerts for the long and short signals the Strategy generates. Obviously, if you want to generate alerts based on a Strategy backtest, please ensure the settings are the same in the Study as in the Strategy.
For illustration, I have plotted arrows on the chart for long and short signals, and also colored the background to show when the rate of change function determines a choppy/sideways market.
ALERTS
There are 2 alerts set up:
Long Entry
Short Entry
ILLUSTRATION
Green arrow = Long Entry
Red arrow = Short Entry
White background = No short trades
Aqua background = No long trades
EXAMPLE USE CASE
1. Open a Bitcoin/USD chart on 1D timeframe.
2. Open this script and the Super Trend 2.0 indicator script.
3. Backtest with the Strategy Backtester and change the settings if you like until you get a desirable outcome for your own purposes.
4. Once you are happy with the backtest, change the settings in the Alerts script (this one) so they match the Strategy settings.
5. Set up the alerts according to your preferences.
Trend Tracker By Prem This Script tracks change of trend and Works as a leading indicator. If anyone interested in further modifying its script please do so and share with everyone with the same name as Trend Tracker By Prem

Super Trend Daily 2.0 BFThis is my Super Trend Daily strategy but with one important difference. You can now adjust settings for long or short signals individually and separately. For example, the condition for a long signal may require a different parameter setting than the condition for a short signal. Each parameter in the signal generation can be tuned. You can also decide what kind of stop loss you want for each side - you could have a fixed stop loss for longs and an ATR derived stop loss for shorts, or whatever.
We also have the option to choose if we want longs, shorts or both.
INISTRUCTIONS
Look at the background colors:
Green line = long signal
Red line = short signal
Aqua = No long trades
White = No short trades
Yellow dotted line = stop loss for long
Orange dotted line = stop loss for short
The aqua and white backgrounds mean the conditions are choppy/sideways according to our settings we applied to the rate of change function for a long/short signal respectively. It is possible to get a long signal in a white background, but not a short signal. Similarly, it is possible to get a short signal in an aqua background, but not a long signal.
This is a work in progress so any suggestions for improvements are welcome.

Super Trend Daily BF 🚀Super Trend is based on volatility and attempts to show the overall greater trend of a market. Thanks to everget for the idea of improving the Super Trend code. Thanks to kiasaki for ROC code.
The idea here is to enter a trade upon trend reversal (unless we have a white background - this indicates choppy/sideways market).
INSTRUCTIONS
Follow the background color for signals of a trend reversal.
Bright green = long
Bright red = short
White = no trade
We use a fixed stop loss here of 6% but I have included the option to apply an ATR based stop loss in Settings. No take profit. No re-entering until we get an opposing signal.
I use a Rate of Change function to detect when we should stay out due to choppy sideways price action.
This strategy was optimised for XBT/USD on Bitmex 1 day chart, ideal settings for other pairs will differ.

Trend swingTrying to code divergences of price and Volume with direction ocs.
It only highlights filtered divergence signals overlayed pointing at trend swing.
Colors:
red- doom
green - moon

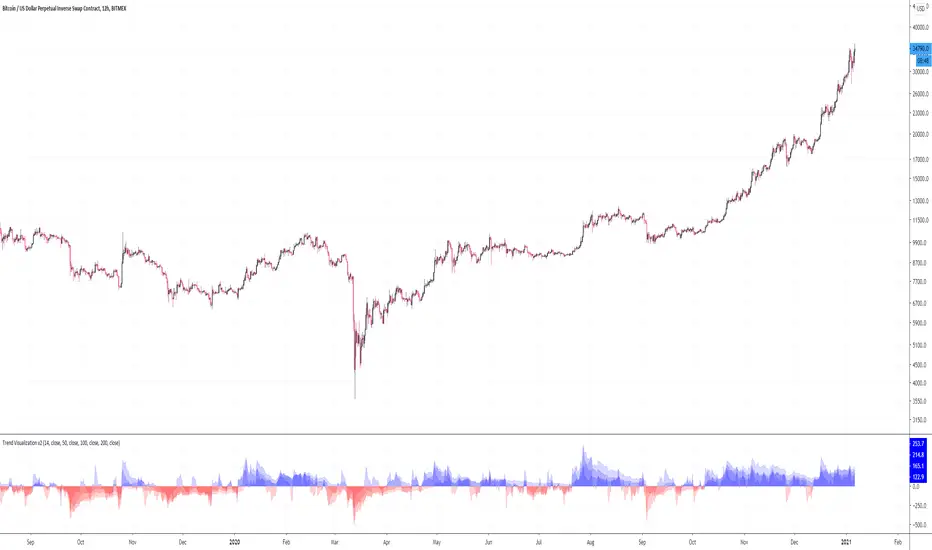
CL Trend VisualizationA trend strength indicator for visualizing momentum. Built from 5 different CCI periods and their averages.
Experimental.