Trend detection for stocksThis Pine Script indicator combines exponential moving averages (EMA) with the Average Directional Index (ADX) to identify clear upward and downward trends. The chart colors the background according to the trend and optionally displays buy and sell signals as well as alerts.
Functionality in detail:
The Fast EMA (Standard 21) reacts quickly to price changes.
The Slow EMA (Standard 55) smooths the trend more.
If the Fast EMA is above the Slow EMA and the ADX is above the defined threshold, the background turns green – indicating a clear upward trend.
Conversely, a red background signals a dominant downward trend.
Buy and sell arrows appear at the EMA crossover as soon as the ADX confirms that a trend is intact.
Cari dalam skrip untuk "trend"

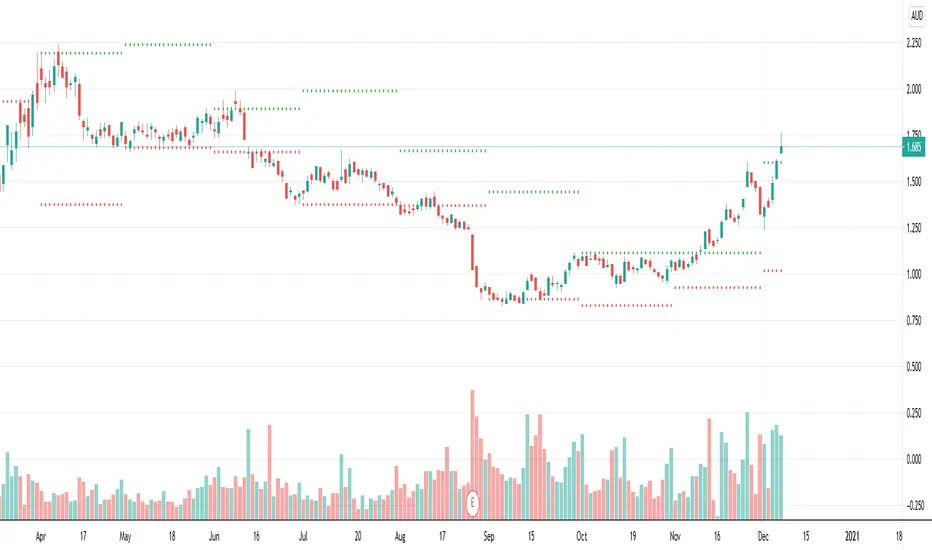
Trend Breakout Description:
This Pine Script indicator identifies pivot high and pivot low points based on user-defined left and right candle legs, detecting breakouts to signal potential trend changes. It plots horizontal lines at pivot highs (lime) and pivot lows (red), marking breakout signals with labels ("Br") when the price crosses above a pivot high or below a pivot low. The indicator also changes the background color to reflect the trend (green for uptrend, red for downtrend) with adjustable transparency. The indicator primarily focuses on recognizing specific pivot patterns to define trends and generate trading signals.
How It Works
• Pivot Detection: Identifies pivot highs and lows using configurable left (Left side Pivot Candle) and right (Right side Pivot Candle) periods.
• Pivot Highs (PH): A pivot high is identified when a candle's high is greater than a specified number of preceding candles (left leg) and succeeding candles (right leg).
• Pivot Lows (PL): Similarly, a pivot low is identified when a candle's low is less than a specified number of preceding and succeeding candles.
The script then tracks the last three pivot highs and pivot lows.
Trend Detection and Breakouts
1. High Line (Resistance): When a middle pivot high (out of the three tracked) is higher than both the previous and the next pivot high, a lime green line is drawn from that pivot high. This line acts as a dynamic resistance level.
2. Low Line (Support): Conversely, when a middle pivot low is lower than both the previous and the next pivot low, a red line is drawn from that pivot low. This line acts as a dynamic support level.
________________________________________
Trading Signals : The indicator generates signals based on price crossing these dynamically drawn lines .
• Long Signal (Uptrend):
o A "Long" signal is triggered when the close price crosses above the current high line (resistance), and the indicator is not already in an uptrend.
o When a long signal occurs, the background turns green, and the high line becomes dotted and thinner. A "Br" (Breakout) label appears below the candle.
• Short Signal (Downtrend):
o A "Short" signal is triggered when the close price crosses below the current low line (support), and the indicator is not already in a downtrend.
o When a short signal occurs, the background turns red, and the low line becomes dotted and thinner. A "Br" (Breakout) label appears above the candle.
________________________________________
Customizable Settings
The indicator provides three user-adjustable inputs:
• Right Side Pivot Candle (fpivotLeg): This setting (default 10) determines the number of candles to the right that must have lower highs/higher lows for a pivot to be confirmed.
• Left Side Pivot Candle (bpivotLeg): This setting (default 15) determines the number of candles to the left that must have lower highs/higher lows for a pivot to be confirmed.
• Adjust Color Visualization (Colortrnp): This setting (default 85) controls the transparency of the background color changes, allowing you to adjust how prominently the green (uptrend) and red (downtrend) backgrounds are displayed.
________________________________________
How to Use It
This indicator can be used by traders to:
• Identify potential reversals: The formation of new pivot highs and lows can signal shifts in market direction.
• Spot breakout opportunities: Crossing above the high line or below the low line can indicate the start of a new trend or the continuation of an existing one.
• Confirm trend strength: The presence and extension of the high and low lines can provide visual cues about the prevailing trend.
• Ideal for swing traders or trend-following strategies.
• Use the breakout labels ("Br") and background color to confirm trend direction.
• Adjust pivot leg inputs to fine-tune sensitivity for different timeframes or assets.
• Customize transparency to suit chart readability.
Example:
On a breakout above a pivot high, a green "Br" label appears, the background turns green, and the pivot line becomes dotted. This signals a potential uptrend, helping traders identify entry points or trend confirmations.
Disclaimer: No indicator guarantees profits. Always use this indicator in conjunction with other analysis methods and proper risk management.

Trend Structure Shift By BCB ElevateTrend Structure Shift by BCB Elevate
This indicator helps traders identify trend structure shifts by detecting Higher Highs (HH) and Lower Lows (LL) to determine bullish, bearish, or neutral market conditions. It provides real-time trend classification to help traders align with market direction.
How It Works:
📌 Bullish Trend: A new Higher High (HH) is detected, signaling potential uptrend continuation.
📌 Bearish Trend: A new Lower Low (LL) is detected, indicating potential downtrend continuation.
📌 Neutral: No significant trend shift is detected.
Key Features:
✅ Dynamic Trend Detection – Identifies key trend structure shifts using swing highs and lows.
✅ Customizable Settings – Adjust the swing length to fine-tune trend detection.
✅ Trend Table Display – Shows current trend as Bullish, Bearish, or Neutral in a convenient on-chart table.
✅ Table Position Selection – Choose where the trend table appears on the chart (Top/Bottom Left or Right).
✅ Works on All Markets & Timeframes – Use it for Crypto, Forex, Stocks, Commodities, and Indices.
How to Use:
1️⃣ Apply the indicator to your chart.
2️⃣ Observe the Trend Table to determine the market condition.
3️⃣ Use it with support/resistance, moving averages, or other indicators for better trade decisions.
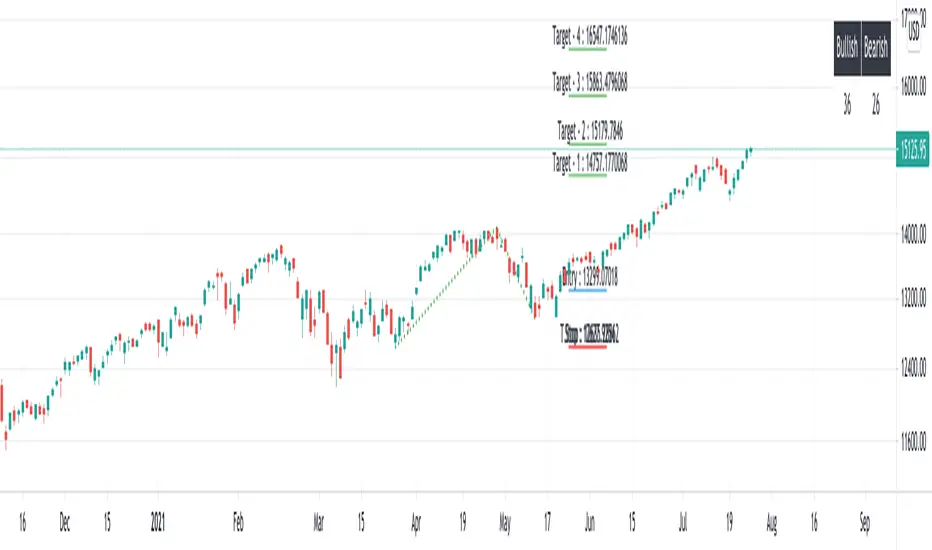
Trend Signals with TP & SL [UAlgo]The "Trend Signals with TP & SL " indicator is a versatile tool designed to assist traders in identifying potential trend continuation opportunities within financial markets Utilizing a combination of technical indicators and user-defined parameters, this indicator aims to provide clear and actionable signals to aid traders in making informed trading decisions.
🔶 Features:
Trend Continuation Signals : The indicator generates signals to identify potential trend continuation points based on the input parameters such as sensitivity, ATR length, and cloud moving average length.
Take-Profit and Stop-Loss Levels: It calculates and plots three levels of take-profit (1R, 2R, 3R) and stop-loss levels based on the entry price of the trade.
Short Position Example:
Long Position Example:
Visualization: The script visualizes the trend signals, entry points, take-profit levels, and stop-loss levels on the price chart, making it easier for traders to interpret the signals.
Alert System: The indicator includes an alert system that notifies the user when there is a change in trend direction or when a buy/sell signal is generated. The alerts provide essential information such as entry price, take-profit levels, and stop-loss levels.
🔶 Calculations :
Trend Calculation: Trend signals are determined based on the comparison between the current closing price and the upper and lower bounds calculated using the Average True Range (ATR) multiplied by a sensitivity factor. A trend is considered bullish if the closing price is above the upper bound and bearish if it's below the lower bound.
Entry, Stop Loss, and Take Profit Calculation: Entry points for long and short positions are identified when there's a change in trend direction.
Stop-loss levels are calculated as a percentage of the entry price, where users can define the percentage based on their risk tolerance.
Take-profit levels are calculated as multiples of the stop-loss level (1R, 2R, 3R).
Cloud Moving Averages: Simple moving averages (SMAs) are calculated for high and low prices over a specified period to create a "cloud" visualization on the chart.
MACD Clouds: Moving Average Convergence Divergence (MACD) indicator is used to determine the market's momentum and trend direction. Positive and negative clouds are plotted based on the MACD line and its signal line, indicating potential bullish or bearish trends.
Signal Generation: Buy and sell signals are generated based on specific conditions such as RSI, CMO (Chande Momentum Oscillator), and pivot points.
Signals are triggered when certain criteria are met, indicating potential opportunities for entering or exiting trades.
🔶 Disclaimer:
Use at Your Own Risk: Trading involves significant risk, and this script is provided for educational and informational purposes only. It does not guarantee profitable trades, and users should exercise caution and perform their own analysis before making trading decisions.
Parameter Sensitivity: The effectiveness of the indicator may vary depending on the chosen parameters, market conditions, and timeframe. Users are encouraged to backtest the script thoroughly and adjust the parameters according to their trading preferences.
Not Financial Advice: The information provided by this script should not be considered as financial advice. Users are solely responsible for their trading decisions and should consult with a qualified financial advisor if needed.
Backtesting and Validation: Before implementing this indicator in live trading, users are strongly encouraged to conduct rigorous backtesting and validation to assess its performance under various market conditions. Past performance is not indicative of future results, and users should carefully evaluate the effectiveness of the indicator based on their individual trading preferences and risk tolerance.

Trend Bar Dow Theory V-1.0The indicator is designed to signal the presence of a trend bar with reduced profit-taking the following day. Below, I explain the logic that I have defined for this first version.
The guidelines I provided are as follows: We identify a trend bar, if it sets a market change, between opening and closing, equal to or greater than 50 pips . This first guideline is used to find a day with good liquidity , which usually leads to a trend bar.
If the first guideline is met, the indicator should change the bar color to white . This way, we can proceed to the second guideline, to detect the presence of reduced profit-taking.
The second guideline should indicate the presence of reduced profit-taking, as explained by Dow Theory, to find a trend context with potential to exploit. Therefore, the second guideline involves coloring the bars near the trend bars in grey, if they have a range equal to or less than 30 pips.
Dow Theory states that a market in trend measures reduced profit-taking, within 33%, up to a maximum of 50% compared to the previous trend bar, but I have not yet been able to make Pine Script calculate the percentage value. If you have any suggestions, I would be grateful.

Trend Lines [AstroHub]1. Understand the basics of technical analysis: to fully utilize this system, you need to understand the fundamentals of technical analysis, such as identifying high and low prices, trendlines, etc. This will help you effectively use indicators and make more informed trading decisions.
2. Study the internal parameters: the system has input parameters, such as "Period," etc. Study their values and understand how they impact the indicator's performance. This will allow you to customize the system to fit your needs and trading strategies.
3. Pay attention to bars of different colors: the system marks bars with different colors depending on the price's position relative to trendlines. Pay close attention to these color changes as they can serve as entry or exit signals.
4. Be ready to adapt: the market is constantly changing, and the system may not always provide accurate signals. Be prepared to adapt and make decisions based on other factors, such as trading volume, news, etc.
5. Practice on historical data: before using this system in real-time, conduct some tests on historical data. This will help you understand how the system works and what results it can produce in different market conditions.
6. Be patient: the system may not always provide instant entry or exit signals. Be patient and wait for signal confirmation before entering or closing a trade.
7. Learn and discuss: trading knowledge and the use of this system are continuous learning processes. Be open to learning new strategies and discussing your experiences with other traders. This will help you improve your skills and better utilize this system.

Trend Volume Indicator by [VanHelsing]Trend Volume and Momentum based indicator
How it works:
The principle of the volume zone oscillator was used here,
but instead of closes > closes (price momentum) was used RSI,
if RSI > 50 it is a positive momentum and we get + volume value, otherwise - volume
Instead of ema's here is a Volume-Weighted Average Price (VWAP) which gives us such shape of TVI line that in general less sensitive to the pullbacks inside a trend.
This indicator is good for catching and following trends.
You can use alerts as well for take values of trend (-1,1) from 1-10D timeframes
Here how to read it

TrendsThe Trends indicator is created for trend trading and (Bitsgap) crypto bots of crypto assets over longer time periods.
Works best for 4h, Daily and Weekly candles (even Monthly), but unsuitable for hourly candles and day trading.
This indicator shows you if a crypto pair is in a Bear, Bull or Sideways market.
The idea is to simplify decision making when to sell or buy, or what pairs to use with trading bots.
Stick to the rule of not having bots in a Bear trend!
- Blue = Bull trend
- Red = Bear trend
- Green = Sideways trend - which can be profitable with trading bots

Divergence-Support/ResistenceAnother script based on zigzag, divergence, and to yield support and resistence levels.
This idea started with below two concepts:
▶ Support and resistence are simply levels where price has rejected to go further down or up. Usually, we can derive this based on pivots. But, if we start looking at every pivot, there will be many of them and may be confusing to understand which one to consider.
▶ Lot of people asked about one of my previous script on divergence detector on how to use it. I believe divergence should be considered as area of support and resistence because, they only amount to temporary weakness in momentum and nothing more. As per my understanding
Trend > Hidden Divergence > Divergence > Oscillator Levels of Overbought and Oversold
⬜ Process
▶ Now combining the above two concepts - what we are trying to do here is draw support resistence lines only on pivots which has observed either divergence or hidden divergence. Continuation and indecision pivots are ignored.
▶ Input requires only few parameters.
Zigzag lengths and oscillator to be used. Oscillator periods are automatically calculated based on zigzag length. Hence no other information required. You can also chose custom oscillator via external source.
▶ Display include horizontal lines of support/resistence which are drawn from the candle from where divergence or hidden divergence is detected.
▶ Support resistence lines are colored based on divergence. Green shades for bullish divergence and bullish hidden divergence whereas red shades for bearish divervence and bearish hidden divergence. Please note, red and green lines does not mean they only provide resistence or support. Any lines which are below the price should be treated as support and any line which are above the price should be treated as resistence.
▶ Divergence symbols are also printed on the bar from where divergence/hidden divergence is detected.
↗ - Bullish Hidden Divergence
↘ - Bearish Hidden Divergence
⤴ - Bullish Divergence
⤵ - Bearish Divergence
▶ Script also demonstrates usage of libraries effectively. I have used following libraries in this code.
import HeWhoMustNotBeNamed/ zigzag /2 as zg
import HeWhoMustNotBeNamed/enhanced_ta/8 as eta
import HeWhoMustNotBeNamed/ supertrend /4 as st
Can be good combination to use it with harmonic patterns.

Zigzag CandlesCan't deny that I am obsessed with zigzags. Been doing some crazy experiments with it and have many more in pipeline. I believe zigzag can be used to derive better trend following methods. Here is an attempt to visualize zigzag as candlesticks. Next steps probably to derive moving average, atr (although there was an attempt of AZR made earlier) and probably supertrend too ;)
Input parameters include ZigzagLength (to calculate zigzag) and CandleSize (number of zigzag pivots in each candle)
CandleSize can be 3 or more. Every time we collect pivots which are equal to CandleSize, we derive one candle. And when we derive a candle, we remove all old pivots except the last one. Becauase, the last pivot acts as open to the next bar and is required.
Body of the candle tells the start and end zigzag pivot in the range. And Wicks signify highest and lowest pivots in the range. High and Low wicks are placed at the pivot where high and lows are formed. Hence, you can see them at different positions each time.
Thanks to @RicardoSantos for suggesting boxes for candles - while I was trying to achieve this with plotbar

Elliot Wave - ImpulseLets dabble a bit into Elliot Waves.
This is a simple script which tries to identify Wave 1 and 2 of Elliot Impulese Wave and then projects for Wave 3.
Ratios are taken from below link: elliottwave-forecast.com - Section 3.1 Impulse
Wave 2 is 50%, 61.8%, 76.4%, or 85.4% of wave 1 - used for identifying the pattern.
Wave 3 is 161.8%, 200%, 261.8%, or 323.6% of wave 1-2 - used for setting the targets
Important input parameters
Length : Zigzag Length. Keep the numbers low if you are looking for smaller and shorter trades. Keep the numbers high if you are looking for longer and bigger trades.
Error Percent : Adjustments for ratios as it is not always possible to find exactly equal retracement ratio.
Entry Percent : Once Wave 2 is formed, entry is set after reversing 30% of wave 2. This number can be increased or decreased. Caution: Keeping the number too low may result in false signals.
Ignore Trend Direction : If unchecked, it will only look for pattern if Wave 1 has made a higher high. If not, it will ignore Wave 1 condition and only look at wave 1 to 2 ratio.
Handle Duplicates : Since, the labels are generated upon crossover of entry price, this crossover may happen multiple times. Or sometimes wave 2 can further extend and generate new signal with same wave 1. This parameter says how to handle such cases. Keep Last is set to default and is most preferred option.
ShowRatios and ShowWaves lets you display wave line and retracement ratios for each pivots
Cumulative Pivot HighLowThis indicator counts number of higher highs/lows and number of lower highs/lows and calculates trend based on that.
Indicator line shows (sum of higher highs/lows - sum of lower highs/lows) derived from last loopback periods. Indicator is green if last two consecutive highs/lows formed are on higher side. Red if on lower side. (Consecutive numbers can be controlled by parameter direction_threshold )
combineHighsAndLows if unselected shows not cumulative version but last consecutive highs and lows marked in red or green according to the trend.

Previous High/Low MTFIndicator to plot higher time frame previous candle highs and lows.
One of the key factor in understanding the trend is to look at higher time-frames chart.
Parameters are explained below:
resolution : Chose resolution of higher timeframe. If set to same as symbol, it will consider next parameter HTFMultiplier for calculation of higher timeframe
HTFMultiplier : Multiply symbol timeframe to by HTFMultiplier to derive higher time-frame
Offset : Number of higher timeframe candles before to be plotted. 1 means - it will show highs/lows of previous higher timeframe candle.
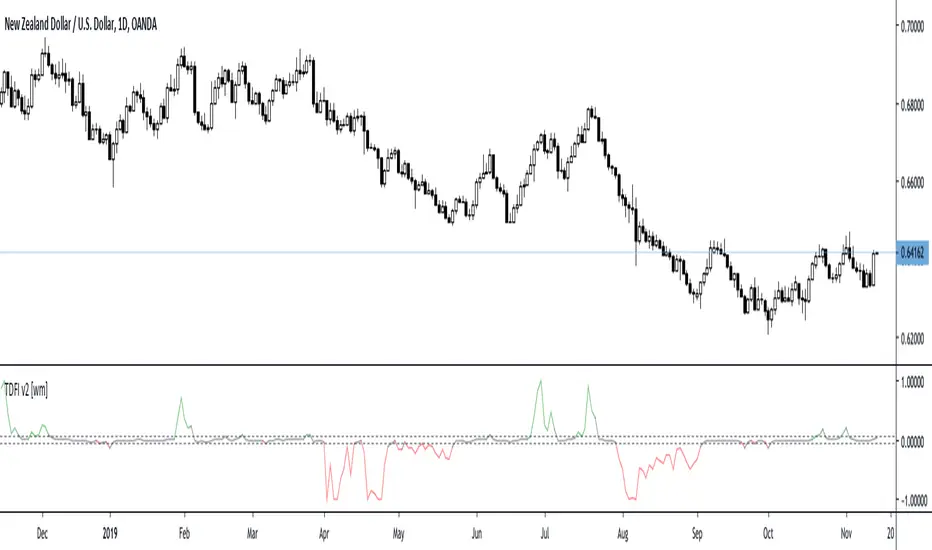
Trend Direction Force Index v2 - TDFI [wm]TDFI can range from -1 to 1 and thus indicate the direction of the trend.
In periods of consolidation ratios take very low values close to zero as a rule, do not exceed the value of 0.05 (and -0.05), which have set arbitrarily as horizontal signal lines. Rate accelerates rapidly to higher values when the consolidation ends and is a good chance of becoming a permanent trend.
As an extension, the trader can assume that as long as the pointer moves above the signal line and does not come down to the low value of less than 0.05 for at least two bars the trend continues. So the descent below signal line and a return to higher values should be interpreted as a temporary weakening trend. Not before rate remains below 0.05 for at least 2 bars, can we consider that the market is likely to begin to consolidate
In addition, we can assess the strength of the trend, depending on the value of the index – the index reaches 1 trend is strong (-1 is a strong downward trend) and generally values above 0.6 should be so interpreted. Less than in decline should be considered that the trend is losing its momentum.
Change Log:
* Refactored tdfi implementation. Functionally exactly the same
* Added selectable smoothers
* Added finer grained inputs fora each smoother
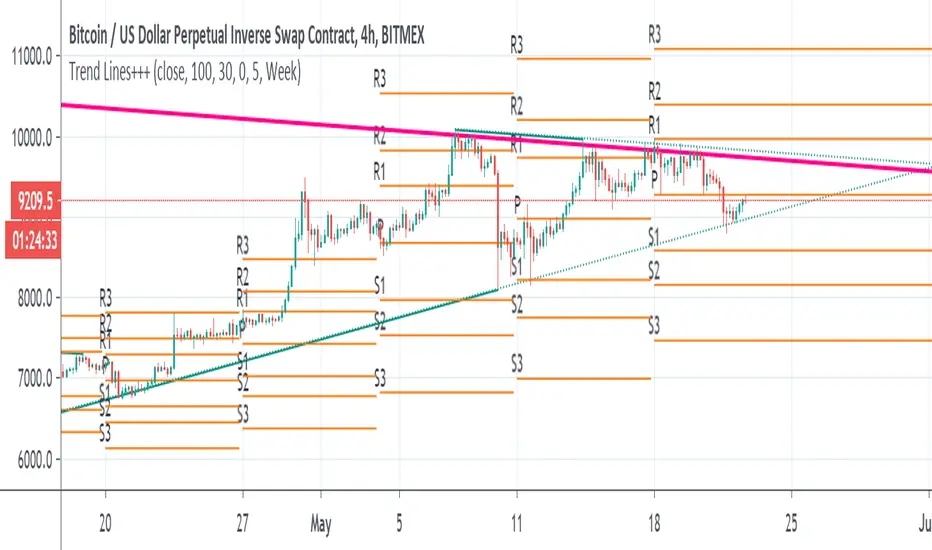
Trend Lines+++scripts taken from
Nothing here is mine , just put it as I like the combination of those script together when I analyse data
so it make life easy to draw line automode
I suggest 4 hours or daily chart with MACD and RSI
Thanks to autors in scripts
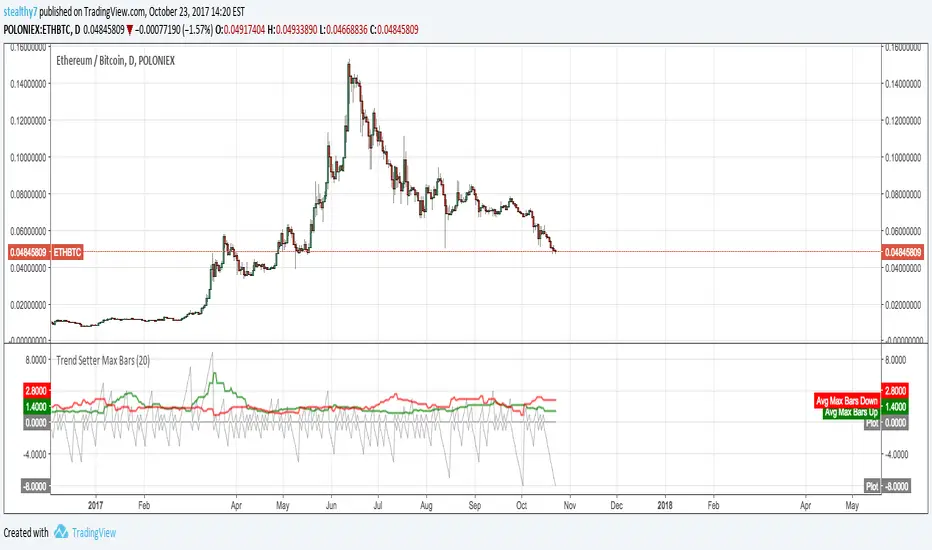
Trend Setter Max BarsThis script allows you to visualize trends. It counts continuous bars in the same direction, then makes an average of the maximum count in the look back period. If Green is above Red, its strength is upward and vice versa. This doesn't use returns or measure price moves.
*Positive Gray is current up bars count. Negative Gray down current down bars count
*Green and Red are average max counts.
This info could possibly be used to gauge trends or momentum.
Note: I finally figured out how to use loops and mutable variables in V3.
Multi-Indicator Trend-Following Strategy 1-minute Gold strategyTrend following using many indicators to provide accurate buy and sell signals on the 1-minute gold chart

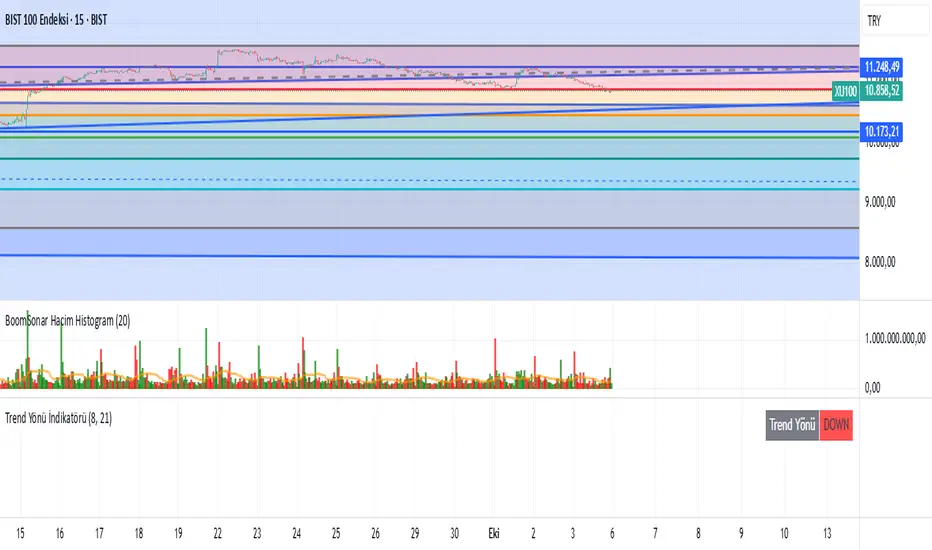
Trend Direction Indicator//This indicator simply tells the trend direction and created for listing achieves which simplifies the shares those have an UP direction.
Trend Strength Index - ZTFThis is a modification of TradingView's default Trend Strength Index indicator.
The Trend Strength Index measures the tendency of a symbol to either trend steadily or to revert to its mean. The core idea behind TSI is that the more momentum a symbol has relative to its volatility, the more likely it is to follow a trend and less likely to revert to its mean.
This indicator analyzes price momentum using the Pearson correlation coefficient, a normalized measure of the linear relationship between time series. Its output shows the correlation between the chart's closing prices and bar index values over a defined number of bars.
A value near +1 shows that prices experienced relatively steady increases across successive bars, indicating high upward trend strength
A value near -1 shows that prices experienced relatively steady decreases across successive bars, indicating high downward trend strength
A value near 0 suggests a lack of trend strength, because prices did not demonstrate a steady positive or negative relationship with the bar index
ZTF Modification: Added a green background highlight that appears when TSI reaches 0.90 or above, providing a visual alert for extremely strong bullish trend conditions.
Credit: Based on TradingView's default Trend Strength Index indicator.

Trend Degree Dashboard (Table)📈 Trend Degree Dashboard (Table) — v1.0
This indicator calculates and displays the trend angle (in degrees) based on the linear regression of the selected source (default: close) over a user-defined lookback period (default: 21 bars).
The trend angle gives a quick visual reference of the current market slope — positive (uptrend) or negative (downtrend).
A dashboard table shows the trend angle directly on the chart, with a background color:
🟩 Green background for positive angles (uptrend)
🟥 Red background for negative angles (downtrend)
🔧 Features:
Customizable Lookback Period: Set the number of candles to consider for trend calculation.
Source Selection: Apply the analysis to close, open, high, low, or any other price series.
Dashboard Positioning: Choose where the dashboard appears (Top Left, Top Right, Bottom Left, Bottom Right).
Clean Table Design: Minimalistic and easy-to-read dashboard with automatic background color highlighting based on trend direction.
⚙️ How It Works:
It uses Linear Regression to measure the slope between two consecutive points.
Converts the slope into degrees using the arctangent function (atan) for a geometric interpretation of trend strength and direction.
Updates the dashboard table live with the latest angle value.
✅ Script Highlights:
Non-repainting: Once a bar closes, its value is fixed.
Efficient performance: Lightweight table visualization with no heavy calculations.
Clear trading signals: Positive angles suggest bullish momentum, negative angles suggest bearish momentum.
⚠️ Disclaimer:
This script is a technical analysis tool designed to assist in decision-making but does not guarantee results.
Please use it alongside other tools and practice proper risk management. Always test any indicator on demo accounts before applying it to live trading.

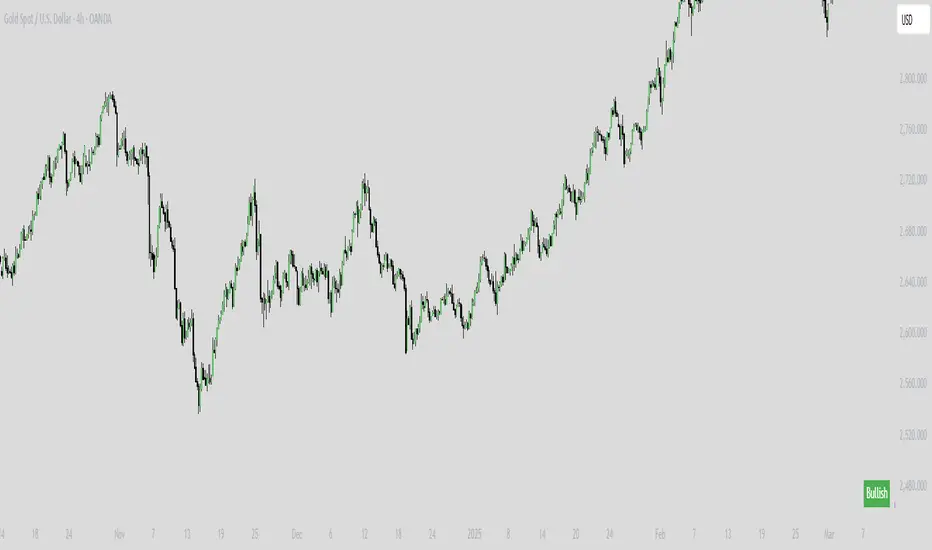
Trend with Mathematical Approach GOLD [AstroHub]
Welcome to the Trend with Mathematical Approach! 🚀
This tool uses a unique mathematical approach to help you spot potential trend beginnings in the market.
By analyzing the derivative of closing prices and applying a specialized moving average, SmartTrend identifies
key points where a new trend might be starting.
🟢 Green arrows show potential BUY opportunities when a new uptrend begins.
🔴 Red arrows indicate potential SELL opportunities when a new downtrend starts.
Additionally, the indicator provides easy-to-read colored backgrounds to highlight potential trend zones.
Green means a potential uptrend, and red suggests a potential downtrend.
To make it even more user-friendly, SmartTrend adds clear labels for BUY and SELL signals directly on the chart,
making it easy for you to spot opportunities at a glance.
💡 Pro Tip: Use the built-in alerts to get notified when SmartTrend identifies a potential trade opportunity.
Enjoy using SmartTrend and happy trading! 📈💰

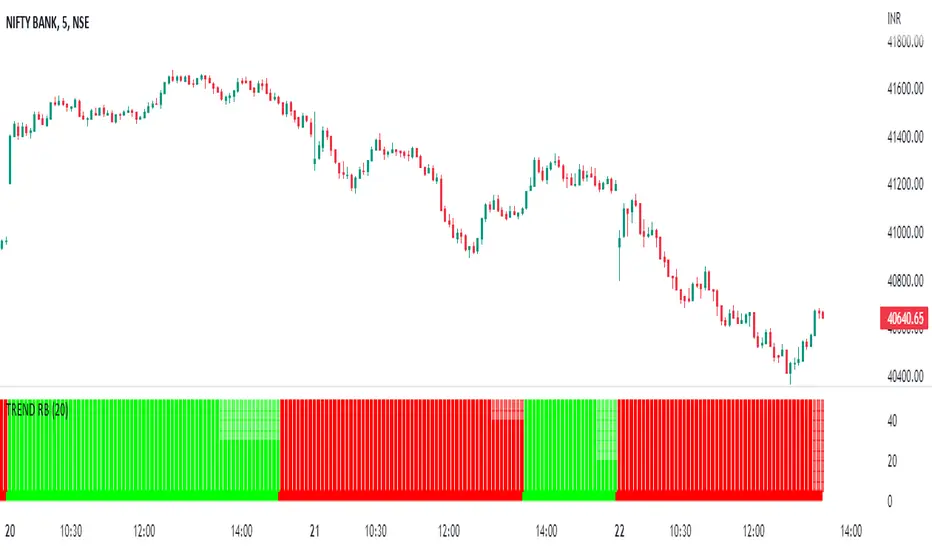
TREND RBReduce Fake Signals, and identify the trend and use as double confirmation
How Does it work ?
- it calculates main trend direction by using the length that is user-defined. so you can change it as you wish
- then it calculates trend direction for each 9 lower lengths. if you set the length = 20 then the lengths are 19, 18,...11
- and it checks if the trend directions that came from lower lengths is same or not with main trend direction.
- it changes the trend color of the ribbon.