Commitment of Traders: Total█ OVERVIEW
This indicator displays the Commitment of Traders (COT) totals data for futures markets.
█ CONCEPTS
Commitment of Traders (COT) data is tallied by the Commodity Futures Trading Commission (CFTC) , a US federal agency that oversees the trading of derivative markets such as futures in the US. It is weekly data that provides traders with information about open interest for an asset. The CFTC oversees derivative markets traded on different exchanges, so COT data is available for assets that can be traded on CBOT, CME, NYMEX, COMEX, and ICEUS.
A detailed description of the COT report can be found on the CFTC's website .
COT data is separated into three notable reports: Legacy, Disaggregated, and Financial. This indicator presents specific data from the COT Legacy report. The Total data details the positions held by various traders: Commercial Hedgers (traders registered with CFTC that use futures contracts in that particular commodity for hedging), Large Traders (traders registered with CFTC that do not hedge that particular commodity) and Small Traders (not registered with CFTC).
Our other COT indicators are:
• Commitment of Traders: Legacy Metrics
• Commitment of Traders: Disaggregated Metrics
• Commitment of Traders: Financial Metrics
█ HOW TO USE IT
Load the indicator on an active chart (see here if you don't know how).
By default, the indicator uses the chart's symbol to derive the COT data it displays. You can also specify a CFTC code in the "CFTC code" field of the script's inputs to display COT data from a symbol different than the chart's.
The rest of this section documents the script's input fields.
COT Selection Mode
This field's value determines how the script determines which COT data to return from the chart's symbol:
- "Root" uses the root of a futures symbol ("ES" for "ESH2020").
- "Base currency" uses the base currency in a forex pair ("EUR" for "EURUSD").
- "Currency" uses the quote currency, i.e., the currency the symbol is traded in ("JPY" for "TSE:9984" or "USDJPY").
- "Auto" tries all modes, in turn.
If no COT data can be found, a runtime error is generated.
Note that if the "CTFC Code" input field contains a code, it will override this input.
Futures/Options
Specifies the type of Commitment of Traders data to display: data concerning only Futures, only Options, or both.
Display
Determines the direction of the metrics requested from the CTFC report.
CTFC Code
Instead of letting the script generate the CFTC COT code from the chart and the "COT Selection Mode" input when this field is empty, you can specify an unrelated CFTC COT code here, e.g., 001602 for wheat futures.
Look first. Then leap.
Cari dalam skrip untuk "usdjpy"

LibraryCOT█ OVERVIEW
This library is a Pine programmer's tool that provides functions to access Commitment of Traders (COT) data for futures. Four of our scripts use it:
• Commitment of Traders: Legacy Metrics
• Commitment of Traders: Disaggregated Metrics
• Commitment of Traders: Financial Metrics
• Commitment of Traders: Total
If you do not program in Pine and want to use COT data, please see the indicators linked above.
█ CONCEPTS
Commitment of Traders (COT) data is tallied by the Commodity Futures Trading Commission (CFTC) , a US federal agency that oversees the trading of derivative markets such as futures in the US. It is weekly data that provides traders with information about open interest for an asset. The CFTC oversees derivative markets traded on different exchanges, so COT data is available for assets that can be traded on CBOT, CME, NYMEX, COMEX, and ICEUS.
Accessing COT data from a Pine script requires the generation of a ticker ID string for use with request.security() . The ticker string must be encoded in a special format that includes both CFTC and TradingView-specific content. The format of the ticker IDs is somewhat complex; this library's functions make their generation easier. Note that if you know the COT ticker ID string for specific data, you can enter it from the chart's "Symbol Search" dialog box.
A ticker for COT data in Pine has the following structure:
COT:__<_metricDirection><_metricType>
where an underscore prefixing a component name inside <> is only included if the component is not a null string, and:
Is a digit representing the type of the COT report the data comes from: "" for legacy COT data, "2" for disaggregated data and "3" for financial data.
Is a six digit code that represents a commodity. Example: wheat futures (root "ZW") have the code "001602".
Is either "F" if the report data should exclude Options data, or "FO" if such data is included.
Is the TradingView code of the metric. This library's `metricNameAndDirectionToTicker()` function creates both
the and components of a COT ticker from the metric names and directions listed in the above chart.
The different metrics are explained in the CFTC's Explanatory Notes .
Is the direction of the metric: "Long", "Short", "Spreading" or "No direction".
Not all directions are applicable to all metrics. The valid ones are listed next to each metric in the above chart.
Is the type of the metric, possible values are "All", "Old" and "Other".
The difference between the types is explained in the "Old and Other Futures" section of the CFTC's Explanatory Notes .
As an example, the Legacy report Open Interest data for ZW futures (options included) in the old standard has the ticker "COT:001602_FO_OI_OLD". The same data using the current standard without futures has the ticker "COT:001602_F_OI".
█ USING THE LIBRARY
The first functions in the library are helper functions that generate components of a COT ticker ID. The last function, `COTTickerid()`, is the one that generates the full ticker ID string by calling some of the helper functions. We use it like this in our example:
exampleTicker = COTTickerid(
COTType = "Legacy",
CFTCCode = convertRootToCOTCode("Auto"),
includeOptions = false,
metricName = "Open Interest",
metricDirection = "No direction",
metricType = "All")
This library's chart displays the valid values for the `metricName` and `metricDirection` arguments. They vary for each of the three types of COT data (the `COTType` argument). The chart also displays the COT ticker ID string in the `exampleTicker` variable.
Look first. Then leap.
The library's functions are:
rootToCFTCCode(root)
Accepts a futures root and returns the relevant CFTC code.
Parameters:
root : Root prefix of the future's symbol, e.g. "ZC" for "ZC1!"" or "ZCU2021".
Returns: The part of a COT ticker corresponding to `root`, or "" if no CFTC code exists for the `root`.
currencyToCFTCCode(curr)
Converts a currency string to its corresponding CFTC code.
Parameters:
curr : Currency code, e.g., "USD" for US Dollar.
Returns: The corresponding to the currency, if one exists.
optionsToTicker(includeOptions)
Returns the part of a COT ticker using the `includeOptions` value supplied, which determines whether options data is to be included.
Parameters:
includeOptions : A "bool" value: 'true' if the symbol should include options and 'false' otherwise.
Returns: The part of a COT ticker: "FO" for data that includes options and "F" for data that doesn't.
metricNameAndDirectionToTicker(metricName, metricDirection)
Returns a string corresponding to a metric name and direction, which is one component required to build a valid COT ticker ID.
Parameters:
metricName : One of the metric names listed in this library's chart. Invalid values will cause a runtime error.
metricDirection : Metric direction. Possible values are: "Long", "Short", "Spreading", and "No direction".
Valid values vary with metrics. Invalid values will cause a runtime error.
Returns: The part of a COT ticker ID string, e.g., "OI_OLD" for "Open Interest" and "No direction",
or "TC_L" for "Traders Commercial" and "Long".
typeToTicker(metricType)
Converts a metric type into one component required to build a valid COT ticker ID.
See the "Old and Other Futures" section of the CFTC's Explanatory Notes for details on types.
Parameters:
metricType : Metric type. Accepted values are: "All", "Old", "Other".
Returns: The part of a COT ticker.
convertRootToCOTCode(mode, convertToCOT)
Depending on the `mode`, returns a CFTC code using the chart's symbol or its currency information when `convertToCOT = true`.
Otherwise, returns the symbol's root or currency information. If no COT data exists, a runtime error is generated.
Parameters:
mode : A string determining how the function will work. Valid values are:
"Root": the function extracts the futures symbol root (e.g. "ES" in "ESH2020") and looks for its CFTC code.
"Base currency": the function extracts the first currency in a pair (e.g. "EUR" in "EURUSD") and looks for its CFTC code.
"Currency": the function extracts the quote currency ("JPY" for "TSE:9984" or "USDJPY") and looks for its CFTC code.
"Auto": the function tries the first three modes (Root -> Base Currency -> Currency) until a match is found.
convertToCOT : "bool" value that, when `true`, causes the function to return a CFTC code.
Otherwise, the root or currency information is returned. Optional. The default is `true`.
Returns: If `convertToCOT` is `true`, the part of a COT ticker ID string.
If `convertToCOT` is `false`, the root or currency extracted from the current symbol.
COTTickerid(COTType, CTFCCode, includeOptions, metricName, metricDirection, metricType)
Returns a valid TradingView ticker for the COT symbol with specified parameters.
Parameters:
COTType : A string with the type of the report requested with the ticker, one of the following: "Legacy", "Disaggregated", "Financial".
CTFCCode : The for the asset, e.g., wheat futures (root "ZW") have the code "001602".
includeOptions : A boolean value. 'true' if the symbol should include options and 'false' otherwise.
metricName : One of the metric names listed in this library's chart.
metricDirection : Direction of the metric, one of the following: "Long", "Short", "Spreading", "No direction".
metricType : Type of the metric. Possible values: "All", "Old", and "Other".
Returns: A ticker ID string usable with `request.security()` to fetch the specified Commitment of Traders data.
█ AVAILABLE METRICS
Different COT types provide different metrics. The table of all metrics available for each of the types can be found below.
+------------------------------+------------------------+
| Legacy (COT) Metric Names | Directions |
+------------------------------+------------------------+
| Open Interest | No direction |
| Noncommercial Positions | Long, Short, Spreading |
| Commercial Positions | Long, Short |
| Total Reportable Positions | Long, Short |
| Nonreportable Positions | Long, Short |
| Traders Total | No direction |
| Traders Noncommercial | Long, Short, Spreading |
| Traders Commercial | Long, Short |
| Traders Total Reportable | Long, Short |
| Concentration Gross LT 4 TDR | Long, Short |
| Concentration Gross LT 8 TDR | Long, Short |
| Concentration Net LT 4 TDR | Long, Short |
| Concentration Net LT 8 TDR | Long, Short |
+------------------------------+------------------------+
+-----------------------------------+------------------------+
| Disaggregated (COT2) Metric Names | Directions |
+-----------------------------------+------------------------+
| Open Interest | No Direction |
| Producer Merchant Positions | Long, Short |
| Swap Positions | Long, Short, Spreading |
| Managed Money Positions | Long, Short, Spreading |
| Other Reportable Positions | Long, Short, Spreading |
| Total Reportable Positions | Long, Short |
| Nonreportable Positions | Long, Short |
| Traders Total | No Direction |
| Traders Producer Merchant | Long, Short |
| Traders Swap | Long, Short, Spreading |
| Traders Managed Money | Long, Short, Spreading |
| Traders Other Reportable | Long, Short, Spreading |
| Traders Total Reportable | Long, Short |
| Concentration Gross LE 4 TDR | Long, Short |
| Concentration Gross LE 8 TDR | Long, Short |
| Concentration Net LE 4 TDR | Long, Short |
| Concentration Net LE 8 TDR | Long, Short |
+-----------------------------------+------------------------+
+-------------------------------+------------------------+
| Financial (COT3) Metric Names | Directions |
+-------------------------------+------------------------+
| Open Interest | No Direction |
| Dealer Positions | Long, Short, Spreading |
| Asset Manager Positions | Long, Short, Spreading |
| Leveraged Funds Positions | Long, Short, Spreading |
| Other Reportable Positions | Long, Short, Spreading |
| Total Reportable Positions | Long, Short |
| Nonreportable Positions | Long, Short |
| Traders Total | No Direction |
| Traders Dealer | Long, Short, Spreading |
| Traders Asset Manager | Long, Short, Spreading |
| Traders Leveraged Funds | Long, Short, Spreading |
| Traders Other Reportable | Long, Short, Spreading |
| Traders Total Reportable | Long, Short |
| Concentration Gross LE 4 TDR | Long, Short |
| Concentration Gross LE 8 TDR | Long, Short |
| Concentration Net LE 4 TDR | Long, Short |
| Concentration Net LE 8 TDR | Long, Short |
+-------------------------------+------------------------+

Fear Of Missing Out grid of forex tradingAbstract
This script finds potential safe grids placing limit orders without fear of missing out.
This script computes grids according to power of 1.0025 .
You can reference those price levels for your trading.
Introduction
Grid trading is a popular trading method.
Traders plan several price levels as grids and repeat buying at lower grids and selling at higher grids.
Grids can be round number like multiple of 100 pips.
Grids can also be support and resistance according to price history.
Some traders may think they need to adjust grids to trade.
However, there are several problems in choosing grids.
One problem is rate of change is related and therefore exponential. 20 to 30 is different from 30 to 40.
Another interesting point is there are some special impressing reversal price levels.
Several months ago, I had a question why usdjpy bounced near 108.3 .
After using a calculator, I found that 108.3 = 100 * 1.083 ≒ 100 * pow(1.0025,31) .
1.0025 , as known as 0.25% of change, is a potential stop out zone.
Therefore, we can compute grids and one grid is a little more than 1.0025 times than an another one.
After we finished computing grids, we can consider buy and sell near those grids.
Note that different traders may obtain different grid values.
For example, from 1.0 to 2.0 , it can be splited as 270 grids or 277 grids because pow(1.0025,277)<2 .
Those grids cannot always imply potential reversal points but they can be useful for traders looking for 0.25% profit targets with reducing fearing of buying or selling too early.
Computing grids
This script split from 1.0 to 10.0 into three segments.
One is 1.0 to 2.0 .
The second segment is from 2.0 to 5.0 .
The third segment is from 5.0 to 10.0 .
This script does the same thing for 0.1 to 1.0 , 10.0 to 100.0 , and so on.
For 1.0 to 2.0 and 5.0 to 10.0 , this script split a segment as 270 grids.
For 2.0 to 5.0 , this script split a segment as 360 grids.
The last step is display the next grids to the daily low and daily high.
Maybe also display the grids behind grids shown.
Parameters
x1,x2,x3,x4 : display the next x1,x2,x3,x4 grids to daily high and daily low. 1 means the next grid to daily high and daily low. 2 means the next grid to 1.
x_seg : default 2.0 . This script split from 1.0 to 10.0 into three segments. One is 1.0 to x_seg. The second segment is from x_seg to 10.0/x_seg . The third segment is from 10.0/x_seg to 10.0 .
x_grid1 : how many grids in the first segment
x_grid2 : how many grids in the second segment
x_lowprice : add this number for bigger grid distance. Generally, you don't need this number when trading forex but you may need it in stock trading. For stocks with price between 50 to 100, I recommend you use x_lowprice=100.
Conclusion and suggestions
This script can find potential grids for trading.
If price touches grids usually, we can consider buy and sell after price touches grids.
If price reverses before touching grids usually, we may consider buy and sell before price touches grids.
Those grids can remind us don't buy too much unless the price touches the next grid.
For instruments with less volatility, maybe we need more grids.
For traders with more money, they may also consider more grids for more dedicated range trading to collect more profit.
Reference
Sorry, I forgot them.

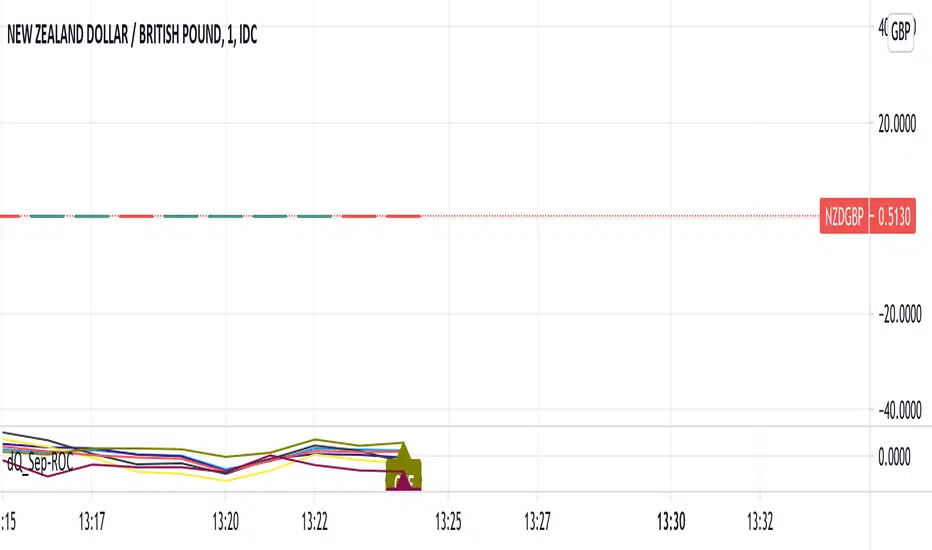
ROC of Majors against the USD (Label)Version 2 of the ROC study that now puts them as a label on the same chart.
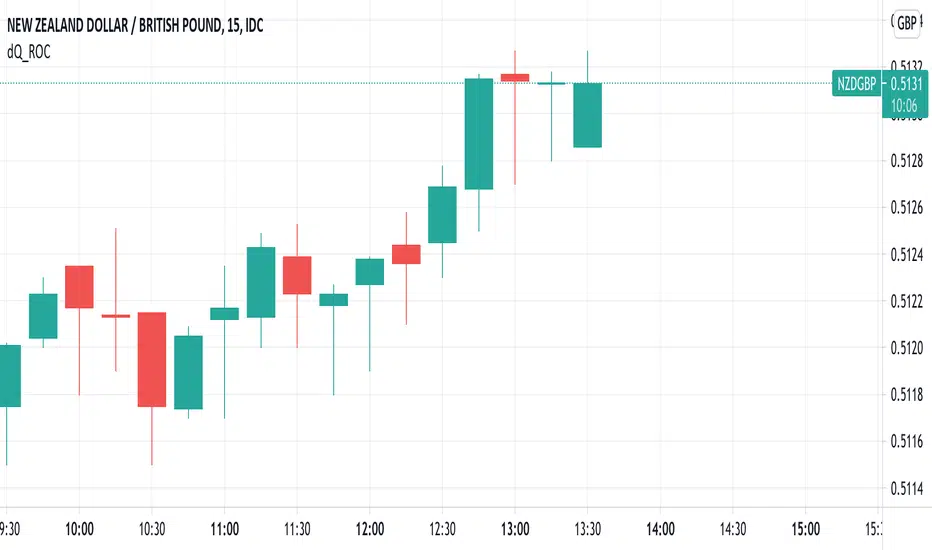
ROC of Majors against the USDA simple study that shows the majors against the USD Rate of Change.
Allows you to pick opposing strength pairs to trade.
There are different ROC calculations for people to play with as I am not sure which way the ( ) should be so feedback is welcome.
Currency Pairs Comparison on ChartAnother play with powerful pine script.
Display 14 related currency pairs for Forex combinations of the following currencies: USD, EUR, GBP, JPY, CHF, AUD, NZD, CAD
Show color green group for the first currency and color red group for the second.
For example, the chart is CHFJPY, then displayed color green group for the following 7 currency pairs:
- CHFUSD
- CHFEUR
- CHFJPY
- CHFGBP
- CHFAUD
- CHFCAD
- CHFNZD
And color red group for the following :
- USDEUR
- USDJPY
- USDGBP
- USDAUD
- USDCAD
- USDCHF
- USDNZD
Because too many bars will make the chart ugly, so I only calculate back N bars based on the great script made by melihtuna on
It can easily show the strong currency and weak currency
And easily found there is no trend
It will use security function to get 14 currency pairs chart, so it may cost a few seconds to paint.

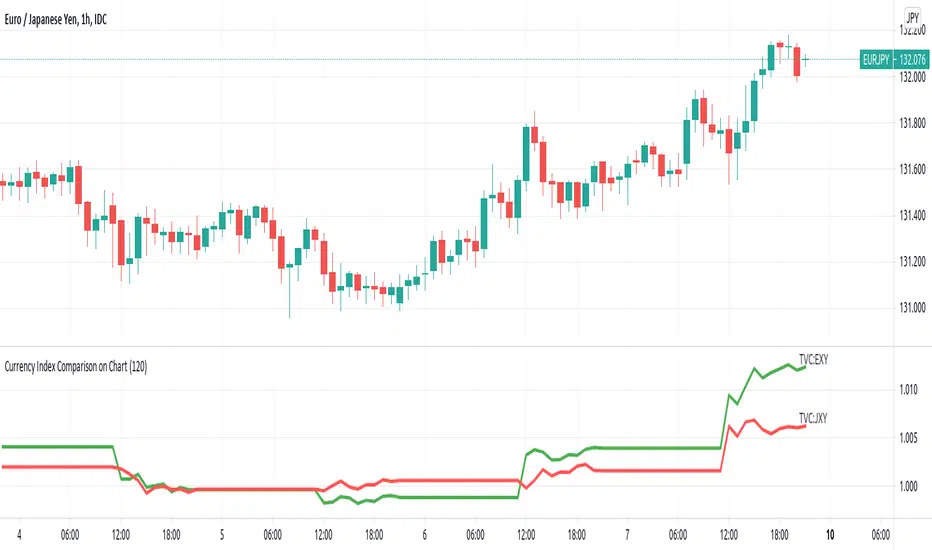
Currency Index Comparison on ChartI wanted to make this script when I made XY RSI - Relative strength Index
But too many bars make the chart ugly.
Today I found a great script from melihtuna on
So I can implement this idea now.
This script is for Forex combinations of the following currencies: USD, EUR, GBP, JPY, CHF, AUD, NZD, CAD
It displayed currency index ( DXY , EXY , BXY , JXY , AXY , CXY , SXY , ZXY ) chart based on the currency pairs.
For example, USDJPY chart will automatically display green line US Dollar Index (DXY) and red line Japan Yen index (JXY).
Fixed price Stop Loss [Takazudo]This strategy is a demo for fixed price stop loss.
This strategy enables you to specify fixed price stop loss. Let's say your deposit is USD. When you trade EURCAD, you need to specify the quantity for trade. Here comes three chances for trade.
A: SL pips: 500
B: SL pips: 200
C: SL pips: 100
In these trade, the risk is different for each. ABC risk ratio is 5:2:1. And, you cannot know how much to lose if the price hits the stop loss. This is a huge problem.
With this strategy, You can specify the fixed risk price for each trade. If you specify 100 USD for the risk, this strategy calculates how much quantity to buy or sell for each entry. In the case above, this strategy guides you how much quantity to buy or sell like below.
A: 2,000 qty (SL: 500pips)
B: 5,000 qty (SL: 200pips)
C: 10,000 qty (SL: 100pips)
If you make entries with those quantity and the price hits the stop loss, You will lose the money like below.
A: 100 USD
B: 100 USD
C: 100 USD
This is what this script does. Fixed price SL.
I tested this caliculation for OANDA's main 28 currency pairs forex listed below.
AUDUSD, EURUSD, GBPUSD, NZDUSD, USDCAD, USDCHF, USDJPY, AUDCAD, AUDCHF, AUDJPY, AUDNZD, CADCHF, CADJPY, CHFJPY, EURAUD, EURCAD, EURCHF, EURGBP, EURJPY, EURNZD, GBPAUD, GBPCAD, GBPCHF, GBPJPY, GBPNZD, NZDCAD, NZDCHF, NZDJPY
I may add more pairs later.
Note: The entry strategy in this script is not intented to win. Check the result. Be careful.

Machine Learning: Logistic RegressionMulti-timeframe Strategy based on Logistic Regression algorithm
Description:
This strategy uses a classic machine learning algorithm that came from statistics - Logistic Regression (LR).
The first and most important thing about logistic regression is that it is not a 'Regression' but a 'Classification' algorithm. The name itself is somewhat misleading. Regression gives a continuous numeric output but most of the time we need the output in classes (i.e. categorical, discrete). For example, we want to classify emails into “spam” or 'not spam', classify treatment into “success” or 'failure', classify statement into “right” or 'wrong', classify election data into 'fraudulent vote' or 'non-fraudulent vote', classify market move into 'long' or 'short' and so on. These are the examples of logistic regression having a binary output (also called dichotomous).
You can also think of logistic regression as a special case of linear regression when the outcome variable is categorical, where we are using log of odds as dependent variable. In simple words, it predicts the probability of occurrence of an event by fitting data to a logit function.
Basically, the theory behind Logistic Regression is very similar to the one from Linear Regression, where we seek to draw a best-fitting line over data points, but in Logistic Regression, we don’t directly fit a straight line to our data like in linear regression. Instead, we fit a S shaped curve, called Sigmoid, to our observations, that best SEPARATES data points. Technically speaking, the main goal of building the model is to find the parameters (weights) using gradient descent.
In this script the LR algorithm is retrained on each new bar trying to classify it into one of the two categories. This is done via the logistic_regression function by updating the weights w in the loop that continues for iterations number of times. In the end the weights are passed through the sigmoid function, yielding a prediction.
Mind that some assets require to modify the script's input parameters. For instance, when used with BTCUSD and USDJPY, the 'Normalization Lookback' parameter should be set down to 4 (2,...,5..), and optionally the 'Use Price Data for Signal Generation?' parameter should be checked. The defaults were tested with EURUSD.
Note: TradingViews's playback feature helps to see this strategy in action.
Warning: Signals ARE repainting.
Style tags: Trend Following, Trend Analysis
Asset class: Equities, Futures, ETFs, Currencies and Commodities
Dataset: FX Minutes/Hours/Days

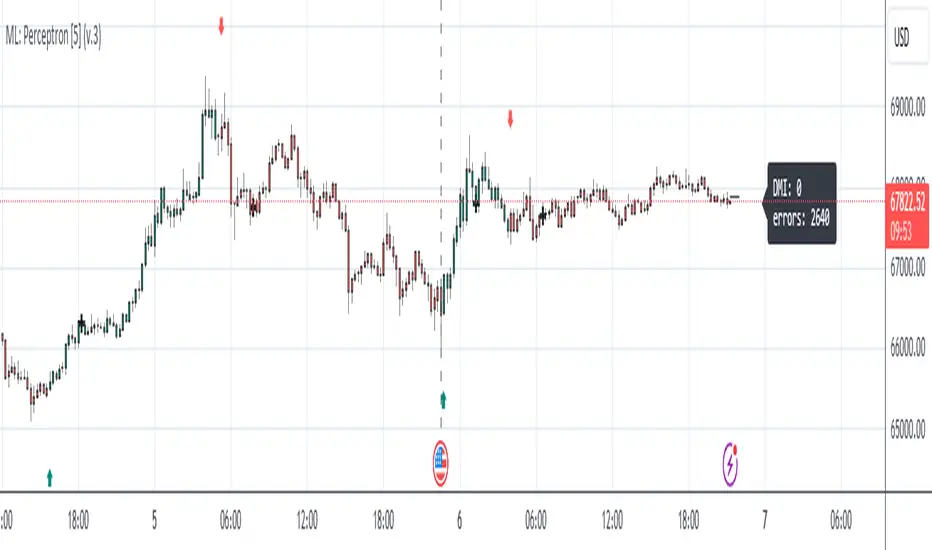
Machine Learning: Perceptron-based strategyPerceptron-based strategy
Description:
The Learning Perceptron is the simplest possible artificial neural network (ANN), consisting of just a single neuron and capable of learning a certain class of binary classification problems. The idea behind ANNs is that by selecting good values for the weight parameters (and the bias), the ANN can model the relationships between the inputs and some target.
Generally, ANN neurons receive a number of inputs, weight each of those inputs, sum the weights, and then transform that sum using a special function called an activation function. The output of that activation function is then either used as the prediction (in a single neuron model) or is combined with the outputs of other neurons for further use in more complex models.
The purpose of the activation function is to take the input signal (that’s the weighted sum of the inputs and the bias) and turn it into an output signal. Think of this activation function as firing (activating) the neuron when it returns 1, and doing nothing when it returns 0. This sort of computation is accomplished with a function called step function: f(z) = {1 if z > 0 else 0}. This function then transforms any weighted sum of the inputs and converts it into a binary output (either 1 or 0). The trick to making this useful is finding (learning) a set of weights that lead to good predictions using this activation function.
Training our perceptron is simply a matter of initializing the weights to zero (or random value) and then implementing the perceptron learning rule, which just updates the weights based on the error of each observation with the current weights. This has the effect of moving the classifier’s decision boundary in the direction that would have helped it classify the last observation correctly. This is achieved via a for loop which iterates over each observation, making a prediction of each observation, calculating the error of that prediction and then updating the weights accordingly. In this way, weights are gradually updated until they converge. Each sweep through the training data is called an epoch.
In this script the perceptron is retrained on each new bar trying to classify this bar by drawing the moving average curve above or below the bar.
This script was tested with BTCUSD, USDJPY, and EURUSD.
Note: TradingViews's playback feature helps to see this strategy in action.
Warning: Signals ARE repainting.
Style tags: Trend Following, Trend Analysis
Asset class: Equities, Futures, ETFs, Currencies and Commodities
Dataset: FX Minutes/Hours+/Days
Pinescript v4 - The Holy Grail (Trailing Stop)After studying several other scripts, I believe I have found the Holy Grail! (Or perhaps I've just found a bug with Tradingview's Pinescript v4 language) Anyhow, I'm publishing this script in the hope that someone smarter than myself could shed some light on the fact that adding a trailing stop to any strategy seems to make it miraculously...no that's an understatement...incredulously, stupendously, mind-bendingly profitable. I'm talking about INSANE profit factors, higher than 200x, with drawdowns of <10%. Sounds too good to be true? Maybe it is...or you could hook it up to your LIVE broker, and pray it doesn't explode. This is an upgraded version of my original Pin Bar Strategy.
Recommended Chart Settings:
Asset Class: Forex
Time Frame: H1
Long Entry Conditions:
a) Exponential Moving Average Fan up trend
b) Presence of a Bullish Pin Bar
c) Pin Bar pierces the Exponential Moving Average Fan
Short Entry Conditions:
a) Exponential Moving Average down trend
b) Presence of a Bearish Pin Bar
c) Pin Bar pierces the Exponential Moving Average Fan
Exit Conditions:
a) Trailing stop is hit
b) Moving Averages cross-back (optional)
c) It's the weekend
Default Robot Settings:
Equity Risk (%): 3 //how much account balance to risk per trade
Stop Loss (x*ATR, Float): 0.5 //stoploss = x * ATR, you can change x
Stop Loss Trail Points (Pips): 1 //the magic sauce, not sure how this works
Stop Loss Trail Offset (Pips): 1 //the magic sauce, not sure how this works
Slow SMA (Period): 50 //slow moving average period
Medium EMA (Period): 18 //medium exponential moving average period
Fast EMA (Period): 6 //fast exponential moving average period
ATR (Period): 14 // average true range period
Cancel Entry After X Bars (Period): 3 //cancel the order after x bars not triggered, you can change x
Backtest Results (2019 to 2020, H1, Default Settings):
AUDUSD - 1604% profit, 239.6 profit factor, 4.9% drawdown (INSANE)
NZDUSD - 1688.7% profit, 100.3 profit factor, 2.5% drawdown
GBPUSD - 1168.8% profit, 98.7 profit factor, 0% drawdown
USDJPY - 900.7% profit, 93.7 profit factor, 4.9% drawdown
USDCAD - 819% profit, 31.7 profit factor, 8.1% drawdown
EURUSD - 685.6% profit, 26.8 profit factor, 5.9% drawdown
USDCHF - 1008% profit, 18.7 profit factor, 8.6% drawdown
GBPJPY - 1173.4% profit, 16.1 profit factor, 7.9% drawdown
EURAUD - 613.3% profit, 14.4 profit factor, 9.8% drawdown
AUDJPY - 1619% profit, 11.26 profit factor, 9.1% drawdown
EURJPY - 897.2% profit, 6 profit factor, 13.8% drawdown
EURGBP - 608.9% profit, 5.3 profit factor, 9.8% drawdown (NOT TOO SHABBY)
As you can clearly see above, this forex robot is projected by the Tradingview backtester to be INSANELY profitable for all common forex pairs. So what was the difference between this strategy and my previous strategies? Check my code and look for "trail_points" and "trail_offset"; you can even look them up in the PineScript v4 documentation. They specify a trailing stop as the exit condition, which automatically closes the trade if price reverses against you.
I however suspect that the backtester is not properly calculating intra-bar price movement, and is using a simplified model. With this simplfied approach, the trailing stop code becomes some sort of "holy grail" generator, making every trade entered profitable.
Risk Warning:
This is a forex trading strategy that involves high risk of equity loss, and backtest performance will not equal future results. You agree to use this script at your own risk.
Hint:
To get more realistic results, and *maybe* overcome the intrabar simulation error, change the settings to: "Stop Loss Trail Points (pips)": 100
I am not sure if this eradicates the bug, but the entries and exits look more proper, and the profit factors are more believable.

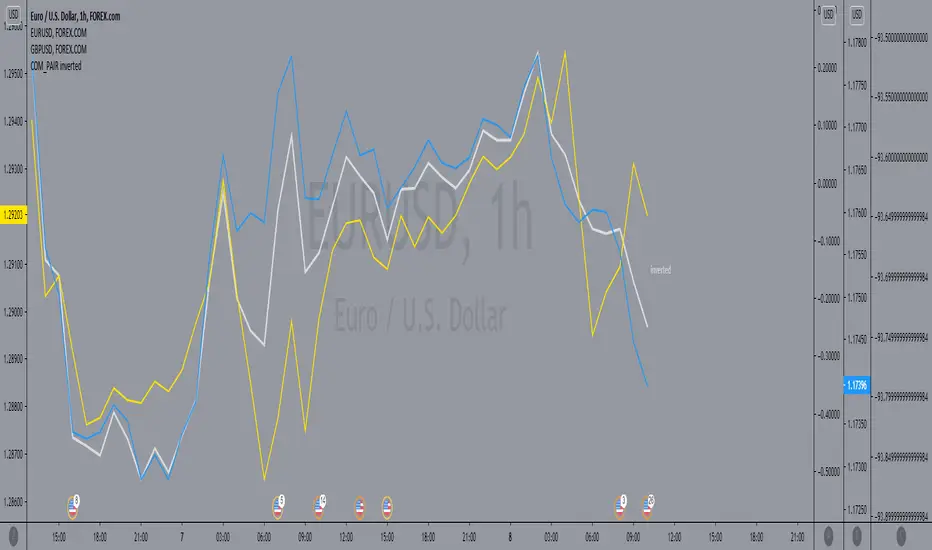
COM_PAIR invertedthe script make it easy on the eyes to compare the inverted symbols lines in comparison with the others, for example by utilizing TVC:DXY / FOREXCOM:USDCAD / FOREXCOM:USDJPY, you cab easily compare with them to EURUSD and GBPUSD.
Currency Group Stochastic (Dual Timeframe)
This is a stochastic for an entire currency group (majors and crosses). So if you are wondering whether the entire group will reverse this might help. For example, if you are think the USD group will roll over you can see an amalgamated stochastic of AUDUSD, NZDUSD, USDJPY, USDCHF, EURUSD, GBPUSD, USDCAD (average stochastic of all of them). The concept is that it might give help to identify 2 opposing currencies - an overbought currency verses an oversold currency.
Also, if your 'classic' instrument specific stochastic is showing an entry, does the the entire currency group agree?
There's more! You can also see the stochastic of the timeframe above on the current timeframe. You're current period stochastic tells you you've an entry and the stochastic from the timeframe above can indicate there is momentum in your direction. (There is a classic stochastic version of this on my profile)
There is a limit to how much I can fit into a single indicator so if you want to see the current and timeframe above together (recommended) you need to overlap the indicator on itself. See below
You can create a dashboard combined with 'currency relative strengths' (that indicator is on my profile) as per below. You now have an idea of the currency strengths, which currencies are correlating and potential turning point to help you decide which currencies to focus on...
Example...
gbp group COULD be ready to buy
chf group COULD be ready to sell
gbpchf - wait for the 3 min chart to roll over and an its not a bad call (considering it took 60 secs to review the market and choose an entry with the possible backing of the entire currency groups :o) )
REMEMBER, YOU CAN'T THIS TRADE FROM THIS INDICATOR. LOOK AT IT TO UNDERSTAND WHAT THE MARKET MIGHT BE DOING AND FOCUS YOUR DETAILED ATTENTION BASED ON YOUR CONCLUSION.
Good luck

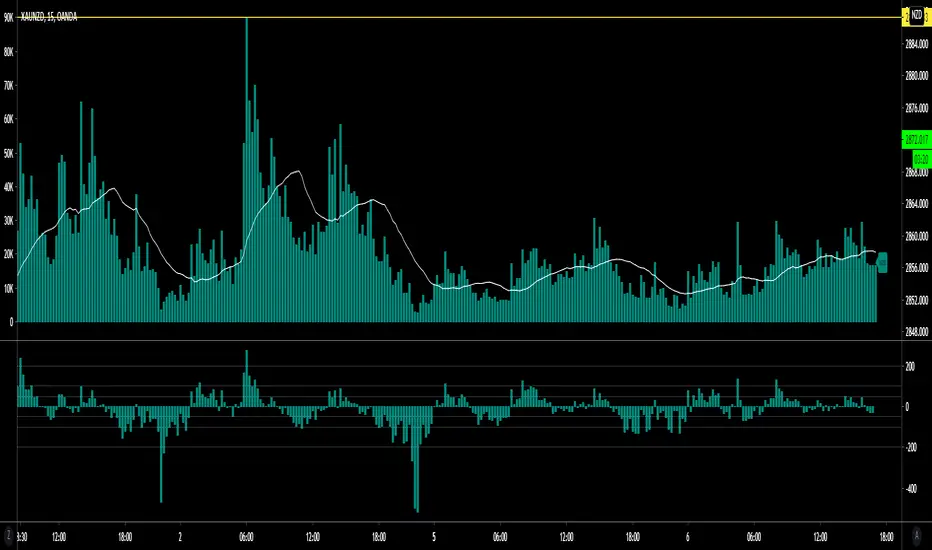
Currency Group Volume
This indicator shows the combined volume of an entire currency from the majors and crosses. So if you chose USD you get the combined volume of audusd, nzdusd, usdjpy, usdchf, eurusd, gbpusd, usdcad...
I made it to see if it would reveal where orders where flowing or perhaps where turning points were etc.
There's an example below of how I was trying to use it. I'm not sure it shows anything too far from obvious.
Its been in my archive for ages so I thought i might as well share it - if anyone sees something I've missed let me know.
(the currency that had the smallest volume spike (AUD) had the biggest push after the volume)
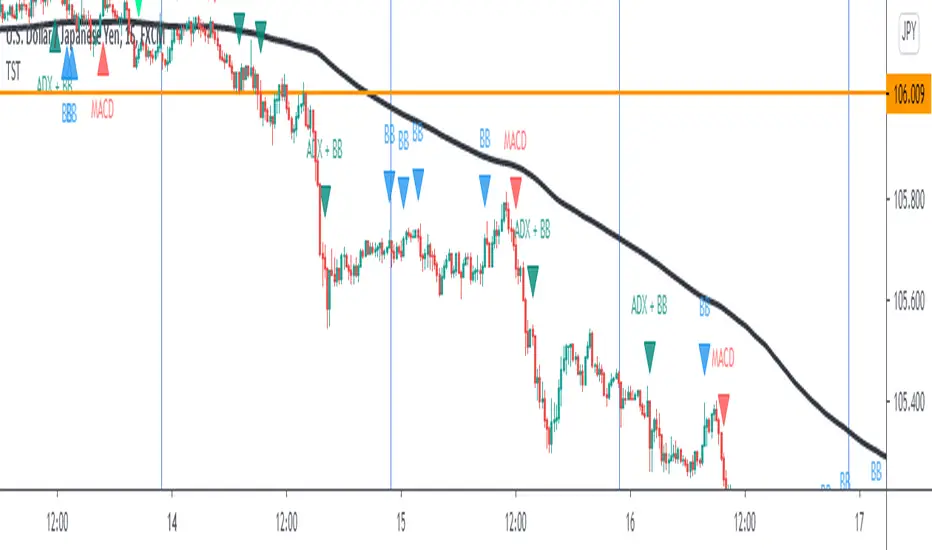
TST Signals & AlertsThis is an unofficial script for strategies tested on Trading Strategy Testing Youtube channel. Over time, most successful strategies will be added with an option to set strategy-specific alerts . TST Signals & Alerts will draw signals on the chart when the entry conditions are met. You can also opt for displaying indicators .
My script is meant for beginners but can be used by veterans too. Just pick one or two strategies, you don't want to flood your chart with conflicting signals. You may want to support your trades with a proper analysis. Is the market trending? Is there a fundament around the corner?
If a new signal occurs when there is still an open position, you are not supposed to take another.
The current version includes MACD and ADX + BB and BB strategies.
MACD strategy:
►Buy, when MACD crosses below the signal line when it is negative. The price must also be above 200 EMA.
►Sell, when MACD crosses above the signal line when it is positive. The price must also be below 200 EMA.
►This strategy was tested on 15-minute charts of EURUSD with reward-to-risk ratio 1,5 and win rate of 61% over 100 trades.
►►►MACD has to be added to your chart separately because it needs a new window. Ticking display indicators will not add MACD to your chart.
►►►MACD was also tested by a different channel I made a script for. You can view the results and the script here:
ADX + BB strategy:
►Buy, when the price is above 200 EMA and ADX becomes higher than 25.
►Sell, when the price is below 200 EMA and ADX becomes higher than 25.
►Stop-loss is either 200 EMA or Bollinger Bands level. Check the channel for more information.
►This strategy was tested on 5-minute charts of EURUSD, USDJPY, AUDUSD with reward-to-risk ratio 1,2 and win rate of 56% over 100 trades in total.
BB strategy:
►Buy, when the price is above 200 EMA and candle's low is below the lower Bollinger Band.
►Sell, when the price is below 200 EMA and candle's high is above the upper Bollinger Band.
►This strategy was tested on 15-minute charts of EURUSD with reward-to-risk ratio 1,5 and win rate of 52% over 100 trades in total.
►►►Due to the relatively low win rate of this strategy, you need to filter out potentially harmful signals with a proper analysis.
Bear in mind that backtesting performance doesn't guarantee future profitability. • Most systematic strategies are not suitable for each timeframe - if you use the different timeframe than the one it was tested on, the result can differ significantly. • You should perform your own backtest to base your trades on more data & to establish confidence in the selected strategy. • This script is not a replacement for proper analysis.
New strategies will be added when I have time. If I see multiple people asking for the same feature, I might agree to release it with a new version. I am not going to add input options in this script, it could come as a separate script though. I am in no way affiliated with the Youtube channel, so if you find the script helpful, shot me a message or send me some TradingView coins >)
If you encounter any bug, you can report it in a message or in comments. Support it with screenshot and relevant information such as a time when it occurred and what options were on etc.
Amazing scalper for majors with risk managementHello,
Today I am glad to bring you an amazing simple and efficient scalper strategy.
Best suited for 1M time frame and majors currency pairs.
Its made of :
Ema (exponential moving average) , long period 25
Ema(exponential moving average) Predictive, long period 50,
Ema(exponential moving average) Predictive, long period 100
Risk management , risking % of equity per trade using stop loss and take profits levels.
Long Entry:
When the Ema 25 cross up through the 50 Ema and 100 EMA. and we are in london or new york session( very important the session, imagine if we have only american or european currencies, its best to test it)
Short Entry:
When the Ema 25 cross down through the 50 Ema and 100 EMA, and we are in london or new york session( very important the session, imagine if we have only american or european currencies, its best to test it)
Exit:
TargetPrice: 5-10 pips
Stop loss: 9-12 pips
Hope you enjoy it :)

PineScript v4 - Forex Pin-Bar Trading StrategyPineScript v4, forex trading robot based on the commonly used bullish / bearish pin-bar piercing the moving averages strategy.
I coded this robot to stress-test the PineScript v4 language to see how advanced it is, and whether I could port a forex trading strategy from MT4 to TradingView.
In my opinion, PineScript v4 is still not a professional coding language; for example you cannot use IF-statements to modify the contents of global variables; this makes complex robot behaviour difficult to implement. In addition, it is unclear if the programmer can use nested IF-ELSE, or nested FOR within IF.
The sequence of program execution is also unclear, and although complex order entry and exit appears to function properly, I am not completely comfortable with it.
Recommended Chart Settings:
Asset Class: Forex
Time Frame: H1
Long Entry Conditions:
a) Moving Average up trend, fast crosses above slow
b) Presence of a Bullish Pin Bar
c) Pin Bar pierces either Moving Average
d) Moving Averages must be sloping up, angle threshold (optional)
Short Entry Conditions:
a) Moving Average down trend, fast crosses below slow
b) Presence of a Bearish Pin Bar
c) Pin Bar pierces either Moving Average
d) Moving Averages must be sloping down, angle threshold (optional)
Exit Conditions:
a) Stoploss level is hit
b) Takeprofit level is hit
c) Moving Averages cross-back (optional)
Default Robot Settings:
Equity Risk (%): 3 //how much account balance to risk per trade
Stop Loss (x*ATR, Float): 2.1 //stoploss = x * ATR, you can change x
Risk : Reward (1 : x*SL, Float): 3.1 //takeprofit = x * stop_loss_distance, you can change x
Fast MA (Period): 20 //fast moving average period
Slow MA (Period): 50 //slow moving average period
ATR (Period): 14 //average true range period
Use MA Slope (Boolean): true //toggle the requirement of the moving average slope
Bull Slope Angle (Deg): 1 //angle above which, moving average is considered to be sloping up
Bear Slope Angle (Deg): -1 //angle below which, moving average is considered to be sloping down
Exit When MA Re-Cross (Boolean): true //toggle, close trade if moving average crosses back
Cancel Entry After X Bars (Period): 3 //cancel the order after x bars not triggered, you can change x
Backtest Results (2019 to 2020, H1, Default Settings):
EURJPY - 111% profit, 2.631 profit factor, 16.43% drawdown
EURUSD - 103% profit, 2.899 profit factor, 14.95% drawdown
EURAUD - 76.75% profit, 1.8 profit factor, 17.99% drawdown
NZDUSD - 64.62% profit, 1.727 profit factor, 19.14% drawdown
GBPUSD - 58.73% profit, 1.663 profit factor, 15.44% downdown
AUDJPY - 48.71% profit, 1.635 profit factor, 11.81% drawdown
USDCHF - 30.72% profit, 1.36 profit factor, 22.63% drawdown
AUDUSD - 8.54% profit, 1.092 profit factor, 19.86% drawdown
EURGBP - 0.03% profit, 1.0 profit factor, 29.66% drawdown
USDJPY - 1.96% loss, 0.972 profit factor, 28.37% drawdown
USDCAD - 6.36% loss, 0.891 profit factor, 21.14% drawdown
GBPJPY - 28.27% loss, 0.461 profit factor, 39.13% drawdown
To reduce the possibility of curve-fitting, this robot was backtested on 12 popular forex currencies, as shown above. The robot was profitable on 8 out of 12 currencies, breakeven on 1, and made a loss on 3.
The default robot settings could be over-fitting for the EUR, as we can see out-sized performance for the EUR pairs, with the exception of the EURGBP. We can see that GBPJPY made the largest loss, so these two pairs could be related.
Risk Warning:
This is a forex trading strategy that involves high risk of equity loss, and backtest performance will not equal future results. You agree to use this script at your own risk.

IntradaySignal #Trading #Candlestick #SignalThis is a simple version of taking bull and bear positions.
Time Frame: Although the time frame decided while making the script was for 1 minute chart, but after checking, even Daily charts work good.
Asset class: The underlying here, is XAUUSD (GOLD) but confirmatory strong positional trades on stocks for intraday purposes.
Condition: The signals are meaningful and are of significant importance when its in trending pattern and not in sideways pattern.
The signals are presented by the background color. when the color is red, start taking short positions, and when the signal is green, go with long position.
StopLoss: Complete reliance on the script might not be rewarding, Prepare your own stoploss and targets. I advise you to take profit and book losses as per "resistance & support" zones.

Rain On Me IndicatorFinally, we made it :D
Rain On Me Indicator, As the name suggests this indicator will make money rain on you. More seriously, this indicator contains :
This indicator contains:
-Bullish and bearish RSI divergences showing on chart with alerts.
-Parabolic SAR with Labels on chart with buying or selling alerts.
-3 Moving Average (MA 1 : 7, MA 2 : 21 MA 3 HIDDEN : 50 (Cross alerts for Pullback)
-Customizable Bollinger band
-Fibonacci on 10 levels with the level 0 to the middle. This Fibonacci help a lot since it can let you find easily entry/exit point, trend and even where to place your Take Profit and Stop Loss. It have alerts for most important levels (0.382, 0.§, 0.618) for Crossunder and Crossover in Bullish or Bearish trend.
-Fully Customizable Ichimoku Cloud.
-Trend Buy/Sell Labels on chart with buying or selling signal alerts.
-Trend color visible on candles.
If an alert trigger of Buy/Sell Signal with the same alert based on PSAR, so you can be confident to enter in position. Alway checking fibs level that is the key thing with this indicator. the script has been set to have the best possible results on as many market as possible. But.best result for zfter backtesting is on
Forex : EUR/USD, USDJPY, USDCAD.
Indice : S&P500, NASDAQ, DOWJONES
Commodities : OIL, WTI
Everything work on following timeframe :
15MN, 1H, 4H, DAILY, WEEKLY.
So that you can avoid having to set it again, whether it be in minutes, hours, days, months.
So you can easily trade in the mode that suits you best. It works well on everything from indices to forex to commodities etc. I thank all those who allowed me to carry out this project. IF you feelt free to give your ideas, suggestions, for improve it by sending me messages.
This is really a first version sp it may contain bugs / errors that will be fixed over time.
A BIG THANK YOU TO QUANTNOMAD WHO GIVE ME HIS PERMISSION TO USE, MODIFY AND REPUBLISH HIS "Ultimate Pivot Points Alerts" Script Indicator :
Good trade to all !


SupertrendIndicatorSupertrend (13,2.5) & Supertrend (18,3) are best for intraday.
Loving the signals.


EMA Crossover StrategyEMA Crossover Strategy
This strategy will enter a long trade when the 21 EMA crosses over the 55 EMA and both EMAs and the close price are above the 200 EMA (long-term trend).
It will enter a short trade when the 21 EMA crosses under the 55 EMA and both EMAs and the close price are below the 200 EMA.
It will exit a long trade when the RSI crosses under from overbought and indicates that the uptrend could be coming to an end.
It will exit a short trade when the RSI crosses over from oversold and indicates that the downtrend could be coming to an end.
Backtesting shows that it works best on:
30 MIN:
SYMBOL - PROFIT FACTOR
AUDCAD - 1.126
EURJPY - 1.12
EURNZD - 1.04
EURUSD - 1.65
GBPAUD - 1.27
USDCAD - 1.08
1 HR:
SYMBOL - PROFIT FACTOR
CADJPY- 1.23
EURNZD- 1.166
GBPJPY- 1.23
GBPUSD- 1.282
NZDJPY- 1.246
USDCHF- 1.344
3 HR:
SYMBOL - PROFIT FACTOR
CADCHF- 1.975
EURGBP- 1.776
EURNZD- 1.911
GBPAUD- 1.364
GBPCHF- 1.311
USDJPY- 1.162
XAUUSD - 2.00
As always, this strategy does not guarantee you to achieve profits and you should always use confirmations before entering a trade.
