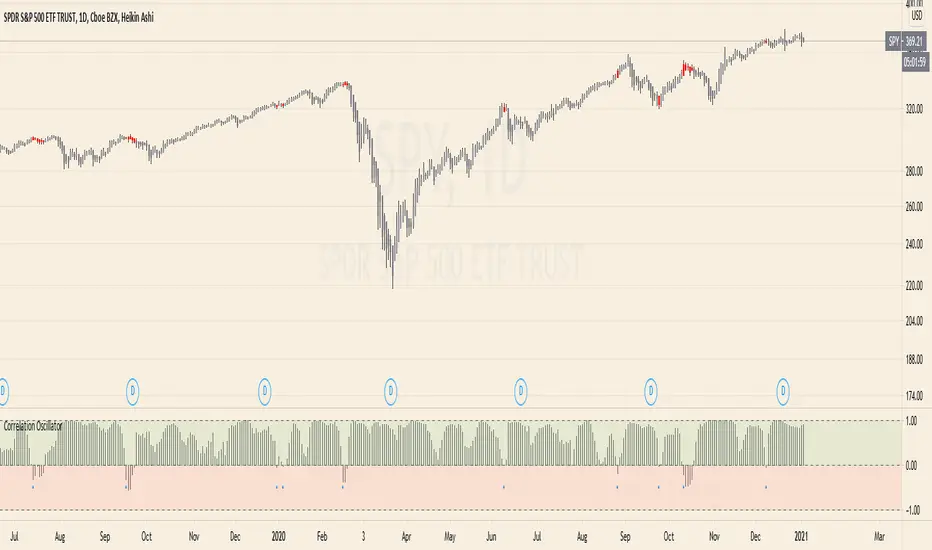
Correlation Oscillator - Anomaly AlertsThis script plots the correlation for two symbols as an oscillator:
A correlation of 1 means that both values move in the same direction together.
A correlation of -1 means that both values are perfectly negative correlated.
Parameter:
Length of the Correlation
The two symbols you want to calculate the correlation for
Barcolor: Defines whether Bar-coloring is set on.
The Number of bars lookback for anomaly: Say both are normally positively correlated it is an anomaly when the correlation turns negative and vica-versa.
Alerts: You can also set an Alert when an anomaly is detected.(blue dots on oscillator)
This has many use-cases:
For example VVIX and VIX are normally positive correlated.
When this turns negative, this can mean that we are on a turning point:
--> VVIX is rising while VIX is falling, risk of future Volatility is increasing (Top)
--> VIX is rising while VVIX is falling, risk of future Volatility is decreasing (Bottom)
Another use-case is just checking the correlation of stocks in your portfolio to diversify.
Cari dalam skrip untuk "vix"
Trading Psychology - Fear & Greed Index by DGTPsychology of a Market Cycle - Where are we in the cycle?
Before proceeding with the question "where", let's first have a quick look at "What is market psychology?"
Market psychology is the idea that the movements of a market reflect the emotional state of its participants. It is one of the main topics of behavioral economics - an interdisciplinary field that investigates the various factors that precede economic decisions. Many believe that emotions are the main driving force behind the shifts of financial markets and that the overall fluctuating investor sentiment is what creates the so-called psychological market cycles - which is also dynamic.
Stages of Investor Emotions:
* Optimism – A positive outlook encourages us about the future, leading us to buy stocks.
* Excitement – Having seen some of our initial ideas work, we begin considering what our market success could allow us to accomplish.
* Thrill – At this point we investors cannot believe our success and begin to comment on how smart we are.
* Euphoria – This marks the point of maximum financial risk. Having seen every decision result in quick, easy profits, we begin to ignore risk and expect every trade to become profitable.
* Anxiety – For the first time the market moves against us. Having never stared at unrealized losses, we tell ourselves we are long-term investors and that all our ideas will eventually work.
* Denial – When markets have not rebounded, yet we do not know how to respond, we begin denying either that we made poor choices or that things will not improve shortly.
* Fear – The market realities become confusing. We believe the stocks we own will never move in our favor.
* Desperation – Not knowing how to act, we grasp at any idea that will allow us to get back to breakeven.
* Panic – Having exhausted all ideas, we are at a loss for what to do next.
* Capitulation – Deciding our portfolio will never increase again, we sell all our stocks to avoid any future losses.
* Despondency – After exiting the markets we do not want to buy stocks ever again. This often marks the moment of greatest financial opportunity.
* Depression – Not knowing how we could be so foolish, we are left trying to understand our actions.
* Hope – Eventually we return to the realization that markets move in cycles, and we begin looking for our next opportunity.
* Relief – Having bought a stock that turned profitable, we renew our faith that there is a future in investing.
It's hard to predict with certainty where we exactly are in the market cycle, we can only make an educated guess as to the rough stage based on data available. And here comes the study "Trading Psychology - Fear & Greed Index"
Factors taken into account in this study include:
1-Price Momentum : Price Divergence/Convergence versus its Slow Moving Average
2-Strenght : Rate of Return (RoR) also called Return on Investment (ROI) is a performance measure used to evaluate the efficiency of an investment, net gain or loss of an investment over a specified time period, the rate of change in price movement over a period of time to help investors determine the strength
3-Money Flow : Chaikin Money Flow (CMF) is a technical analysis indicator used to measure Money Flow Volume over a set period of time. CMF can be used as a way to further quantify changes in buying and selling pressure and can help to anticipate future changes and therefore trading opportunities. CMF calculations is based on Accumulation/Distribution
4-Market Volatility : CBOE Volatility Index (VIX), the Volatility Index, or VIX, is a real-time market index that represents the market's expectation of 30-day forward-looking volatility. Derived from the price inputs of the S&P 500 index options, it provides a measure of market risk and investors' sentiments. It is also known by other names like "Fear Gauge" or "Fear Index." Investors, research analysts and portfolio managers look to VIX values as a way to measure market risk, fear and stress before they take investment decisions
5-Safe Haven Demand : in this study GOLD demand is assumed
What to look for :
*Fear and Greed Index as explained above,
*Divergencies
Tool tip of the label displayed provides details of references
Conclusion:
As investors, we always get caught up in the day to day price movements, and lose sight of the bigger picture. The biggest crashes happen not when investors are cautious and fearful, it's when they're euphoric and expecting financial instruments to continue going higher. So as we continue investing, don’t forget to stop and ask yourself, where in the chart do you think we are right now? The Market Psychology Cycle shines light on how emotions evolve, fear and greed index can come in handy, provided that it is not the only tool used to make investment decisions. It is easy to look back at market cycles and recognize how the overall psychology changed. Analyzing previous data makes it obvious what actions and decisions would have been the most profitable. However, it is much harder to understand how the market is changing as it goes - and even harder to predict what comes next. Many investors use technical analysis (TA) to attempt to anticipate where the market is likely to go. Investors are advised to keep tabs on fear for potential buying the dips opportunities and view periods of greed as a potential indicator that financial instruments might be overvalued.
Warren Buffett's quote, buy when others are fearful, and sell when others are greedy
Trading success is all about following your trading strategy and the indicators should fit within your trading strategy, and not to be traded upon solely
Disclaimer : The script is for informational and educational purposes only. Use of the script does not constitute professional and/or financial advice. You alone have the sole responsibility of evaluating the script output and risks associated with the use of the script. In exchange for using the script, you agree not to hold dgtrd TradingView user liable for any possible claim for damages arising from any decision you make based on use of the script

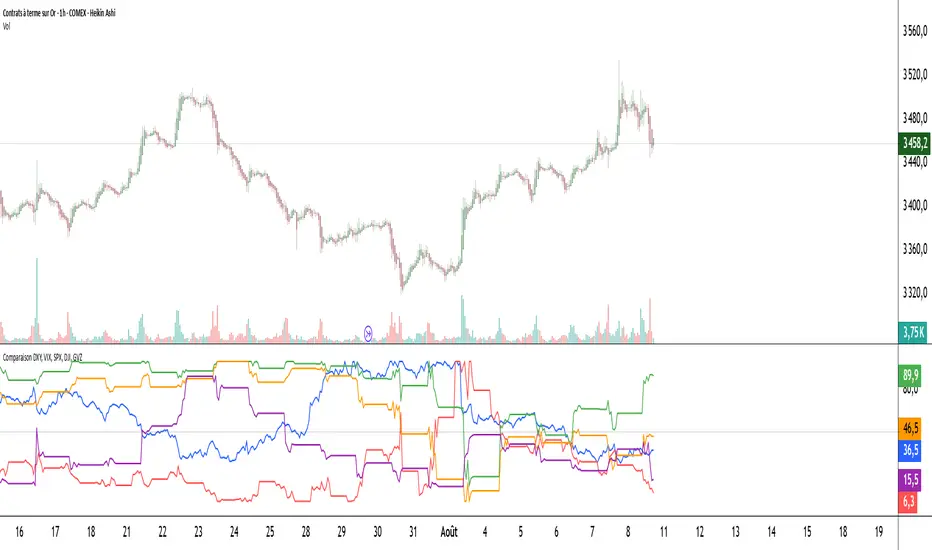
Comparaison DXY, VIX, SPX, DJI, GVZPine Script indicator compares the normalized values of DXY, VIX, SPX, DJI, and GVZ indices on a single scale from 0 to 100. Here's a breakdown of what it does:
Data Requests: Gets closing prices for:
US Dollar Index (DXY)
VIX Volatility Index
S&P 500 (SPX)
Dow Jones Industrial Average (DJI)
Gold Volatility Index (GVZ)
Normalization: Each index is normalized using a 500-period lookback to scale values between 0-100, making them comparable despite different price scales.
Visualization:
Plots each normalized index with distinct colors
Adds a dotted midline at 50 for reference
Uses thicker linewidth (2) for better visibility
Timeframe Flexibility: Works on any chart timeframe since it uses timeframe.period
This is useful for:
Comparing relative strength/weakness between these key market indicators
Identifying divergences or convergences in their movements
Seeing how different asset classes (currencies, equities, volatility) relate
You could enhance this by:
Adding correlation calculations between pairs
Including options to adjust the normalization period
Adding alerts when instruments diverge beyond certain thresholds
Including volume or other metrics alongside price
SPY, QQQ, VIX - Multi TF Trend Table***CURRENTLY IN BACKTESTING PHASE***
This TradingView script creates a real-time multi-timeframe trend status table for SPY, QQQ, and VIX using the Ripster-style EMA cloud logic.
🔍 What It Shows:
Current Price (1 Min): Live snapshot of each symbol.
10min Trend (5/12 EMA): Short-term momentum.
10min Trend (34/50 EMA): Intermediate-term direction.
1 Hour Trend: Higher timeframe trend.
Daily Trend: Long-term trend using 5/12 and 34/55 EMA alignment.
Each cell is color-coded:
✅ Green = Bullish
❌ Red = Bearish
Yellow can be used for neutral if customized.
⚙️ How It Works:
Uses request.security() to pull multi-timeframe EMA values for each symbol.
Compares fast/slow EMAs to determine bullish or bearish alignment.
The table is refreshed live and placed in a corner of your choice.
✅ Ideal For:
Trend traders using Ripster EMA clouds
SPY/QQQ/VIX correlation watchers
Traders seeking real-time trend clarity across multiple timeframes

TrendBoxThis indicator is called "TrendBox," designed to help traders analyze daily price ranges using several technical indicators. Below is a breakdown of its functionality, purpose, and key components:
Purpose
The script overlays indicators on a chart to assess whether the price is above or below key levels and moving in a trend.
VIX-based expected range (index fund targeted)
- This helps calculate the expected dealers range based on VIX implications. You can expect to see ranges be bought on and sold on. Moving outside this range creates heightened volatility and most of the time a gamma squeeze follows.
VWAP (Volume Weighted Average Price)
- This allows you to understand the mid point or average pricing of the daily session. If you're paying a premium or getting a discount on the daily session.
Daily Market Open
- Identifying the market open price is a key level on a daily session and allows you to identify some level of intraday trend.
Daily 4-period VWMA
- This is a crucial role of our indicator and showing short term time frame bias. Seeing price move over the top of our daily 4 level establishes a short term trend and can be used as a distribution guide, closing positions when we see longer time frame candles close under it. Vice versa for shorting.
It also displays a status box (optional) summarizing whether the price is above or below these levels, helping traders quickly evaluate market conditions.

BBS – Bond Breadth Signal"When bonds scream, breadth collapses, and fear spikes — BBS listens."
🧠 BBS – Bond Breadth Signal
A reversal timing tool built on macro conviction, not price noise.
The Bond Breadth Signal (BBS) was developed to identify major market inflection points by combining four key market stress indicators:
1) 10-Year Yield ROC – Measures sharp moves in the bond market
2) Z-Score of the 10Y – Captures statistical extremes
3) NSHF (Net Highs–Lows) – Signals internal market strength or weakness
4) TLT ROC + VIX – Confirmations of flight to safety and volatility-driven fear
When all conditions align, BBS marks either a For-Sure Buy or For-Sure Sell — these are rare, high-confidence signals designed to cut through noise and focus on true market dislocations.
🔧 Features:
-Background color and signal arrows on confirmation days
-Signals remain visually active for 3 days for added clarity
-Fully adjustable thresholds and alert toggles
-Plot panel for yield, TLT, NSHF, VIX, and Z-score visuals
This tool isn’t designed to fire every day. It’s meant to wait for those moments when the market truly bends — not just wiggles.
Best used on major indices (SPY, QQQ, IWM) to assess macro turning points.

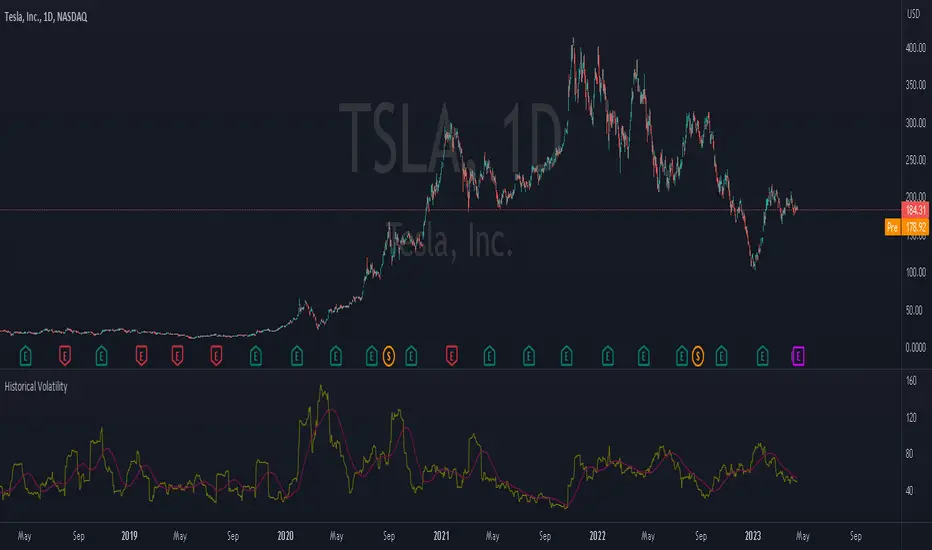
Historical VolatilityThis script calculates the historical volatility of a given market using the standard deviation of its returns over a specified lookback period.
The indicator also includes a volatility Simple Moving Average (SMA), a VIX SMA, and the VIX index as reference market.
The script uses the inputs from the user to adjust the calculation, such as lookback period, volatility SMA period, and reference market.
The Historical Volatility indicator can be a useful tool for traders and investors who want to measure the degree of variation of a market's price over time, which can help them to better understand market trends and potential risks. This script is licensed under the Mozilla Public License 2.0, which means that it can be used, modified, and distributed under the terms of this license.
Full Volatility Statistics and Forecast
This is a tool designed to translate the data from the expected volatility of different assets, such as for example VIX, which measures the volatility of SP500 index.
Once get the data from the volatility asset we want to measure(for this test I have used VIX), we are going to translate it the required timeframe expected move by dividing the initial value into :
252 = if we want to use the daily timeframe, since there are ~252 aproximative daily trading days
52 = if we want to use the weekly timeframe, since there 52 trading weeks in a year
12 = if we want to use the monthly timeframe, since there are 12 months in a year
For this example I have used 252 with the daily timeframe.
In this scenario, we can see that we had 5711 total cnadles which we analysed, and in this case, we had 942 crosses, where the daily movement ended up either above or below the channel made from the opening daily candle value + expected movement from the volatility, giving as a total of 16.5% of occurances that volatility was higher than expected, and in 83.5% of the times, we can see that the price stayed within our channel.
At the same time, we can see that we had 6 max losses in a row ( OUT) AND 95 max wins in a row (IN), and at the same time in those moments when the volatility crosses happen we had a 0.51% avg movements when the top crossed happened, and 0.67% avg movements when the bot happened.
Lastly on the second part of the panel, we had E which means the expected movement of today, for example it has 61.056$ , so lets say price opened on 4083, our top is 4083 + 61 and our bot is 4083 - 61 ( giving us the daily channel). At continuation we can see that overall the avg bull candle os 0.714% and avg bear candle was 0.805% .
I hope this tool will help you with your future analysis and trades !
If you have any questions please let me know !

(JS) Checklist SignalsWhat if I told you that you could use over 10 indicators at once without having a single one of them on you chart? Enter the Checklist Signals. This is probably the most complex yet simple indicator I've ever done.
What you get is 6 rows (if you want them all) of labels that hover at the top of your screen with a ton of extremely useful information. I will go down the list of options in the indicator settings and explain how it all works.
So the label placement is based on ATR. You choose your X Axis and Y Axis starting point then adjust the lookback period. Default lookback is 600 bars. What that means is, the indicator finds the highest high in the last 600 bars, then begins to place the labels above that zone based on the ATR of the chart. Different timeframes require very different combinations so it's all customizable. Sometimes if labels overlap you need to adjust the X Axis starting point, or the spread on either axis.
The next set of options allows you to decide what you'd prefer to be set on or off. Let's start with ATR and VWAP. I have added bands for both of these. When price is below the mean (which is the 21 ema by default), then the labels show you the next 5 standard deviations of ATR going down. When under one of these levels the label turns red. The opposite is true when above the mean and in those instances the labels will be green. It is the same with the VWAP, though instead of using the mean we use the daily VWAP as the starting point. If you choose to have levels switched on then you can see the actual values of each standard deviation level. Down lower in the options you can change the resolution and source used for VWAP.
The next option is "Trending". This creates a moving average using the length of the Trending Lookback Period (default is 5) and then tells you using arrows in the label which direction the trend of the indicator is going.
The next area let's you specify the information you receive in the Squeeze labels. By default all options are one - and this tells you if there's a Squeeze, what type of Squeeze there is, and how many bars the Squeeze has been building up or since it fired. These labels are color coded to correspond with the Squeeze type as well.
Then we get to another one of my indicators, the Ballista. One of the main signals is the "Inverted Squeeze" where the short term momentum inverts against the long term momentum. Here I have the distance between the two oscillators in the first label, and then the second label tells you if there's an Inverted Squeeze signal, if there's potential entry, confirmed entry, or how many bars its been since the last entry signal.
The next feature is off by default, but it will add arrows to your chart based on a simple lower highs and higher lows signals. Turning arrows on will place them right on your chart above or below each bar.
The rest of it is customizable settings of all the other indicators that are shown. Now looking at the labels themselves, starting in the top left corner:
First Row-
ADX + DMI: These labels show the ADX, DI+, & DI- values in each label. Whenever the DI+ or DI- is above the other then their respective label will light up. Also, when the ADX is above 20 (confirming the trend) it lights up in the same color as well.
Squeeze: I described how this worked above, the labels tell you if there's a Squeeze, how long there's been one, and how long since it fired, all while also changing to color of the associated Squeeze type.
Second Row -
Stacked EMAs: The top label looks at the EMA values using the numbers of the Fibonacci sequence. It looks at the EMA 8, 21, 34, 55, 89, & 233 and tells you if they're all stacked in the same direction (Stacked Bear meaning they're all crossed down in order, Stacked Bull meaning they're all crossed up in order). If the EMAs are all stacked but 1 or 2 it will say Stacked -1 or Stacked -2. When they're all over the place it will say they aren't stacked at all.
BB%: This tells you the value of the Bollinger Band %. If this is negative then you know that price is currently below the lower Bollinger Band, and if it is above 100% it is above the upper Bollinger Band.
RSI: This tells you the value of the RSI and the label changes colors based on the value.
Stoch: This tells you the Stochastic value and changes colors based on the value, same as the RSI.
Third Row -
The Mean: This tells you the numerical value of whatever you have the mean set as (21 ema by default). The label changes colors based on price being above or below the mean.
One ATR: This was something I added for those looking to plan their trades out. This tells you the value of one ATR so you can have a better idea of how to plan your trades based on this distance.
VIX: This tells you the current value of the VIX, and color changes based on being green or red on the day.
Ballista: I explained this above, it tells you the distance between the two oscillators and changes colors based on the trend being above or below 0. When there's an Inverted Squeeze this label is gray.
Inverted Squeeze: This label tells you if there's an inverted squeeze as well as if it is showing an entry or how many bars since the last entry signal. This label turns fuchsia on a bear signal and lime on a bull signal.
Fourth Row -
ATR Bands: As I explained above, this plots each standard deviation using ATR and changes colors based on price's relationship to each one.
Fifth Row -
VWAP: The three labels here show the daily, weekly, and monthly VWAP values, and color changes based on price's relationship to each one.
Sixth Row -
VWAP Bands: These are the standard deviation levels of the VWAP resolution of your choosing (as explained above), and just as the others, colors change based on price's relationship to each one.
I thought this was a really cool indicator that could be used for people like me who like knowing the right information, but HATE having their charts clustered with a ton of stuff. Hope you all like it, enjoy!

TICK strategy for SPY optionsImportant notes:
1. This strategy is designed for same day SPY option scalping. All profit shown in back testing report is based on Profit/Loss (P/L) estimates from trading options with approximately 6 months of data. By default, it is set to 10 option contracts. By default the initial capital is set to $5000. Pyramiding is set to 3.
2. This strategy works better with non-extended market data.
3. This strategy is mainly developed for SPY trading on 5 min chart, it probably will not be very profitable with other tickers or time frame without tweaking all the parameters first.
4. This strategy will work with QQQ as well, but please adjust the profit multiplier to match the P/L of QQQ options.
How it works:
When trading the indices, many rely on the TICK for market directions. This strategy is a trend following strategy that uses a combination of conditions using the following indicators:
- TICK
- RSI
- VIX volatility index
- EMA
For entries, the conditions are:
1. TICK moving average crossover with a delayed signal line
2. Bullish or bearish RSI signal, RSI > 50 for bullish, < 50 for bearish
3. VIX must be above a certain threshold to take advantage of high market volatility
4. Price must be on top of EMA line for long, and below for short
For exits, there are 3 scenarios:
1. Stop loss set by a percentage of the daily ATR value
2. Trend changes on the TICK and the RSI
3. Bearish or bullish divergence on price with TICK
This strategy automatically signal to close all trades at 3:50 pm EST at the end of the day.
Extras:
- There is an option to show P/L for reinvesting profits
Enjoy~!!! Let's all make $$$

Williams Vix Fix + Inverse [Alorse]The VIX Fix measures how close the current market price is to the lowest price of the last X candles. When prices are in uptrends, the close is usually near the high. But prices close near the low in downtrends.
It works because it’s based on how traders behave. The calculation fixes some of the problems with the VIX.
This indicator is based on CM_Williams_Vix_Fix Finds Market Bottoms and its great difference is that it adds the inverse functionality, also showing the possible highest areas of the market.

Correlation overlayThe script is intended to indicate when the correlation between VIX and VVIX gets below 0, on the selecteted security chart. It makes sense to plot it on indicies. This aims to present how the chart of a security looked like when the divergance between VIX and VVIX happened.

Equity Vix Correlation [Nic]Shows the correlation between an equity and the vix index.
When an equity and it's vix go up together, it is a risk off signal.
Does not support all equities, but does support many.

Nic's VIX CorrelationIdentifies divergences in price action between the VIX (volatility index) and a ticker. Divergences can be a 'red flag' identifying lack of confidence in the price action.
Best used in with volume studies, across multiple time frames, and across multiple tickers.
Supports any volatility ticker (VIX, VXN, RVX).

ATR%A useful measure of recent volatility. I use 50 day or 50 week periods, but you can experiment with other values too. Because it measures ranges as a % of current close it can be used to make good comparisons with other historic periods of low (or high) volatility. This measure reached a new 23 year low for daily S&P 500 in July 2017.
Uses and historic examples: lunatictrader.com

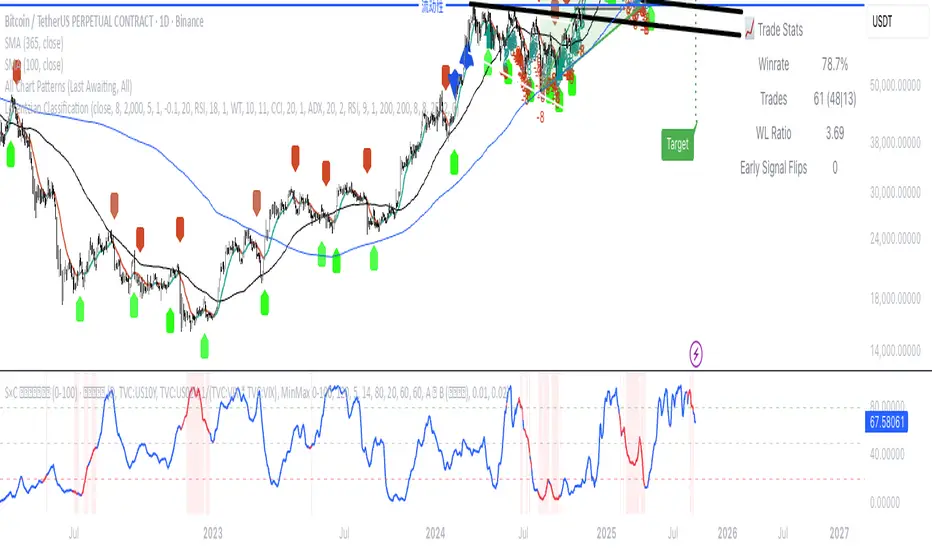
(VIX Spread-BTC Cycle Timing Strategy)A multi-asset cycle timing strategy that constructs a 0-100 oscillator using the absolute 10Y-2Y U.S. Treasury yield spread multiplied by the inverse of VIX squared. It integrates BTC’s deviation from its 100-day MA and 10Y Treasury’s MA position as dual filters, with clear entry rules: enter bond markets when the oscillator exceeds 80 (hiking cycles) and enter BTC when it drops below 20 (easing cycles).
VIX9D to VIX RatioVIX9D to VIX Ratio
The ratio > 1 can signal near-term fear > long-term fear (potential short-term stress).
The ratio < 1 implies long-term implied volatility is higher — more typical in calm markets.

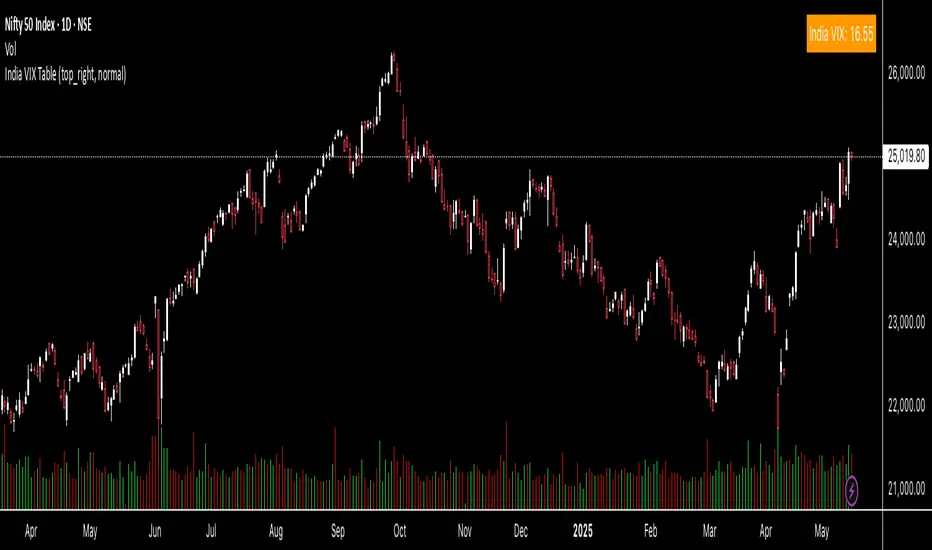
India VIX TableThis indicator gives you the India Vix value in real time on your chart. You can change the position on the chart as per your preference.
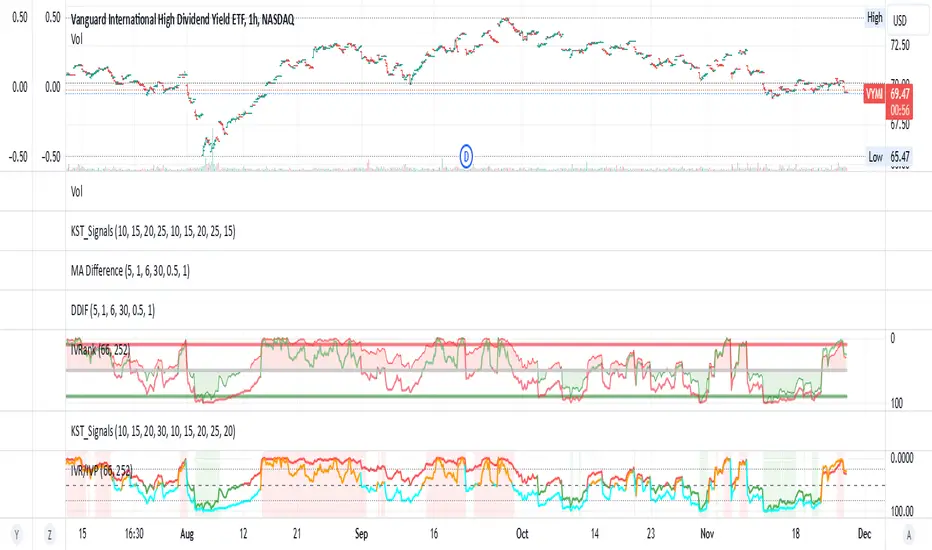
IV Rank/Percentile with Williams VIX FixDisplay IV Rank / IV Percentile
This indicator is based on William's VixFix, which replicates the VIX—a measure of the implied volatility of the S&P 500 Index (SPX). The key advantage of the VixFix is that it can be applied to any security, not just the SPX.
IV Rank is calculated by identifying the highest and lowest implied volatility (IV) values over a selected number of past periods. It then determines where the current IV lies as a percentage between these two extremes. For example, if over the past five periods the highest IV was 30%, the lowest was 10%, and the current IV is 20%, the IV Rank would be 50%, since 20% is halfway between 10% and 30%.
IV Percentile, on the other hand, considers all past IV values—not just the highest and lowest—and calculates the percentage of these values that are below the current IV. For instance, if the past five IV values were 30%, 10%, 11%, 15%, and 17%, and the current IV is 20%, the IV Rank remains at 50%. However, the IV Percentile is 80% because 4 out of the 5 past values (80%) are below the current IV of 20%.
Market Volatility Key: CHOP, ATR, VIX & 10Y BondThis script builds upon existing market analysis tools by providing a comprehensive dashboard that combines the Choppiness Index (CHOP), Average True Range (ATR) with a user-selectable timeframe, VIX (Volatility Index), and the 10-year US Treasury bond price in a compact tile format. The color-coded key provides quick visual cues for market conditions—highlighting whether the market is trending or consolidating—allowing traders to make informed decisions quickly.
For example, when trading the Nasdaq (NQ), you might use this indicator to help manage your scalping trades. If you trade on a 10-minute chart but set the ATR timeframe to 1 minute, it helps identify whether there is enough price movement to justify entering a trade. If the ATR is less than 10, it suggests there's not enough range for scalping opportunities, and you may choose to stay out of the trade.
This expanded indicator integrates and enhances existing concepts to deliver a well-rounded view of volatility, trend strength, and market conditions all in one glance, making it an essential tool for both trend-following and scalping strategies.

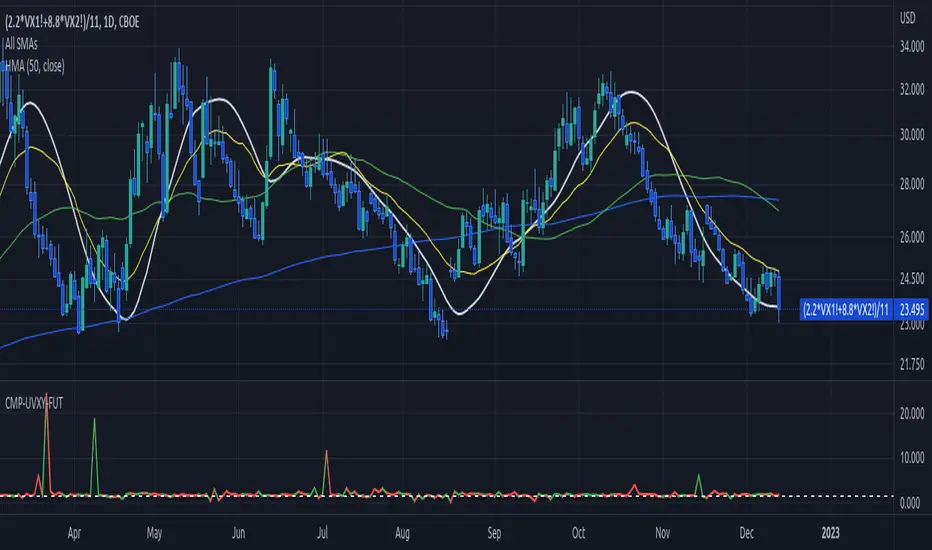
Compare UVXY to its VIX futures basketJust a quick script to show the actual movement ration between UVXY and its VIX futures basket.
The advertised reference value of 1.5 is shown as well.
The basket is hardcoded for now. Depending on how the underlyings of UVXY change, this might have to be configurable.
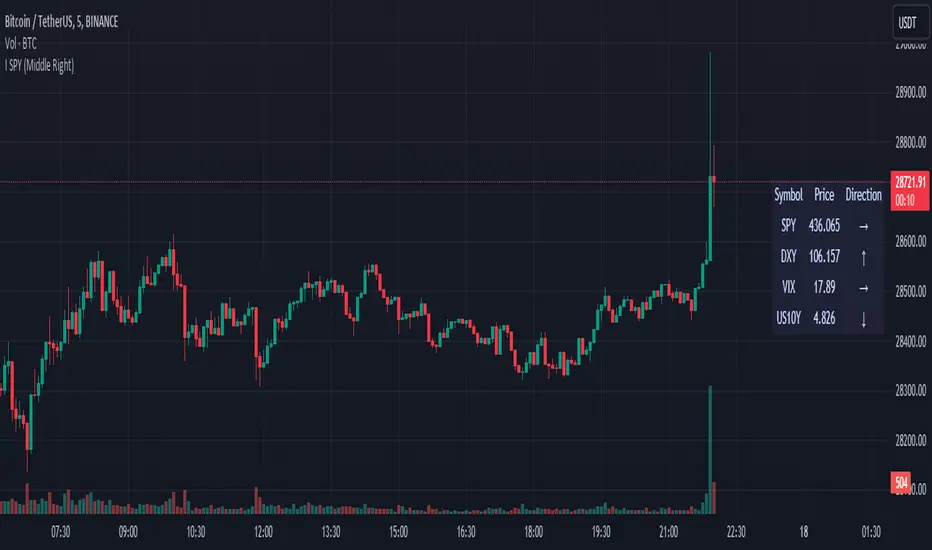
SPY DXY VIX MonitorIf you like to monitor DXY and VIX while trading SPY this tool is for you. It gives you the price of all three and the direction they are going based on a smoothed derivative. This should help you make trading decisions based on this strategy of monitoring the three much easier as you get a small box on your chart. You can change the location of this on your chart to! I know its a small release but I hope you can find great use with this!
Strategy Oil Z ScoreObjective is to find forward looking indicators to find good entries into major index's.
In similar vein to my Combo Z Score script I have implemented one looking at oil and oil volatility. Interestingly the script out performs WITHOUT applying the EMA in longer timeframes but under performs in shorter timeframes, for example 2007 vs 2019. Likely due to the bullish nature of the past decade (by and large). You have some options on the underlying included Oil vs OVX (Best), MOVE vs OVX and VIX vs OVX. Oil vs OVX out performs Combo Z Script. Favours Spy over QQQ or derivations (SPXL etc).
