MMMRI*VIXi took the MMMRI and as the title states, multiplied it by the vix. in looking to the past, when there are severe divergences between the mmmri to mmmri*vix, there tends to be a very decent buying opportunity. also it should be noted that this also depends on what level of volatility you can stomach as well as the trading strategy ur using.
Cari dalam skrip untuk "vix"

MS VIX Bull ReversalThis script measures the rebound of the implied volatility of the S&P 500 index options from an excessive panic zone. The IV starts a reversion to the mean as soon as profit taking from the hedge begins. The assumption behind it: this rebound indicates at least the beginning of a countermovement, in uptrends the end of the correction and the trend continuation.

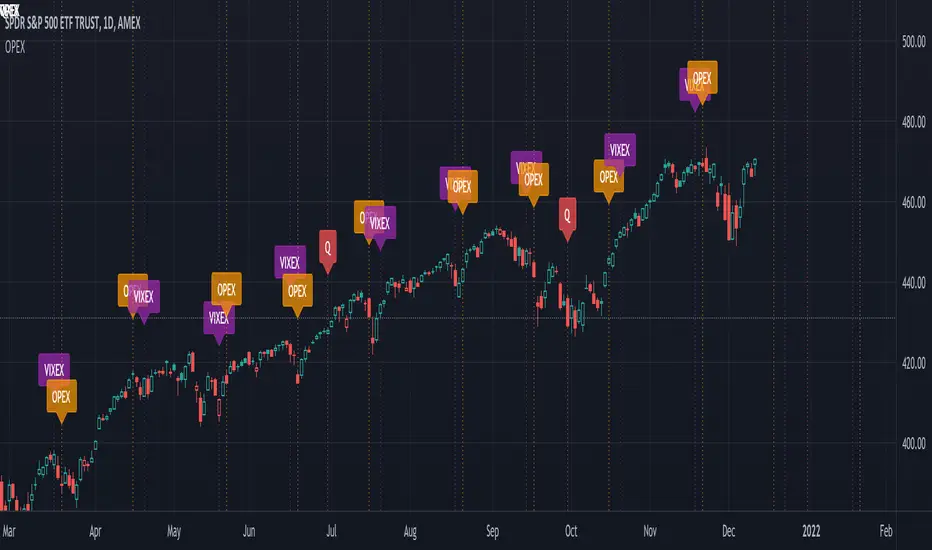
Option Expirations - Equities, Indexes, VIX OPEX VIXperationShows monthly and quarterly expirations for Equities, Indexes, & VIX. OPEX, VIXEX, Vixperation.
vol_premiaThis script shows the volatility risk premium for several instruments. The premium is simply "IV30 - RV20". Although Tradingview doesn't provide options prices, CBOE publishes 30-day implied volatilities for many instruments (most of which are VIX variations). CBOE calculates these in a standard way, weighting at- and out-of-the-money IVs for options that expire in 30 days, on average. For realized volatility, I used the standard deviation of log returns. Since there are twenty trading periods in 30 calendar days, IV30 can be compared to RV20. The "premium" is the difference, which reflects market participants' expectation for how much upcoming volatility will over- or under-shoot recent volatility.
The script loads pretty slow since there are lots of symbols, so feel free to delete the ones you don't care about. Hopefully the code is straightforward enough. I won't list the meaning of every symbols here, since I might change them later, but you can type them into tradingview for data, and read about their volatility index on CBOE's website. Some of the more well-known ones are:
ES: S&P futures, which I prefer to the SPX index). Its implied volatility is VIX.
USO: the oil ETF representing WTI future prices. Its IV is OVX.
GDX: the gold miner's ETF, which is usually more volatile than gold. Its IV is VXGDX.
FXI: a china ETF, whose volatility is VXFXI.
And so on. In addition to the premium, the "percentile" column shows where this premium ranks among the previous 252 trading days. 100 = the highest premium, 0 = the lowest premium.

BitMEX BTC Volatility IndexThis indicator displays the BitMEX BTC Volatility Index ( BVOL24H ) as an indicator and it can be compared to the VIX of the cryptocurrencies.
more information about how BVOL24H is calculated can be found here: www.bitmex.com
Symbol can be changed in the parameters

vx_termsUSAGE
--------
This script helps train your intuition for changes in the VX term structure. I recommend using it on the VIX chart, so you can compare changes in the terms to changes in VIX. It's also nice for calendar spread traders who want to get a feel for the same changes.
1. Select a day, month, and year using the inputs
2. Observe the data table.
3. Open the input again and increment or decrement the day (and month, year as necessary).
4. Click "Ok".
5. Click to deselect the indicator, which allows the chart to load new data.
6. The data table will be reloaded with the next/previous day's data.
The data table has the following columns:
- contract: the VX contracts, in sequence. refer to the CBOE for month codes (F for January, etc.)
- close: the closing price of the contract.
- ma:mb: the spread (difference) between this row and the next row.
- ma:mb chg: the spread's change from prior close.
For example, given the following values for the first two columns:
VXQ2021, 16.5, -3.1, -0.2
VXU2021, 19.6, ..., ...
The front month (Q = august) closed at 16.5, $3.1 below the s\September contract. The negative spread enlarged by $0.20 from $2.90 on the previous trading day.
BUGS, ODDITIES, AND LIMITATIONS:
-------------------------------------------
- The first column will be greyed out after expiration day, which is the 3rd Tuesday of that month. Unfortunately, I can't load the next month's contract due to some limitations with TV.
- The active date is highlighted with a yellow background. When a non-trading date is selected, the highlight will disappear. However, the data table will sometimes fill with the nearest trading date, prematurely. No worries, just know that the data is probably for the previous Friday.
- The script is clunky and slow, but this is the best I can do with TV. Hopefully they add more continuous contracts or allow true dynamic symbol loading.
SPECIAL THANKS:
---------------------
Thanks to HeWhoMustNotBeNamed for helping me get through some messiness. Very helpful guy.
www.tradingview.com

QuantAnna: Nifty VIX CorrelationNSE:NIFTY
Simple correlation indicator which oscillates around zero
Shows default correlation with NSE:IndiaVix
You can use it to check correlation with any other trading symbol or indices by simply selecting it in the settings.

The dispersion of volatility indicesThe script is my implementation of "Forecasting a Volatility Tsunami" by Andrew Thrasher (Thrasher Analytics). You can find the paper here: www.researchgate.net
I've changed a bit the approach - instead of two volatility indices (VIX & VVIX), I used two more: VXN and VXD. Additionally, I average the percentiles, but there is an option to swtich it to the original approach.


MOVE/VXTLT CorrelationMany know of the VIX for equity trading. Yet, many are unaware that there is the same kind of volatility measure for trading bonds, called the MOVE Index.
"The Merrill Lynch Option Volatility Estimate (MOVE) Index is a yield curve weighted index of the normalized implied volatility on 1-month Treasury options which are weighted on the 2, 5, 10, and 30 year contracts."
With this script one can see the the correlation and divergences between bonds and its volatility measure to make educated decisions in trading or hedging.
The idea of this script comes from NicTheMajestic.

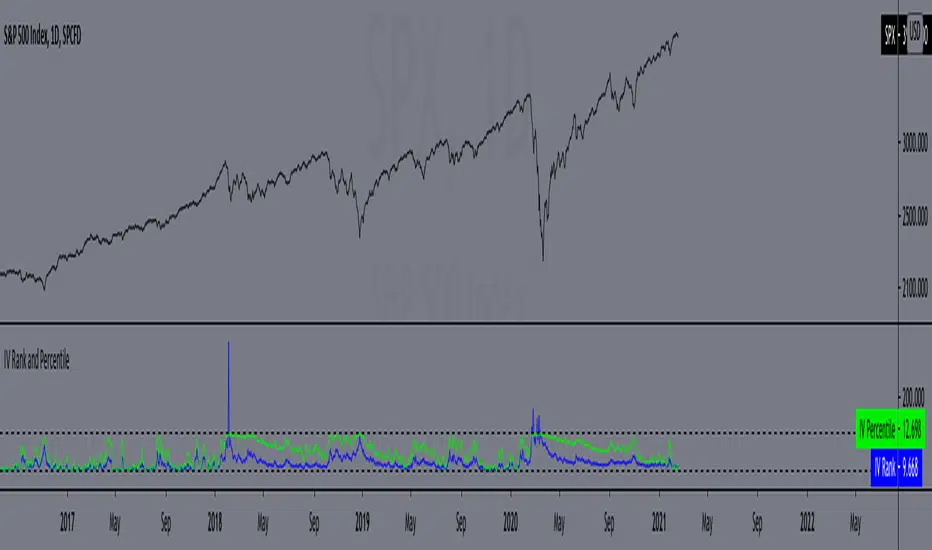
IV Rank and Percentile"All stocks in the market have unique personalities in terms of implied volatility (their option prices). For example, one stock might have an implied volatility of 30%, while another has an implied volatility of 50%. Even more, the 30% IV stock might usually trade with 20% IV, in which case 30% is high. On the other hand, the 50% IV stock might usually trade with 75% IV, in which case 50% is low.
So, how do we determine whether a stock's option prices (IV) are relatively high or low?
The solution is to compare each stock's IV against its historical IV levels. We can accomplish this by converting a stock's current IV into a rank or percentile.
Implied Volatility Rank (IV Rank) Explained
Implied volatility rank (IV rank) compares a stock's current IV to its IV range over a certain time period (typically one year).
Here's the formula for one-year IV rank:
(Current IV - 1 Year Low IV) / (1 Year High IV - 1 Year Low IV) * 100
For example, the IV rank for a 20% IV stock with a one-year IV range between 15% and 35% would be:
(20% - 15%) / (35% - 15%) = 25%
An IV rank of 25% means that the difference between the current IV and the low IV is only 25% of the entire IV range over the past year, which means the current IV is closer to the low end of historical levels of implied volatility.
Furthermore, an IV rank of 0% indicates that the current IV is the very bottom of the one-year range, and an IV rank of 100% indicates that the current IV is at the top of the one-year range.
Implied Volatility Percentile (IV Percentile) Explained
Implied volatility percentile (IV percentile) tells you the percentage of days in the past that a stock's IV was lower than its current IV.
Here's the formula for calculating a one-year IV percentile:
Number of trading days below current IV / 252 * 100
As an example, let's say a stock's current IV is 35%, and in 180 of the past 252 days, the stock's IV has been below 35%. In this case, the stock's 35% implied volatility represents an IV percentile equal to:
180/252 * 100 = 71.42%
An IV percentile of 71.42% tells us that the stock's IV has been below 35% approximately 71% of the time over the past year.
Applications of IV Rank and IV Percentile
Why does it help to know whether a stock's current implied volatility is relatively high or low? Well, many traders use IV rank or IV percentile as a way to determine appropriate strategies for that stock.
For example, if a stock's IV rank is 90%, then a trader might look to implement strategies that profit from a decrease in the stock's implied volatility, as the IV rank of 90% indicates that the stock's current IV is at the top of its range over the past year (for a one-year IV rank).
On the other hand, if a stock's IV rank is 0%, then traders might look to implement strategies that profit from an increase in implied volatility, as the IV rank of 0% indicates the stock's current implied volatility is at the bottom of its range over the past year."
This script approximates IV by using the VIX products, which calculate the 30-day implied volatility of the specified security.
*Includes an option for repainting -- default value is true, meaning the script will repaint the current bar.
False = Not Repainting = Value for the current bar is not repainted, but all past values are offset by 1 bar.
True = Repainting = Value for the current bar is repainted, but all past values are correct and not offset by 1 bar.
In both cases, all of the historical values are correct, it is just a matter of whether you prefer the current bar to be realistically painted and the historical bars offset by 1, or the current bar to be repainted and the historical data to match their respective price bars.
As explained by TradingView,`f_security()` is for coders who want to offer their users a repainting/no-repainting version of the HTF data.
Combo VIX and DXYHello traders
It's been a while :)
I wanted to share a cool script that you can use for any asset class.
The script isn't really special - though what it displays is super helpful
Volatility Index $VIX
(Source: Wikipedia)
VIX is the ticker symbol and the popular name for the Chicago Board Options Exchange's CBOE Volatility Index, a popular measure of the stock market's expectation of volatility based on S&P 500 index options.
It is calculated and disseminated on a real-time basis by the CBOE, and is often referred to as the fear index or fear gauge.
I consider that a $VIX above 30% is a very bearish signal.
Above 30% translating investors selling in masse their assets. #blood #on #the #street
Dollar Index $DXY
(Source: Wikipedia)
The U.S. Dollar Index (USDX, DXY, DX, or, informally, the "Dixie") is an index (or measure) of the value of the United States dollar relative to a basket of foreign currencies, often referred to as a basket of U.S. trade partners' currencies.
The Index goes up when the U.S. dollar gains "strength" (value) when compared to other currencies.
The index is designed, maintained, and published by ICE (Intercontinental Exchange, Inc.), with the name "U.S. Dollar Index" a registered trademark.
It is a weighted geometric mean of the dollar's value relative to following select currencies:
Euro (EUR), 57.6% weight
Japanese yen (JPY) 13.6% weight
Pound sterling (GBP), 11.9% weight
Canadian dollar (CAD), 9.1% weight
Swedish krona (SEK), 4.2% weight
Swiss franc (CHF) 3.6% weight
In "bear markets", the $DXY usually goes up.
People are selling their hard assets to get some $USD in return - pumping the $DXY higher
Corollary
I'm not sure which one happens first between a bearish $DXY or bearish $DXY... though both are usually correlated
If:
- $VIX goes above 30%, usually $DXY increases and assets versus the good old' $USD drop
- $VIX goes below 30%, usually $DXY decreases and assets versus the good old' $USD increases
This is a nice lever effect between both the $VIX, $DXY and the assets versus the $USD
That's being said, I don't only use those 2 information to enter in a trade.
It gives me though a strong confirmation whenever I'm long or short
Imagine I get a LONG signal but the combo $VIX + $DXY is bearish... this tells me to be cautious and to:
- enter at a pullback
- protect my position quickly at breakeven
- take my profit quick
For a mega bull market (some called it hyperinflation), you want your fiat to drop in value for the counter-asset to increase in value.
And before you ask.... yes I look at what $DXY is doing before taking a trade on $BTCUSD :)
In other words, $DXY going down is quite bullish for Bitcoin.
Settings and Alerts
The settings by default are the ones I use for my trading.
The background colors will be colored whenever the COMBO is bullish (green) or bearish (red)
Alerts are enabled using the brand new alert function published last week by @TradingView
That's it for today, I hope you'll like it :)
PS: In this chart above, I'm using the Supertrend indicator from @KivancOzbilgic
Dave

Daily Crypto StrategyThis is a long only strategy.
This strategy measures and creates a signal when an asset is moving out of a correlation with CBOE VIX into an inverse correlation.
It also has a risk management with TP/SL based on percentages.
If you have any questions let me know.

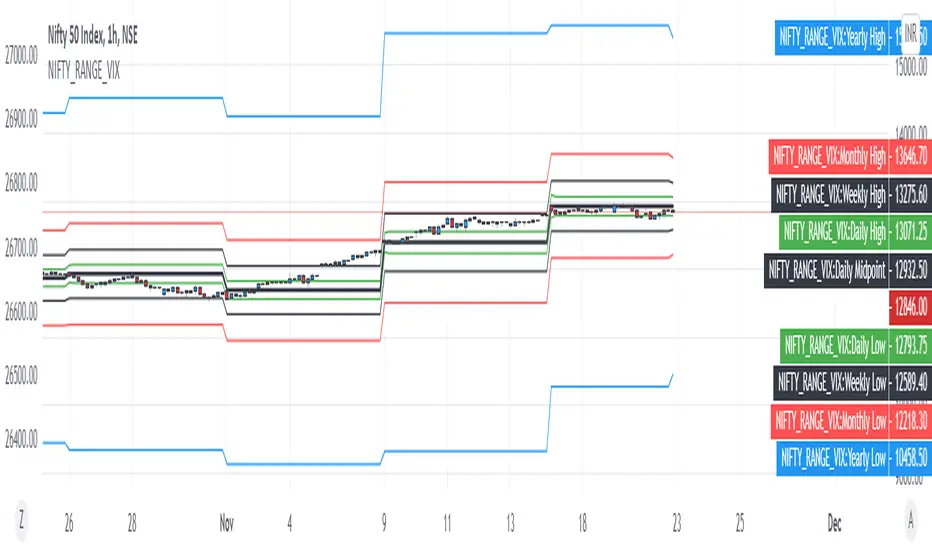
NIFTY VIX BANDSThis script can be used to visually identify the 1 standard deviation range of price movement anticipated by NSE ticker for Volatility Index NSE:INDIAVIX
Ideal to use on NSE:NIFTY ticker only!
The NIFTY range is extended to Yearly, Monthly, Weekly, Daily based on the current value of INDIAVIX.
All options are customizable:
Time frame of the VIX Bands
Select / De-select of Plots for Yearly, Monthly Weekly and Daily
VIX3M/1M ratioThis script simply calculates and plots the VIX 3 month versus 1 month ratio. Values below 1 indicate a strong panic situation in the market (1 month volatility is higher than the 3 month volatiliy). This might be a good opportunity to sell options.

VIX3M/VIX RatioPlots the ratio between the VIX3m and the VIX to show potential entry points (.8 - .9).

ATR and VIX For Profit Target and RSI LimitThe red line, based on ATR, should be used as a percentage gain goal. So I will set my profit targets based on this percentage.
The grey line is based on William's VIX and I use it to judge what RSI I should sell at.
@WACC Volatility Weighted PUT/CALL Positions [SPX]This indicator is based on Volatility and Market Sentiment. When volatility is high, and market sentiment is positive, the indicator is in a low or 'buy state'. When volatility is low and market sentiment is poor, the indicator is high.
The indicator uses the VIX as it's volatility input.
The indicator uses the spread between the Call Volume on SPX/SPY and the Put Volume.
This is pulled from CVSPX and PVSPX.
When volatility and put/call reaches a critical level, such as the levels present in a crisis or a sell off, the line will be green. See Sept 2015, 2008, and Feb 2018.
This level can be edited in the source code.
As the indicator is based on Put/Call, the indicator works best on larger time frames as the put/call ratio becomes a more discernible measure of sentiment over time.

IV/HV ratio 1.0 [dime]This script compares the implied volatility to the historic volatility as a ratio.
The plot indicates how high the current implied volatility for the next 30 days is relative to the actual volatility realized over the set period. This is most useful for options traders as it may show when the premiums paid on options are over valued relative to the historic risk.
The default is set to one year (252 bars) however any number of bars can be set for the lookback period for HV.
The default is set to VIX for the IV on SPX or SPY but other CBOE implied volatility indexes may be used. For /CL you have OVX/HV and for /GC you have GVX/HV.
Note that the CBOE data for these indexes may be delayed and updated EOD
and may not be suitable for intraday information. (Future versions of this script may be developed to provide a realtime intraday study. )
There is a list of many volatility indexes from CBOE listed at:
www.cboe.com
(Some may not yet be available on Tradingview)
RVX Russell 2000
VXN NASDAQ
VXO S&P 100
VXD DJIA
GVX Gold
OVX OIL
VIX3M 3-Month
VIX6M S&P 500 6-Month
VIX1Y 1-Year
VXEFA Cboe EFA ETF
VXEEM Cboe Emerging Markets ETF
VXFXI Cboe China ETF
VXEWZ Cboe Brazil ETF
VXSLV Cboe Silver ETF
VXGDX Cboe Gold Miners ETF
VXXLE Cboe Energy Sector ETF
EUVIX FX Euro
JYVIX FX Yen
BPVIX FX British Pound
EVZ Cboe EuroCurrency ETF Volatility Index
Amazon VXAZN
Apple VXAPL
Goldman Sachs VXGS
Google VXGOG
IBM VXIBM

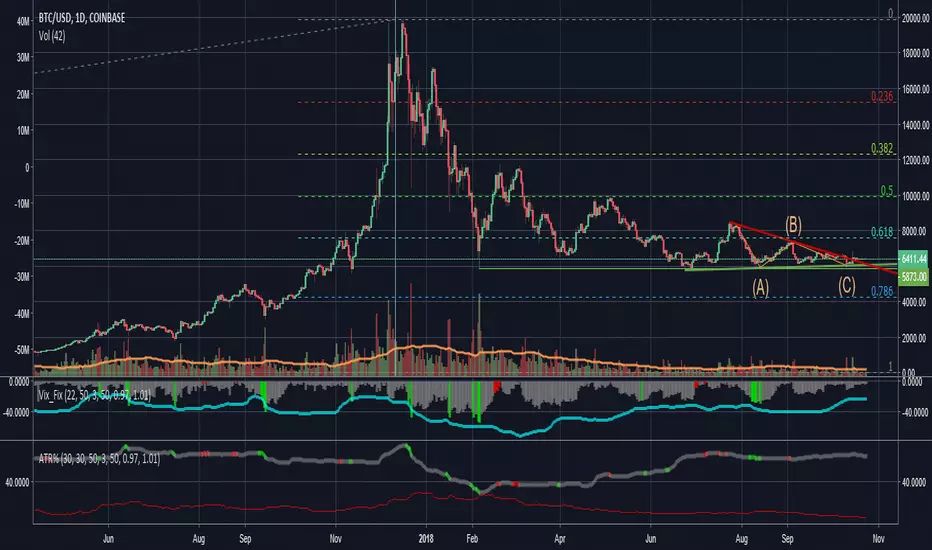
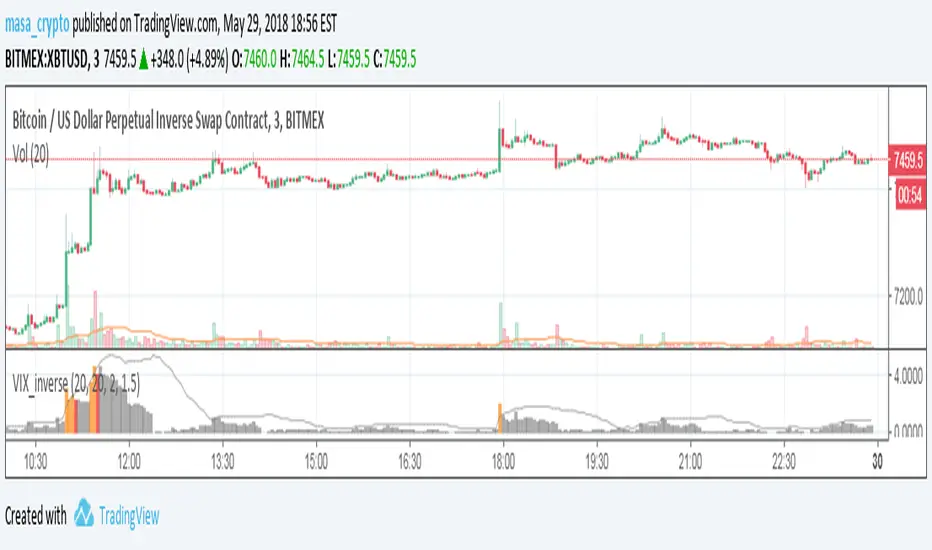
Williams_VIX_fix_inverseThe volatility index, Williams vix fix developed by Larry Williams, is a well-known index for finding market bottoms. It describes how much the current low price statistically deviates from the maximum within a given look-back period.
The inverse can be formulated by considering "how much the current high value statistically deviates from the minimum within a given look-back period." This transformation equates Vix_Fix_inverse. This indicator can be used for finding market tops, and therefore, is a good signal for a timing for taking a short position.

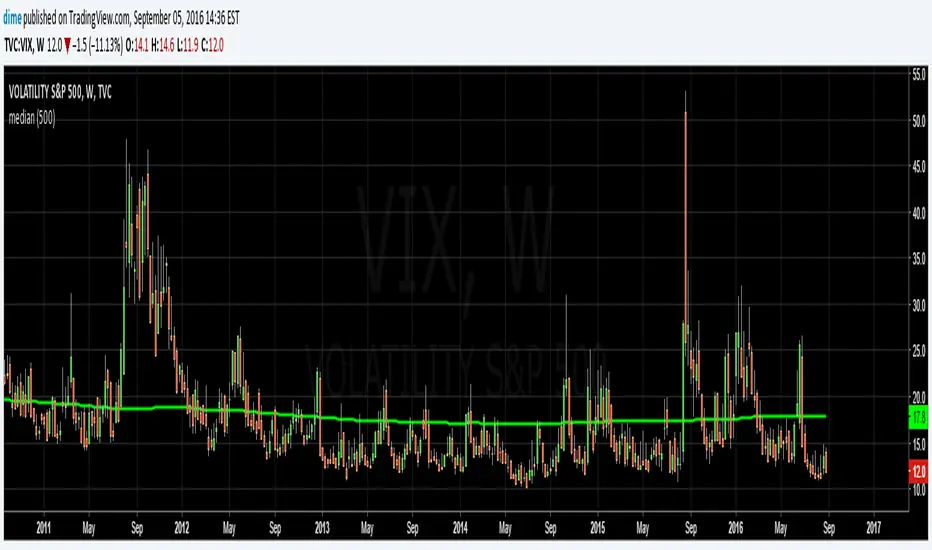
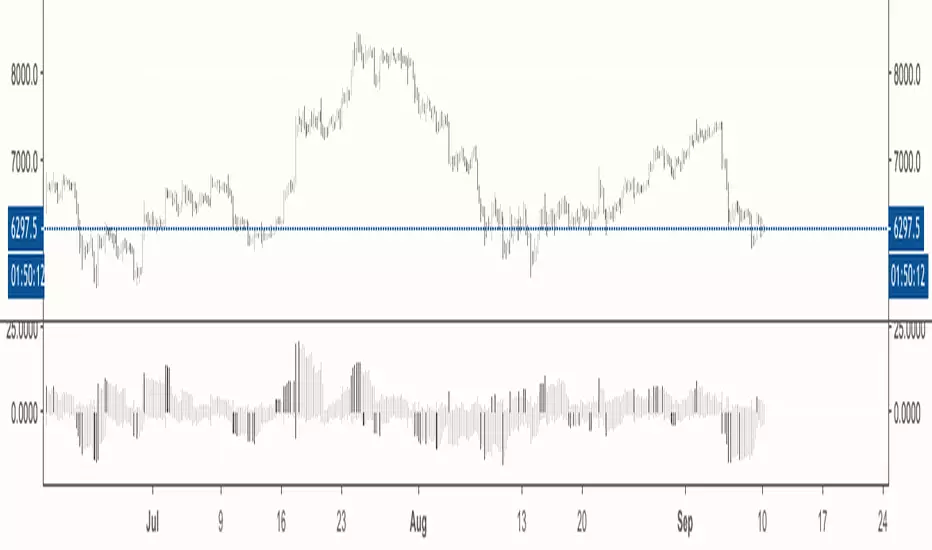
Moving MedianThis simple script was a collaborative effort with 4X4good.
It plots a moving median for the period using the 50th percentile value.
We wanted to know the median value of VIX but surprisingly, a median indicator wasn't yet available in the indicators library.
So we did a little research & put this together.