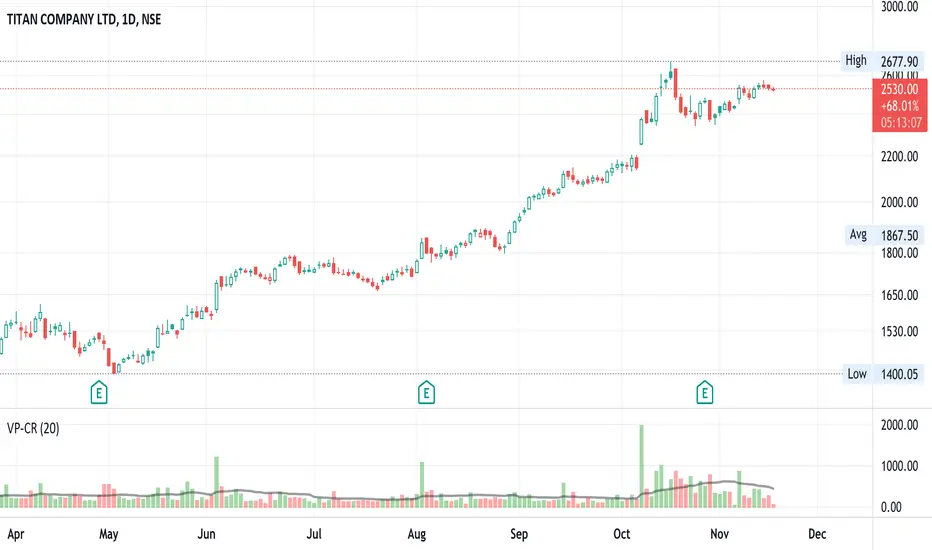
Volume x Price in Crores + RVolScript is designed predominantly for Indian users. Many are used to looking at numbers in lakhs and crores vs millions and billions, this provides a volume figure in rupee crores.
Formula is last close_price x volume / 1 cr or (close_price x volume /10000000). The second figure is the simple moving average (default to 20sma ) again in rupee crores. The third is the relative volume - todays volume / 20 day moving average.
Helpful especially when putting on a trade for a thinly traded stock. It is a quick gauge to how large or small one would want to buy or avoid. Helps manage risk. Also, great to see large volumes in crores to gauge institutional buys or sells.
On 10/NOV/21 - In the chart displayed here, Titan volumes are on average quite substantial as one can see. The 20 day moving average is 550 CR+. 10/NOV volumes are shown as 226 CR and the RVOL is 0.41 (226/550).
Cari dalam skrip untuk "volume"
Volume Profile HeatmapA variation of a Volume Profile based on code originally by LuxAlgo. () The traditional bar chart is replaced with full-width bars that are brighter for high volume price levels.
Like a traditional VP, its purpose is to visualize how volume corresponds to specific price levels, allowing you to get a quick idea of where the most activity is occurring, and where it hasn't been. This information may provide clues as to where price action may return, areas of support and resistance , and regions where price may move quickly. The basic concepts behind any Volume Profile (or Price by Volume Chart) should apply here as well. (investopedia article)
Inputs are set up such that you can customize the lookback period, number of rows, and width of rows for most major timeframes individually. Timeframes between those available will use the next lower timeframe settings (e.g., 2m chart will use the 1m settings.)
This indicator is experimental and is likely to receive further updates.

Volume Profile [LuxAlgo]Displays the estimate of a volume profile, with the option to show a rolling POC (point of control). Users can change the lookback, row size, and various visual aspects of the volume profile.
Settings
Basic:
Lookback: Number of most recent bars to use for the calculation of the volume profile
Row Size: Determines the number of rows used for the calculation of the volume profile
Show Rolling POC: Determines whether to display the rolling POC of the volume profile
Style:
Width (% of the box): Determines the length of the bars relative to the Lookback value
Bar Width: Width of each bar
Flip Histogram: Flips the histogram, when enabled, the histogram base will be located at the most recent candle
Gradient: Allows to color the volume profile bars with a gradient, with a color intensity determined by the length of each bar
Rows Solid Color: Color of each bar when 'Gradient' is disabled
POC Solid Color: Color of the POC when 'Gradient' is disabled
Usage
It is very common to display volume over time in order to visualize the trading activity made over a specific candle, however this is not the only way to display volume and it can be interesting to put it in relation with the price, which is what volume profiles do.
Volume profiles are displayed as price relative histograms showing the accumulated volume within certain price areas, the number of areas are determined by the row size of the volume profile. Knowing which price's area accumulated the most volume allow highlighting areas of interest to market participants.
Most accumulated volume will be encountered in zones of equilibrium between buyers and sellers; that is zones of local price stationarity. These zones are highlighted by high volume nodes in the volume profile. Imbalance between buyers and sellers are highlighted by thinner zones of the volume profile.
The price level with the most accumulated volume is highlighted by the "point of control" (POC), displayed by the dotted line in the indicator.
The POC is often considered an important level, commonly used as support/resistance by traders. One can verify the accuracy of this use case by using the rolling POC (assuming one would use the POC over time as SR).
Indicator Limitations
Volume profiles are calculated using tick data, which is not the case of this estimate, as such you won't have an accurate representation of an actual volume profile.
The rolling POC can introduce time outs in the script computation, use lower lookback and row size value to display it.

Volume Multi Time FrameHi All,
This script shows total volume info of Higher Time Frame. it checks open/close prices of higher time frame and sets the color. it also show a dynamic line on last volume , so you can see when HTF candle started and ended. by looking at the color of volume columns you can see HTF candle is green or red. it's something like weis wave volume that is using HTF candles.
Higher time frame is set automatically, you can set it manually by choosing "User-defined" in the indicator options and choose higher time frame as you want
Here some examples:
Current time freame is 1min and htf is 1hour
Current time freame is 1min and htf is 1day
Enjoy!

Volume MAs Cloud Trend | Lyro RSVolume MAs Cloud Trend is a volume-weighted trend-following indicator designed to identify market direction, momentum strength, and dynamic trade management directly on price. By combining volume-adjusted moving averages, adaptive deviation bands, and an integrated ATR trailing stop, it delivers clear visual trend structure and actionable signals in a single overlay.
Key Features
Volume-Adjusted Moving Average
Uses a normalized formula: (Price × Volume) MA ÷ Volume MA, ensuring high-participation price moves carry greater influence. Supports 16+ MA types, with VWMA handled natively.
Deviation Band Cloud
Upper and lower bands are built from standard deviation over the MA length, scaled by independent positive and negative multipliers to adapt to volatility.
Cloud & Trail Modes
Cloud Mode visualizes trend structure using a filled band cloud.
Trail Mode switches to an ATR-based trailing stop for trend management.
Automatic Trend Signals
Bullish signals trigger when price crosses above the positive band.
Bearish signals trigger when price crosses below the negative band.
ATR Trailing Stop (Built-In)
A volatility-adjusted trailing stop initializes on each new trend and updates only in the trade direction, helping lock in gains while staying with the trend.
Custom Visuals & Palettes
Choose from Classic, Mystic, Accented, or Royal palettes, or define your own bullish and bearish colors. Includes MA glow, trend cloud fill, and trend-colored candles.
How It Works
MA Construction
Applies the selected moving average to volume-weighted price (or VWMA when selected) to create a participation-aware trend baseline.
Band Calculation
Calculates rolling standard deviation and offsets it using user-defined multipliers to form adaptive upper and lower trend bands.
Trend Detection
Crosses above the upper band confirm bullish momentum.
Crosses below the lower band confirm bearish momentum.
Trailing Stop Logic
On each new trend signal, an ATR-based trailing stop is initialized and dynamically updated in the trend direction.
Visual Synchronization
MA, cloud, trailing stop, and candles all change color in real time to reflect the current trend state.
Practical Use
Trend Confirmation
Sustained price action outside the cloud indicates strong directional momentum.
Breakout Identification
Band crosses highlight potential trend starts, especially when aligned with volatility expansion.
Trade Management
Trail Mode provides objective, volatility-based exits for trend-following strategies.
Quick Market Scanning
Color-coded candles and cloud structure allow fast visual assessment across multiple symbols and timeframes.
Customization
Adjust MA type and length to control responsiveness
Tune band multipliers for volatility sensitivity
Switch between Cloud and Trail modes depending on strategy
Customize color schemes to match your chart layout
⚠️ Disclaimer
This indicator is intended for technical analysis and educational purposes only. It does not guarantee results and should be used alongside proper risk management and additional analysis. The creator is not responsible for any financial decisions made using this tool.

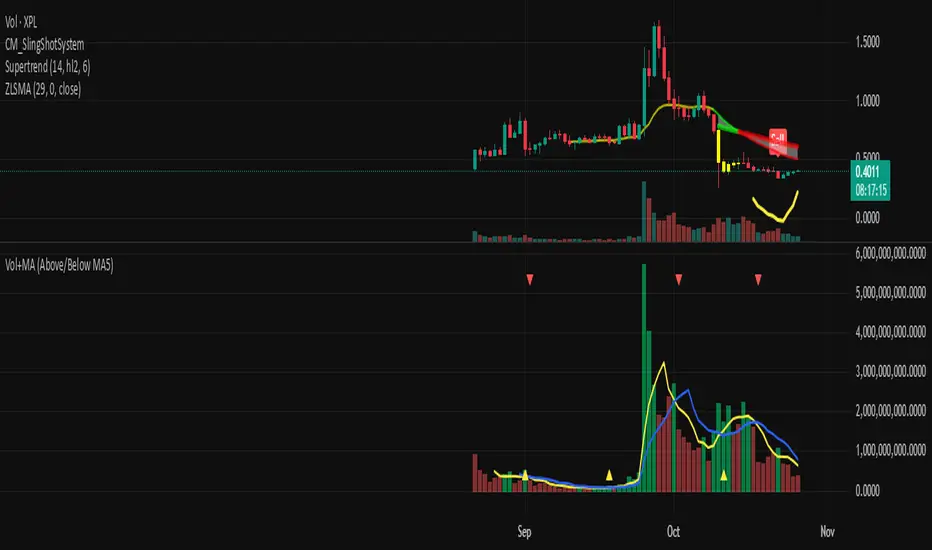
Volume + MA5 & MA10This Volume + MA5 & MA10 (Technical Volume Trend Analysis)
The Volume + MA5 & MA10 indicator provides a precise view of market participation and volume momentum by combining raw volume data with two moving averages (MA5 and MA10). It’s designed for traders who rely on volume-based confirmation to validate price movements, breakouts, and trend reversals.
🔍 Overview
This indicator displays volume bars alongside two smooth volume averages — MA5 (short-term) and MA10 (medium-term) — making it easier to detect shifts in market activity.
When the short-term average crosses above or below the long-term average, it signals a potential change in trading intensity or market sentiment.
⚙️ Key Features
Dual Volume Moving Averages (MA5 & MA10) for short- and medium-term analysis.
Dynamic Bar Coloring based on whether current volume exceeds MA5 or MA10.
Crossover Detection with visual markers for MA5/MA10 intersections.
Alert Conditions to notify you of significant volume trend shifts.
Fully customizable appearance and smoothing options.
📊 How to Interpret
MA5 > MA10 → Increasing short-term volume activity (strengthening momentum).
MA5 < MA10 → Decreasing short-term volume (weakening participation).
Rising volume with price → Confirms trend strength.
Falling volume with rising/falling price → Suggests potential reversal or reduced conviction.
💡 Applications
Confirm breakouts and trend continuations.
Identify momentum divergences between price and volume.
Filter out low-volume or weak-trend setups.
Combine with RSI, MACD, or moving averages for enhanced signal validation.
✅ Advantages
Simple yet powerful structure for clean visual analysis.
Works across all timeframes and markets (crypto, stocks, forex, indices).
No repainting — reliable for both live and historical backtesting.
Use Volume + MA5 & MA10 to strengthen your technical analysis and gain a deeper understanding of how market participation drives price trends.
Volume % of Diluted Shares OutstandingIndicator does what it says - shows the volume traded per time frame as percentage of shares outstanding.
There are three scaling modes, see below.
Absolute (0–100%+) → The line values are the true % of diluted shares traded.
If the plot is at 12, that means 12% of all diluted shares traded that day.
Auto-range (absolute) → The line values are still the true % of shares traded (the y-axis is in real percentages).
But the reference lines (25/50/75/100) are not literal percentages anymore; they are markers at fractions of the local min-to-max range.
So your blue bars are real (e.g., 12% really is 12%), but the dotted lines are relative.
Normalize to 100 → The line values are not the true % anymore.
Everything is re-expressed as a fraction of the recent maximum, so 100 = “highest in the lookback window,” not “100% of shares.”
If the true max was 30% of shares traded, and today is 15%, then the plot will show 50 (because 15 is half of 30).

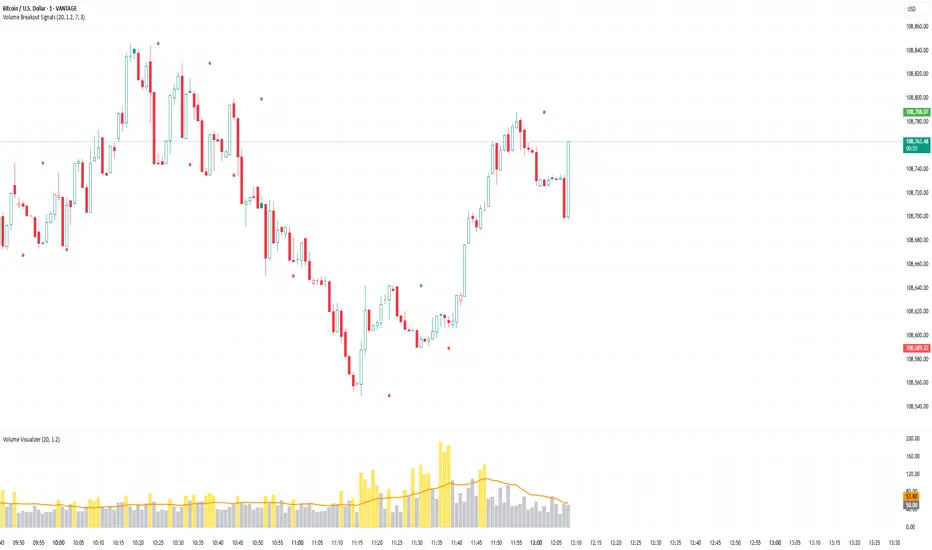
Volume Breakout SignalsScript by Hanssome
The Volume Breakout Signals indicator is a trading tool designed to identify potential entry points by pinpointing high-momentum price breakouts on your main chart. It operates on a simple but powerful principle: a true breakout should be supported by a significant increase in trading volume.
The indicator plots two primary visual elements on your price chart:
Pivot Highs and Lows: These are marked with green and red circles and represent the most recent significant swing points in the price. They act as dynamic support and resistance levels, and the script watches for the price to break past them.
BUY and SELL Labels: These signals appear directly on the chart to indicate a potential trading opportunity.
A signal is only generated when two specific conditions are met simultaneously:
Price Breakout: A BUY signal requires the price to cross decisively above the most recent pivot high. A SELL signal requires the price to cross below the most recent pivot low.
Volume Confirmation: This price breakout must be accompanied by a recent spike in trading volume. This confirmation suggests strong momentum and conviction behind the move, increasing the probability of a successful breakout.
All the parameters, such as the sensitivity of the pivot points and the definition of a volume spike, can be adjusted in the indicator's settings to fit your specific trading style and the asset you are viewing.
Volume Momentum [BackQuant]Volume Momentum
The Volume Momentum indicator is designed to help traders identify shifts in market momentum based on volume data. By analyzing the relative volume momentum, this indicator provides insights into whether the market is gaining strength (uptrend) or losing momentum (downtrend). The strategy uses a combination of percentile-based volume normalization, weighted moving averages (WMA), and exponential moving averages (EMA) to assess volume trends.
The system focuses on the relationship between price and volume, utilizing normalized volume data to highlight key market changes. This approach allows traders to focus on volume-driven price movements, helping them to capture momentum shifts early.
Key Features
1. Volume Normalization and Percentile Calculation:
The signed volume (positive when the close is higher than the open, negative when the close is lower) is normalized against the rolling average volume. This normalized volume is then subjected to a percentile interpolation, allowing for a robust statistical measure of how the current volume compares to historical data. The percentile level is customizable, with 50 representing the median.
2. Weighted and Smoothed Moving Averages for Trend Detection:
The normalized volume is smoothed using weighted moving averages (WMA) and exponential moving averages (EMA). These smoothing techniques help eliminate noise, providing a clearer view of the underlying momentum. The WMA filters out short-term fluctuations, while the EMA ensures that the most recent data points have a higher weight, making the system more responsive to current market conditions.
3. Trend Reversal Detection:
The indicator detects momentum shifts by evaluating whether the volume momentum crosses above or below zero. A positive volume momentum indicates a potential uptrend, while a negative momentum suggests a possible downtrend. These trend reversals are identified through crossover and crossunder conditions, triggering alerts when significant changes occur.
4. Dynamic Trend Background and Bar Coloring:
The script offers customizable background coloring based on the trend direction. When volume momentum is positive, the background is colored green, indicating a bullish trend. When volume momentum is negative, the background is colored red, signaling a bearish trend. Additionally, the bars themselves can be colored based on the trend, further helping traders quickly visualize market momentum.
5. Alerts for Momentum Shifts:
The system provides real-time alerts for traders to monitor when volume momentum crosses a critical threshold (zero), signaling a trend reversal. The alerts notify traders when the market momentum turns bullish or bearish, assisting them in making timely decisions.
6. Customizable Parameters for Flexible Usage:
Users can fine-tune the behavior of the indicator by adjusting various parameters:
Volume Rolling Mean: The period used to calculate the average volume for normalization.
Percentile Interpolation Length: Defines the range over which the percentile is calculated.
Percentile Level: Determines the percentile threshold (e.g., 50 for the median).
WMA and Smoothing Periods: Control the smoothing and response time of the indicator.
7. Trend Background Visualization and Trend-Based Bar Coloring:
The background fill is shaded according to whether the volume momentum is positive or negative, providing a visual cue to indicate market strength. Additionally, bars can be color-coded to highlight the trend, making it easier to see the trend’s direction without needing to analyze numerical data manually.
8. Note on Mean-Reversion Strategy:
If you take the inverse of the signals, this indicator can be adapted for a mean-reversion strategy. Instead of following the trend, the strategy would involve buying assets that are underperforming and selling assets that are overperforming, based on volume momentum. However, it’s important to note that this approach may not work effectively on highly correlated assets, as their price movements may be too similar, reducing the effectiveness of the mean-reversion strategy.
Final Thoughts
The Volume Momentum indicator offers a comprehensive approach to analyzing volume-based momentum shifts in the market. By using volume normalization, percentile interpolation, and smoothed moving averages, this system helps identify the strength and direction of market trends. Whether used for trend-following or adapted for mean-reversion, this tool provides traders with actionable insights into the market’s volume-driven movements, improving decision-making and portfolio management.

Volume Delta Candles [LuxAlgo]Volume Delta Candles provides insights about Intrabar trading activity in an easy-to-interpret manner. Lower timeframe or real-time data is used for displaying Volume Delta percentage against the total volume as a coloured bar part.
The script also highlights the intrabar price with the maximum trading activity, as well as complementary information.
🔶 USAGE
The tool focuses on intrabar volume to provide more information about the trading activity associated with a candle, without having to use an external volume indicator.
Each indicator components is further explained below:
🔹 Volume Delta
The volume delta is obtained by the difference between buy volume and sell volume, where buy volume is the volume associated with a bullish intrabar candle, and sell volume with a bearish intrabar candle.
Positive volume delta is displayed with a green candle area, while negative delta is displayed with a red candle area.
🔹 Bar Coloring
The script displays VD as a percentage of the whole, or from the candle half, depending on the setting ' Display '.
Bars can be coloured as follows:
Full (100%) when Display is set at ' Full Bar '
Half (50% or 100% of half a bar) when Display is set at ' Half Bar '
A negative VD (more bearish than bullish volume) will fill the bar from the top (or centre) of the bar towards the bottom, and a positive VD will fill a bar from the bottom (or centre) of the bar towards the top.
A negative VD on a green candle will show a red-coloured VD against a green-bordered candle. On the other hand, a positive VD on a red candle will show a green-coloured VD against a red-bordered candle.
Colours for VD sentiment opposite to the candle sentiment can be set differently if desired.
🔹 Highest Volume Price Level
The script displays a white (black on light mode) line highlighting the intrabar price level with the highest volume.
When ' Show Previous Max Volume Price ' is checked, a white (black on light mode) dot is displayed 1 bar to the right.
🔶 DETAILS
🔹 Tick/LTF data
The above example used Lower TimeFrame (LTF) data.
The following example uses real-time tick data ( Settings -> Data From )
Both options, LTF or tick data, will show a vertical dotted line where the data starts.
🔹 LTF settings
When ' Data from ' LTF is chosen and ' Auto ' enabled, the LTF will be the nearest possible x times smaller TF than the current TF. When 'Premium' is disabled, the minimum TF will always be 1 minute to ensure TradingView plans lower than Premium don't get an error.
Examples with current Daily TF (when Premium is enabled):
500 : 3 minute LTF
1500 (default): 1 minute LTF
5000: 30 seconds LTF (1 minute if Premium is disabled)
🔹 Notes
Different LTFs give different data, which means different results; this doesn't mean it isn't correct; they are just different data sets.
(LTF is displayed at the top right corner)
To ensure maximum visibility of values, we recommend using Bars from the Bar's style menu.
🔶 SETTINGS
Data from: Lower TimeFrame or real-time Tick data
Resolution: LTF setting
Auto + multiple: Adjusts the initial set resolution
Premium: Enable when your TradingView plan is Premium or higher
🔹 Intrabar Data
Colours
Display: Full/Half bar
Show previous max volume price: White/black dot, showing previous highest volume price level
🔹 Table
Show TF: Show LTF at the top right corner
Colour + table text size
🔹 Details
Show details: label with 'Volume', 'Delta' (VD) and '%'
See USAGE for more information

Volume Oscillators Focus IndicatorVolume Oscillators Focus Indicator
Short name VolumeFocus
This indicator seeks to show episodes of high and low volumes analyzing these by calculating three lines and create colorings on the basis of where these lines go relative to each other.
The first line is a percent based on the current volume level, for which a 3 period sma is taken.
It is calculated by using the lowest volume in the lookback as zero, the highest as 100 percent
This line is called “current volume level”
The second line is a percent, based on the median volume of the last five periods. This line is called “new normal volume”
The third line is a percent, based on the median volume of the lookback period. This is called “old normal volume”
For the second and third line the lowest “new normal volume” in the lookback is used as zero while the 100 percent level is the same as in the calculation of the first line.
The reasoning for the colors is as follows:
When both current en new normal level are below old normal, the volume is to be considered ‘low’. When volume is low, the background color is gray and the fill color between the old normal and current lines is navy.
When both current and new normal level are above old normal, the volume is to be considered ‘significantly expanded’. When this happens the fill color between current and old normal is orange.
When volume is not low it is considered normal or high and the background color is green.
The lookback is set to 50, it advise to keep it that way.
Use of the indicator.
Volume results from focus of the market on the instrument. When the price seems correct, some buy it, some sell it but most don’t care. Then the volume is low, the background is gray. The navy fill color indicates ‘how low’.
When the price seems off, many will care and start trading. Then volume is high, background is green. When the trading is really heating up the orange fill color appears, showing that the market has high focus on this instrument, perhaps move in a trend.
Of course we don’t know in which way the market tries to ‘correct’ the price, for that purpose I use this indicator together with REVE Cohorts which provide useful markers to explain what the excess volume means.
Eykpunter

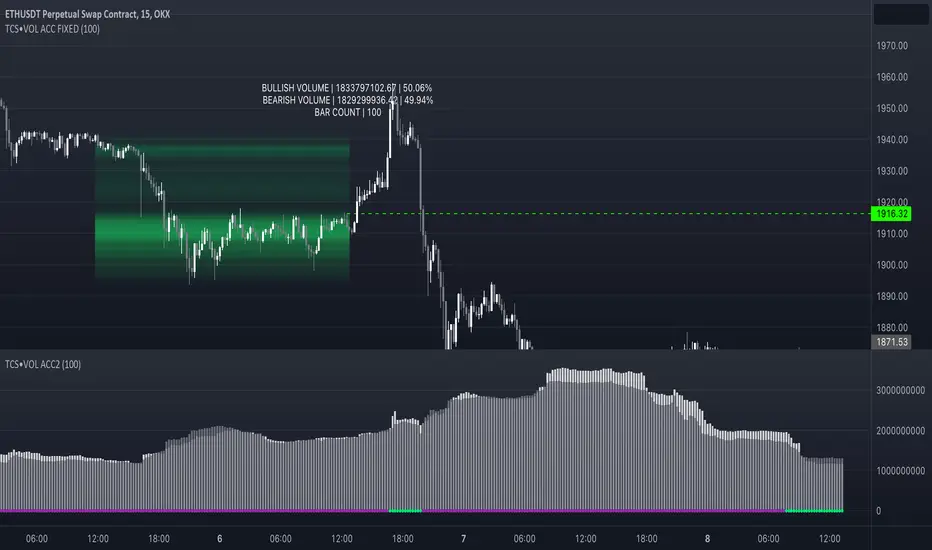
Volume accumulation on past range [TCS] | VTAThe indicator calculates buy and sell volume values for different look-back periods based on the high, low, close, and tick volume data of the chart.
The range can be selected by adding the end date and the look-back period, which starts from the end date. It can calculate a maximum of 100 candlesticks.
The calculated buy and sell volume values are stored in separate variables, representing cumulative volume values over their respective look-back periods. It's important to note that the provided code calculates the buy and sell volume values individually for each look-back period and then sums them.
This information can be useful in understanding who is in control of the market during the selected range. The 'heatmap' is particularly helpful in identifying areas of high or low trading activity, which can help define support and resistance levels.
For example, if there is a greater accumulation of bullish volume than bearish volume and a break occurs in a resistance area, it may present a good entry opportunity.
Please note that this indicator is for educational purposes only and should not be used for trading without further testing and analysis.
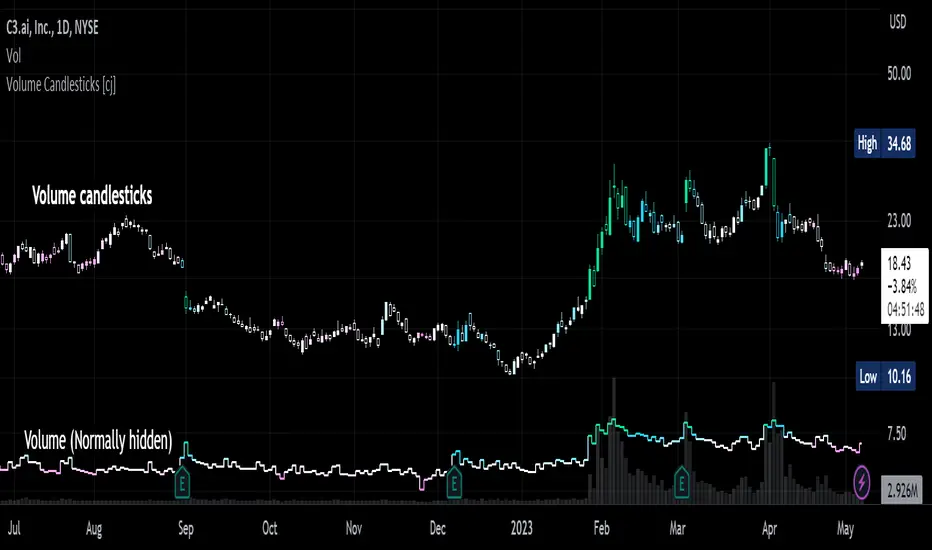
Volume Candlesticks [cajole]
This script lets you create the equivalent of "volume candlesticks" in TradingView.
"Volume candlesticks" normally vary their width according to the bar's volume. This script varies COLOUR instead of WIDTH.
Bar charts are also supported.
Candles/Bars are coloured by their distance from the average volume. You can also add a "huge volume" colour to further highlight the most extremely-high volume bars.
Note that volume is extrapolated for incomplete bars by default. So, if the average volume of the past 10 days is 5M shares, and 5M shares trade in the first 10% of today's session, that bar will be coloured as though 50M shares have traded. Set the "Extrapolate" option to 1.0 to disable this.
For this script to work properly, you should set TradingView's default candle/bar colours to be at least 20% transparent. By default, TradingView tends to overlay its own bars on top of indicators.
Nerdy details:
The script works best on a dark background, because it is easier to change the hue of white bars than of black bars. If you find a set of colours that work for white backgrounds, please comment with them!
The geometric mean is used instead of the arithmetic mean, to keep the 'average' from being strongly influenced by spikes. Bars are
then coloured by assuming a normal probability distribution and highlighting outliers. (This means that the first high-volume bars are coloured differently to later ones.)
Volume-Weighted Closing Range (TG Fork)Volume-weighted closing range of each bar. Closing range is (high - close) relative to the length of the wick (high - low). A close at the top of the wick would be 100%, middle 50%, bottom 0%. This is then multiplied by volume to weight towards high volume bars.
A moving average is applied to visualize trend in volume-weighted closing range over time.
Options include changing the threshold of bullish closes. The default is 50%, but you can view a close above 40% as a bullish .
How to use:
Columns indicate per-bar closing range, and can be used as either a buying-selling pressure indicator, or as an overreaction detector (eg, bars that are abnormally big can be used to start a fading/contrarian trade next bars). Green means the bar closed in the upper range, red in the lower range.
The cloud is the moving average over several bars (by default using EMA). This tends to represent sentiment over a period of time, and hence trend/momentum. Can be used in any timescale, even on weekly, then this represents the market cycles.
If you like this indicator, please show the original author your appreciation:

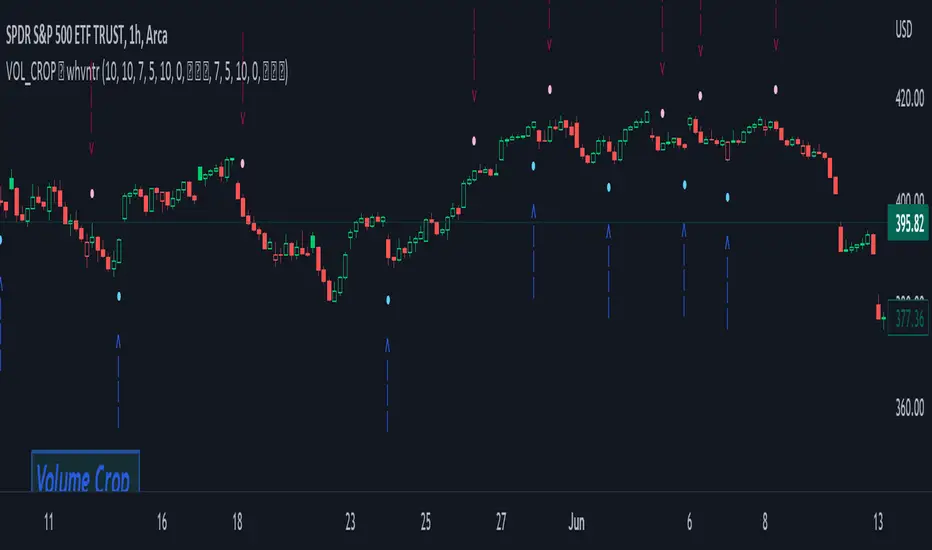
Volume Crop ━ Hidden Volume Divergence [whvntr] Volume Divergence
• Formula originated from: "Hidden Price Divergence" (circles) by TheLark. I did two things to harness its
effectiveness:
• Firstly, I developed a unique way to filter out the divergence signals that were appearing on both sides of the
midline. This filter will be known as the "Midline Tool" . It filters out a lot of the false signals commonly
associated with oscillators.
• Then, I modified the default format from Price to Volume.
• The midline formula "Midline Tool" was developed by me . It adjusts in the thousands since it's volume.
Let me know in the comments if you would rater have a smaller step value than 10,000. How does it work?
Crossover then Crossunder, the arrows only appear during the first sign of hidden volume divergence once
crossing the midline. Normally, these signs appear on both side of the midline both bearish and bullish no
matter if it's on an oversold or overbought side of the spectrum... Also, let
me know in the comments if you would like for me to release an oscillator version of this
indicator for co-witnessing.
Features:
• Volume divergence
• Midline Tool©
• Disclaimer: This indicator does not constitute investment advice. Trade at your own risk with the investments
you can afford to lose because all financial investments have risks and this is not a
guarantee that the volume divergence will be 100% all the time.
Volume Density w/barcolorOpacity limit set to 70 min & barcolor overlay
The transparency of each candle is based on volume density.
Volume density is calculated as follows.
Volume density = Volume / Price range
Price range uses true range "max(high - low, abs(high - close), abs(low - close))".
Since volume density varies drastically by stock or time, the transparency is calculated based on the deviation rate from the average volume density.
Volume Price Change RatioMessing around with this two point selecting ability I recently learned about from Tradingview's CAGR. Here is a script that will tell you changes in volume(obv)/price, volume to price change ratio, and the average volume to price change ratio for the length you define in the settings menu. You can use this to compare the ratio of a current pump to an older pump to help assess the strength of a movement. Enjoy!

Volume In USDDisplay volume in fiat base currency so that we can compare symbols in a list to find healthy one to trade.
Add a label so that we can see the latest volume number easier on mobile phone.


Volume Cloud [LucF]A strictly volume-based cloud. It plots current volume (green line) over its 20-period linear regression (red line) on the chart. Unlike Ichimoku's cloud, it is not offset. While probably not something that you would have on your charts all the time, it can provide a useful way to study the interaction between price and volume.
Because the green line is the current volume, you can forego volume columns when using the indicator.
Volume Cloud does have practical uses. I will show here how I use volume to help me in selecting better probability entries, with only Volume Cloud and my TLD indicator on the chart (the Volume Columns are there to provide context for first-time users of the Volume Cloud).
When looking for entries, I’m trying to find spots where a reversal from a bottom or a continuation after a pause is confirmed by increasing volume (preferably above average) candles with proper wick/body structure. The candle structure of increasing volume candles is important because for me, it provides granularity on the volume action during the candle. I view wicks as failed tests and body height as reinforcement of the price movement. As for candles where volume is not increasing, I mostly ignore them. This is a simplified account of my mindset; just the stories I trade with and that I believe provide an edge—and profits. I certainly don’t pretend having found an infallible way to trade, and there is much more to it that I can explain here, but let’s look at a chart.
Point 1: Solid increasing volume and above average down candle, but I don’t enter on big candles. The volume on that candle has reached a new high though, so I’m thinking bearish sentiment for the next bars.
Point 2: Nicely formed above average increasing volume candle, but I’m looking to short. A similar’ish candle 4 bars back was followed by non-descript action. After 2, a test of past resistance fails before reaching it and a lower low and then a lower high bring us to point 3.
Point 3: Exactly what I’m looking for. No upper wick, solid body that’s not too big, and the highest volume reached on chart yet as a bonus. I enter on the following candle and because of the solid context, I can use a tight stop at the previous candle’s high. Going down, I will move my stop to the high of any increasing volume candle going in my direction, starting when that point is at least as far from my entry as my stop (RR=1).
Point 4: This is the last point where I move my stop at the candle’s high and get stopped out at the following candle for a RR=3.75 trade. Notice how the very high volume at point 4 generates a relatively small body. This is often a sign of stopping volume that portends a reversal or a pause.
Point 5: A first above average increasing volume candle, but with longish wicks that don’t fit my idea of a solid candle. Definitely not a strong enough sign to bet on a reversal from the recent strong descent.
Point 6: This candle is a different story altogether. No lower wick, reasonably sized body, double the volume of previous candle and a close way above the previous 20 candles. Long entry with stop at candle 6’s low. I don’t move my stop on the candle following my entry because it wouldn’t put me at RR=1, so the first time I move my stop up is at candle just before point 7.
Point 7: I get stopped out for RR=3 after that candle because I will have moved my stop a second time, at candle’s 7 low.
I didn’t make these trades (can’t even short on Binance yet), and while this is a typical a posteriori story, it does reflect what I do in reality.

Volume Edge Pro[wjdtks255]Volume Edge Pro: Indicator Description
Volume Edge Pro is an advanced volume analysis tool designed to identify institutional accumulation and significant supply levels. Unlike standard volume bars, this indicator categorizes trading volume into four distinct types based on price action and historical comparisons, helping traders spot high-probability breakout opportunities.
Key Components:
Blue Bars (PPV - Pocket Pivot Volume): Indicates institutional accumulation. It appears when up-day volume exceeds the highest down-day volume of the last 10 trading sessions.
Green Bars (RGV - Recent Green Volume): Represents strong buying pressure where up-day volume is higher than the 50-period moving average.
Red Bars (RRV - Recent Red Volume): Signifies heavy supply or selling pressure where down-day volume is higher than the 50-period moving average.
Grey Bars: Represents standard market volume without significant institutional involvement.
Trading Strategy (How to Trade)
1. Identifying Accumulation (The Base)
Look for multiple Blue Bars (PPV) during a consolidation phase or within a "base." This suggests that "Smart Money" is quietly accumulating shares without significantly driving up the price yet.
2. The Buy Signal
The ideal entry point is when the price breaks out of a consolidation resistance level, especially when the breakout is confirmed by a Blue (PPV) or Green (RGV) bar. The presence of PPV signals within the base increases the reliability of the breakout.
3. Overcoming Supply (The RRV Rule)
When a Red Bar (RRV) appears, it marks a level of "unconsumed supply."
Treat the high of the RRV candle as a resistance level.
A bullish reversal or continuation is confirmed only when the price reclaims the high of the RRV day or when subsequent PPVs/RGVs overwhelm the previous selling volume.
4. Risk Management
If a massive Red Bar (RRV) appears after a long uptrend and the price breaks below the prior support, it may indicate institutional distribution (selling), signaling a time to exit or tighten stop-losses.

Volume DeltaThis indicator provides a detailed view of Volume Delta (VD) by analyzing order flow on a lower, intra-bar timeframe. For each bar on the chart, it calculates the net difference between buying and selling volume based on the direction of the intra-bar candles.
Key Features:
Intra-Bar Delta Calculation: The indicator analyzes price action on a user-defined lower timeframe ('Intra-Bar Timeframe') to construct a detailed picture of the underlying order flow for each bar on the main chart.
"Delta Candle" Visualization: The delta for each bar is shown as a candle, where:
Open: Always starts at the zero line.
High/Low: Represent the peak buying and selling pressure accumulated within the bar.
Close: The final net delta value for that bar. This visualization shows absorption, exhaustion, and conviction in a single glance.
Customizable Moving Average: An optional moving average of the net delta (Close) can be added. The MA type, length, and an optional Volume weighted setting are customizable.
Intra-Bar Peak Pivot Detection: Automatically identifies and plots significant turning points (pivots) in the peak buying (High) and selling (Low) pressure.
Note on Confirmation (Lag): Pivot signals are confirmed using a lookback method. A pivot is only plotted after the Pivot Right Bars input has passed, which introduces an inherent lag.
Multi-Timeframe (MTF) Capability:
MTF Output: The entire analysis (Delta Candles, MA, Pivots) can be calculated on a higher timeframe (using the Timeframe input), with standard options to handle gaps (Fill Gaps) and prevent repainting (Wait for...).
Limitation: The Pivot detection (Calculate Pivots) is disabled if a Higher Timeframe (HTF) is selected.
Integrated Alerts: Includes 8 alerts for:
The net delta crossing its moving average.
The detection of new peak buying or selling pivots.
Conditions of agreement or disagreement between the net delta and the main bar's direction (absolute volume).
Caution: Real-Time Data Behavior (Intra-Bar Repainting) This indicator uses high-resolution intra-bar data. As a result, the values on the current, unclosed bar (the real-time bar) will update dynamically as new intra-bar data arrives. This behavior is normal and necessary for this type of analysis. Signals should only be considered final after the main chart bar has closed.
DISCLAIMER
For Informational/Educational Use Only: This indicator is provided for informational and educational purposes only. It does not constitute financial, investment, or trading advice, nor is it a recommendation to buy or sell any asset.
Use at Your Own Risk: All trading decisions you make based on the information or signals generated by this indicator are made solely at your own risk.
No Guarantee of Performance: Past performance is not an indicator of future results. The author makes no guarantee regarding the accuracy of the signals or future profitability.
No Liability: The author shall not be held liable for any financial losses or damages incurred directly or indirectly from the use of this indicator.
Signals Are Not Recommendations: The alerts and visual signals (e.g., crossovers) generated by this tool are not direct recommendations to buy or sell. They are technical observations for your own analysis and consideration.

Volume Profile Auto POC📌 Overview
Volume Profile Auto POC is a trend-following strategy that uses the automatically calculated Point of Control (POC) from the volume profile, combined with ATR zones, to capture reversals and breakouts.
By basing decisions on volume concentration, it dynamically visualizes the price levels most watched by market participants.
⚠️ This strategy is provided for educational and research purposes only.
Past performance does not guarantee future results.
🎯 Strategy Objectives
Automatically detect the volume concentration area (POC) to improve entry accuracy
Optimize risk management through ATR-based volatility adjustment
Provide early and consistent signals when trends emerge
✨ Key Features
Automatic POC Detection : Updates the volume profile over a defined lookback window in real time
ATR Zone Integration : Defines a POC ± 0.5 ATR zone to clarify potential reversals/breakouts
Visual Support : Plots the POC line and zones on the chart for intuitive decision-making
📊 Trading Rules
Long Entry:
Price breaks above the POC + 0.5 ATR zone
Volume is above average to support the breakout
Short Entry:
Price breaks below the POC - 0.5 ATR zone
Volume is above average to support the downside move
Exit (or Reverse Position):
Price returns to the POC area
Or touches the ATR band
⚙️ Trading Parameters & Considerations
Indicator Name: Volume Profile Auto POC
Parameters:
Lookback Bars: 50
Bins for Volume Profile: 24
ATR Length: 14
ATR Multiplier: 2.0
🖼 Visual Support
POC line plotted in red
POC ± 0.5 ATR zone displayed as a semi-transparent box
ATR bands plotted in blue for confirmation
🔧 Strategy Improvements & Uniqueness
This strategy is inspired by traditional Volume Profile + ATR analysis,
while adding the improvement of a sliding-window mechanism for automatic POC updates.
Compared with conventional trend-following approaches,
its strength lies in combining both price and volume perspectives for decision-making.
✅ Summary
Volume Profile Auto POC automatically extracts key market levels (POC) and combines them with ATR-based zones,
providing a responsive trend-following method.
It balances clarity with practicality, aiming for both usability and reproducibility.
⚠️ This strategy is based on historical data and does not guarantee future profits.
Always use proper risk management when applying it.
