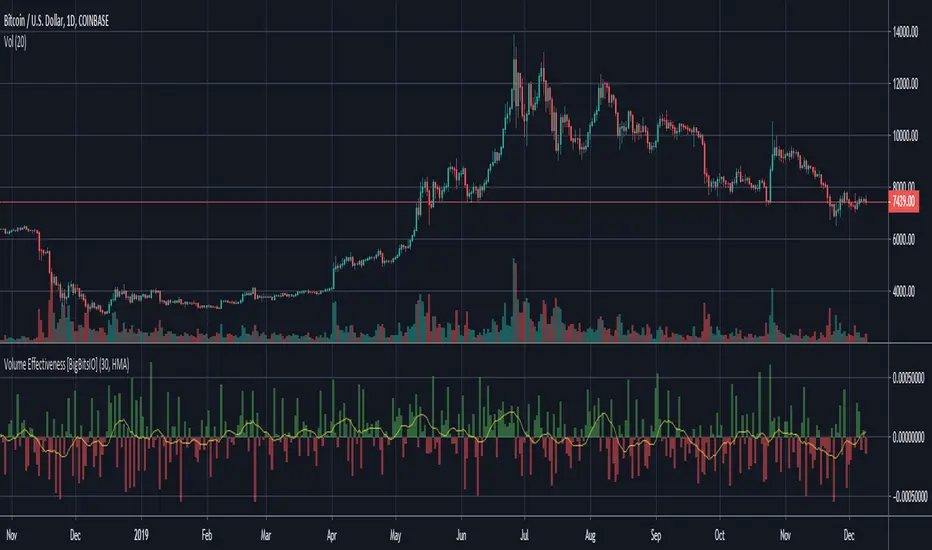
Volume Effectiveness [BigBitsIO]This Volume Effectiveness indicator is designed to allow users to try and identify how effective volume is on each candle, and smoothing those values over time to try to find trends.
Volume Effectiveness is the % change in price for each single unit of volume on the associated candle. The value can be positive or negative, but there is an option to just monitor an absolute value.
Features:
- Volume Effectiveness
- Toggle if Volume Effectiveness should be an absolute value
- Toggle visibility of bars
- Smoothed moving average of Volume Effectiveness
- Adjustable period on the smoothed moving average
- Several moving average types available to use for the smoothed moving average
- Toggle visibility of smoothed moving average
Cari dalam skrip untuk "volume"
Volume, Relative Volume HighlightThe indicator plots regular volume bars.
The highlight is given by the current cumulative volume for the day, compared to a custom average (standard 20 periods). The stronger the color, the higher the relative volume is. Stocks moving of higher relative volume have higher chances of making predictable moves.

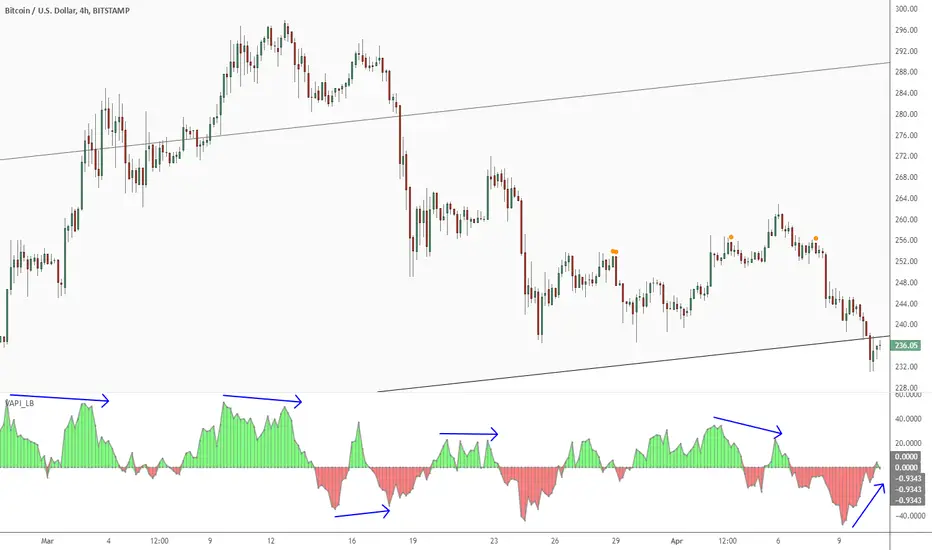
Volume Accumulation Percentage Indicator [LazyBear]Volume Accumulation Percentage Indicator (VAPI) is a variation of the classic volume-accumulation indicators. It uses volume the same way as OBV except that it assigns volume weights based on intraday volatility.
In a positive trend, if the stock price is close to a (local) new high, the VAPI should be at its maximum as well (and vice versa for a negative trend). If the market is looking for a direction, if the price is in the bottom side of his current trading range and if, at the same moment the VAPI osc slopes up, there is accumulation on the stock and that the prices should start to climb. The SELL signal is given when the VAPI decreases (distribution). Divergences are usually very effective too.
Tuning the "length" parameter may be needed for your instrument (default is 10), do let me know if you find a different value to be optimal for majority of instruments.
List of my public indicators: bit.ly
List of my app-store indicators: blog.tradingview.com
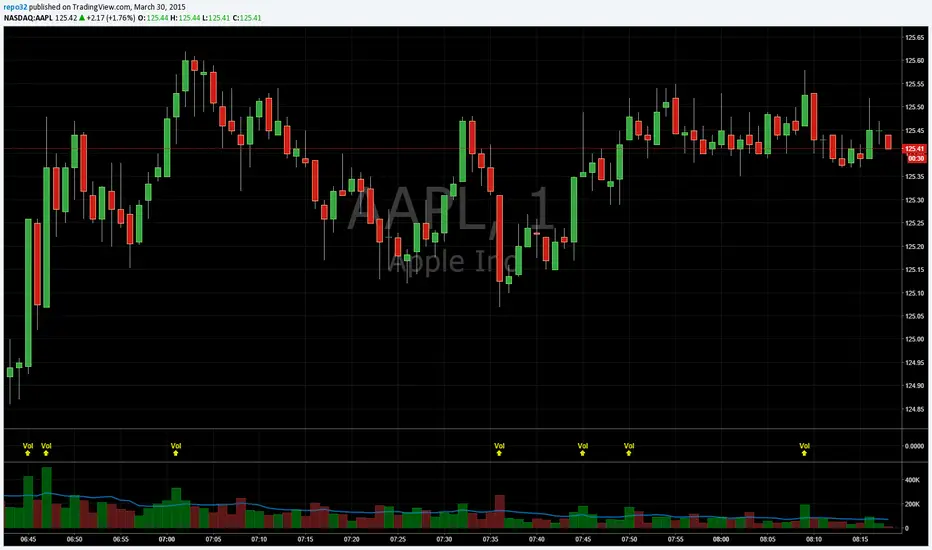
Volume BombI am republishing to use a clean chart. Previous one had too much of a mess. Idea for TradingView: Please allow us to change out the charts after publishing.
I like to know when volume spikes (only when it spikes). I am not interested in seeing the rest of the volume bars. I created this indicator to show me when it explodes (i.e. the name "Volume Bomb" , plus it sounds cool).
This indicator only shows you when volume exceeds the EMA of volume by whatever multiplier you set.
Default settings are the current volume with 10 EMA. Yellow arrowup will appear when volume is at 1.5x the 10 EMA.
Adjust it to your liking and particular stock.
Volume BombI like to know when volume spikes (only when it spikes). I am not interested in seeing the rest of the volume bars. I created this indicator to show me when it explodes (i.e. the name "Volume Bomb" , plus it sounds cool).
This indicator only shows you when volume exceeds the EMA of volume by whatever multiplier you set.
Default settings are the current volume with 10 EMA. Yellow arrowup will appear when volume is at 1.5x the 10 EMA.
Adjust it to your liking and particular stock.

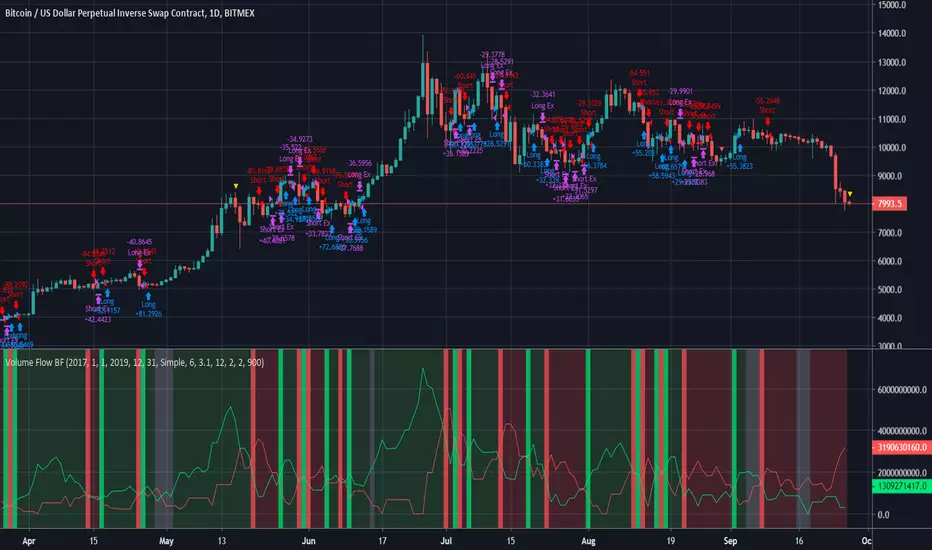
Volume Flow BFBased on code by oh92 and kiasaki.
Measures volume to indicate Bull vs Bear.
Go long when green, short when red, wait patiently when white.
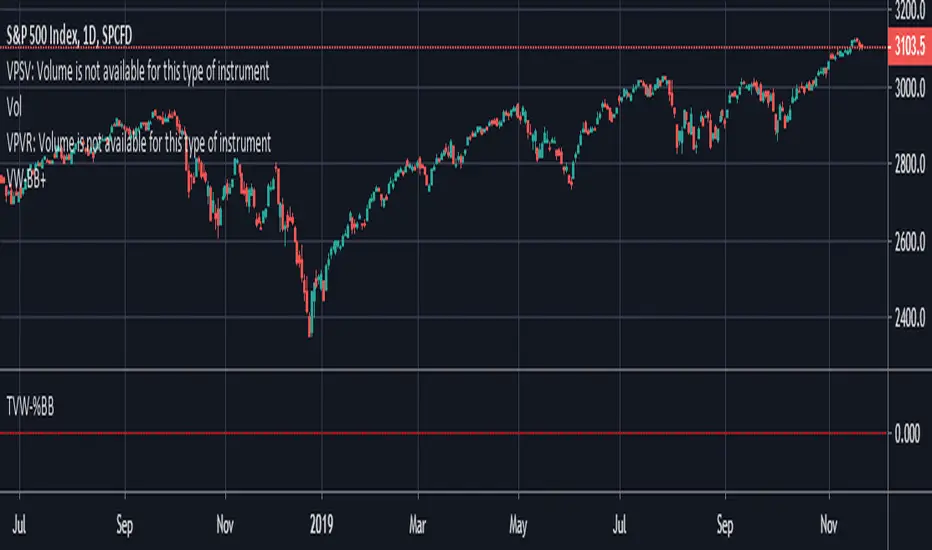
Volume Weighted Bollinger (Final, cleaned up visuals)Volume-weighted bollinger (normal stats application of weighting mean) with cleaned up visualization. Shaded area represents1sd-2sd move size for trailing 20 period average on timeframe for individual candles.
Volume - Moving Sum (Quote Currency)This indicator shows a MOVING SUM of the QUOTE CURRENCY of the pair.
I made this because I wanted to be able to see how the 24HR volume looked on 1-Minute charts (which is why the default period is 1440, as there are 1440 minutes in a day.)

Volume ExternalShows the volume of a specified exchange and pair. They should be entered in the format EXCHANGE:PAIR, e.g. BINANCE:ETHUSDT.
You can add multiple indicators of this to do volume analysis of multiple pairs on the same chart.


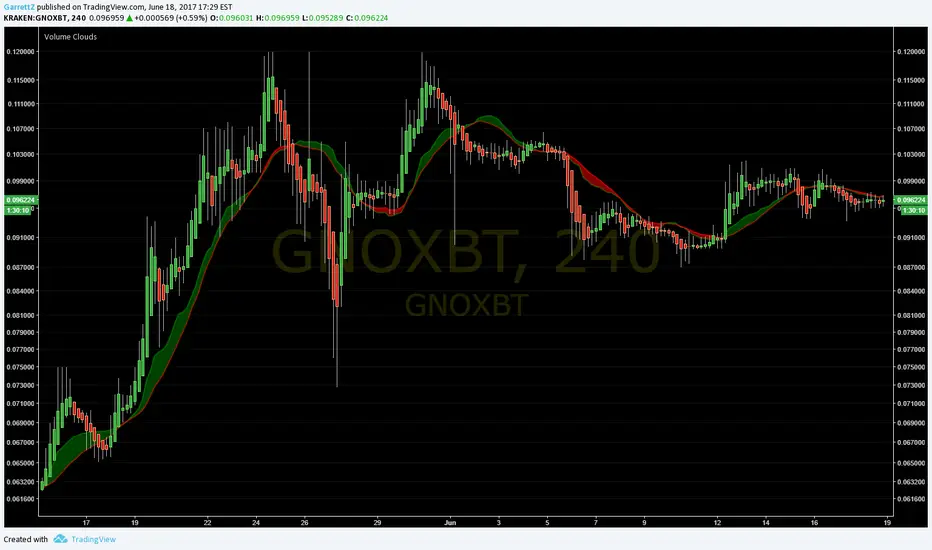
Volume CloudsI know it isn't much, but it is my first time coding an indicator!
You might need to modify distance to fit the volatility and time frame of the chart you are looking at (if candles stay on top of cloud in an ugly mess, increase distance until signals can be seen). Sometimes heikin ashi candles can really help clear the picture up as well.
How to use:
The lines are the Volume Weighted Moving Average (green) and Simple Moving Average (red).
Cloud is green when VWMA is above SMA ( bullish ) and red when SMA is above VWMA ( bearish ).
The thicker the cloud, the stronger the signal. Also, the farther price strays from the cloud, the more pressure there is for it to return.
Look for divergences:
When price passes below a green cloud you have a bullish divergence (or if cloud turns green at crossing point)
Price pass above red cloud = bearish divergence.
Or confirmations:
Price passes below red cloud = bearish confirmation.
Price pass above green cloud = bullish confirmation.
I hope this helps you at least a little! Twitter: GarrettZ
volume stopsLooks at increasing or decreasing volume over the last 3 bars as well as how the last three price bars have close. The idea is to use a color bar as confirmation of support/resistance at that level.

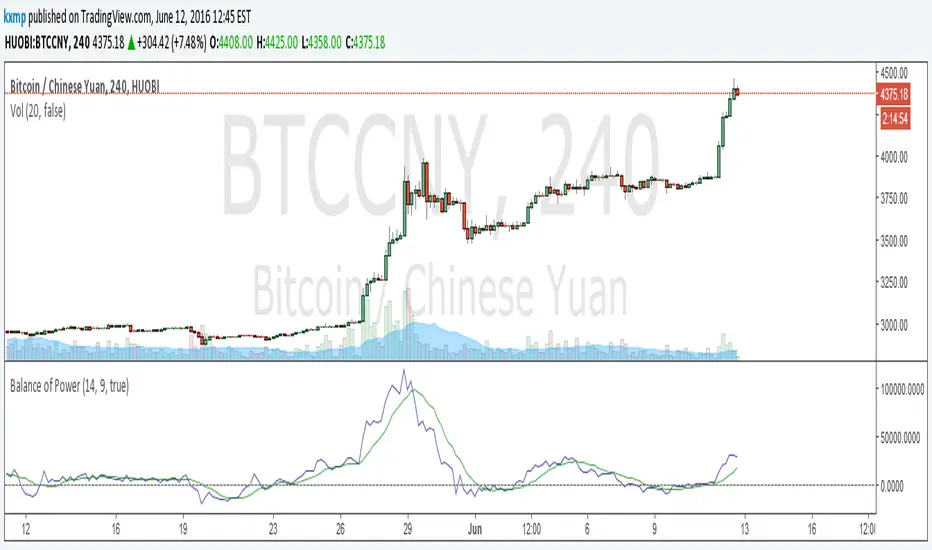
Volume weighted Balance of PowerIt's a simple indication.
I multiplied the output of bop with volume, make it more smoother.
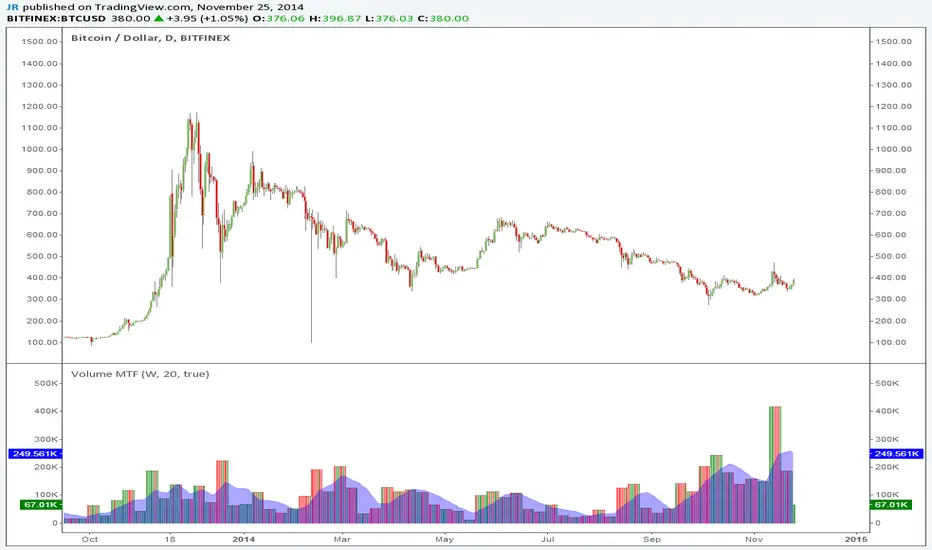
Volume MTFThis is a simple indicator you can use to separate volume from price on your chart. You can also select different time frames (MTF).
Thanks to LazyBear for cleaning up my previous messy code.
Buy Sell Volume SeparateDescription:
The script is designed to provide traders with a unique and comprehensive analysis of trading volume dynamics. Unlike existing scripts, the script offers a distinct advantage by presenting both buy and sell volumes on separate scales, simplifying trading decisions.
Key Features:
1. Dual Volume Scales: The script provides two separate volume scales, one for buy volumes and another for sell volumes. This separation allows to easily distinguish between buying and selling pressure, aiding in more precise trade entries and exits.
2. Clear and Intuitive Chart: The script ensures that the chart it generates is clean and easy to understand. The buy and sell volumes are color-coded for clarity, and you can quickly identify significant volume spikes and trends.
How to Use:
1. Adding the Script: To use the script, simply add it to your TradingView chart.
2. Interpreting Buy and Sell Volumes: On the chart, you will see two separate volume scales—one for buy volumes and one for sell volumes. Green bars represent buying pressure, while red bars indicate selling pressure. Pay attention to the relative strengths and patterns of these bars to gauge market sentiment.
3. Informed Trading Decisions: Armed with insights into both buy and sell volumes, you can make more informed trading decisions. Look for divergences, patterns, or significant volume spikes to identify potential entry and exit points.

Delta Volume Channels [LucF]█ OVERVIEW
This indicator displays on-chart visuals aimed at making the most of delta volume information. It can color bars and display two channels: one for delta volume, another calculated from the price levels of bars where delta volume divergences occur. Markers and alerts can also be configured using key conditions, and filtered in many different ways. The indicator caters to traders who prefer chart visuals over raw values. It will work on historical bars and in real time, using intrabar analysis to calculate delta volume in both conditions.
█ CONCEPTS
Delta Volume
The volume delta concept divides a bar's volume in "up" and "down" volumes. The delta is calculated by subtracting down volume from up volume. Many calculation techniques exist to isolate up and down volume within a bar. The simplest techniques use the polarity of interbar price changes to assign their volume to up or down slots, e.g., On Balance Volume or the Klinger Oscillator . Others such as Chaikin Money Flow use assumptions based on a bar's OHLC values. The most precise calculation method uses tick data and assigns the volume of each tick to the up or down slot depending on whether the transaction occurs at the bid or ask price. While this technique is ideal, it requires huge amounts of data on historical bars, which usually limits the historical depth of charts and the number of symbols for which tick data is available.
This indicator uses intrabar analysis to achieve a compromise between the simplest and most precise methods of calculating volume delta. In the context where historical tick data is not yet available on TradingView, intrabar analysis is the most precise technique to calculate volume delta on historical bars on our charts. TradingView's Volume Profile built-in indicators use it, as do the CVD - Cumulative Volume Delta Candles and CVD - Cumulative Volume Delta (Chart) indicators published from the TradingView account . My Volume Delta Columns Pro indicator also uses intrabar analysis. Other volume delta indicators such as my Realtime 5D Profile use realtime chart updates to achieve more precise volume delta calculations. Indicators of that type cannot be used on historical bars however; they only work in real time.
This is the logic I use to assign intrabar volume to up or down slots:
• If the intrabar's open and close values are different, their relative position is used.
• If the intrabar's open and close values are the same, the difference between the intrabar's close and the previous intrabar's close is used.
• As a last resort, when there is no movement during an intrabar and it closes at the same price as the previous intrabar, the last known polarity is used.
Once all intrabars making up a chart bar have been analyzed and the up or down property of each intrabar's volume determined, the up volumes are added and the down volumes subtracted. The resulting value is volume delta for that chart bar, which can be used as an estimate of the buying/selling pressure on an instrument.
Delta Volume Percent (DV%)
This value is the proportion that delta volume represents of the total intrabar volume in the chart bar. Note that on some symbols/timeframes, the total intrabar volume may differ from the chart's volume for a bar, but that will not affect our calculations since we use the total intrabar volume.
Delta Volume Channel
The DV channel is the space between two moving averages: the reference line and a DV%-weighted version of that reference. The reference line is a moving average of a type, source and length which you select. The DV%-weighted line uses the same settings, but it averages the DV%-weighted price source.
The weight applied to the source of the reference line is calculated from two values, which are multiplied: DV% and the relative size of the bar's volume in relation to previous bars. The effect of this is that DV% values on bars with higher total volume will carry greater weight than those with lesser volume.
The DV channel can be in one of four states, each having its corresponding color:
• Bull (teal): The DV%-weighted line is above the reference line.
• Strong bull (lime): The bull condition is fulfilled and the bar's close is above the reference line and both the reference and the DV%-weighted lines are rising.
• Bear (maroon): The DV%-weighted line is below the reference line.
• Strong bear (pink): The bear condition is fulfilled and the bar's close is below the reference line and both the reference and the DV%-weighted lines are falling.
Divergences
In the context of this indicator, a divergence is any bar where the slope of the reference line does not match that of the DV%-weighted line. No directional bias is assigned to divergences when they occur.
Divergence Channel
The divergence channel is the space between two levels (by default, the bar's low and high ) saved when divergences occur. When price has breached a channel and a new divergence occurs, a new channel is created. Until that new channel is breached, bars where additional divergences occur will expand the channel's levels if the bar's price points are outside the channel.
Prices breaches of the divergence channel will change its state. Divergence channels can be in one of five different states:
• Bull (teal): Price has breached the channel to the upside.
• Strong bull (lime): The bull condition is fulfilled and the DV channel is in the strong bull state.
• Bear (maroon): Price has breached the channel to the downside.
• Strong bear (pink): The bear condition is fulfilled and the DV channel is in the strong bear state.
• Neutral (gray): The channel has not been breached.
█ HOW TO USE THE INDICATOR
Load the indicator on an active chart (see here if you don't know how).
The default configuration displays:
• The DV channel, without the reference or DV%-weighted lines.
• The Divergence channel, without its level lines.
• Bar colors using the state of the DV channel.
The default settings use an Arnaud-Legoux moving average on the close and a length of 20 bars. The DV%-weighted version of it uses a combination of DV% and relative volume to calculate the ultimate weight applied to the reference. The DV%-weighted line is capped to 5 standard deviations of the reference. The lower timeframe used to access intrabars automatically adjusts to the chart's timeframe and achieves optimal balance between the number of intrabars inspected in each chart bar, and the number of chart bars covered by the script's calculations.
The Divergence channel's levels are determined using the high and low of the bars where divergences occur. Breaches of the channel require a bar's low to move above the top of the channel, and the bar's high to move below the channel's bottom.
No markers appear on the chart; if you want to create alerts from this script, you will need first to define the conditions that will trigger the markers, then create the alert, which will trigger on those same conditions.
To learn more about how to use this indicator, you must understand the concepts it uses and the information it displays, which requires reading this description. There are no videos to explain it.
█ FEATURES
The script's inputs are divided in four sections: "DV channel", "Divergence channel", "Other Visuals" and "Marker/Alert Conditions". The first setting is the selection method used to determine the intrabar precision, i.e., how many lower timeframe bars (intrabars) are examined in each chart bar. The more intrabars you analyze, the more precise the calculation of DV% results will be, but the less chart coverage can be covered by the script's calculations.
DV Channel
Here, you control the visibility and colors of the reference line, its weighted version, and the DV channel between them.
You also specify what type of moving average you want to use as a reference line, its source and length. This acts as the DV channel's baseline. The DV%-weighted line is also a moving average of the same type and length as the reference line, except that it will be calculated from the DV%-weighted source used in the reference line. By default, the DV%-weighted line is capped to five standard deviations of the reference line. You can change that value here. This section is also where you can disable the relative volume component of the weight.
Divergence Channel
This is where you control the appearance of the divergence channel and the key price values used in determining the channel's levels and breaching conditions. These choices have an impact on the behavior of the channel. More generous level prices like the default low and high selection will produce more conservative channels, as will the default choice for breach prices.
In this section, you can also enable a mode where an attempt is made to estimate the channel's bias before price breaches the channel. When it is enabled, successive increases/decreases of the channel's top and bottom levels are counted as new divergences occur. When one count is greater than the other, a bull/bear bias is inferred from it.
Other Visuals
You specify here:
• The method used to color chart bars, if you choose to do so.
• The display of a mark appearing above or below bars when a divergence occurs.
• If you want raw values to appear in tooltips when you hover above chart bars. The default setting does not display them, which makes the script faster.
• If you want to display an information box which by default appears in the lower left of the chart.
It shows which lower timeframe is used for intrabars, and the average number of intrabars per chart bar.
Marker/Alert Conditions
Here, you specify the conditions that will trigger up or down markers. The trigger conditions can include a combination of state transitions of the DV and the divergence channels. The triggering conditions can be filtered using a variety of conditions.
Configuring the marker conditions is necessary before creating an alert from this script, as the alert will use the marker conditions to trigger.
Markers only appear on bar closes, so they will not repaint. Keep in mind, when looking at markers on historical bars, that they are positioned on the bar when it closes — NOT when it opens.
Raw values
The raw values calculated by this script can be inspected using a tooltip and the Data Window. The tooltip is visible when you hover over the top of chart bars. It will display on the last 500 bars of the chart, and shows the values of DV, DV%, the combined weight, and the intermediary values used to calculate them.
█ INTERPRETATION
The aim of the DV channel is to provide a visual representation of the buying/selling pressure calculated using delta volume. The simplest characteristic of the channel is its bull/bear state. One can then distinguish between its bull and strong bull states, as transitions from strong bull to bull states will generally happen when buyers are losing steam. While one should not infer a reversal from such transitions, they can be a good place to tighten stops. Only time will tell if a reversal will occur. One or more divergences will often occur before reversals.
The nature of the divergence channel's design makes it particularly adept at identifying consolidation areas if its settings are kept on the conservative side. A gray divergence channel should usually be considered a no-trade zone. More adventurous traders can use the DV channel to orient their trade entries if they accept the risk of trading in a neutral divergence channel, which by definition will not have been breached by price.
If your charts are already busy with other stuff you want to hold on to, you could consider using only the chart bar coloring component of this indicator:
At its simplest, one way to use this indicator would be to look for overlaps of the strong bull/bear colors in both the DV channel and a divergence channel, as these identify points where price is breaching the divergence channel when buy/sell pressure is consistent with the direction of the breach. I have highlighted all those points in the chart below. Not all of them would have produced profitable trades, but nothing is perfect in the markets. Also, keep in mind that the circles identify the visual you would be looking for — not the trade's entry level.
█ LIMITATIONS
• The script will not work on symbols where no volume is available. An error will appear when that is the case.
• Because a maximum of 100K intrabars can be analyzed by a script, a compromise is necessary between the number of intrabars analyzed per chart bar
and chart coverage. The more intrabars you analyze per chart bar, the less coverage you will obtain.
The setting of the "Intrabar precision" field in the "DV channel" section of the script's inputs
is where you control how the lower timeframe is calculated from the chart's timeframe.
█ NOTES
Volume Quality
If you use volume, it's important to understand its nature and quality, as it varies with sectors and instruments. My Volume X-ray indicator is one way you can appraise the quality of an instrument's intraday volume.
For Pine Script™ Coders
• This script uses the new overload of the fill() function which now makes it possible to do vertical gradients in Pine. I use it for both channels displayed by this script.
• I use the new arguments for plot() 's `display` parameter to control where the script plots some of its values,
namely those I only want to appear in the script's status line and in the Data Window.
• I wrote my script using the revised recommendations in the Style Guide from the Pine v5 User Manual.
█ THANKS
To PineCoders . I have used their lower_tf library in this script, to manage the calculation of the LTF and intrabar stats, and their Time library to convert a timeframe in seconds to a printable form for its display in the Information box.
To TradingView's Pine Script™ team. Their innovations and improvements, big and small, constantly expand the boundaries of the language. What this script does would not have been possible just a few months back.
And finally, thanks to all the users of my scripts who take the time to comment on my publications and suggest improvements. I do not reply to all but I do read your comments and do my best to implement your suggestions with the limited time that I have.

CVD - Cumulative Volume Delta Candles█ OVERVIEW
This indicator displays cumulative volume delta in candle form. It uses intrabar information to obtain more precise volume delta information than methods using only the chart's timeframe.
█ CONCEPTS
Bar polarity
By bar polarity , we mean the direction of a bar, which is determined by looking at the bar's close vs its open .
Intrabars
Intrabars are chart bars at a lower timeframe than the chart's. Each 1H chart bar of a 24x7 market will, for example, usually contain 60 bars at the lower timeframe of 1min, provided there was market activity during each minute of the hour. Mining information from intrabars can be useful in that it offers traders visibility on the activity inside a chart bar.
Lower timeframes (LTFs)
A lower timeframe is a timeframe that is smaller than the chart's timeframe. This script uses a LTF to access intrabars. The lower the LTF, the more intrabars are analyzed, but the less chart bars can display CVD information because there is a limit to the total number of intrabars that can be analyzed.
Volume delta
The volume delta concept divides a bar's volume in "up" and "down" volumes. The delta is calculated by subtracting down volume from up volume. Many calculation techniques exist to isolate up and down volume within a bar. The simplest techniques use the polarity of interbar price changes to assign their volume to up or down slots, e.g., On Balance Volume or the Klinger Oscillator . Others such as Chaikin Money Flow use assumptions based on a bar's OHLC values. The most precise calculation method uses tick data and assigns the volume of each tick to the up or down slot depending on whether the transaction occurs at the bid or ask price. While this technique is ideal, it requires huge amounts of data on historical bars, which usually limits the historical depth of charts and the number of symbols for which tick data is available.
This indicator uses intrabar analysis to achieve a compromise between the simplest and most precise methods of calculating volume delta. In the context where historical tick data is not yet available on TradingView, intrabar analysis is the most precise technique to calculate volume delta on historical bars on our charts. Our Volume Profile indicators use it. Other volume delta indicators in our Community Scripts such as the Realtime 5D Profile use realtime chart updates to achieve more precise volume delta calculations, but that method cannot be used on historical bars, so those indicators only work in real time.
This is the logic we use to assign intrabar volume to up or down slots:
• If the intrabar's open and close values are different, their relative position is used.
• If the intrabar's open and close values are the same, the difference between the intrabar's close and the previous intrabar's close is used.
• As a last resort, when there is no movement during an intrabar and it closes at the same price as the previous intrabar, the last known polarity is used.
Once all intrabars making up a chart bar have been analyzed and the up or down property of each intrabar's volume determined, the up volumes are added and the down volumes subtracted. The resulting value is volume delta for that chart bar.
█ FEATURES
CVD Candles
Cumulative Volume Delta Candles present volume delta information as it evolves during a period of time.
This is how each candle's levels are calculated:
• open : Each candle's' open level is the cumulative volume delta for the current period at the start of the bar.
This value becomes zero on the first candle following a CVD reset.
The candles after the first one always open where the previous candle closed.
The candle's high, low and close levels are then calculated by adding or subtracting a volume value to the open.
• high : The highest volume delta value found in intrabars. If it is not higher than the volume delta for the bar, then that candle will have no upper wick.
• low : The lowest volume delta value found in intrabars. If it is not lower than the volume delta for the bar, then that candle will have no lower wick.
• close : The aggregated volume delta for all intrabars. If volume delta is positive for the chart bar, then the candle's close will be higher than its open, and vice versa.
The candles are plotted in one of two configurable colors, depending on the polarity of volume delta for the bar.
CVD resets
The "cumulative" part of the indicator's name stems from the fact that calculations accumulate during a period of time. This allows you to analyze the progression of volume delta across manageable chunks, which is often more useful than looking at volume delta cumulated from the beginning of a chart's history.
You can configure the reset period using the "CVD Resets" input, which offers the following selections:
• None : Calculations do not reset.
• On a fixed higher timeframe : Calculations reset on the higher timeframe you select in the "Fixed higher timeframe" field.
• At a fixed time that you specify.
• At the beginning of the regular session .
• On a stepped higher timeframe : Calculations reset on a higher timeframe automatically stepped using the chart's timeframe and following these rules:
Chart TF HTF
< 1min 1H
< 3H 1D
<= 12H 1W
< 1W 1M
>= 1W 1Y
The indicator's background shows where resets occur.
Intrabar precision
The precision of calculations increases with the number of intrabars analyzed for each chart bar. It is controlled through the script's "Intrabar precision" input, which offers the following selections:
• Least precise, covering many chart bars
• Less precise, covering some chart bars
• More precise, covering less chart bars
• Most precise, 1min intrabars
As there is a limit to the number of intrabars that can be analyzed by a script, a tradeoff occurs between the number of intrabars analyzed per chart bar and the chart bars for which calculations are possible.
Total volume candles
You can choose to display candles showing the total intrabar volume for the chart bar. This provides you with more context to evaluate a bar's volume delta by showing it relative to the sum of intrabar volume. Note that because of the reasons explained in the "NOTES" section further down, the total volume is the sum of all intrabar volume rather than the volume of the bar at the chart's timeframe.
Total volume candles can be configured with their own up and down colors. You can also control the opacity of their bodies to make them more or less prominent. This publication's chart shows the indicator with total volume candles. They are turned off by default, so you will need to choose to display them in the script's inputs for them to plot.
Divergences
Divergences occur when the polarity of volume delta does not match that of the chart bar. You can identify divergences by coloring the CVD candles differently for them, or by coloring the indicator's background.
Information box
An information box in the lower-left corner of the indicator displays the HTF used for resets, the LTF used for intrabars, and the average quantity of intrabars per chart bar. You can hide the box using the script's inputs.
█ INTERPRETATION
The first thing to look at when analyzing CVD candles is the side of the zero line they are on, as this tells you if CVD is generally bullish or bearish. Next, one should consider the relative position of successive candles, just as you would with a price chart. Are successive candles trending up, down, or stagnating? Keep in mind that whatever trend you identify must be considered in the context of where it appears with regards to the zero line; an uptrend in a negative CVD (below the zero line) may not be as powerful as one taking place in positive CVD values, but it may also predate a movement into positive CVD territory. The same goes with stagnation; a trader in a long position will find stagnation in positive CVD territory less worrisome than stagnation under the zero line.
After consideration of the bigger picture, one can drill down into the details. Exactly what you are looking for in markets will, of course, depend on your trading methodology, but you may find it useful to:
• Evaluate volume delta for the bar in relation to price movement for that bar.
• Evaluate the proportion that volume delta represents of total volume.
• Notice divergences and if the chart's candle shape confirms a hesitation point, as a Doji would.
• Evaluate if the progress of CVD candles correlates with that of chart bars.
• Analyze the wicks. As with price candles, long wicks tend to indicate weakness.
Always keep in mind that unless you have chosen not to reset it, your CVD resets for each period, whether it is fixed or automatically stepped. Consequently, any trend from the preceding period must re-establish itself in the next.
█ NOTES
Know your volume
Traders using volume information should understand the volume data they are using: where it originates and what transactions it includes, as this can vary with instruments, sectors, exchanges, timeframes, and between historical and realtime bars. The information used to build a chart's bars and display volume comes from data providers (exchanges, brokers, etc.) who often maintain distinct feeds for intraday and end-of-day (EOD) timeframes. How volume data is assembled for the two feeds depends on how instruments are traded in that sector and/or the volume reporting policy for each feed. Instruments from crypto and forex markets, for example, will often display similar volume on both feeds. Stocks will often display variations because block trades or other types of trades may not be included in their intraday volume data. Futures will also typically display variations.
Note that as intraday vs EOD variations exist for historical bars on some instruments, differences may also exist between the realtime feeds used on intraday vs 1D or greater timeframes for those same assets. Realtime reporting rules will often be different from historical feed reporting rules, so variations between realtime feeds will often be different from the variations between historical feeds for the same instrument. The Volume X-ray indicator can help you analyze differences between intraday and EOD volumes for the instruments you trade.
If every unit of volume is both bought by a buyer and sold by a seller, how can volume delta make sense?
Traders who do not understand the mechanics of matching engines (the exchange software that matches orders from buyers and sellers) sometimes argue that the concept of volume delta is flawed, as every unit of volume is both bought and sold. While they are rigorously correct in stating that every unit of volume is both bought and sold, they overlook the fact that information can be mined by analyzing variations in the price of successive ticks, or in our case, intrabars.
Our calculations model the situation where, in fully automated order handling, market orders are generally matched to limit orders sitting in the order book. Buy market orders are matched to quotes at the ask level and sell market orders are matched to quotes at the bid level. As explained earlier, we use the same logic when comparing intrabar prices. While using intrabar analysis does not produce results as precise as when individual transactions — or ticks — are analyzed, results are much more precise than those of methods using only chart prices.
Not only does the concept underlying volume delta make sense, it provides a window on an oft-overlooked variable which, with price and time, is the only basic information representing market activity. Furthermore, because the calculation of volume delta also uses price and time variations, one could conceivably surmise that it can provide a more complete model than ones using price and time only. Whether or not volume delta can be useful in your trading practice, as usual, is for you to decide, as each trader's methodology is different.
For Pine Script™ coders
As our latest Polarity Divergences publication, this script uses the recently released request.security_lower_tf() Pine Script™ function discussed in this blog post . It works differently from the usual request.security() in that it can only be used at LTFs, and it returns an array containing one value per intrabar. This makes it much easier for programmers to access intrabar information.
Look first. Then leap.

VolumeProfileLibrary "VolumeProfile"
Analyzes volume and price and calculates a volume profile, in particular the Point Of Control and Value Area values.
new(rowSizeInTicks, valueAreaCoverage, startTime)
Constructor method that creates a new Volume Profile
Parameters:
rowSizeInTicks (float) : Internal row size (aka resolution) of the volume profile. Useful for most futures contracts would be '1 / syminfo.mintick'. Default '4'.
valueAreaCoverage (int) : Percentage of total volume that is considered the Value Area. Default '70'
startTime (int) : Start time (unix timestamp in milliseconds) of the Volume Profile. Default 'time'.
Returns: VolumeProfile object
method calculatePOC(vp)
Calculates current Point Of Control of the VP
Namespace types: VolumeProfile
Parameters:
vp (VolumeProfile)
Returns: void
method calculateVA(vp)
Calculates current Value Area High and Low of the VP
Namespace types: VolumeProfile
Parameters:
vp (VolumeProfile)
Returns: void
method update(vp, h, l, v, t)
Processes new chart data and sorts volume into rows. Then calls calculatePOC() and calculateVA() to update the VP. Parameters are usually the output of request.security_lower_tf.
Namespace types: VolumeProfile
Parameters:
vp (VolumeProfile)
h (array) : Array of highs
l (array) : Array of lows
v (array) : Array of volumes
t (array) : Array of candle times
Returns: void
method setSessionHigh(vp, h)
Sets the high of the session the VP is tracking
Namespace types: VolumeProfile
Parameters:
vp (VolumeProfile)
h (float)
Returns: void
method setSessionLow(vp, l)
Sets the low of the session the VP is tracking
Namespace types: VolumeProfile
Parameters:
vp (VolumeProfile)
l (float)
Returns: void
method getPOC(vp)
Gets the current Point Of Control
Namespace types: VolumeProfile
Parameters:
vp (VolumeProfile)
Returns: Point Of Control (float)
method getVAH(vp)
Gets the current Value Area High
Namespace types: VolumeProfile
Parameters:
vp (VolumeProfile)
Returns: Value Area High (float)
method getVAL(vp)
Gets the current Value Area Low
Namespace types: VolumeProfile
Parameters:
vp (VolumeProfile)
Returns: Value Area Low (float)
VolumeProfile
Fields:
rowSizeInTicks (series float)
valueAreaCoverage (series int)
startTime (series int)
valueAreaHigh (series float)
pointOfControl (series float)
valueAreaLow (series float)
sessionHigh (series float)
sessionLow (series float)
volumeByRow (map)
totalVolume (series float)
pocRow (series float)
pocVol (series float)

VolumeSpreadAnalysisLibrary "VolumeSpreadAnalysis"
A library for Volume Spread Analysis (VSA).
spread(_barIndex)
Calculates the spread of a bar.
Parameters:
_barIndex (int) : (int) The index of the bar.
Returns: (float) The spread of the bar.
volume(_barIndex)
Retrieves the volume of a bar.
Parameters:
_barIndex (int) : (int) The index of the bar.
Returns: (float) The volume of the bar.
body(_barIndex)
Calculates the body of a bar.
Parameters:
_barIndex (simple int) : (int) The index of the bar.
Returns: (float) The body size of the bar.
wickUpper(_barIndex)
Calculates the upper wick of a bar (upper shadow).
Parameters:
_barIndex (simple int) : (int) The index of the bar.
Returns: (float) The upper wick size of the bar.
wickLower(_barIndex)
Calculates the lower wick of a bar (lower shadow).
Parameters:
_barIndex (simple int) : (int) The index of the bar.
Returns: (float) The lower wick size of the bar.
calcForecastedSMA(_source, _length, _forecastedLevel)
Calculates the forecasted Simple Moving Average (SMA).
Parameters:
_source (float) : (series float) Source data for calculation.
_length (simple int) : (int) The length of the SMA.
_forecastedLevel (float) : (float) The forecasted level to include in the calculation.
Returns: (float) The forecasted SMA value.
calcForecastedEMA(_source, _length, _forecastedLevel)
Calculates the forecasted Exponential Moving Average (EMA).
Parameters:
_source (float) : (series float) Source data for calculation.
_length (simple int) : (int) The length of the EMA.
_forecastedLevel (float) : (float) The forecasted level to include in the calculation.
Returns: (float) The forecasted EMA value.
calcForecastedRMA(_source, _length, _forecastedLevel)
Calculates the forecasted Relative Moving Average (RMA).
Parameters:
_source (float) : (series float) Source data for calculation.
_length (simple int) : (int) The length of the RMA.
_forecastedLevel (float) : (float) The forecasted level to include in the calculation.
Returns: (float) The forecasted RMA value.
calcForecastedWMA(_source, _length, _forecastedLevel)
Calculates the forecasted Weighted Moving Average (WMA).
Parameters:
_source (float) : (series float) Source data for calculation.
_length (simple int) : (int) The length of the WMA.
_forecastedLevel (float) : (float) The forecasted level to include in the calculation.
Returns: (float) The forecasted WMA value.
calcElapsedTimePercent()
Calculates the elapsed time percent of the current bar.
Returns: (float) The elapsed time percent.
calcForecastedSpread(multiplierAtMidpoints, multiplierAtPeaks)
Calculates the forecasted spread using elapsed time and dynamic multipliers, handling spread's non-linear nature.
Parameters:
multiplierAtMidpoints (float) : (float) The multiplier value at midpoints.
multiplierAtPeaks (float) : (float) The multiplier value at peaks.
Returns: (float) The forecasted spread value.
calcForecastedVolume()
Calculates the forecasted volume using elapsed time, satisfying volume's linear nature.
Returns: (float) The forecasted volume value.
calcForecastedMA(_source, _length, _forecastedSource, _type)
Calculates the forecasted Moving Average (MA) based on the specified type.
Parameters:
_source (float) : (series float) Source data for calculation.
_length (simple int) : (int) The length of the MA.
_forecastedSource (float) : (float) The forecasted level to include in the calculation.
_type (simple string) : (string) The type of the MA ("SMA", "EMA", "SMMA (RMA)", "WMA").
Returns: (float) The forecasted MA value.
calcMA(_source, _length, _type)
Calculates the Moving Average (MA) based on the specified type.
Parameters:
_source (float) : (series float) Source data for calculation.
_length (simple int) : (int) The length of the MA.
_type (simple string) : (string) The type of the MA ("SMA", "EMA", "SMMA (RMA)", "WMA").
Returns: (float) The MA value.
bullBar(_barIndex)
Determines if the bar is bullish.
Parameters:
_barIndex (simple int) : (int) The index of the bar.
Returns: (bool) True if the bar is bullish, otherwise false.
bearBar(_barIndex)
Determines if the bar is bearish.
Parameters:
_barIndex (simple int) : (int) The index of the bar.
Returns: (bool) True if the bar is bearish, otherwise false.
breakout(_barIndex)
Determines if there is a breakout above the previous bar.
Parameters:
_barIndex (simple int) : (int) The index of the bar.
Returns: (bool) True if there is a breakout, otherwise false.
breakdown(_barIndex)
Determines if there is a breakdown below the previous bar.
Parameters:
_barIndex (simple int) : (int) The index of the bar.
Returns: (bool) True if there is a breakdown, otherwise false.
rejectionWickUpper(_rejectionWick)
Determines if the upper wick is a rejection wick.
Parameters:
_rejectionWick (simple float) : (float) The rejection wick percentage.
Returns: (bool) True if the upper wick is a rejection wick, otherwise false.
rejectionWickLower(_rejectionWick)
Determines if the lower wick is a rejection wick.
Parameters:
_rejectionWick (simple float) : (float) The rejection wick percentage.
Returns: (bool) True if the lower wick is a rejection wick, otherwise false.
setupDataVolume(_data, _mult_Low, _mult_High, _mult_Ultra, _maLengthVolume, _maTypeVolume)
Sets up data for volume levels.
Parameters:
_data (map) : (map) The map to store the levels.
_mult_Low (simple float) : (float) The multiplier for low level.
_mult_High (simple float) : (float) The multiplier for high level.
_mult_Ultra (simple float) : (float) The multiplier for ultra level.
_maLengthVolume (simple int) : (int) The length for MA.
_maTypeVolume (simple string) : (string) The type for MA.
Returns: (void) Nothing.
setupDataSpread(_data, _mult_Low, _mult_High, _mult_Ultra, _maLengthSpread, _maTypeSpread)
Sets up data for spread levels.
Parameters:
_data (map) : (map) The map to store the levels.
_mult_Low (simple float) : (float) The multiplier for low level.
_mult_High (simple float) : (float) The multiplier for high level.
_mult_Ultra (simple float) : (float) The multiplier for ultra level.
_maLengthSpread (simple int) : (int) The length for MA.
_maTypeSpread (simple string) : (string) The type for MA.
Returns: (void) Nothing.
setupDataForecastVolume(_dataForecast, _mult_Low, _mult_High, _mult_Ultra, _maLengthVolume, _predictedLevelVolume, _maTypeVolume)
Sets up data for volume and spread levels for forecast.
Parameters:
_dataForecast (map)
_mult_Low (simple float) : (float) The multiplier for low level.
_mult_High (simple float) : (float) The multiplier for high level.
_mult_Ultra (simple float) : (float) The multiplier for ultra level.
_maLengthVolume (simple int) : (int) The length for MA.
_predictedLevelVolume (float) : (float) The predicted level for MA.
_maTypeVolume (simple string) : (string) The type for MA.
Returns: (void) Nothing.
setupDataForecastSpread(_dataForecast, _mult_Low, _mult_High, _mult_Ultra, _maLengthSpread, _predictedLevelSpread, _maTypeSpread)
Sets up data for spread levels for forecast.
Parameters:
_dataForecast (map)
_mult_Low (simple float) : (float) The multiplier for low level.
_mult_High (simple float) : (float) The multiplier for high level.
_mult_Ultra (simple float) : (float) The multiplier for ultra level.
_maLengthSpread (simple int) : (int) The length for MA.
_predictedLevelSpread (float) : (float) The predicted level for MA.
_maTypeSpread (simple string) : (string) The type for MA.
Returns: (void) Nothing.
isVolumeLow(_data, _barIndex)
Determines if the volume is low.
Parameters:
_data (map) : (map) The data map with volume levels.
_barIndex (int)
Returns: (bool) True if the volume is low, otherwise false.
isVolumeNormal(_data, _barIndex)
Determines if the volume is normal.
Parameters:
_data (map) : (map) The data map with volume levels.
_barIndex (int)
Returns: (bool) True if the volume is normal, otherwise false.
isVolumeHigh(_data, _barIndex)
Determines if the volume is high.
Parameters:
_data (map) : (map) The data map with volume levels.
_barIndex (int)
Returns: (bool) True if the volume is high, otherwise false.
isVolumeUltra(_data, _barIndex)
Determines if the volume is ultra.
Parameters:
_data (map) : (map) The data map with volume levels.
_barIndex (int)
Returns: (bool) True if the volume is ultra, otherwise false.
isSpreadLow(_data, _barIndex)
Determines if the spread is low.
Parameters:
_data (map) : (map) The data map with spread levels.
_barIndex (int)
Returns: (bool) True if the spread is low, otherwise false.
isSpreadNormal(_data, _barIndex)
Determines if the spread is normal.
Parameters:
_data (map) : (map) The data map with spread levels.
_barIndex (int)
Returns: (bool) True if the spread is normal, otherwise false.
isSpreadHigh(_data, _barIndex)
Determines if the spread is high.
Parameters:
_data (map) : (map) The data map with spread levels.
_barIndex (int)
Returns: (bool) True if the spread is high, otherwise false.
isSpreadUltra(_data, _barIndex)
Determines if the spread is ultra.
Parameters:
_data (map) : (map) The data map with spread levels.
_barIndex (int)
Returns: (bool) True if the spread is ultra, otherwise false.
isVolumeText(_data)
Determines text string representing the volume area level.
Parameters:
_data (map) : (map) The data map with volume levels.
Returns: (string) Text string of Low, Normal, High, or Ultra.
isSpreadText(_data)
Determines text string representing the spread area level.
Parameters:
_data (map) : (map) The data map with spread levels.
Returns: (string) Text string of Low, Normal, High, or Ultra.
calcBarColor(_value, _level)
Calculates the color based level.
Parameters:
_value (float) : (float) The value to check.
_level (float) : (float) The value level for comparison.
Returns: (color) The color for the bar.
bullPinBar(_maxBodyPercent, _minWickPercent)
Determines if the bar is a bull pin bar.
Parameters:
_maxBodyPercent (simple float) : (float) The maximum body percentage.
_minWickPercent (simple float) : (float) The minimum wick percentage.
Returns: (bool) True if the bar is a bull pin bar, otherwise false.
bearPinBar(_maxBodyPercent, _minWickPercent)
Determines if the bar is a bear pin bar.
Parameters:
_maxBodyPercent (simple float) : (float) The maximum body percentage.
_minWickPercent (simple float) : (float) The minimum wick percentage.
Returns: (bool) True if the bar is a bear pin bar, otherwise false.
dojiBar(_maxBodyPercent)
Determines if the bar is a doji.
Parameters:
_maxBodyPercent (simple float) : (float) The maximum body percentage.
Returns: (bool) True if the bar is a doji, otherwise false.
spinningTopBar(_minWicksPercent, _emaLength)
Determines if the bar is a spinning top.
Parameters:
_minWicksPercent (simple float) : (float) The minimum wicks percentage.
_emaLength (simple int) : (int) The length for EMA calculation.
Returns: (bool) True if the bar is a spinning top, otherwise false.
highWaveBar(_minBodyPercent, _minWickPercent, _bars)
Determines if the bar is a high wave bar.
Parameters:
_minBodyPercent (simple float) : (float) The minimum body percentage.
_minWickPercent (simple float) : (float) The minimum wick percentage.
_bars (simple int) : (int) The number of bars for comparison.
Returns: (bool) True if the bar is a high wave bar, otherwise false.
consolidationBar(_data, _spread, _bars)
Determines if the bars are in consolidation.
Parameters:
_data (map) : (map) The data map with spread levels.
_spread (simple float) : (float) The spread percentage for comparison.
_bars (simple int) : (int) The number of bars for comparison.
Returns: (bool) True if the bars are in consolidation, otherwise false.
S_DownThrust(_data, _bullPinBarMaxBody, _bullPinBarMinWick)
Determines if there is a sign of strength (DownThrust).
Parameters:
_data (map) : (map) The data map with volume and spread levels.
_bullPinBarMaxBody (simple float) : (float) The maximum body percentage for bull pin bar.
_bullPinBarMinWick (simple float) : (float) The minimum wick percentage for bull pin bar.
Returns: (bool) True if there is a sign of strength (DownThrust), otherwise false.
S_SellingClimax(_data, _rejectionWick)
Determines if there is a sign of strength (Selling Climax).
Parameters:
_data (map) : (map) The data map with volume and spread levels.
_rejectionWick (simple float) : (float) The rejection wick percentage.
Returns: (bool) True if there is a sign of strength (Selling Climax), otherwise false.
S_NoEffortBearishResult()
Determines if there is a sign of strength (No Effort Bearish Result).
Returns: (bool) True if there is a sign of strength (No Effort Bearish Result), otherwise false.
S_BearishEffortNoResult()
Determines if there is a sign of strength (Bearish Effort No Result).
Returns: (bool) True if there is a sign of strength (Bearish Effort No Result), otherwise false.
S_InverseDownThrust(_data, _bearPinBarMaxBody, _bearPinBarMinWick)
Determines if there is a sign of strength (Inverse DownThrust).
Parameters:
_data (map) : (map) The data map with volume and spread levels.
_bearPinBarMaxBody (simple float) : (float) The maximum body percentage for bear pin bar.
_bearPinBarMinWick (simple float) : (float) The minimum wick percentage for bear pin bar.
Returns: (bool) True if there is a sign of strength (Inverse DownThrust), otherwise false.
S_FailedSellingClimax()
Determines if there is a sign of strength (Failed Selling Climax).
Returns: (bool) True if there is a sign of strength (Failed Selling Climax), otherwise false.
S_BullOutsideReversal(_data)
Determines if there is a sign of strength (Bull Outside Reversal).
Parameters:
_data (map) : (map) The data map with volume and spread levels.
Returns: (bool) True if there is a sign of strength (Bull Outside Reversal), otherwise false.
S_EndOfFallingMarket(_data)
Determines if there is a sign of strength (End of Falling Market).
Parameters:
_data (map) : (map) The data map with volume and spread levels.
Returns: (bool) True if there is a sign of strength (End of Falling Market), otherwise false.
S_PseudoDownThrust(_bullPinBarMaxBody, _bullPinBarMinWick)
Determines if there is a sign of strength (Pseudo DownThrust).
Parameters:
_bullPinBarMaxBody (simple float) : (float) The maximum body percentage for bull pin bar.
_bullPinBarMinWick (simple float) : (float) The minimum wick percentage for bull pin bar.
Returns: (bool) True if there is a sign of strength (Pseudo DownThrust), otherwise false.
S_NoSupply(_bullPinBarMaxBody, _bullPinBarMinWick)
Determines if there is a sign of strength (No Supply).
Parameters:
_bullPinBarMaxBody (simple float) : (float) The maximum body percentage for bull pin bar.
_bullPinBarMinWick (simple float) : (float) The minimum wick percentage for bull pin bar.
Returns: (bool) True if there is a sign of strength (No Supply), otherwise false.
W_UpThrust(_data, _bearPinBarMaxBody, _bearPinBarMinWick)
Determines if there is a sign of weakness (UpThrust).
Parameters:
_data (map) : (map) The data map with volume and spread levels.
_bearPinBarMaxBody (simple float) : (float) The maximum body percentage for bear pin bar.
_bearPinBarMinWick (simple float) : (float) The minimum wick percentage for bear pin bar.
Returns: (bool) True if there is a sign of weakness (UpThrust), otherwise false.
W_BuyingClimax(_data, _rejectionWick)
Determines if there is a sign of weakness (Buying Climax).
Parameters:
_data (map) : (map) The data map with volume and spread levels.
_rejectionWick (simple float) : (float) The rejection wick percentage.
Returns: (bool) True if there is a sign of weakness (Buying Climax), otherwise false.
W_NoEffortBullishResult()
Determines if there is a sign of weakness (No Effort Bullish Result).
Returns: (bool) True if there is a sign of weakness (No Effort Bullish Result), otherwise false.
W_BullishEffortNoResult()
Determines if there is a sign of weakness (Bullish Effort No Result).
Returns: (bool) True if there is a sign of weakness (Bullish Effort No Result), otherwise false.
W_InverseUpThrust(_data, _bullPinBarMaxBody, _bullPinBarMinWick)
Determines if there is a sign of weakness (Inverse UpThrust).
Parameters:
_data (map) : (map) The data map with volume and spread levels.
_bullPinBarMaxBody (simple float) : (float) The maximum body percentage for bull pin bar.
_bullPinBarMinWick (simple float) : (float) The minimum wick percentage for bull pin bar.
Returns: (bool) True if there is a sign of weakness (Inverse UpThrust), otherwise false.
W_FailedBuyingClimax()
Determines if there is a sign of weakness (Failed Buying Climax).
Returns: (bool) True if there is a sign of weakness (Failed Buying Climax), otherwise false.
W_BearOutsideReversal(_data)
Determines if there is a sign of weakness (Bear Outside Reversal).
Parameters:
_data (map) : (map) The data map with volume and spread levels.
Returns: (bool) True if there is a sign of weakness (Bear Outside Reversal), otherwise false.
W_EndOfRisingMarket(_data)
Determines if there is a sign of weakness (End of Rising Market).
Parameters:
_data (map) : (map) The data map with volume and spread levels.
Returns: (bool) True if there is a sign of weakness (End of Rising Market), otherwise false.
W_PseudoUpThrust(_bearPinBarMaxBody, _bearPinBarMinWick)
Determines if there is a sign of weakness (Pseudo UpThrust).
Parameters:
_bearPinBarMaxBody (simple float) : (float) The maximum body percentage for bear pin bar.
_bearPinBarMinWick (simple float) : (float) The minimum wick percentage for bear pin bar.
Returns: (bool) True if there is a sign of weakness (Pseudo UpThrust), otherwise false.
W_NoDemand(_bearPinBarMaxBody, _bearPinBarMinWick)
Determines if there is a sign of weakness (No Demand).
Parameters:
_bearPinBarMaxBody (simple float) : (float) The maximum body percentage for bear pin bar.
_bearPinBarMinWick (simple float) : (float) The minimum wick percentage for bear pin bar.
Returns: (bool) True if there is a sign of weakness (No Demand), otherwise false.
N_QuietDoji(_dojiBarMaxBody)
Determines if there is a neutral signal (Quiet Doji).
Parameters:
_dojiBarMaxBody (simple float) : (float) The maximum body percentage for doji bar.
Returns: (bool) True if there is a neutral signal (Quiet Doji), otherwise false.
N_BalancedDoji(_data, _dojiBarMaxBody)
Determines if there is a neutral signal (Balanced Doji).
Parameters:
_data (map) : (map) The data map with volume and spread levels.
_dojiBarMaxBody (simple float) : (float) The maximum body percentage for doji bar.
Returns: (bool) True if there is a neutral signal (Balanced Doji), otherwise false.
N_StrongDoji(_dojiBarMaxBody)
Determines if there is a neutral signal (Strong Doji).
Parameters:
_dojiBarMaxBody (simple float) : (float) The maximum body percentage for doji bar.
Returns: (bool) True if there is a neutral signal (Strong Doji), otherwise false.
N_QuietSpinningTop(_spinningTopBarMinWicks, _spinningTopBarEmaLength)
Determines if there is a neutral signal (Quiet Spinning Top).
Parameters:
_spinningTopBarMinWicks (simple float) : (float) The minimum wicks percentage for spinning top bar.
_spinningTopBarEmaLength (simple int) : (int) The length for EMA calculation.
Returns: (bool) True if there is a neutral signal (Quiet Spinning Top), otherwise false.
N_BalancedSpinningTop(_data, _spinningTopBarMinWicks, _spinningTopBarEmaLength)
Determines if there is a neutral signal (Balanced Spinning Top).
Parameters:
_data (map) : (map) The data map with volume and spread levels.
_spinningTopBarMinWicks (simple float) : (float) The minimum wicks percentage for spinning top bar.
_spinningTopBarEmaLength (simple int) : (int) The length for EMA calculation.
Returns: (bool) True if there is a neutral signal (Balanced Spinning Top), otherwise false.
N_StrongSpinningTop(_spinningTopBarMinWicks, _spinningTopBarEmaLength)
Determines if there is a neutral signal (Strong Spinning Top).
Parameters:
_spinningTopBarMinWicks (simple float) : (float) The minimum wicks percentage for spinning top bar.
_spinningTopBarEmaLength (simple int) : (int) The length for EMA calculation.
Returns: (bool) True if there is a neutral signal (Strong Spinning Top), otherwise false.
N_QuietHighWave(_highWaveBarMinBody, _highWaveBarMinWick, _highWaveBarBars)
Determines if there is a neutral signal (Quiet High Wave).
Parameters:
_highWaveBarMinBody (simple float) : (float) The minimum body percentage for high wave bar.
_highWaveBarMinWick (simple float) : (float) The minimum wick percentage for high wave bar.
_highWaveBarBars (simple int) : (int) The number of bars for comparison.
Returns: (bool) True if there is a neutral signal (Quiet High Wave), otherwise false.
N_BalancedHighWave(_data, _highWaveBarMinBody, _highWaveBarMinWick, _highWaveBarBars)
Determines if there is a neutral signal (Balanced High Wave).
Parameters:
_data (map) : (map) The data map with volume and spread levels.
_highWaveBarMinBody (simple float) : (float) The minimum body percentage for high wave bar.
_highWaveBarMinWick (simple float) : (float) The minimum wick percentage for high wave bar.
_highWaveBarBars (simple int) : (int) The number of bars for comparison.
Returns: (bool) True if there is a neutral signal (Balanced High Wave), otherwise false.
N_StrongHighWave(_highWaveBarMinBody, _highWaveBarMinWick, _highWaveBarBars)
Determines if there is a neutral signal (Strong High Wave).
Parameters:
_highWaveBarMinBody (simple float) : (float) The minimum body percentage for high wave bar.
_highWaveBarMinWick (simple float) : (float) The minimum wick percentage for high wave bar.
_highWaveBarBars (simple int) : (int) The number of bars for comparison.
Returns: (bool) True if there is a neutral signal (Strong High Wave), otherwise false.
N_Consolidation(_data, _consolidationBarSpread, _consolidationBarBars)
Determines if there is a neutral signal (Consolidation).
Parameters:
_data (map) : (map) The data map with volume and spread levels.
_consolidationBarSpread (simple float) : (float) The spread percentage for consolidation bar.
_consolidationBarBars (simple int) : (int) The number of bars for comparison.
Returns: (bool) True if there is a neutral signal (Consolidation), otherwise false.

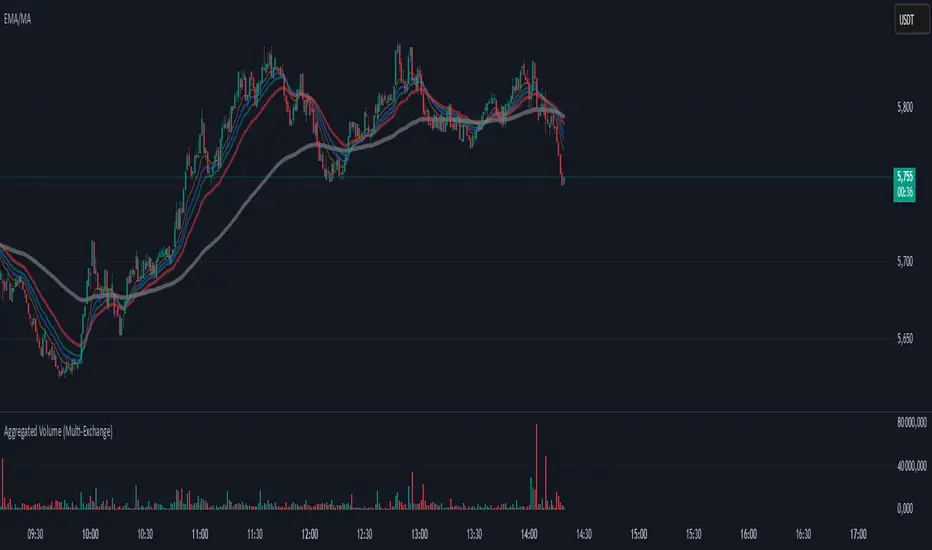
Aggregated Volume (Multi-Exchange)Indicator: Aggregated Volume (Multi-Exchange)
Overview:
The Aggregated Volume (Multi-Exchange) indicator is designed to aggregate trading volume data from multiple exchanges for a specific cryptocurrency pair. The goal is to provide a consolidated view of the total trading volume across different platforms, helping traders and analysts gauge the overall market activity for a given asset.
Features:
Multi-Exchange Support: The indicator allows you to aggregate trading volume data from various exchanges. Users can enable or disable volume data from specific exchanges (e.g., Binance, Bybit, Kucoin, etc.).
Spot and Futures Volumes: The indicator can sum the volume for spot trading and futures trading separately if desired. However, in the current version, it only sums the volume for specific pairs across multiple exchanges, without distinguishing between spot and futures volumes (though this feature can be added if necessary).
Customizable Exchange Selection: Users can select which exchanges' volume data to include in the aggregation.
Real-Time Updates: The volume data is updated in real-time as new bars are formed on the chart, providing an up-to-date picture of the trading volume.
Purpose:
The primary purpose of this indicator is to consolidate trading volume information from multiple exchanges for the same trading pair (e.g., BTC/USD). Traders can use this aggregated volume to gain a better understanding of market activity across various platforms, as well as assess the level of liquidity and interest in a particular asset.
By viewing the total aggregated volume, traders can:
Track market trends: Higher aggregated volume can signal increased market interest, making it easier to spot trends or potential breakouts.
Analyze liquidity: This indicator can help traders assess liquidity in the market, especially when using multiple exchanges.
Identify potential market manipulation: If there is a sudden spike in volume on multiple exchanges, it could signal market manipulation or an event-driven surge.
How it Works:
Volume Aggregation: The indicator collects and sums the volume data for a given symbol (e.g., BTC/USD) from different exchanges like Binance, Bybit, Kucoin, and others.
Multiple Exchanges: The volume data is aggregated from each selected exchange and plotted as a single volume value on the chart.
Real-Time Volume Plotting: The total aggregated volume is then plotted as a histogram on the chart, with the color of the bars changing depending on whether the price is rising or falling (typically green for rising prices and red for falling prices).
Inputs/Settings:
Exchange Selection: A list of checkboxes where users can choose which exchanges' volume data to include (e.g., Binance, Bybit, Kucoin, etc.).
Color Settings: Users can set the color for the histogram bars based on price direction (e.g., green for rising and red for falling).
Volume Calculation: The indicator calculates the volume for a specific cryptocurrency pair across selected exchanges in real-time.
Bullish/Bearish VolumeThe "Bullish/Bearish Volume" indicator helps traders identify discrepancies between price movement and trading volumes. Sometimes the price trends in one direction while trading volumes indicate opposing intentions among market participants. This indicator aims to identify such divergences, assisting traders in making more informed and balanced trading decisions.
Key features:
1. Directional Volume Differences: The indicator calculates volumes by separating them into two main categories: buying and selling. When the closing price is higher than the opening price, buying volume is shown in green, while selling volume is shown in red when the closing price is lower than the opening price. This accurate classification helps identify which volume type predominates in the current interval.
2. Histograms by Fixed Time Intervals: Collecting data from a fixed time interval (1 minute), the indicator analyzes and sums up buying and selling volumes regardless of the selected chart timeframe. This provides a more detailed market view, allowing traders to accurately gauge sentiment within any chosen timeframe.
3. Total Volume: The indicator aggregates buying and selling volumes, representing total trading activity in gray transparent bars. This gives traders a clear visual representation of overall volume activity in the market for a selected period.
4. Volume Delta and its Moving Average: The volume delta (the difference between buying and selling volumes) is highlighted in blue, allowing for monitoring shifts in the balance of buying and selling power. Additionally, the indicator includes a moving average of the delta, shown as a blue line, to smooth out short-term fluctuations and help traders easily identify long-term trends in volume shifts.
5. Volume Volatility: A histogram representing volume volatility offers insight into trading activity variability, uncovering abnormal spikes or lulls in market dynamics.
Bullish/Bearish Volume is a powerful tool that can break down market flows into understandable signals, enabling traders to better recognize imbalances and make informed decisions.
