Market First - Relative Strength/Weakness (the ZenBot strategy)This market-first trading strategy gives BUY, SHORT, and CLOSE signals based on volume, trend, and relative strength or weakness to the market (SPY by default, can be customized). This indicator is useful for signaling day-trade entries and exits for tickers that are strong (or weak) against the market.
Stocks that are showing relative strength (or weakness) to the market, are trending, and have decent movement generate a buy (or short) signal. When the trend runs out, a CLOSE signal is fired.
Potential profit (based on ATR) and actual profit is calculated, predicting the type of move expected
Unique 'stay in trade' logic helps prevent unnecessary CLOSE signals if a trend is likely to continue
A colored plot indicates the strength of the current trend and turns orange/red when the strength is weakened.
Crypto traders can uncheck 'Trade during market hours' for 24-hour trading, and should change the comparison ticker from SPY to BTCUSD or something similar for their market.
Enjoy!
KEY CONCEPTS
The three- and five-minute timeframes are used to establish and verify trend ( ADX /DI with custom logic)
Entries and exits are based on Parabolic SAR and confirmed on multiple timeframes, trend, and relative volume
Relative strength /weakness to the market compares ticker to SPY
Chop is avoided at all costs. I've experimented with choppiness indicator below 38, but found that the ADX DI+/- readings work even better.
Trend is established using ADX DI+/- readings over 20, confirmed by EMA 5/13 crossover and EMA5 slope
Signals will fire only if the average volume for the current 5-min bar is above normal
Only tickers with a five-bar / 13 period ATR of 1% the ticker's price generate signal.
Only longs above daily-anchored VWAP , shorts below daily-anchored VWAP
Signals fire on bar close to prevent repainting / look-ahead bias
Indicator labels and alerts generated
SIGNALS
BUY: up-trending tickers showing relative strength are bought on the three-minute PSAR
SELL: when the close price falls below the 1, 3, and 5-minute PSAR, or the ADX DI- falls below 20
SHORT: down-trending tickers with relative weakness are shorted on the three-minute PSAR
COVER: when the close price moves above the 1, 3, and 5-minute PSAR, or the ADX DI- falls below 20
ALERTS
Alerts are generated on BUY, SELL, SHORT, and COVER signals, as well as optional LOST RELATIVE STRENGTH and LOST RELATIVE WEAKNESS
INPUTS
Use relative strength /weakness comparison with the market : trigger trades based on the ticker's strength or weakness to the selected comparison ticker (usually SPY for equities or BTCUSD for crypto)
[* ]Comparison Ticker for relative strength /weakness : Ticker to compare against for relative strength /weakness
Trade during market hours only : Take buy/sells during specified hours. Disable this for crypto trading.
[* ]Market hours (market time) : Customize market hours - defaults to 9:30 to 16:00 EST
[* ]"Only trade very strong trends" : take trades only if an established trend is very strong ( ADX over 40 ) (DEFAULT = ON)
"Limit trade direction to VWAP" : Long trades only above VWAP , shorts below (DEFAULT = ON)
"Limit trade direction to Market direction" : Long trades only if SPY (or selected comparison ticker) is up, shorts if the market is down. (DEFAULT= ON)
"Limit trades based on a ticker's green/red status for the day" : Long trades if the ticker is green for the day, shorts if red. (DEFAULT = ON)
Cari dalam skrip untuk "volume"

Strategy Crypto -- double your capitalBTCUSD -- 5 min
BUY POSITION
1 : The price is above the hull suite indicator
2 : The hull suite indicator is green
3 : The volume oscillator indicator is above 0
4 : A new blue candle should appear on the QQE MOD indicator
SELL POSITION
1 : The price is bellow the hull suite indicator
2 : The hull suite indicator is red
3 : The volume oscillator indicator is above 0
4 : A new red candle should appear on the QQE MOD indicator

Dual Fibonacci Zone & Ranged Vol DCA Strategy - R3c0nTraderWhat does this do?
This is for educational purposes and allows one to backtest two Fibonacci Zones simultaneously. This also includes an option for Ranged Volume as a parameter.
Pre-requisites:
First off, this is a Long only strategy as I wrote it with DCA in mind. It cannot be used for shorting. Shorting defeats the purpose of a DCA bot which has a goal that is Long a position not Short a position. If you want to short, there are plenty of free scripts out there that do this.
You must have some base knowledge or experience with Fibonacci trading, understanding what is ADX, +DI (and -DI), etc.
You can use this script without a 3Commas account and see how 3Commas DCA Bot would perform. However, I highly recommend inexperienced uses get a free account and going through the tutorials, FAQ's and knowledgebase. This would give you a base understanding of the settings you will see in this strategy and why you will need to know them. Only then should you try testing this strategy with a paper bot.
Background
After I had created and released "Fibonacci Zone DCA Strategy", I began expanding and testing other ideas.
The first idea was to add Ranged Volume to the Fibonacci Zone DCA strategy which I wanted for providing further confirmation before entering a trade. The second idea was to add a second Fibonacci Zone that was just as configurable as the first Fibonacci Zone. I managed to add both and they can be easily enabled or disabled via the strategy settings menu.
Things Got Real Interesting
Things got real interesting when I started testing strategies with two Fibonacci zones. Here's a quick list of what I found I was able to do:
Mix and match exit strategies. I could set the Fib-1 zone strategy to exit with a take profit % and separately set the Fib-2 zone strategy to exit when the price crosses the top-high fib border
Trade the trend. A common phrase amongst traders is "the Trend is your friend" and with the help of an additional Fib Zone, I was able to trade the trend more often by using two different Fib Zone strategies which if configured properly can shorten time to re-deploy capital, increase number of closed trades, and in some cases increase net profit.
Trade both bull market uptrends and bear market downtrends in the same strategy. I found I could configure one Fib Zone strategy to be really good in uptrends and another Fib Zone strategy to be really good in downtrends. In some cases, with both Fib Zone strategies enabled together in a single strategy I got better results than if the strategies were backtested separately.
There are many other trade strategies I am finding with this. One could be to trade a convergence or divergence of the two different Fib Zones. This could possibly be achieved by setting one strategy to have different Fibonacci length.
Credits:
Thank you "EvoCrypto" for granting me permission to use "Ranged Volume" to create this strategy
Thank you "eykpunter" for granting me permission to use "Fibonacci Zones" to create this strategy
Thank you "junyou0424" for granting me permission to use "DCA Bot with SuperTrend Emulator" which I used for adding bot inputs, calculations, and strategy

Strategy Puma Trending StrategyThis script is a trading strategy, the structure originally made by the youtuber no nonsense forex.
It contains a combination of different indicators that contain different parameters an assets price and volume much reach before a trade is made.
Indicators include one for volume, volatility, baseline, zero cross indicator and a trigger indicator.

Cyatophilum 3Commas DCA Bot BacktesterAn indicator to backtest and automate 3Commas DCA Bots.
═════════════════════════════════════════════════════════════════════════
█ HOW IT WORKS
The indicator allows you to replicate your bot settings and get backtest results from the Strategy Tester and also a backtest panel with additional information on the safety orders.
You can also create alerts for each of the strategy events.
█ HOW TO USE
Choose a symbol that corresponds to your bot pair and exchange.
Pick a chart time frame as small as possible, usually 1 minute. The timeframe should always be smaller or equal to the deal start conditions timeframes.
Always use regular candle type.
Configure your deal start condition . You can combine several technical indicators to trigger an entry using a AND logical gate.
Configure your profit target
Use the Take Profit feature to set a target in percentage of price. You can also make it trail.
There is also a Stop Loss feature that is turned off by default.
Configure your safety orders
Replicate the safety orders from your bot into the indicator inputs.
Check your backtest parameters
Make sure that the initial capital and order size make sense. Since it is a pyramiding strategy with safety orders, the sum of all deals should not be bigger than the initial capital.
In this example: Initial capital is 0.02 BTC, which around 600$. I used 1000$ to be safe.
If you use % equity as order size, please note that it will create compounding.
Check the fees, by default they are set to 0.1%.
I also recommend to set a slippage that corresponds to your exchange's spread.
█ FEATURES
• Strategy direction
Configure wether to go long or short.
• Deal Start Conditions
The current conditions available are:
- Up to 4 MTF Trading View ratings conditions (Buy/Sell, Strong Buy/Sell)
- Up to 4 MTF RSI with configurable start conditions (Less/Greater than, Crossing Up/Down)
- Up to 2 MTF Ultimate Oscillator with configurable start conditions (Less/Greater than, Crossing Up/Down)
- MTF BB%-20-1 (length-deviation) with configurable start conditions (Less/Greater than, Crossing Up/Down)
- MTF BB%-20-2 (length-deviation) with configurable start conditions (Less/Greater than, Crossing Up/Down)
- Up to 2 MTF TA presets with the following options (Bollinger Bands, MFI, CCI, MACD, PSAR, SMA crosses, Heikin Ashi)
• Stop Loss and Take Profit
Configure your stop loss and take profit for long and short trades.
You can also make a trailing take profit.
• DCA (Safety orders)
Create up to 100 safety orders with configurable options for step and volume scaling, take profit from total volume, base and safety order size.
• Backtest Settings
Choose a backtest period, longs or shorts, wether to use limit orders or not.
Graphics
A Configuration panel with all the indicator settings, useful for sharing/saving a strategy.
A Backtest Results panel with additional information from the strategy tester.
█ ALERTS
The indicator is using the alert() calls: it only uses 1 alert slot to send order messages for each event (Long/Short entry, stop loss, take profit, safety order). This means free TV plans can create 1 complete strategy.
To set your alert messages, open the indicator settings and scroll to the bottom of the "inputs" tab.
Create your alert after you set the messages in the indicator settings, and make sure "Any alert() function call" is set in the alert option.
█ BACKTEST RESULTS
The backtest settings used in this snapshot are the following:
Initial Capital: 1000€
Order size: 0.003 BTC
Commission: 0.1 % per order
Slippage : 1 tick
Please read the author instructions below for access.

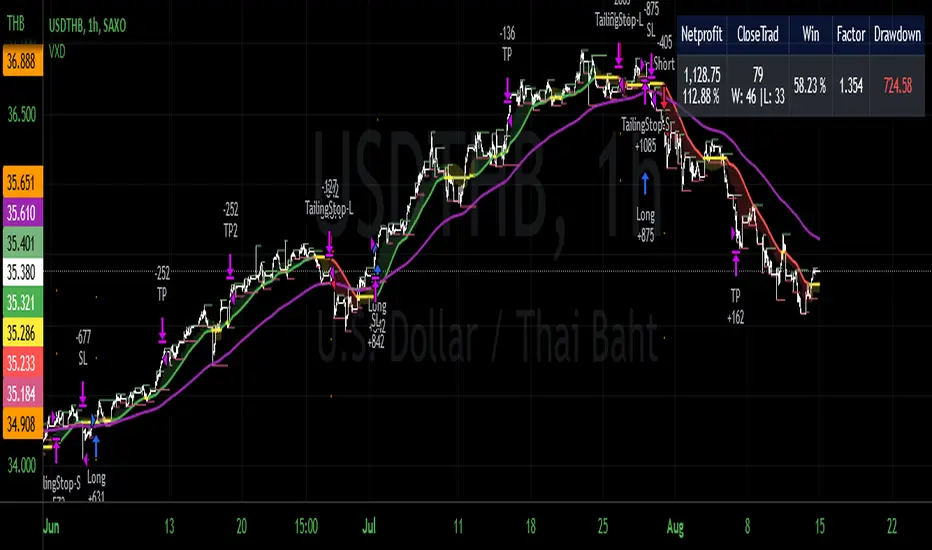
VXD Cloud EditionVXD Cloud Edition.
to overcome sideways market conditions this cloud configured for low timeframe.
every TA is same as VXD Supercycle but show as cloud.
Symbols on chart show Premium and Discount Prices
X-Cross = Engulfing Candle with weak volume .
O-circle - Engulfing Candle with strong volume .
Pivot point and Rejected Block
Pivot show last High and low of a price in past bars
Rejected Block show when that High or Low price are important level to determined if it's Hidden Divergence or Divergence (with RSI)
Setting
Momentum: RSI = 25 , RSI MA = 14
Trend: Rolling VWAP and ATR and Subhag (Everthing show as a cloud)
Trailing STOP: ATR 12 x 2.4
Highlight Bars color when volume is above SMA 6
SMA200 act as TP Line
Risk:Reward Calculation
if Buy your Stoploss will be previous Pivot low
if Sell your Stoploss will be previous Pivot high
and TP line will be calculated form there, then show in Orange color line
Buy condition : Close is above Cloud and close above pivot high
Sell condition : Close is below Cloud and close below pivot low
Trip : add this to alerts setting.
Order {{strategy.order.action}} filled on {{ticker}} @ {{strategy.order.price}} {{strategy.order.alert_message}}.
Oversold RSI with tight SL Strategy (by Coinrule)This is one of the best strategies that can be used to get familiar with technical indicators and start to include them in your trading bot rules.
ENTRY
1. This trading system uses the RSI ( Relative Strength Index ) to anticipate good points to enter positions. RSI is a technical indicator frequently used in trading. It works by measuring the speed and change of price movements to determine whether a coin is oversold (indicating a good entry point) or overbought (indicating a point of exit/entry for a short position). The RSI oscillates between 0 and 100 and is traditionally considered overbought when over 70 and oversold when below 30.
2. To pick the right moment to buy, the strategy enters a trade when the RSI falls below 30 indicating the coin is oversold and primed for a trend reversal.
EXIT
The strategy then exits the position when the price appreciates 7% from the point of entry. The position also maintains a tight stop-loss and closes the position if the price depreciates 1% from the entry price. The idea behind this is to cut your losing trades fast and let your winners ride.
The best time frame for this strategy based on our backtesting data is the daily. Shorter time frames can also work well on certain coins, however in our experience, the daily works best. Feel free to experiment with this script and test it on a variety of your coins! With our backtesting data a trading fee of 0.1% is taken into account. The fee is aligned to the base fee applied on Binance, which is the largest cryptocurrency exchange by volume. In the example shown, this strategy made a handsome net profit of 39.31% on Chainlink with 61.54% of trades being profitable.

Oversold RSI with Tight Stop-Loss Strategy (by Coinrule)KRAKEN:LINKUSD
This is one of the best strategies that can be used to get familiar with technical indicators and start to include them in your rules on Coinrule .
ENTRY
1. This trading system uses the RSI (Relative Strength Index) to anticipate good points to enter positions. RSI is a technical indicator frequently used in trading. It works by measuring the speed and change of price movements to determine whether a coin is oversold (indicating a good entry point) or overbought (indicating a point of exit/entry for a short position). The RSI oscillates between 0 and 100 and is traditionally considered overbought when over 70 and oversold when below 30.
2. To pick the right moment to buy, the strategy enters a trade when the RSI falls below 30 indicating the coin is oversold and primed for a trend reversal.
EXIT
The strategy then exits the position when the price appreciates 7% from the point of entry. The position also maintains a tight stop-loss and closes the position if the price depreciates 1% from the entry price. The idea behind this is to cut your losing trades fast and let your winners ride.
The best time frame for this strategy based on our back testing data is the daily. Shorter time frames can also work well on certain coins, however in our experience, the daily works best. Feel free to experiment with this script and test it on a variety of your coins! With our back testing data a trading fee of 0.1% is taken into account. The fee is aligned to the base fee applied on Binance, which is the largest cryptocurrency exchange by volume. In the example shown, this strategy made a handsome net profit of 52.6% on Chainlink with 66.67% of trades being profitable.
You can execute this strategy on your favorite exchanges with Coinrule .

HARSI - The WHALE v2This strategy is credited to the "Heikin Ashi RSI Oscillator" By JayRogers.
The core of this strategy is "Heikin Ashi RSI Oscillator (HARSI)" By JayRogers, with multiple confirmation indicators. The buy signal is generated by HARSI when there is green HA, and there is a positive stochastic cross under the line OB line.
To confirm the buys signal, you can use one or all of the following:
- EMA: the buy confirmation is positive if the candle closes above the EMA.
- Volume Oscillator: the buy confirmation is positive if the volume value is above the zero line.
- ADX: the buy confirmation is positive if the D+ is above the D- and the D+ is above the threshold level.
- Vortex: the buy confirmation is positive if VI+ is above VI-.
You can enable the take profit, trailing stop loss (TSL), and stop lose (SL), if not, then the strategy will give a sell signal by itself when there is a negative stochastic cross above OB Extreme line.
Note, that the TSL arming value should be lower than the TSL %.
The strategy can give a different result based on your selection. However, the best timeframe is 4 hours without TP.

The Brain Trust Presets Strategies [BTC / ETH] [PrismBot] [Lite]This strategy contains 9 different timeframe strategies (2 strategy types with pre-adjusted filter options for the different timeframes) tailored to BTC ( Bitcoin ) and ETH ( Ethereum ) on Binance. While I've listed these prebuilt strategies for specific timeframes, they are versatile enough to be checked and tested on other timeframes, and exchanges as well. I have been careful to avoid any curvefitting or overfitting. Included is useful default order settings, but we wanted to ensure you, the user, has control over the order settings for your own equity and trading.
These strategies are created, tailored, tested, and actively used by me.
It is up to you to do your own due diligence when testing these strategies on your exchange, and for your use, and PrismBot bears no responsibility for losses from the use of these strategies.
These strategies employ a variety of methods. Notable inclusions are other live strategies of mine including but not limited to:
ADX + MACD
RSI
Consolidations
Bull Bear Power
Volume Calculations
Open Interest Data
All of these setups include trend trading methods intended to maximize profitability in strong trending markets, and filters deployed to prevent failures in consolidation, though nothing is failproof.
You can control your leverage, quantity calculations, and other order settings. However, all other strategy input parameters are controlled by the strategy selectors.
Some strategies use 1.5 to 1 Risk to Reward ratio while others use 1:1.
How we execute trades for each strategy:
For 10m and 45m
we use a variety of settings for a Normalized MACD and ADX indicator. The thesis is we detect Normalized MACD crossovers at specific values and only allow trading of the strategy when the ADX is above a specific value.
For 15m, 1H, and 45m
we utilize the RSI crossovers of overbought and oversold and use the RSI moving average to filter trades. The thesis is we detect overbought for long and oversold for short.
For each strategy we use additional filters such as Bull Bear Power, Volume Flow, and Open Interest calculations to simply validate a trade.
Automatic Mode
In automatic mode, we detect your timeframe and current coin chart to decide one of the strategies from our database. If you want to manually select a different strategy or try the strategies on different cryptocurrencies, you can disable automatic mode entirely.

Compound strategyIn this strategy, I looked at how to manage the crypto I bought. Once we have a little understanding of how cryptocurrency is valued, we can manage the coins we have. For example, the most valuable coin in a coin is to sell when it is overvalued and re-buy when it is undervalued. Furthermore, I realised that buying from the right place and selling at the right time is very important to make a good profit. When it says sell, it's divided into several parts.
1. When the major uptrend is over and we are able to make the desired profit, we will sell our holdings outright.
2. Selling in the middle of a down trend and buying less than that amount again
3. When a small uptrend is over, sell the ones you bought at a lower price and make a small profit.
The other important thing is that the average cost is gradually reduced. Also, those who sell at a loss will reduce their profit (winning rate), so knowing that we will have a chance to calculate our loss and recover it. I used this to write a strategy in Trading View. I have put the link below it. From that we can see how this idea works. What I did was I made the signal by taking some technical indicators as I did in the previous one (all the indicators I got in this case were directional indicators, then I was able to get a good correlation and a standard deviation. I multiplied the correlation and the standard deviation by both and I took the signal as the time when the graph went through zero, and I connected it to the volume so that I could see some of the volume supported by it.)
Now let me tell you a little bit about what I see in this strategy. In this I used the compound effect. That is, the strategy, the profit he takes to reinvest. On the other hand, the strategy itself can put a separate stop loss value on each trade and avoid any major loss from that trade. I also added to this strategy the ability to do swing trading. That means we can take the small profits that come with going on a big up trend or a big down trend. Combined with Compound Effect, Stop Loss and Swing Trading, I was able to make a profit of 894% per annum (1,117.62% for 15 months) with a winning rate of 80%. Winning rate dropped to 80% because I added stop loss and swing trading. The other thing is that I applied DCA to this in both the up trend and the down trend (both). That was another reason for me to make a good profit. The orange line shows how to reduction of costly trade. The yellow line shows the profit and you can see that the profit line does not go down during the loss trades. That's because I want to absorb the loss from that trade.
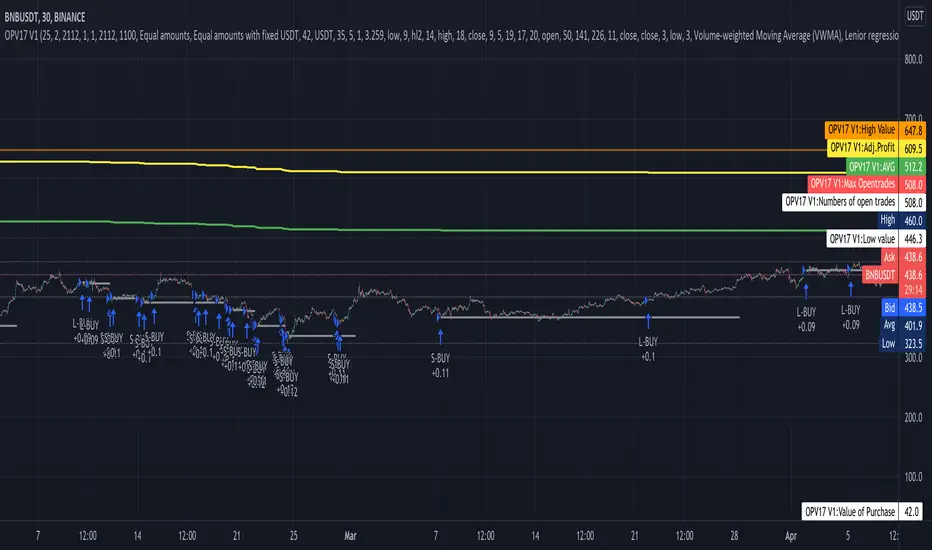
VOLLY PRICE CONVERGETriggers:
Long = Price and Volume ma's move up
Close trade = crosses ma, volume and price move in different directions

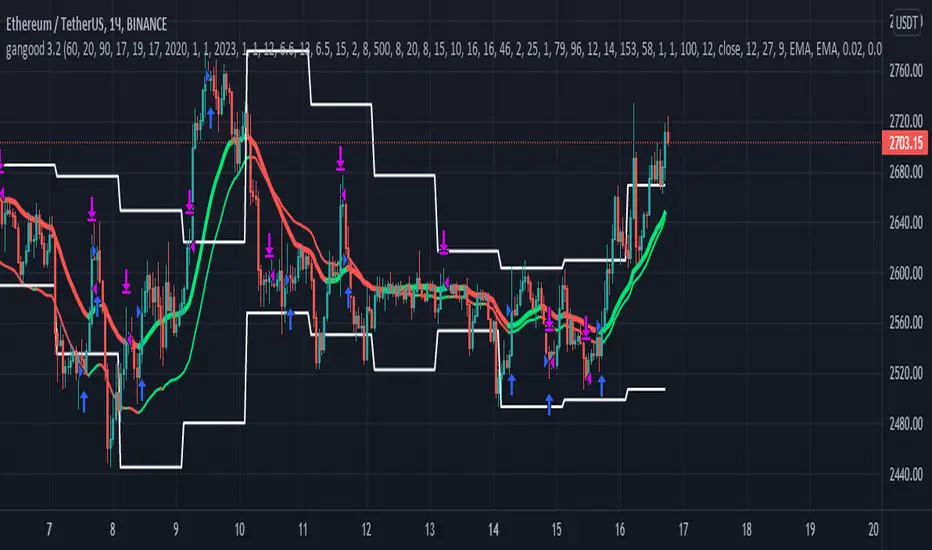
gangood bot for FinandyGangood is a mean reversion algorithm currently optimized for trading the ETH/USDT pair on the 1 hour chart time frame. All indicator inputs use the closing price of the period, and all trades are executed at the open of the period following the period in which the trading signal was generated.
To take into account slippage, the commission costs 0.15%.
Backtest result from 2020.
Result since 2019 2,500,000%, maximum drawdown 18%
This bot uses 11 indicators:
1) ADX
2) RANGE FILTER
3) SAR
4) RSI
5) TWAP
6) JMA
7) MACD
8) VOLUME DELTA
9) VOLUME WEIGHT
10) MA
11) TSI
Pattern 1:
There are 3 main components that make up Gangood: I. Trend Filter. The algorithm uses a version of the ADX indicator as a trend filter to only trade during certain time periods when price is most likely to be range-bound (i.e., average retracement). This indicator consists of a fast ADX and a slow ADX both using the same lookback period.
The ADX is smoothed with a 6-period EMA and the slow ADX is smoothed with a 12-period EMA. When the fast ADX is above the slow ADX , the algorithm does not trade because it indicates that the price is most likely trending, which is bad for a mean reversion system. Conversely, when the fast ADX is below the slow ADX, the price is likely to be in a range, so this is the only time the algorithm is allowed to trade. II. Bollinger Bands When the trend filter allows trading, the algorithm uses Bollinger Bands.
Indicator for opening long and short positions. The Bolliger Bands indicator has a 20 lookback period and a 1.5 standard deviation for both the upper and lower bands. When the price crosses the lower band, a buy signal is generated and a long position is opened. When the price crosses the upper band, a sell signal is generated and a short position is opened.
Pattern 2:
Based on RSI which is commonly used as a trend reversal indicator. However, here it is used as a trend-setting indicator, often with great success. This pattern only takes long trades, which is quite successful in a bull market.
Pattern 3:
Long or short trades are determined by the intersection of the fast EMA with the slow EMA for long positions and vice versa for short positions. Trades should only occur close to intersections. We then use the MACD for the long position. an indicator with a 10-minute time frame where we look for high peaks in negative values for longs and vice versa for shorts. They should be significantly higher than the other peaks.
Capital Management:
The maximum leverage in this strategy, I would recommend 2x, in order to trade without unnecessary risks and keep your nerves in order.
Bot setup:
I use the Finandy terminal, in which you can easily trade with this strategy.
1. We go to binance and turn on the hedging mode, this is necessary so that if tradingview sends a webhook for buying later than for selling.
2. Adding a new signal to Finandy
2.1. Open tab
2.1.1. "Order side" Strategy
2.1.2. "Amount" Balance% x Leverage
2.1.3. We set the percentage of the order two times less than the one you want
2.1.4. "Shoulder" is twice as large as the one you want
2.2.Close tab
2.2.1. "Enebaled" tick
2.2.2. "Reverse / Close" Disable
3. Set a notification for this strategy.
4. Copy "Signal URL" and paste it into webhook on tradingview
5. Copy "Signal Message" and paste it into the message on tradingview
boonam17_ALERT이용 관련 문의는 이메일 boonam17@naver.com 통해 해주시기 바랍니다.
백테스트 결과와 실제 투자 결과는 개인 블로그를 통해 업데이트할 계획입니다.

Inside Breakout PerQuantumCoin Premium Indicator (strategy)HOW IT WORKS:
- The Inside Breakout gives signals on the chart on the breakout of inside bar chart pattern;
- It allows to trade trend or counter-trend signals;
- Computes intrinsic values to access the strength of the Buy/Sell signal;
- Allows users to adjust their own settings, adapting the signals produced;
- These signals can be also set up as Alerts;
- The indicator has a few custom features that allows users to filter out signals using multi-timeframe trend indicator and to keep tracking positions so that one can only get new signals when they reserve position;
This Strategy version is meant to be a companion to the main indicator in order to backtest your SLT/TP settings with different instruments and adapt results.
Please NOTE:
Results may vary depending on TP/SL settings. Also, previous performance is not a indicator for future results.

Сatching knivesThis strategy is based on the regression line and volume
The Linear Regression Channel is a three-line technical indicator that displays the high, low and midpoint of the current trend.
How does it work in strategy?
If there is a deviation by a given percentage, the entry occurs
//LOGIC ENTRY
-Length-сhannel length
-Deviation-deviation of the boundaries, the higher , the rarer the entries
-% low for regression-deviation directly from the boundaries, the higher the number, the less frequent the entries
-Required % down bar-additional condition for entry (the candle on which the entry takes place from the logic must necessarily fall by a given percentage)
-Volume-the volume, which must be larger by the number of times you specify ( you can set the volume lower, but for better entries, you need to set the deviation percentages higher!)
//EXIT SETTING
Take profit and stop loss when a certain percentage is reached
//SETTINGS NEXT ENTRY AND GRID
Allow signal lower than,% - the next entry into a trade from logic occurs only when a decrease by a certain percentage
Allow grid,% - when the price drops by the percentage specified in the settings, the entry will take place, but only on the next bar.
//DATA RANGE
-Testing results for any period of time
//
Default settings for infrequent but relatively accurate entries for TF 1 hour.
It costs pyramiding 5 and take profit 5%. Choose the flavors of your choice!
Good luck!

CryptoGraph Multi Algo StrategyThis is a summary of how this strategy works.
CryptoGraph Multi Algo Strategy is the second profitable real-time trading strategy by the CryptoGraph team, that generates trade signal with exact entires, exits and risk management. The strategy is intended to work nearly every crypto coin pair, stock or index.
Principles behind the strategy
Entry:
Detection of trend direction with the use of an EMA . Default setting is a length of 550.
Detection of shorter term trend direction with the use of multiple Supertrend Indicators.
Detection of an even shorter term direction with the use of a crossover of the Stochastic RSI , below or above certain levels. This would be the final condition for an entry signal.
Exit:
Once an entry signal has fired, the script will look at the current ATR Value. In the script settings there will be an option to adjust the ATR factor. While ATR factor is equal to 1, it means it will use the default ATR value distance from the candle close. When ATR factor is for example 2, it will use two times the ATR distance from the candle close.
This is a simple representation of how this strategy works, in reality there are more underlying factors.
To find the best settings for the crypto coin pair or stock you want the strategy to trade with, simply switch up the EMA , ATR Profit Multiplier and ATR Stop Multiplier and experiment which settings would fit your style best.
What to look for when testing coins or stocks?
EMA, default exponential moving average is set to 550. When above the line, it will only look for longs, when below it will only look for shorts.
The Take Profit and Stop Loss are based on ATR multiplications, adjust these in the inputs interface and you will see the exits change.
Default parameters of the strategy
This is only an example of a profitable combination of all parameters. This would be the 30 minute timeframe Bybit chart on Bitcoin.
ATR take profit at x2, ATR stop loss at x4.1.
In this example we are using an initial capital of $1.000,- while each trade 100% of this capital is used and compounds over time. Meaning every profit or loss will be added to the next trade. Also there is a 0.05% commission used based on Bybit, since we expect most trades to market in and limit out.

Kitti-Playbook 2 MA Simulation R0 Jan 26 2022
Objective : Analysis the result of 2 moving averages from 12 Types X 12 Types of Moving average by realtime visualization dashboard
Study 2 MA and response to Buy Sell Signal
The movement of Equity
Simulate Money management
Type of MA
1)SMA Simple Moving Averages (SMAs) , use sma() function
2)EMA Exponential Moving Averages (EMAs) use ema() function
3)WMA Weighted Moving Averages (WMAs)", use wma() funvtion
4)RMA Adjusted exponential moving averages (also known as Wilder's exponential moving average) (RMAs)" , use rma() function
5)SWMA Symmetrically-Weighted Moving Average (SWMA)", use swma() function ( 4 prd )
6)ALMA Arnaud Legoux Moving Average (ALMA)", use alma() function
7)VWMA Volume-Weighted Moving Average (VWMA)", use vwma() function
8)VWAP volume-Weighted Average Price (VWAP)", use vwap()function
9)hull Moving Average (HMA)" use hma() function
10) Double exponential moving averages (DEMA)
fDEMA(S,L) =>
DEMA= ema(S,L)*2 - ema(ema(S,L) ,L)
11) Triple Exponential Moving Average (TEMA)
fTEMA(S,L) =>
TEMA = (3*ema(S,L)) - (3*ema(ema(S,L) ,L)) +ema(ema(ema(S,L) ,L),L)
12) CDC Action Zone V3 = EMA function
Program Flow
1) Initial Strategy Setting
2) Initial Input Setting
3) Data Processing
4) Information of System selection
5) STRATEGY Entry And Exit
6) Dashboard for result Trading result /

action zone - ATR stop reverse order strategy v0.1 by 9nckACTION ZONE-ATR MOD v0.1 DOCUMENTATION
Overview
This tradingview pine script strategy is mainly created to enrich my coding skill. It is a combination of “CDC-ACTIONZONE” and my personal studies of trading techniques in various sources e.g.book, course or blog. This strategy purposefully built to connect with my automatic trading bot. However, It will be very useful to aid your trading routine by diminishing mental distraction which possibly leads to bad trades.
How does it work?
This strategy will do a basic simple thing that most traders do by creating entry signals on both sides long/short and also set the stop loss. Furthermore, It will also reverse the order (from long to short and vice versa (if long/short conditions are met). Finally, it will recalculate the stop loss/take profit price in every complete bar to increase the chance of winning and limit our loss.
Entry rules(Long/Short)
If you have no open order, an order will be created when a fast EMA crosses(up(long)/down(short) the slow EMA(It’s as simple as that).
If you have an open order, the current order will be (sold if long, covered if short) and the opposite side order will be created.
Exit and Reverse rules(Long/Short)
If fast EMA cross (DOWN(long), UP(short)), the current order will be closed, THE OPPOSITE SIDE ORDER WILL ALSO BE CREATED.
Risk management
FLEX STOP PRICE : initial value will be set at the bar which order created. It is a fast ema (+/-) MIDDLE ATR value.
If MIDDLE ATR value rises, it will be our new stop price.
If MIDDLE ATR value falls, stop price unchanged
If Price OVERBOUGHT(long)/SOLD(short), LOW of that bar will be a new stop price.
Minimum position hold period
In order to eliminate risk of repeatedly open, close orders in sideway trends. Minimum hold period must be passed to start exit our position. However, It always respects stop loss prices. The value refers to the number of bars.
MUST READ!!!
This strategy uses only MARKET ORDER. If you trade with a bot, make sure you choose only enormous market cap tokens.
This strategy is bi-direction strategy. It will work best in the DERIVATIVE market.
It was initially designed to compete in the cryptocurrency market which has very high volume and volatility.
I only use this strategy in 1HR (acceptable change rate, optimum trade frequency)
How (should) we use it?
Choose crypto future pairs (recommend only top 10-15 market volume pairs in Binance, let’s say 1000M+ trade value)
Choose your time frame (1H is strongly recommended)
Setup your portfolio profile (Setting->Properties) such as Initial cap, order size, commission. DO NOT USE CAL ON EVERY TICK IT WILL CAUSE REPAINTING AND YOUR CAPITAL IS BLEEDING !!!
BACKTEST FIRST!! Back test is a combination of art, math and statis(and a bit of luck). You can apply to train and test methods or whatever you are familiar with. In my opinion, your test period should include UPTREND, SIDEWAY, DOWNTREND. Fine tune fast, slow ema first(my best ema length of 1H timeframe around 7-10, 17-22). Try to eliminate fault breakout trade and use other options only necessary. Hopefully we can use automatic optimization on Pine Script soon.
Don’t forget to turn off using a specific backtest date option to start your strategy.A
THIS IS NOT A PERFECT (OR EVEN PROFITABLE) STRATEGY. USE AT YOUR OWN RISK AND TRADE RESPONSIBLY. DYOR DUDE.

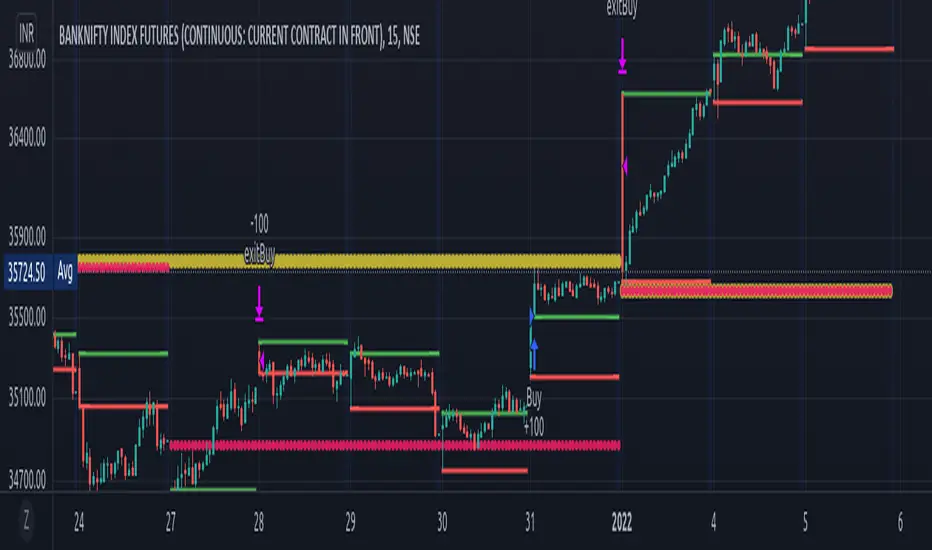
yuyutsu-banknifty-beta"yuyutsu-banknifty-beta" indicator is a strategy especially made for NSE/BSE Banknifty. Strategy has various sub strategies which can be selected to check back tested accuracy and profit factor. Strategies works best on 3m /15m for intraday. Sub strategy "Swing" can be applied on either nifty and banknifty.
I have also added checkboxes for 3m/15m which implictly selects best combination for desired results.
Below are the sub strategies which user can use and perform back testing.
HMA
Daily Weekly Closing
Daily Monthly Closing
Pivot
Previous day open close
Gap up/down
75m analysis
ORB
Swing
TDI
VMWA
VWAP
Ripster clouds
TENKAN BOLTTENKAN BOLT
7 major point in this indicator are as follows :-
•Tenkan-sen
•Ichimoku Cloud
•Exponential Moving Average
•Change of Volume Analysis (calculated in background)
•Modified Keltner Channel (calculated in background)
•RSI Divergence (calculated in background)
•Entry and Exit Point
www.tradingview.com
There will be 2 types of Long entry alert and 2 types of Short entry alert.
•The first one is marked as "Long" or "Short" only which indicates the signal calculated by Keltner Channel, Tenkan-sen and change of volume in sudden time.
•The second one is marked as "Long Divergence" and "Short Divergence" which indicates signal by RSI Divergence in my own way (not aggressive).
The idea of this script is only trade the highest probability setup and I shall call it the "High Probability, Probability Trading". This is definitely not a buy or sell call as the idea of the script is to give a good direction for trader and to learn the high probability trading setup which includes the volatility of the market.
This script specifically created for Futures Crude Palm OIL (FCPO) market and may works differently in different market. It works great in 1 minute time-frame and 3 minute time-frame
(with slight adjustment).
Kindly contact me for usage. Thanks!

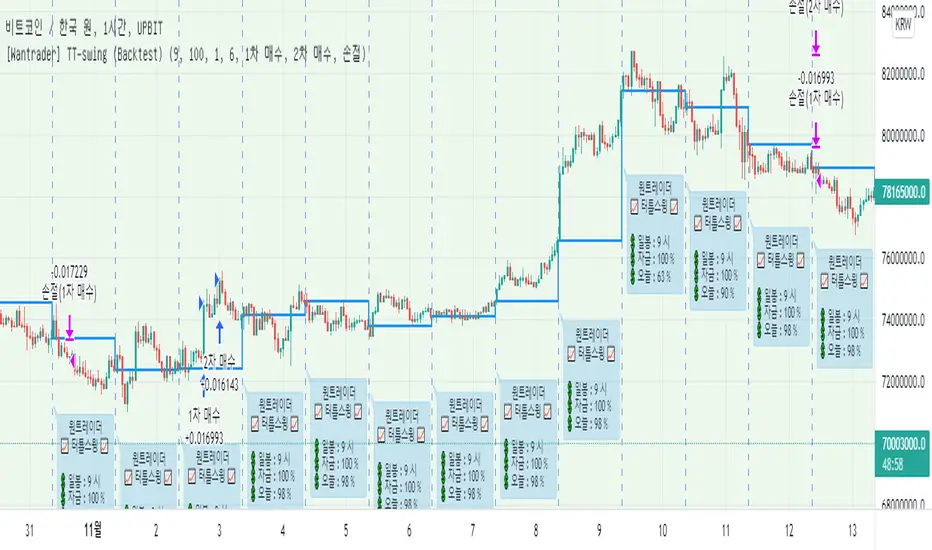
[Wantrader] Turtle Swing Strategy (Backtest)This is the Wantrader's turtle swing strategy.
It's a transformation of Richard Danis' Turtle Trading.
It's the best strategy for and
Please choose 1H time frame
If the date is the future than today, only show you until yesterday
No repaint
"It's a mid-term trend swing strategy."
- Enter a specific standard of reporting price and liquidate it at a new low price.
- It's a long-only strategy without short trade.
- It has high market adaptability in response to market volatility.
- We have minimized over-optimization factors so that they can work well in the future
"The efficiency has been increased by delicate control of entry volume."
- Control losses by managing funds in line with market changes
- Calculate the leverage on the day automatically
- It goes in more when it's advantageous and less when it's disadvantageous
- It's a welfare strategy that works against assets
"We further lowered the risk by cutting off and buying in installments"
- If you deviate from the trend of mid-term price indicators, you will escape.
- It was purchased in installments twice, increasing the confidence of entry
======================================================================
리처드 대니스의 터틀트레이딩을 변형한
원트레이더 터틀 스윙 전략 입니다.
비트코인, 이더리움 에 가장 잘 맞는 전략이며
1H 타임프레임으로 선택해주세요
백테스트 버전은 전일까지만 확인 가능합니다. (당일 진입 확인 불가)
리페인트는 발생하지 않습니다.
"중기 추세 스윙 전략입니다."
- 특정기준의 신고가에 진입, 신저가에 청산합니다.
- 숏은 없는 롱 온리 전략입니다.
- 시장 변동성에 따라 대응하여 시장 적응력이 높습니다.
- 과최적화 요소를 최소화 하여 미래에도 잘 작동 할 수 있도록 만들었습니다.
"섬세한 진입 물량 제어로 효율을 높였습니다."
- 시장 변화에 맞춰 자금관리를 하여 손실을 제어합니다.
- 당일 레버리지를 매일 자동으로 계산합니다.
- 유리할때 더 들어가고, 불리할때 적게 들어갑니다.
- 자산대비로 작동하는 복리 전략입니다.
"손절과 분할매수로 리스크를 더욱 낮췄습니다."
- 중기 가격지표 추세 (모멘텀에 가까움)를 이탈 시 탈출합니다.
- 2회에 걸쳐서 분할매수 하여, 진입 확신도를 높였습니다.
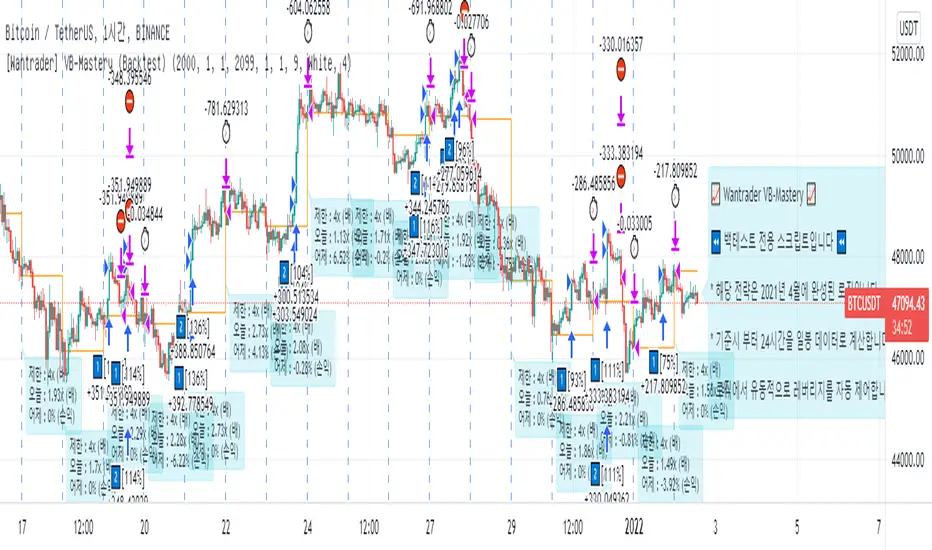
[Wantrader] Volatility Breakout Strategy - Mastery (Backtest)This is the Wantrader's volatility breakthrough version 9,
which developed Larry Williams' volatility breakthrough strategy.
It has been 4 months of development and 8 months of practice.
It's the best strategy for and .
Please choose 1H time frame.
If the date is the future than today, only show you until yesterday.
No repaint.
"As a long-only day trend strategy, we pursue profits in the downward / transverse / rising market."
- It will be exited based on the closing price of the day as a strategy to take only the day trend.
- It's a long-only strategy without short trade.
- It has high market adaptability in response to market volatility.
- We have minimized over-optimization factors so that they can work well in the future.
"The efficiency has been increased by delicate control of entry volume."
- Control losses by managing funds in line with market changes.
- Calculate the leverage on the day automatically.
- It goes in more when it's advantageous and less when it's disadvantageous
- It's a welfare strategy that works against assets
"We further lowered the risk by cutting off and buying in installments."
- If you judge that the trend has declined on the day, you will break off and respond to a sharp drop.
- It was purchased in installments twice, increasing the confidence of entry
========================================================================================
래리윌리엄스의 변동성돌파전략을 발전시킨
원트레이더 변동성돌파 버전9 입니다.
2021년 1월부터 4개월 동안 개발하여
2021년 4월 부터 '8개월 간의 실전테스트 기간을 가졌습니다.'
비트코인, 이더리움 에 가장 잘 맞는 전략이며
1H 타임프레임으로 선택해주세요
백테스트 버전은 전일까지만 확인 가능합니다. (당일 진입 확인 불가)
리페인트는 발생하지 않습니다.
롱 온리 당일 추세 전략으로 하락/횡보/상승 장에서 수익을 추구합니다.
- 당일 추세만 취하는 전략으로 일봉 종가 기준 청산됩니다.
- 숏은 없는 롱 온리 전략입니다.
- 시장 변동성에 따라 대응하여 시장 적응력이 높습니다.
- 과최적화 요소를 최소화 하여 미래에도 잘 작동 할 수 있도록 만들었습니다.
섬세한 진입 물량 제어로 효율을 높였습니다.
- 시장 변화에 맞춰 자금관리를 하여 손실을 제어합니다.
- 당일 레버리지를 매일 자동으로 계산합니다.
- 유리할때 더 들어가고, 불리할때 적게 들어갑니다.
- 자산대비로 작동하는 복리 전략입니다.
손절과 분할매수로 리스크를 더욱 낮췄습니다.
- 당일 추세가 꺾였다고 판단하면 손절하여, 급락에 대응합니다.
- 2회에 걸쳐서 분할매수 하여, 진입 확신도를 높였습니다.