Volume Spectrum - WhvntrThe "Volume Spectrum" by Whvntr has been developed to analyze and visualize trading volume patterns in financial markets, offering traders insights into volume dynamics relative to historical performance. This tool can be particularly useful for identifying periods of unusually high or low trading activity, which are often associated with significant price movements.
Intended Markets and Conditions
The Volume Spectrum indicator is versatile and can be applied across a variety of markets, including stocks, forex, commodities, and cryptocurrencies. It is designed to be relevant in both bullish and bearish markets, as well as in varying volatility conditions. The primary focus is on identifying shifts in trading volume that could indicate potential trading opportunities or risks.
Features and Relevance for Trading
Volume Analysis: The indicator calculates and plots the average volume over a user-defined period (length) and compares it to a shorter-term average volume (avg_length). This comparison helps in identifying trends in trading volume.
Smoothing Options: Users can select from four types of smoothing methods (RMA, SMA, EMA, WMA) to calculate the moving averages, allowing for customization based on trading strategy and personal preference.
High and Low Volume Identification: It highlights periods of high and low volume relative to the average, using customizable color schemes for easy visual identification.
Volume Alerts: The script generates alerts for significant increases or decreases in volume, enabling traders to react promptly to potential trading signals.
Customizability: Traders can adjust various parameters, including volume length, average length, smoothing method, and visual elements like plot colors and background highlights.
Volume Histogram: An optional volume histogram can be displayed, with colors indicating whether the volume is increasing and if the closing price was higher or lower than the opening price.
This indicator can be particularly relevant for traders looking to capitalize on volume-based trading strategies. High volume periods may indicate strong interest in a security at its current price, whereas low volume may suggest a lack of interest. By identifying these conditions, traders can make more informed decisions about entry and exit points.
Disclaimer
The Volume Spectrum indicator, like any analytical tool, should be used as part of a comprehensive trading strategy. It is important to note that past performance is not indicative of future results. Trading involves risk, and the effectiveness of this or any indicator may vary based on market conditions, settings used, and other factors. Traders should exercise caution, do their own research, and consider seeking advice from a financial professional before making trading decisions. This indicator is provided without warranty regarding its accuracy, timeliness, or completeness, and users assume all risks associated with its use.
Cari dalam skrip untuk "volume"

Volume+This volume indicator uses a long WMA to establish an average volume and calculates the standard deviation based on that average. Each deviation level from 1 to 3 is also plotted with the bar color gradually increasing in intensity when more than one standard deviation is exceeded.

Volume Spike 20%+This indicator highlights volume spikes that exceed the 20% threshold above the 20-period simple moving average of volume.
🔹 Gray bars: Normal volume
🔹 Green bars: Volume is at least 20% higher than the 20-period average
🔸 Orange line: The 20-period volume moving average
Use case:
This tool helps traders quickly spot abnormal trading activity or increased interest in a stock, which may precede a price breakout or reversal.
Simple, clean, and effective – perfect for momentum, breakout, or volume-based strategies.

Volume USDTName:
USDT Volume Bars (Directional Colors)
Description:
This indicator visualizes trading volume in USDT by multiplying the candle's volume by the average of its open and close prices. The result reflects a more realistic estimation of the traded value per candle.
🟩 Green bars: Bullish or neutral candles (close ≥ open)
🟥 Red bars: Bearish candles (close < open)
Useful for spotting high-value inflows and outflows based on actual price-weighted volume.

Volume Pulse: Mobile-Optimized Candle Volume Viewer✨ Description ✨
Sleek. Simple. Sexy.
A modern, minimal volume tracker designed for mobile and desktop users who want clean data without clutter.
✅ Displays the volume of the last N candles with intuitive green/red background colors based on candle direction (bullish/bearish).
✅ Automatically converts numbers into K/M/B format for quick understanding.
✅ Comes with a text size setting, so it's fully readable whether you're on a phone or desktop.
Perfect for traders who want to:
Spot volume spikes at a glance
Quickly compare recent candle volumes
Stay mobile-friendly with a visual style that actually fits

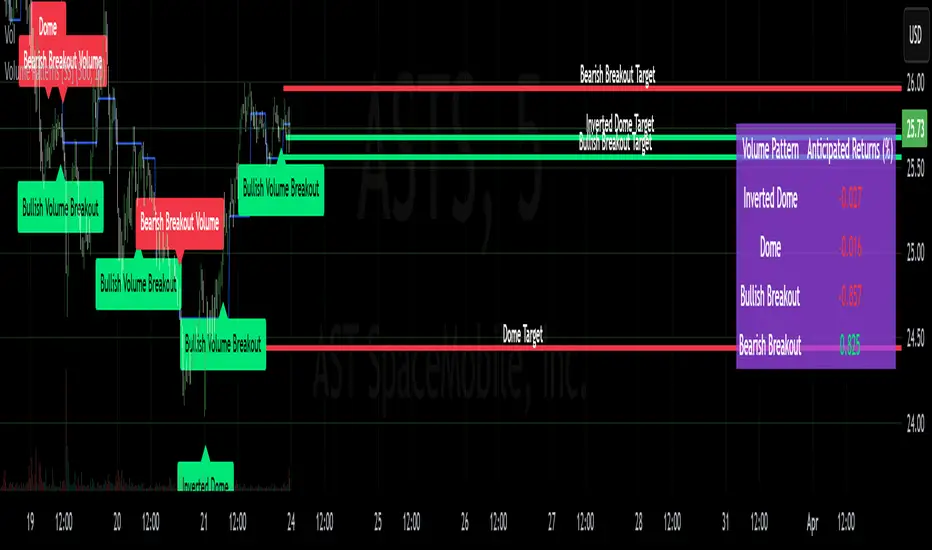
Volume Patterns [SS]Hey everyone,
Been a while since doing anything with Pinescript.
Here is my iteration of a Volume Pattern identification, inspired by Bulkowski's work on patterns and volume.
The indicator aims to identify the 4 major types of volume patterns, these are:
Bullish Breakout Volume
Bearish Breakout Volume
Inverted Domes
Domes
Classification
These patterns are all assigned to a classification based on theory. For example, dome volume is usually bearish, inverted dome is usually bullish, etc. etc. However, in order to accommodate changing sentiments and volatility, I have coded logic into the indicator to assess for the actual sentiment associated with these patterns itself.
The indicator calculates the average return associated with each pattern, scaling the data into a percent return. It then has the ability to re-scale the target using the close price associated with the pattern at the time of pattern signaling, to calculate the target price and plot the target on the chart for you.
Additionally, it provides you with the following:
Labels to signal when a pattern has happened
A table that shows you the average returns associated with the 4 major patterns
Target lines with labels that visually show you the target price associated with the pattern, as well as which pattern they are associated with.
All of these things can be toggled on or off depending on your preference.
Customizing the indicator
In addition to being able to toggle the visuals on or off depending on what you want to see or not see, there are some minor customization abilities in terms of training the indicator to recognize the patterns and predict the TP.
The first one is the Training length
In the settings, you will see "Train", and the default is 500. This is the amount the indicator is looking back in history to learn the patterns and returns associated with them. This 500 is appropriate in most cases and on most timeframes.
Lastly, the Lookforward Length
The look forward length represents the number of bars forward you want to determine the returns for. It is defaulted to 10, but you can modify it.
So, if you are on the 1-Minute chart and have the look forward set to 10, then once a signal happens, the target price is calculated based on 10 minutes from the time of signal. You can increase this or decrease this based on your preference.
Longer look forwards can be good for swingers but should be used on the larger timeframes, shorter are good for scalpers but should be used on the shorter timeframes.
The indicator's use is incredibly simple, you'll pick it up in no time!
Hope you enjoy it and as always, safe trades!
Just an FYI for those who may have questions:
The indicator is open source. This means you are free to take it and modify it as you wish. You do not need to ask me.
Please read the description carefully, as 100% of questions I am asked about indicators are covered in the description. ;-)
Have a good one guys and gals! 🚀🚀🚀
Volume Standard Deviation Alert GusPurpose
The script detects and alerts traders when the volume of a trading asset significantly exceeds a calculated threshold based on the standard deviation of volume over a specified lookback period. It optionally filters these alerts based on whether the price action is bullish or bearish.
Key Components
Inputs
lookback (default: 20)
The number of bars to consider when calculating the moving average and standard deviation of volume.
stdDevFactor (default: 2.0)
The multiplier for the standard deviation to determine the threshold for a volume spike.
alertOnClose (default: true)
Determines whether alerts should only be triggered after the bar has closed.
checkBullBear (default: false)
Enables filtering of alerts based on the bullishness or bearishness of the bar.
Calculations
volSMA
The simple moving average (SMA) of the volume over the lookback period.
volStd
The standard deviation of the volume over the lookback period.
threshold
The alert threshold is calculated as:
Threshold
=
volSMA
+
(
stdDevFactor
×
volStd
)
Threshold=volSMA+(stdDevFactor×volStd)
isBullish & isBearish
Determines whether the current bar is bullish (close > open) or bearish (close < open).
volumeSpikeCondition
A condition that triggers when the current volume exceeds the calculated threshold.
bullishCondition & bearishCondition
Refines the spike condition by requiring the bar to be bullish or bearish when checkBullBear is enabled.
finalCondition
The ultimate alert condition based on the user’s preference for bullish/bearish filtering.
finalTrigger
Ensures the alert only triggers at bar close if alertOnClose is set to true.
Visualization
Plots the SMA of the volume (volSMA) and the threshold line (threshold), helping traders visually understand the conditions.
Histograms the current volume and colors the bars:
Red: Volume exceeds the threshold.
Blue: Volume is below the threshold.
Alerts
The script generates an alert message when the finalTrigger condition is met:
"Bullish Volume Spike!" if the bar is bullish.
"Bearish Volume Spike!" if the bar is bearish.
"High Volume Spike!" if no bull/bear filter is applied.
Alerts are sent using alert() with the message and set to trigger once per bar close.
Usage
Traders can use this script to identify unusual volume activity, which often precedes significant price movements.
Customizability allows traders to tune the lookback period, standard deviation multiplier, and whether to filter for bullish/bearish spikes.
Visual and audible cues help in identifying important market events in real time.
This indicator is particularly useful for spotting market breakouts or breakdowns driven by high trading activity.

Volume TableDisplays a table of volume and short volume.
When chart timeframe is intraday or daily, table will show daily values. If chart is on weekly, table will show weekly values. If chart is on monthly, table will show monthly values.
If a ticker doesn’t have short volume, uncheck “Show Short Volume” in settings for table to work.
Table rows:
Date row (Day/Week/Month) text:
Green when close > open
Red when close < open
White when close equals open
Volume (Vol) row text:
Default: Black
If “Check for inside candles” is checked, when the high and low (or open and close if “Use H/L not O/C” is unchecked) is within the previous time period (day/week/month), text will be white
Volume (Vol) row background:
Default: Gray
Colored based on values and colors set in settings:
>= Very High Volume
>= High Volume
<= Low Volume
<= Very Low Volume
Short Volume (SV) row cell background color:
SV < “Lower Threshold”: Black
“Lower Threshold” <= SV < “Low Threshold”: Gray
“Low Threshold” < SV < First “Short Volume Color Increment”: Silver
“Short Volume Color Increment's (5 million increments by default): purple, blue, teal, green, lime, yellow, orange, red, maroon, white
Short Volume text color is just colored to be visible based on SV cell background.
There are labels that can be displayed to look back at data further back than the table goes (recommend being on the daily timeframe).

Volume Z-Score Bar ColorA simple script help you identify significant upticks in volume for a particular candle.
Using the standard z-score calculation you can change the bar color based on the user selected standard deviation range.
Calculation
z = (x - μ) / σ, where:
z: is the z-score
x: is the current volume
μ: is the mean volume
σ: is the standard deviation
Options include setting the bottom and top end of the deviation range. This will allow you to see a moderated uptick in volume as well as an extreme uptick. You can also choose the colors for the moderate bull/bear volume and extreme bull/bear volume.

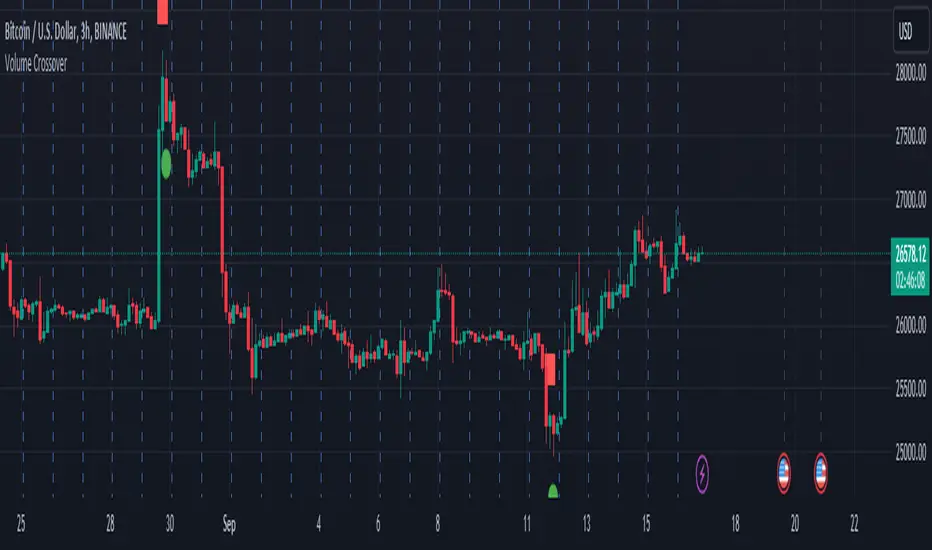
Volume Crossover StrategyThis script shows us the strength and acceleration of the trend, not the direction. ! . The indicator is built on the collision of two volumes (the collision of one-hour and four-hour volumes), where as a result one upward arrow shows us (acceleration, pressing the gas on the pedal), and the downward one shows deceleration (i.e. braking).
Recommendation: Be sure to attach:
a) any trend direction indicator (SMA, EMA), through which we will have an idea where the market is going and going:
b) volatility indicator
c) AD accumulation distribution (let's have a real picture, is there a buying or selling trend)
It is suitable for a one-hour timeframe
P.S. The script does not make any guarantee of profit, it is published only for the purpose of sharing my opinion about this strategy.
an hour ago
Comment:
The green signal is the start of the marathon, and the red signal is the end. For example, if the downward trend has ended (we can see it through the blue signal), it does not mean that the next marathon will necessarily be a reflected trend. It is not excluded that the next marathon will also develop on a downward trend...and therefore in the opposite case as well..
FBMKLCI VolumeVolume for FBMKLCI Malaysia. Note that the volume starts on 27th Oct 2020 due to the change of securities in index. There are 30 securities combined into single volume.

Volume Support/ResistanceAn Indicator which shows the potential resistance/support level at K bar with significant trading volume.
The logic is stated below:
(current K-bar volume - the past average trading volume of 48 Ks) > 4 *standard deviation of trading volume
When this condition is met, it is considered that the trading volume is particularly enlarged, which may be an area where support pressure is possible
If the K is an ascending K-bar, then draw support at the lowest point; if the K is a descending K-bar, draw resistance at the highest point.
You can change the length and the number the standard deviation in the input section.

Volume by SessionThis indicator shows volume separated by session. The aim is clarify which session a volume bar occurred in and how it compares to the average of that session - NOT ALL SESSIONS.
The logic is that there is little value comparing for example the volume of the London session against volume of the London-NY session - the London-NY will always have higher volume. But how does today's london compare to yesterdays london or the london average.
The indicator has moving averages that only consider the average of previous episodes of the same session - so the average on the london session is the average of the past 5 london sessions (NY and asia and London-NY are not included in the calculation of the MA).
The indicator goes as high as 1H timeframe and the average line does not function below 5 mins - thats a limitation on available data to calculate it.
There's also a 'dark screen' function. Thats because I like a black background so the colours need to be inverted.
Hope its useful. Good luck.
John

Volume %This volume indicator additionally shows in percent how much volume, e.g. in the 1-minute chart, was traded compared to the average daily volume.

vRSI-volume detectorVolume RSI and standart deviation of mean volume calculation impose on one another
for easy detection of breakout volumes

VolumeS as stochThis volume indicator is my design. in this example we can use it as stoch but only this one based on pure volume .
since it a volume and not price based it allow us to see the real trend before the price go up or down. And by simple math of conversion volume number to real number . we can add this indicator to any indicator that we choose and we can enhance it affect.
this is just concept idea. as the real best setting for this need still to be found:)
if you want o make it faster or slower just change the smooth or length setting
so have fun

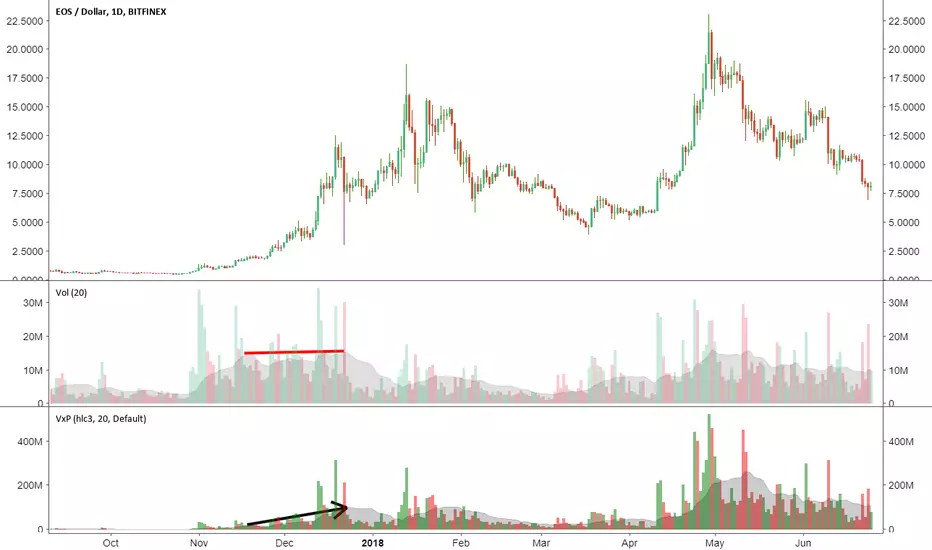
Volume x PriceThis is a simple indicator that calculates volume times price (money volume). Both asset volume and money volume are important indicators in TA. As you can see in the chart above, money volume (moving average) was increasing while the asset volume was not during late 2017. This could have led to wrong interpretations. Money volume becomes more important to consider when the difference in asset price is 'relatively' high.
Features:
- In addition to default options on volume indicator, it is possible to color volume bars based on "money flow multiplier" sign (close-(low+high)/2)
- Money factor can be disabled to show regular volume
Note: Most exchanges show asset volume but there are some like Bitmex that show money volume. Using this indicator on Bitmex type tickers should be avoided.
PS: I couldn't find any indicator for money volume so I had to develop this.
Your feedback is very welcome. If you know similar indicators, please let me know.
Volumes on BarEste indicador colore as cores do candle de acordo com o volume.
Desabilitar a visibilidade do candle original.
Volume Weekdays/WeekendsShow weekend volumes in a difference colour and calculate two separate moving averages over the lookback period.

Volume ProfileThis is a Volume Profile based on pine script arrays.
The main idea behind this script is from the user @IldarAkhmetgaleev .
He created an awesome piece of code for free users on tradingview.
Here are some changes to the main script:
0. Used Pine Script Arrays for doing/storing calculations.
1. The bar labels are replaced with lines.
2. Added a POC line.
3. Bar growing directions changed from right to left.
4. Added an option to change bar width.
Inputs:
0. Volume Lookback Depth : Number of bars to look back for volume calculations.
1. Bar Length Multiplier : Bar length multiplier to make bar long or short.
2. Bar Horizontal Offset : Horizontal distance from the current bar in the right direction.
3. Bar Width : Width of the bars.
4. Show POC Line : Show or hide the POC line.
Happy trading.

Volume/Price Alert (idea from a dear TV trader)Simple code that finds a sell candle following a buy candle that has higher volume.

Volume Delta MontoscaTechnical Summary: Volume Delta Montosca + Market Bias V3
The Volume Delta Montosca + Market Bias V3 is a multi-layered analysis tool designed to decode market sentiment through volume decomposition and relative strength. Instead of looking at volume as a single metric, this indicator splits every bar into its buy and sell components to reveal the true intent behind price movements.
Core Volume Analysis and Delta Logic
The indicator uses a calculation based on price movement within each bar to estimate Buy and Sell Delta. It measures the relationship between the close, high, and low to determine how much of the total volume was aggressive buying versus aggressive selling. Users can define a Dominance Threshold (typically 80%), which acts as a filter to identify bars where one side has a "substantial majority," effectively ignoring noise and focusing on high-conviction moves.
Signal Generation and FVG Filtering
Signals are categorized into two levels of importance. Base Signals (represented by small circles) occur when there is a significant volume spike—defined by a 20-period SMA—combined with high dominance. However, the indicator also features an internal Fair Value Gap (FVG) Filter. When price action "inverts" or breaks through a recent price imbalance while showing dominant volume, the indicator triggers a High-Priority Signal (represented by triangles). This specific logic ensures that signals are not just based on volume, but on the successful reclamation of key price areas.
Dynamic Market Bias and Comparative Strength
Beyond individual asset analysis, the script includes a Market Bias Engine that compares the current ticker against a benchmark, such as the S&P 500 (ES1!). It calculates a ratio between the two assets and applies a "Volume Supremacy" logic. If the current asset shows expanding volume and higher dominance percentages than the benchmark, the Bias Panel updates to show which asset is leading the market. This allows traders to see at a glance if they are trading the strongest available asset or if the broader market bias is shifting against them.
Visual Elements and Customization
The tool offers a clean visual experience by plotting a dual-colored histogram where the dominant volume color takes priority. It also includes Volume Candles, which paint the bars on the main chart to match the volume sentiment, and Top Diamonds to mark the peaks of volume expansion. All features, including the FVG lookback range and the SMA adjustment factor, are fully customizable to fit different trading timeframes and styles.
