VWAP angle TrendThe VWAP Angle Trend is an indicator built with the aim of providing valuable insights into the reversal points of the #VWAP using Angle
This is achieved by calculating the angle between the current VWAP and its previous value over a customizable lookback period and normalizing it with ATR
By analyzing the angle, we can gain an understanding of the strength and direction of the VWAP, which can help them identify potential trend reversals or continuations.
After observing the market over a lengthy period, I have come to realize that as the angle increases above 65 or decreases under -65 , it confirms a higher likelihood of a trend reversal.
the indicator highlights these zones where a trend reversal is more likely to occur.
The indicator can help you to assess the strength and direction of VWAP, enabling you to make more informed trading decisions.
By identifying periods of strong momentum or potential exhaustion, you can seek opportunities for entering or exiting positions, and potentially capitalize on trend movements in the market.
Cari dalam skrip untuk "vwap"

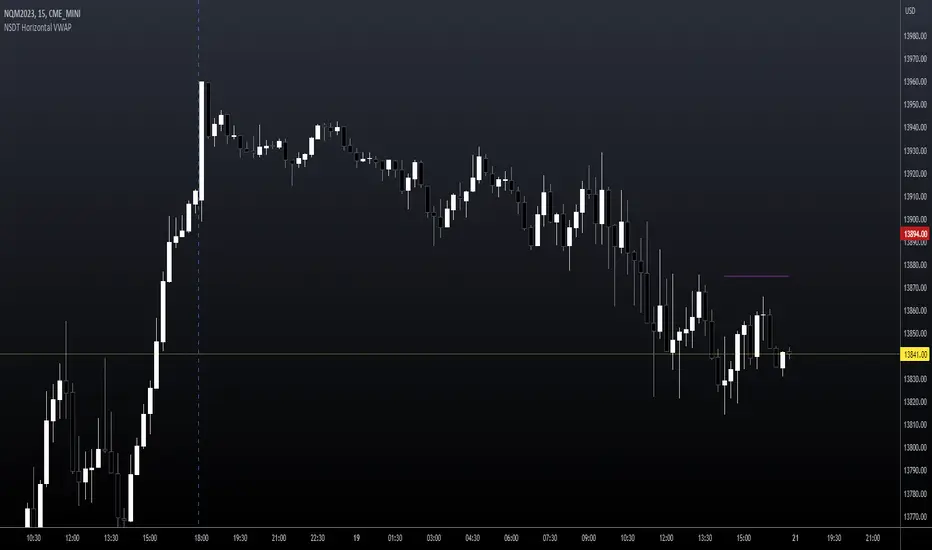
NSDT Horizontal VWAPThis script plots VWAP as a horizontal line starting at the most recent candle and extending backwards for a period of 10 to make it easier to see. (default is 10 but can be changed to fit your needs)
You may only want to see where VWAP is currently and not need to see the entire day. Helps keep the chart clean.
Colors and line settings can all be modified.
You can show the original VWAP plot as well for reference.
What Is the Volume-Weighted Average Price (VWAP)?
The volume-weighted average price (VWAP) is a technical analysis indicator used on intraday charts that resets at the start of every new trading session.
It's a trading benchmark that represents the average price a security has traded at throughout the day, based on both volume and price.
VWAP is important because it provides traders with pricing insight into both the trend and value of a security.
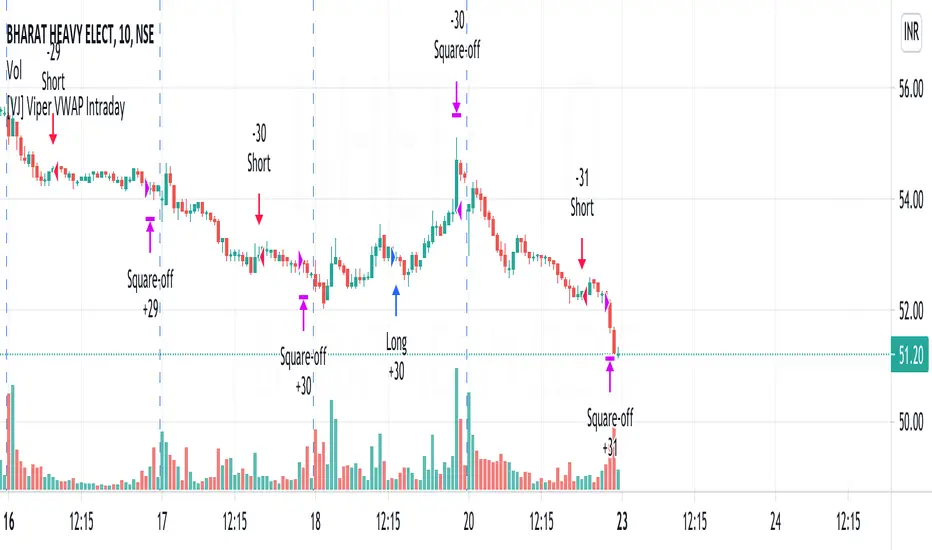
[VJ] Viper VWAP IntradayHello Traders, this is a simple intraday strategy involving the ever reliable VWAP and a chop index to add twist to the traditional style . You can modify the values on the stock and see what are your best picks. Comment below if you found something with good returns
Strategy: VWAP based strategy but uses an additional powerful indicator Chop index to help us stay out of false trades.
Indicators used :
VWAP identifies the true average price of a stock by factoring the volume of transactions at a specific price point and not based on the closing price. VWAP can add more value than your standard 10, 50, or 200 moving average indicators because VWAP reacts to price movements based on the volume during a given period.
The Choppiness Index is designed to determine whether the market is choppy or trading sideways, or not choppy and trading within a trend in either direction. Using a scale from 1 - 100, the market is considered to be choppy as values near 100 (over 61.80) and trending when values are lower than 38.20)
Buying/Selling typically happens at VWAP Breakouts which is then validated with extreme CI to ascertain the entries
Aggressive trade stop can be employed by using the % for long and shorts in the strategy.
Usage & Best setting :
Choose a good volatile stock and a time frame - 10m.
CI Index : 14
Trend Factor - anything below 38.2 is considered in trend, you can experiment from 50
There is stop loss and take profit that can be used to optimise your trade
The template also includes daily square off based on your time.
Multi Range VWAP PivotsMulti Range VWAP Pivots turned out to be one of my most accurate pivot indicators to date!
Multi Range VWAP Pivots works by recognizing the high and low of the timeframe selected (D, W, M, 6M, and 12M) and plotting range high to VWAP averages and range low to VWAP averages.
After further examination of each completed range, I came to the conclusion that due to the nature of averages, high and low respectively would need to be completed within the current range, for the averages to actually display pivots correctly. This means that if all averages appear to be "pivoting" correctly after or during a break lower of higher, then we can only assume the most recent break higher or lower could be exhaustion and price will be reverted to the mean (VWAP). OR, this could be the most accurate hindsight indicator on the planet.
*DISCLAIMER*: This indicator repaints. DO NOT backtest or set alerts with this indicator.

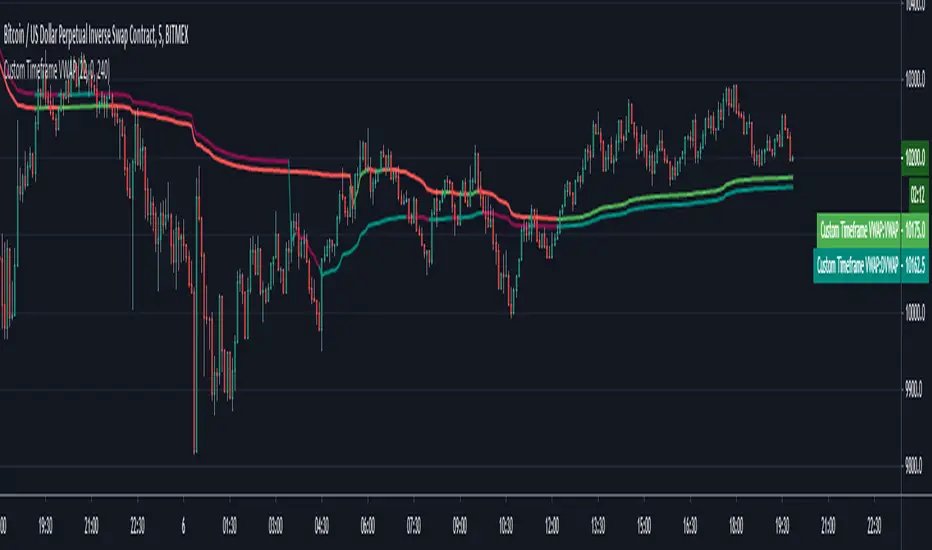
Custom Timeframe VWAPThis script calculates the daily VWAP from any specified starting point intraday. Also colors the VWAP based on whether price is above or below it.
Standard vwap starts at day open 0 GMT, however there are some exchanges for eg. Deribit that have seen they use a different time period to begin VWAP calculations. This is useful in such cases.
You need to specify the hours & minutes of the VWAP that want to use. VWAP will be hidden on any timeframe higher than specified "Highest Visible Timeframe".
Also a big thanks to u/mortdiggiddy as he helped with this script.
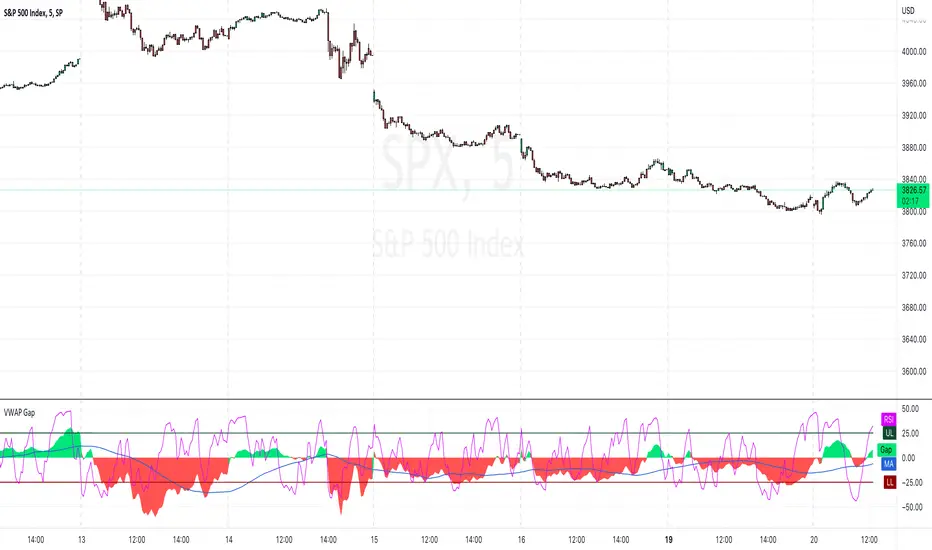
VWAP Gap [AR]This simple indicator measure the difference between price and VWAP line
The VWAP Gap indicator works best on intraday charts
SET-UP INFO
1. Add VWAP to your chart and set it up
2. Open "VWAP Gap Indicator" settings
3. Change source to "VWAP"
Enjoy!
Alex R.
Multi-Day VWAP
Chart the multi-day Volume Weighted Average Price ( VWAP ). Normally, the VWAP is tracked for the current day, from the first bar of the day (regular or extended session). The VWAP shows the current value of:
-> sum(hlc3 * volume , barsForDay) / sum( volume , barsForDay),
-> where 'barsForDay' is the total number bars that have elapsed during the day for the chart interval.
The multi-day version tracks the VWAP for N days back, by averaging the previous N - 1 day bars VWAP and the current VWAP for the current bar (chart interval).
This is very different that simply using a volume weighted moving average , since the closing VWAP values are used for the historical day bars. The results are interesting for intraday trades... especially for values of 1, 2, 3, 4, and 5 days.
Enjoy.

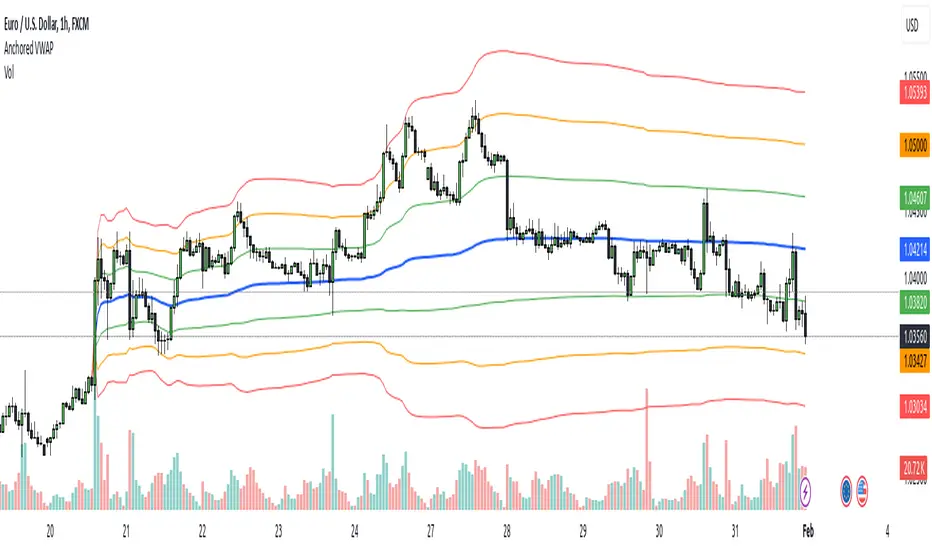
Anchored VWAPAnchored VWAP with 3 Standard Deviation Bands
📈 Version: Pine Script v5
📌 Author: Aymen Haddaji
🔍 Overview
This indicator calculates an Anchored Volume-Weighted Average Price (AVWAP), allowing traders to anchor the VWAP calculation from a user-defined date and time. It also plots three standard deviation bands above and below the AVWAP to help identify potential areas of overbought and oversold conditions.
📊 Features & Functionality
✔ Custom Anchor Point: Select a specific date and time to start the AVWAP calculation.
✔ OHLC/4 Calculation: Uses the average of Open, High, Low, and Close to smooth the price input.
✔ Three Standard Deviation Bands:
1st Deviation (Green): Moderate volatility zone.
2nd Deviation (Orange): High volatility zone.
3rd Deviation (Red): Extreme overbought/oversold areas.
✔ Real-Time Calculation: Updates dynamically with each price movement.
✔ Clear Visuals:
AVWAP (Blue Line) represents the fair market price from the anchor.
Deviation Bands (Dashed Lines) show potential support and resistance levels.
🛠 How It Works
VWAP Calculation
Uses a cumulative sum of price × volume divided by cumulative volume.
Calculation starts from the user-defined anchor time.
Standard Deviation Bands
Measures the price dispersion around the AVWAP.
The wider the bands, the higher the volatility.
When price touches or exceeds the 3rd deviation, a potential reversal zone is indicated.
Trading Strategies with AVWAP & Deviation Bands
Trend Confirmation:
Price above AVWAP = Uptrend (bullish).
Price below AVWAP = Downtrend (bearish).
Support & Resistance:
AVWAP acts as dynamic support or resistance.
1st & 2nd deviations often act as secondary levels.
Mean Reversion Trading:
When price reaches the 3rd standard deviation, a pullback is likely.
Breakout Confirmation:
A strong close above/below the 3rd deviation may indicate trend continuation.
⚙️ Input Settings
📍 Anchor Time: Allows you to set the exact date and time to start the AVWAP calculation.
🎯 Ideal For
✅ Intraday traders looking for short-term mean reversion plays.
✅ Swing traders identifying key support/resistance zones.
✅ Trend traders confirming long-term market direction.
✅ Volatility traders using standard deviation for trade entries.
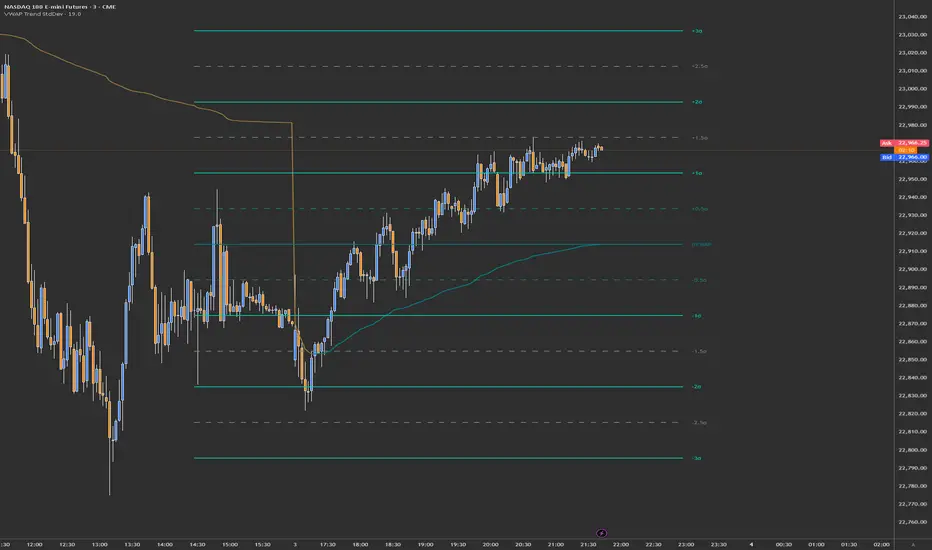
VWAP Trend with Standard Deviation & MidlinesThis indicator is a sophisticated VWAP (Volume Weighted Average Price) tool with multiple features:
Core Functionality:
1. Calculates a primary VWAP line that changes color based on trend direction (green when rising, red when falling)
2. Creates multiple standard deviation bands around the VWAP at customizable distances
3. Resets calculations at either:
- New York session start time (configurable, default 9:30 AM)
- Daily start time
- Can be hidden on daily/weekly/monthly timeframes if desired
Band Structure:
- Band 1 (innermost): ±1 standard deviation
- Band 2 (middle): ±2 standard deviations
- Band 3 (outermost): ±3 standard deviations
- Midlines at 0.5σ intervals between bands
- All bands can be individually enabled/disabled
Customization Options:
1. Band calculation modes:
- Standard Deviation based
- Percentage based
2. Visual settings:
- Customizable colors for all elements
- Adjustable line widths
- Optional labels with configurable size
- Optional extension lines
- Label position adjustment
3. Source data selection (default: HLC3 - High, Low, Close average)
Common Uses:
- Identifying potential support/resistance levels
- Measuring price volatility
- Spotting mean reversion opportunities
- Trading range analysis
- Trend direction confirmation
The indicator essentially creates a dynamic support/resistance structure that adapts to market volatility and volume, making it useful for both intraday and swing trading strategies.
MTF VWAPThis indicator is an enhanced version of the traditional VWAP, providing traders with multiple timeframe views, automatic session anchoring, and customization options for optimized technical analysis.
Key Features:
1. Multiple Timeframes, One View : Visualize Daily, Weekly, Monthly, and Yearly VWAP calculations simultaneously on a single chart.
2. Automatic Anchoring : The indicator intelligently auto-anchors each VWAP calculation to the start of its respective session. This ensures accurate readings and streamlines your analysis by eliminating the need for manual adjustments.
3. Customizability : Tailor the appearance of the indicator with fully customizable colors and the ability to select your preferred price source (e.g., high, low, close, hlc3, hlcc4, or a custom one).

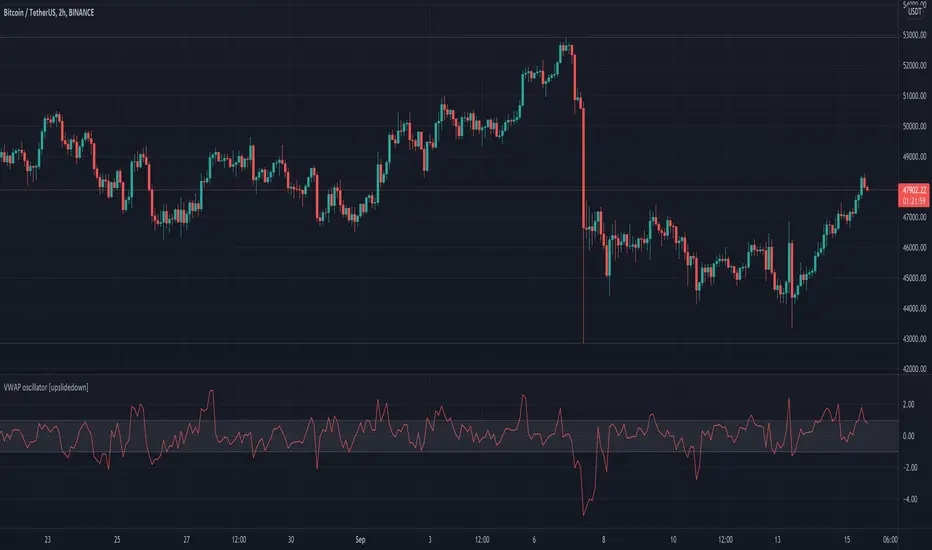
VWAP oscillator [upslidedown]This VWAP oscillator showcases the percent difference between VWAP and current price within an oscillator centered on 0. My thesis for this indicator is that trend following within the threshold zone (defaulted to 1%) would be "choppy" but outside is a significant trend. Another way to think about VWAP is potential for taking profits, as price will always be magnetized back to the center.
I find this sort of visualization very helpful when creating strategies that revolve around a filter such as VWAP and wasn't able to find anything that was close and/or provided this sort of visualization publicly. Enjoy and let me know if you find this useful or can dream up an improvement.
Swing VWAP Weekly Stock and Crypto StrategyThis is a simple yet very efficient swing strategy designed for crypto and stock market, using big timeframes.
Its main component is VWAP weekly, so for best scenarios its better to use big timeframes such as 8h+.
The rules for entry are simple:
If our close if above vwap weekly we enter long .
If our close is below vwap weekly we enter short.
We exit from the trade, when a reverse condition than the entry one is triggered.
Because this strategy has no risk management inside, I recommend to be careful with it.
If you have any questions, let me know

Vwap mtf Swing Stock StrategyThis is a trending strategy designed for stock market, especially long trending assets such as TSLA, NIO, AMAZON and so on.
Its made of volatility bands and weekly VWAP, in this case daily and weekly.
This strategy has been adapted to go long only.
Rules for entry
For long , we want to enter close of a candle is above vwap weekly, and at the same time the close of a candle cross-under the lower volatility band.
For exit , we want to enter close of a candle is below vwap weekly, and at the same time the close of a candle cross-over the upper volatility band.
This strategy does not have a risk management inside, so use it with caution.
If you have any questions, let me know !

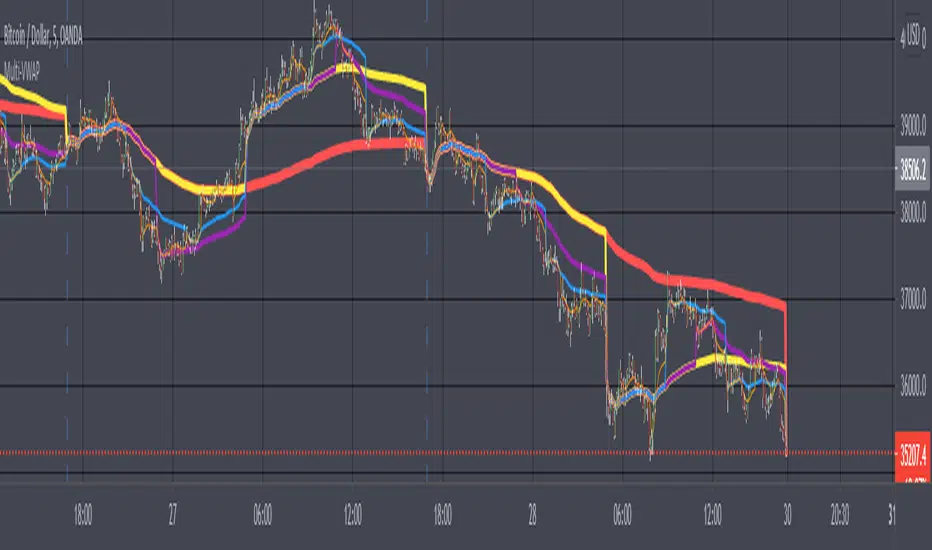
Multi-VWAPVolume Weighted Average Price (VWAP) Definition
What is the Volume Weighted Average Price (VWAP)?
The volume weighted average price (VWAP) is a trading benchmark used by traders that gives the average price a security has traded at throughout the day,
based on both volume and price. It is important because it provides traders with insight into both the trend and value of a security.
-Investopedia By JASON FERNANDO Reviewed by SOMER ANDERSON Updated Feb 24, 2021
-Choose from 5 different Timeframes (lower or higher)
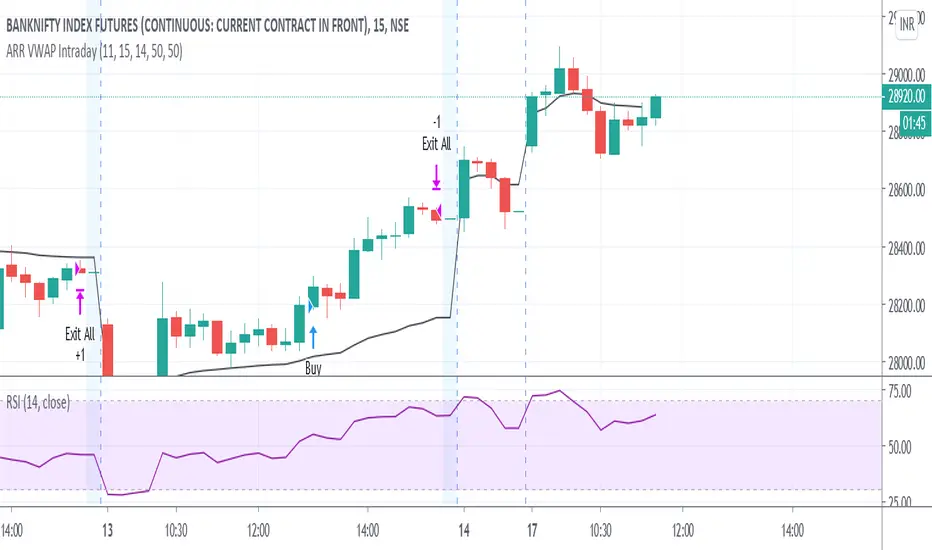
ARR VWAP IntradayIntra day VWAP Strategy
Strategy is
Buy when vwap goes up and RSI above 50 (Can be modified) .
Sell wehn vwap goes down and rsi bellow 50 (Can be modified)
Exit all at market close hour specified
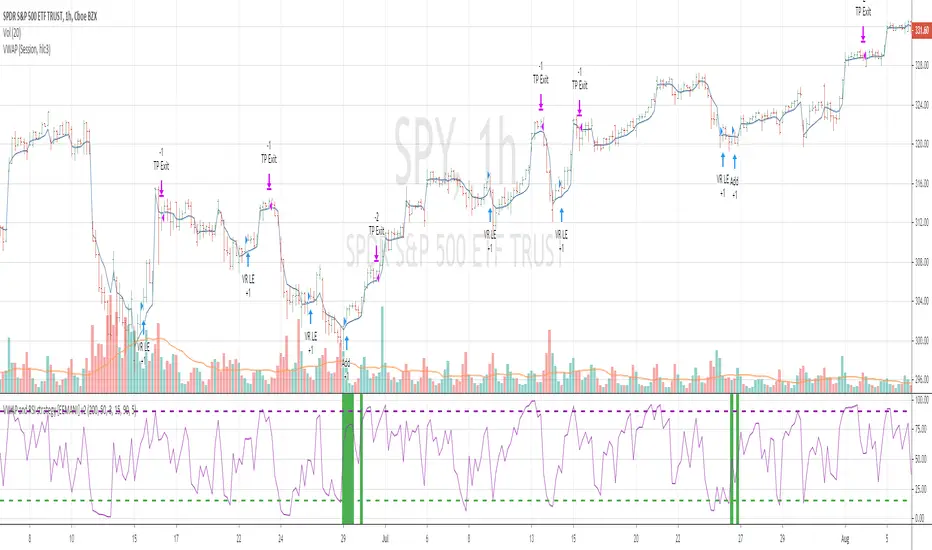
VWAP and RSI strategyThis strategy combines VWAP and RSI indicators
BUY RULE
1. EMA50 > EMA 200
2. if current close > vwap session value and close>open
3. check if RSI3 is dipped below 10 for any of last 10 candles (as defined rsi_buy_level)
EXIT RULE
1. RSI3 crossing down 90 level (as defined in rsi_sell_level)
STOP LOSS EXIT
1. default is set to 5%
you need to add EMA 50 , EMA 200 and VWAP (session) indicators to the chart to see how these signals are generated
This strategy is tested on SPY and QQQ index stocks on hourly chart.
Warning
for educational purposes only

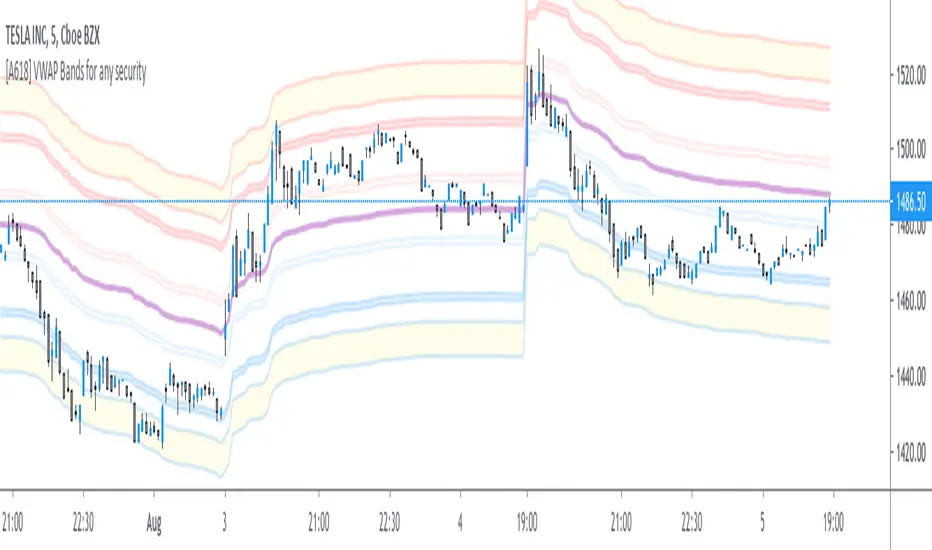
[A618] VWAP bands for any SecurityThe Script plots Standard Deviation Bands around The VWAP line,
This will help you out with detecting market overbought and oversold Conditions on the Fly
Use this in conjunction with an oscillator
- stoch, macd, etc...
- if you find a positive crossover with oscillator on a VWAP level its time to go long, targeting the next vwap level and vice-versa
VWAP/MVWAP/EMA CROSSOVEROnly difference in this one is that a EMA is used which should give quicker signals but theres a chance for more false signals as per usual use TA and other indicators to confirm positions. So far I've been liking the Vortex Indicator
When the VWAP (Thick Yellow) AND the two EMA (Orange and thin Yellow) cross above the MVWAP (Purple) then you will be in a uptrend that could possibly continue upwards. The opposite is true if you are looking a short opportunity, wait for the three other lines to cross under the MVWAP and you should be in a downtrend that could possibly continue downwards
Of course as with all indicators not every signal will be 100% accurate there is no way to predict human emotions when it comes to trading but based on the VWAP strategy used in other markets this is the closest I could get.
Note: Don't relay completely on this indicator to think for you. Use other forms of TA to confirm all positions before entering. And if the candles start trending the opposite direction after a lets say a mini pump/dump then the signal was false.
Finally this was made according to the 15 minute chart. I did not plan on remaking it for any other timeframes as I have left the code open for you to tweak and the setting are free to adjust aswell.
Q/A
Q: Does it repaint?
A: No, this is based on moving averages as far as I know they don't repaint.
Q: How did you come up with this indicator?
A: Went on youtube looking for trading strategies other and the usual EMA crosses and found a VWAP & EMA strat. I added the MVWAP and played with the numbers until I found something that I liked.
Q: How long have you been trading/learning pinescript?
A: Been trading less than a two months and pinescript about a month and a half.

Weekly VWAP - Starts Monday 12AMThere are a number of VWAP indicators out there, but it's difficult to find VWAP calculations that take the entire week into account. This helps with analyzing longer-term trends on daily and intraday charts. As with all VWAP indicators, this one is also more sensitive to price starting at the open of trading at the beginning of the week.

VWAP Bands - MultiTF and anchoredThe script has traditional VWAP for two different timeframes along with an option to anchor them to a particular bar. VWAP bands are also included in the script. The bands and VWAP act as hidden support/resistance for the scrip and are useful for intraday trading.

VWAP it GOODWhy: Instead of having 5 individual VWAP indicators, I found it beneficial for one view with a clean display. This VWAP indicator combines the daily, weekly, monthly, quarterly and annual into one color coded view. These colors and styles can be modified by the user.
A user can turn any timeframe off, but this is how I personally like to trade since it helps me better understand potential bounce or pullback areas.
Do your own research for what is best for you.

VWAP filtered MACD Bars with positive MACD histogram value and closing above VWAP are colored, long positions should be taken in areas made of those bars.
Similarly, bars with negative MACD histogram value and closing below VWAP are also colored, short positions should be taken there.
This indicator by default should be a part of your trend following trading system.
In the setting you can change colors
Above grow: positive and rising MACD histogram value
Above fall: positive and falling MACD histogram value
Below fall: negative and falling MACD histogram value
Below grow: negative and rising MACD histogram value