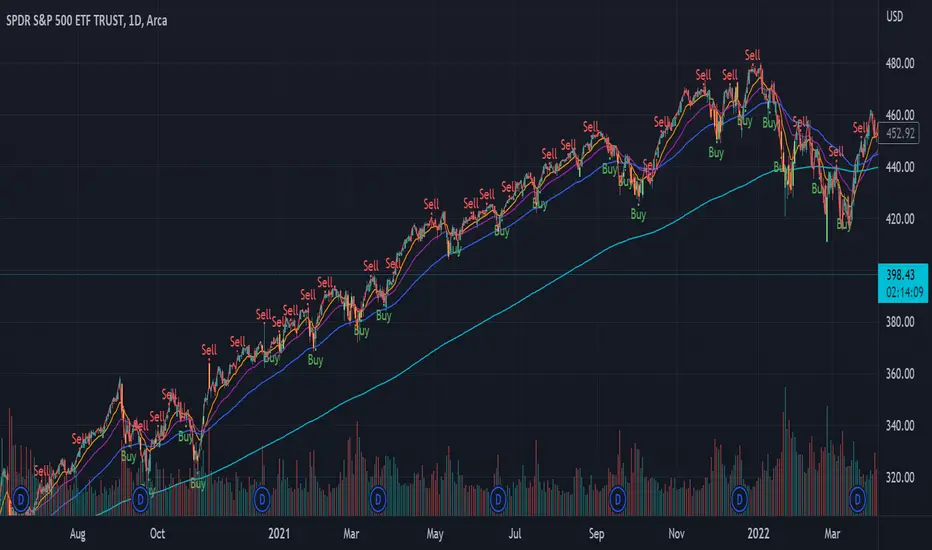
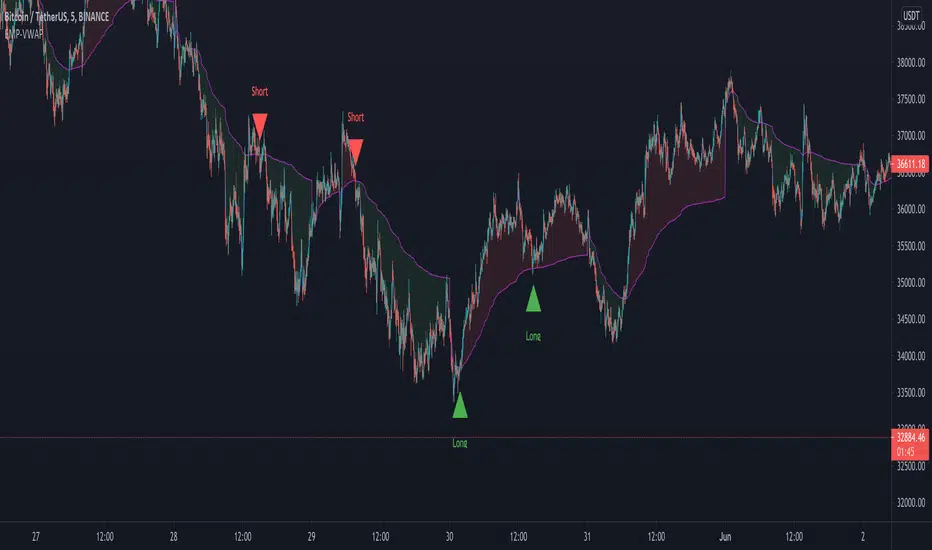
ATR+VWAP Alert//These signals mostly consist of crossovers between a 13 VWMA and a 62 VWMA. I've found these two moving averages to be quite special in their ability to
//recognize a quick trend using volume data. The VWAP is used in the alert system as well, to give some perspective on which direction we are looking to take. We
//are also using ATR. We only take trades when the ATR is on the move, meaning we have a chance to catch a volatile move! Finally, we use RSI to help weed out bad
//trades. We only take 'longs' with bullish readings from RSI, and we only take 'shorts' with bearish readings from RSI. These alerts are fantastic for catching quick intraday
//trades in either direction. I recommend using a small 'take profit' target rather than using an exit indicator. These trades can move 20-30 pips and reverse just as quickly. Good luck!
//How To Use:
//When the alert system is added to the chart, you will notice up/down symbols appear at various locations. For bullish alerts, right click an 'Up' symbol and choose 'Add Alert on VWap & ATR..'
//There are two condition options. 'Long/short', and right below that 'Buy-Signal/Sell-Signal'. Choose 'long' and 'Buy-Signal'. At options, choose 'Once Per Bar Close'. Design your alert, and you're good to go.
//For bearish signals, find a 'down' signal on the chart. Right click and follow the same process, except choosing 'short/Sell-Signal' conditions.
Tips:
Use VWAP as a stop-loss. If a candle closes below/above the VWAP in the direction against you.. get out of the trade. The losses will be minimal and few compared to the wins. Use discretion and trade carefully. This works great with crypto. Invent your own exit. If you come up with a clever exit, please share!
You can contact me at my Discord!
discord.gg
Cari dalam skrip untuk "vwap"

VWAP Balance HeatmapVWAP Balance Heatmap visually highlights where price stands relative to the dynamic equilibrium of bullish and bearish VWAP averages. The indicator builds two running VWAP arrays — one for bullish candles, one for bearish — then plots their averages and the midpoint between them. It fills the space between price and this midpoint, coloring it green when price is above balance and red when below. The result is a smooth heatmap that reveals whether the market is trading in premium or discount zones, helping you see shifts in momentum and balance without clutter or lag.

VWAP + EMA50 + EMA200 (with optional Anchored VWAP)VWAP + EMA50 + EMA200 (with optional Anchored VWAP)

Power Indicator - EMAs + VWAP + Volume BarThe Power Indicator is intended to return some exponential moving average, vwap, volume bar, and others. With this compilation, you will be able to use them as one indicator in Trading View.
The components are:
- EMA9 - Exponential Moving Average of 9 days
- EMA21 - Exponential Moving Average of 21 days
- EMA50 - Exponential Moving Average of 50 days
- EMA200 - Exponential Moving Average of 200 days
- Volume Bar - This indicator provides the volume of the candle and its strength by showing different colors. It's a way to check expressive volume in one bar.
- Vwap line
- Indicator
If you have any questions, let me know!
Anchored VWAP BandSimple script to anchor vwap to a drag and drop spot on the chart and display it as a band instead of a line.
the AVAP Band displays:
1. The AVWAP using High as the source
2. The AVWAP using OHLC4 as the source
3. The AVWAP using Low as the source
This is just a different way of visualising VWAP from an anchored point in time (Band vs Line)
EMA + VWAP (CriptoAprendices)CriptoAprendices 2022
Estrategia EMA 9 + VWAP (Day Trading)
Lo ideal es usar EMA DE 9 + VWAP (Session) y operar en grafico de 5 minutos

4EMA SET & VWAP帶有價格及名稱標籤可自訂的4條EMA線和VWAP
Customizable 4 EMA lines and VWAP with price and name labels.

Dillon's Double VWAP StrategyThis is based on Dillon's double VWAP strategy.
I enters when the ADX is low (aka not a trending market) and it's not close to the VWAP reset. Check it out.

Swing VWAP Crypto and Stocks StrategyThis is a strategy designed for swing trading on markets such as crypto and stocks.
Its components are:
VWAP
Time Management
Risk management
Rules for entry:
We entry only on Monday, if our close of the candle crossed above VWAP
Rules for exit
We exit always on Sunday or if we either hit the TP/SL levels.
If you have any questions let me know

EmperorBTC's VWAP StrategyEmperorBTC's VWAP Indicator & Strategy
v2.1
coded by Bogdan Vaida
This indicator was created after EmperorBTC's conditions.
Good timeframes for it: 30', 15', 5'
To convert from strategy to study switch the commented lines in the beginning
and at the end of the script and vice versa.
What this indicator does is to check if:
o Pivot Point was crossed
o Stoch-RSI and VWAP were crossed in current or previous candle
o Candle (or previous candle) close is in the trend direction
If all these are true then it will go long or short based on direction.

dEMA w/ VWAP filterBuy when EMA is below VWAP and starts sloping up
Sell when EMA is above VWAP and starts sloping down

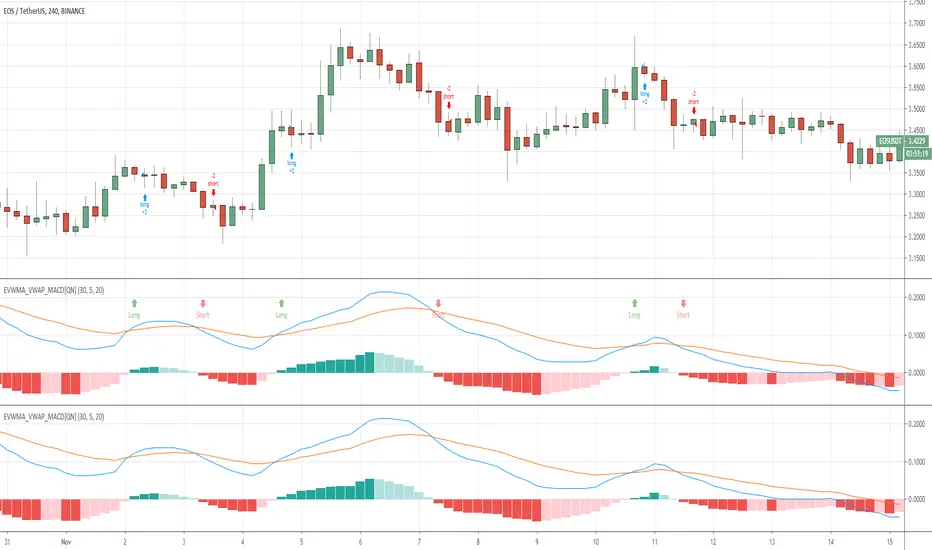
MACD VWAP IndicatorThis indicator uses a combination of the VWAP, EMA 9 and parts of the MACD in order to detect a bullish or bearish trend.
How to trade it:
Set SL either below or above the VWAP line (orange) and TP to 1:1.5 ratio (depending on last few candles, of course).
If EMA200 is close by then place SL either below or above EMA200 (blue) and TP to 1:1.5 ratio
Important:
Best traded in 15M, 30M => Intraday.
Have fun! :)

5min vwap in Multi Time FramesThis indicator will show the 5Min intraday VWAP onto any other timeframe. I like to see where the 5min VWAP is while on the 1Min chart for example.

BB + RSI Div + Volume + VWAP (4H Perp Short Alert) - SafeThis Indicator use Bollinger Band + RSI Div + Volumne + VWAP for shorting Mid and Small Cap token in 4H timeframe

VWAP + Scaled VIX OverlayVWAP-VIX Fusion Overlay helps traders interpret volatility in real time by placing VIX and VWAP where they belong: side-by-side with price action.
It turns the invisible (fear, volatility pressure, momentum shifts) into something clearly visible — making entries, exits, and trend evaluation easier and more accurate.

Multi-Period Rolling VWAPMulti-Period Rolling VWAP (MP-RVWAP)
This indicator plots multiple Rolling Volume-Weighted Average Price (RVWAP) lines over different time periods (7, 14, 30, 60, 90, 180, and 360 days) on a single chart. Each RVWAP is calculated using a user-defined timeframe and source (default: HLC3), ensuring consistency across chart resolutions.
Key Features:
Customizable Periods: Toggle visibility for each period (7d, 14d, 30d, 60d, 90d, 180d, 360d) and adjust their colors.
Labels: Each RVWAP line is labeled at the end (e.g., "7d", "360d") for easy identification.
Standard Deviation Bands: Optional bands can be added above and below each RVWAP, with customizable multipliers (set to 0 to hide).
Flexible Timeframe: Define a single timeframe (default: 1D) for all RVWAP calculations, independent of the chart’s timeframe.
Minimum Bars: Set a minimum number of bars (default: 10) to ensure reliable calculations.
Usage:
Ideal for traders analyzing price trends across multiple time horizons. Enable/disable specific RVWAPs, tweak colors, and add bands to suit your strategy.

Bollinger Bands Scalper + VWAPGet more consistent scalps by trading in-between Bollinger Band Deviations.
FEATURES:
1) 3 Bollinger Bands with default settings to 1, 2, and 3 deviations for more consistent scalps
2) Trendicator: a dynamic color changing moving average that helps you see trend quickly
3) Robust VWAP tool with up to 3 different deviations as well as different anchor points to help you see strong support and resistances
4) Calming "purple cloud" color palette helps you focus on price action
5) Discover new trading strategies with a wide range of customizability

EmperorBTC's VWAP IndicatorThis indicator was created after EmperorBTC's conditions. Conditions displayed below:
Good timeframes for it: 30', 15', 5'
To convert from strategy to study switch the commented lines in the beginning and at the end of the script
What this indicator does is:
1) Check if Pivot Point was crossed
2) Stoch-RSI and VWAP were crossed up in current or previous candle
3) Candle (or previous candle) is green
Then, it will plot a Long opportunity.
FUTURE IDEAS:
- Volume Expansion
- Candle Stick patterns
Flunki VWAP minus MA OscillatorHerewith a simple oscillator that show the difference in price between a Moving Average of the price, and the current VWAP
This show as a histogram
On top of that is a Moving Average of the histogram value, shown as a blue / red line with an option to hight these crossing and also crossing zero
Simple idea ; code open.

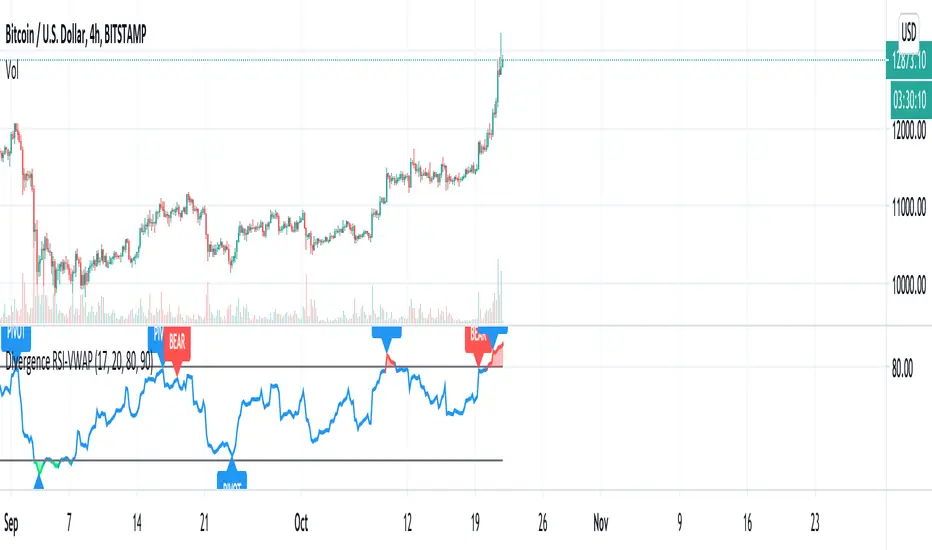
Divergence RSI-VWAPCombination of the script from XaviZ of RSI-VWAP and divergence detector from Libertus.
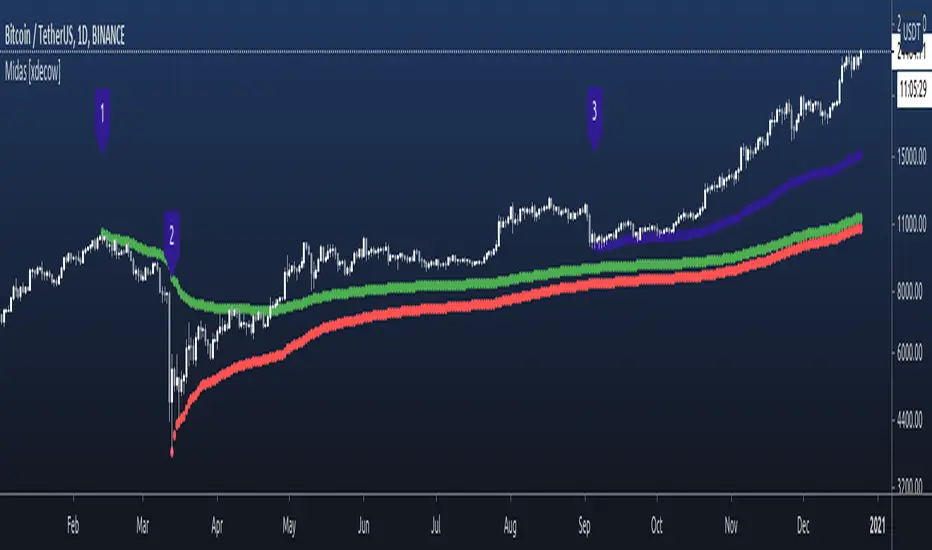
Midas 6 Anchored VWAP [xdecow]This script plots 6 anchored vwap from the selected bars.
The labels are only to help identify the starting points and can be disabled in the options.