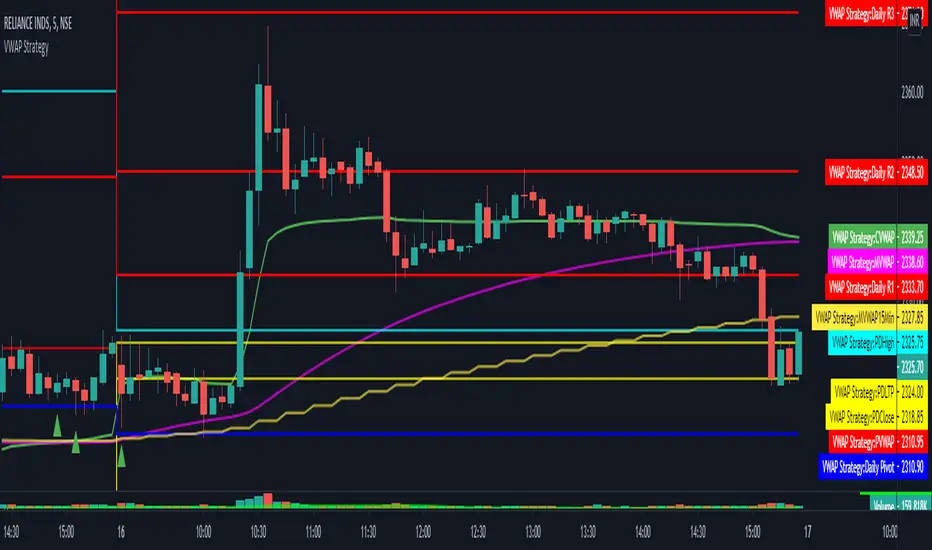
VWAP Indicator Channel | Multi Timeframe by Osbrah📊 Multi-Timeframe VWAP Indicator (Session / Weekly / Monthly)
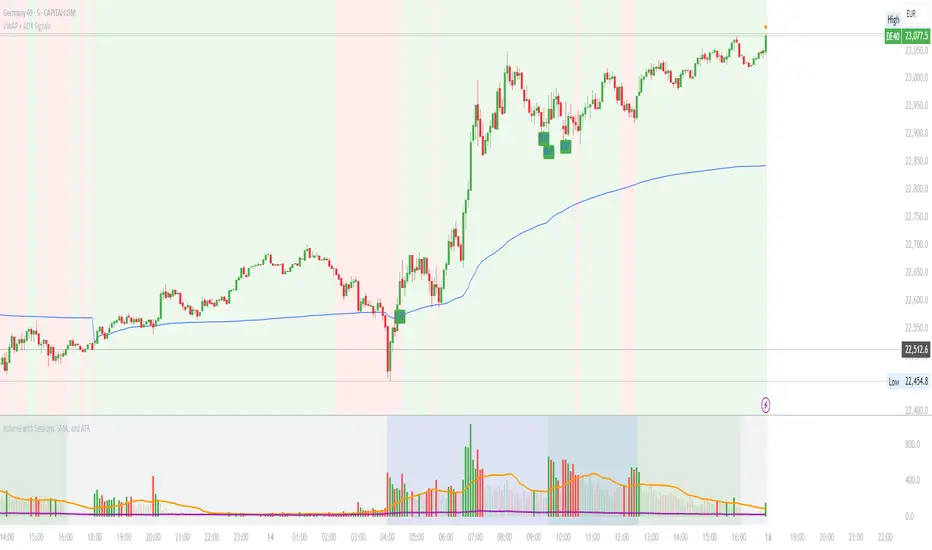
This powerful indicator plots the Volume Weighted Average Price (VWAP) across multiple timeframes: intraday session, weekly, and monthly. It's designed to give traders a clear understanding of the market’s fair value over different horizons.
Key Features:
* Display Session VWAP (resets daily)
* Enable Weekly and Monthly VWAPs for broader market context
* Customize colors, styles, and visibility for each VWAP
* Toggle between standard VWAP or anchored to session opens
Use Cases:
* Identify value zones where price tends to gravitate
* Spot institutional levels of interest and potential reversal points
* Align entries with VWAP bounces or breaks
* Combine with EMAs or price action for high-probability setups
Perfect for day traders, swing traders, and institutional-style strategies, this VWAP tool helps you stay aligned with volume-based price dynamics across all market phases.
Penunjuk Pine Script®