Dynamic VWAP: Fair Value & Divergence SuiteDynamic VWAP: Fair Value & Divergence Suite
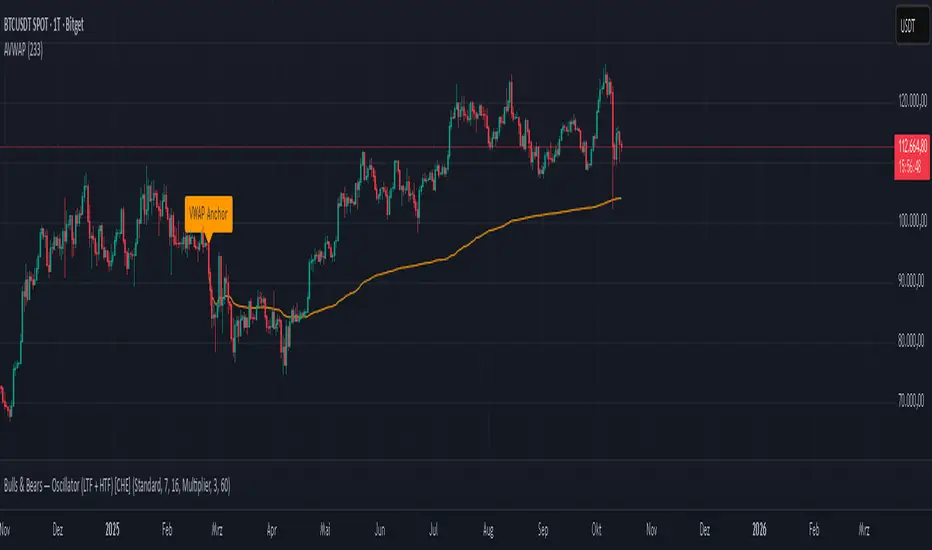
Dynamic VWAP: Fair Value & Divergence Suite is a comprehensive tool for tracking contextual valuation, overextension, and potential reversal signals in trending markets. Unlike traditional VWAP that anchors to the start of a session or a fixed period, this indicator dynamically resets the VWAP anchor to the most recent swing low. This design allows you to monitor how far price has extended from the most recent significant low, helping identify zones of potential profit-taking or reversion.
Deviation bands (standard deviations above the anchored VWAP) provide a clear visual framework to assess whether price is in a fair value zone (±1σ), moderately extended (+2σ), or in zones of extreme extension (+3σ to +5σ). The indicator also highlights contextual divergence signals, including slope deceleration, weak-volume retests, and deviation failures—giving you actionable confluence around potential reversal points.
Because the anchor updates dynamically, this tool is particularly well suited for trend-following assets like BTC or stocks in sustained moves, where price rarely returns to deep negative deviation zones. For this reason, the indicator focuses on upside extension rather than symmetrical reversion to a long-term mean.
🎯 Key Features
✅ Dynamic Swing Low Anchoring
Continuously re-anchors VWAP to the most recent swing low based on your chosen lookback period.
Provides context for trend progression and overextension relative to structural lows.
✅ Standard Deviation Bands
Plots up to +5σ deviation bands to visualize levels of overextension.
Extended bands (+3σ to +5σ) can be toggled for simplicity.
✅ Conditional Zone Fills
Colored background fills show when price is inside each valuation zone.
Helps you immediately see if price is in fair value, moderately extended, or highly stretched territory.
✅ Divergence Detection
VWAP Slope Divergence: Flags when price makes a higher high but VWAP slope decelerates.
Low Volume Retest: Highlights weak re-tests of VWAP on low volume.
Deviation Failure: Identifies when price reverts back inside +1σ after closing beyond +3σ.
✅ Volume Fallback
If volume is unavailable, uses high-low range as a proxy.
✅ Highly Customizable
Adjust lookbacks, show/hide extended bands, toggle fills, and enable or disable divergences.
🛠️ How to Use
Identify Buy and Sell Zones
Price in the fair value band (±1σ) suggests equilibrium.
Reaching +2σ to +3σ signals increasing overextension and potential areas to take profits.
+4σ to +5σ zones can be used to watch for exhaustion or mean-reversion setups.
Monitor Divergence Signals
Use slope divergence and deviation failures to look for confluence with overextension.
Low volume retests can flag rallies lacking conviction.
Adapt Swing Lookback
30–50 bars: Faster re-anchoring for swing trading.
75–100 bars: More stable anchors for longer-term trends.
🧭 Best Practices
Combine the anchored VWAP with higher timeframe structure.
Confirm signals with other tools (momentum, volume profiles, or trend filters).
Use extended deviation zones as context, not as standalone signals.
⚠️ Disclaimer
This script is for educational and informational purposes only. It does not constitute financial advice or a recommendation to buy or sell any security or asset. Always do your own research and consult a qualified financial professional before making any trading decisions. Past performance does not guarantee future results.
Cari dalam skrip untuk "vwap"

Volume Weighted Average Price (VWAP) with Extras [starlord_xrp]This script builds on the standard VWAP buy adding anchor selections for new High, new Low, and for extreme price moves (Percent Change) that can be significate anchor points for the VWAP. The Percent Change is based on "% Price Change" by OrganicPunch and uses a percentage threshold that can be set in the settings.

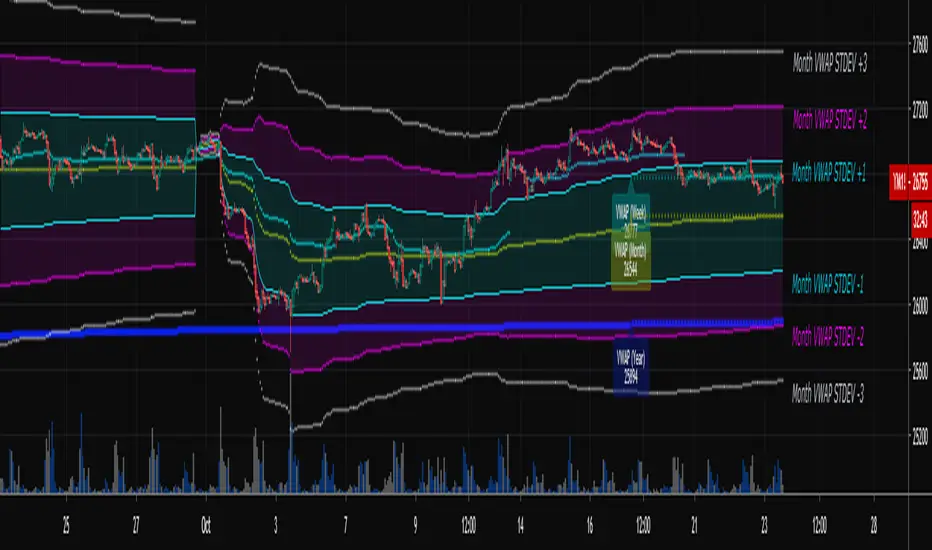
VWAP Stdev Bands Multi Time Frame SBTCProviding a useful update to Vwap STDEV bands, including multi timeframe functionality. Shown above is monthly VWAP Stdev Bands.

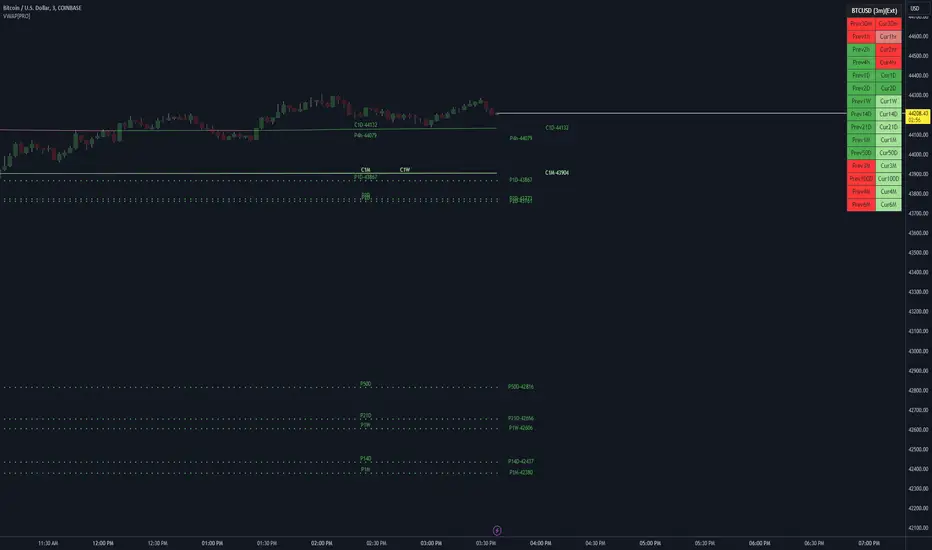
VWAP LEVELS [PRO]32 VWAP levels with labels and a table to help you identify quickly where current price is in relation to your favorite VWAP pivot levels. To help reduce cognitive load, 4 colors are used to show you where price is in relation to a VWAP level as well as the strength of that respective level. Ultimately, VWAP can be an invaluable source of support and resistance; in other words you'll often see price bounce off of a level (whether price is increasing or decreasing) once or multiple times and that could be an indication of a price's direction. Another way that you could utilize this indicator is to use it in confluence with other popular signals, such as an EMA crossover. Many traders will wait till a bar's close on the 5m or 10m time frame above a VWAP level (developing 1D VWAP would be a popular choice) before making a decision on a potential trade especially if price is rising above the 1D VWAP *and* there's been a recent 100 EMA cross UP of the 200 EMA. These are 2 bullish signals that you could look for before possibly entering in to a trade.
I've made this indicator extremely customizable:
⚡Each VWAP level has 2 labels: 1 "at level" and 1 "at right", each label and price can be disabled
⚡Each VWAP label has its own input for label padding. The "at right" label padding input allows you to zoom in and out of a chart without the labels moving along their respective axis. However, the "at level" label padding input doesn't work the same way once you move the label out of the "0" input. The label will move slightly when you zoom in and out
⚡Both "current" and "previous" VWAP levels have their own plot style that can be changed from circles, crosses and lines
⚡Significant figures input allows you to round a price up or down
⚡A price line that allows you to identify where price is in relation to a VWAP level
⚡A table that's color coded the same way as the labels. The labels and table cells change to 1 of 4 colors when "OC Check Mode" is enabled. This theory examines if the VWAP from the Open is above or below the VWAP from Close and if price is above or below normal VWAP (HLC3). This way we have 4 states:
Red = Strong Downtrend
Light Red = Weak Downtrend
Light = Weak Uptrend
Green = Strong Uptrend
Something to keep in mind: At the start of a new year, week or month, some levels will converge and they'll eventually diverge slowly or quickly depending on the level and/or time frame. You could add a few labels "at level" to show which levels are converging at the time. Since we're at the beginning of a new year, you'll see current month, 2 month, 3 month etc converge in to one level.
🙏Thanks to (c)MartinWeb for the inspiration behind this indicator.
🙏Thanks to (c)SimpleCryptoLife for the libraries and code to help create the labels.
Swing-Based VWAPSwing-Based VWAP
Summary:
The "Swing-Based VWAP" indicator enhances traditional VWAP calculations by incorporating swing-based logic. It dynamically adapts to market conditions by identifying key swing highs and lows and calculating VWAP levels around these pivot points. This makes it a versatile tool for traders seeking actionable price insights.
Explanation:
What is Swing-Based VWAP?
The Swing-Based VWAP is a modified version of the Volume-Weighted Average Price (VWAP). It calculates VWAP not only for a chosen timeframe (e.g., session, week) but also adapts dynamically to market swings. By identifying swing highs and lows, it offers more precise levels for potential price action.
Unique Features:
1. Dynamic Swing Integration:
- Uses pivot points to determine significant price levels.
- Calculates VWAP based on these points to adapt to market trends.
2. User-Friendly Settings:
- Includes options to hide VWAP on higher timeframes for chart clarity.
- Flexible swing size input for adjusting sensitivity.
How to Use:
1. Configuring Swing Settings:
- Use the "Swing Setting" input to determine the sensitivity of swing detection.
- Higher values identify broader swings, while smaller values capture more granular movements.
2. Enabling/Disabling VWAP:
- Toggle VWAP visibility using the "Use VWAP" option.
- The "Hide VWAP on 1D or Above" setting lets you control visibility on higher timeframes.
3. Anchor Period:
- Select your preferred anchoring period (e.g., session, week) to match your trading style.
4. Adjusting the Data Source:
- Use the "Source" input to select the price source (default: HLC3).
5. Visualizing Swing-Based VWAP:
- The script plots a dynamic VWAP line based on detected swing points.
- This line highlights average price levels weighted by volume and swing pivots.
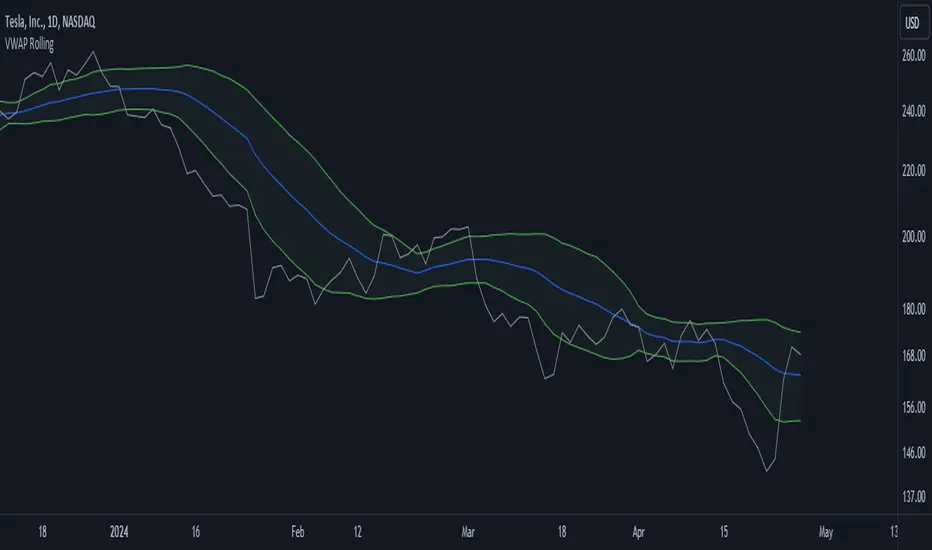
VWAP RollingThis indicator, referred to here as "VWAP Rolling," is a technical tool designed to provide insight into the average price at which an asset has traded over a specified rolling period, along with bands that can indicate potential overbought or oversold conditions based on standard deviations from this rolling VWAP.
Purpose and Utility:
The indicator's primary purpose is to track the volume-weighted average price (VWAP) over a specified period, typically 20 bars in this script. The VWAP Rolling is particularly useful in assessing the average price level at which a security has been traded over the recent history, incorporating both price and volume data. This can help traders understand the prevailing market price in relation to trading volume.
Advantages:
1. Dynamic Average: Unlike fixed VWAP indicators that calculate over a specific session, the rolling VWAP adapts to recent price and volume changes, offering a more responsive and dynamic average.
2. Volume Sensitivity: By weighting prices by volume, the rolling VWAP gives more importance to periods with higher trading activity, providing a clearer picture of where significant trading has occurred.
3. Standard Deviation Bands: The inclusion of standard deviation bands (configurable as 1x and 2x deviations in this script) around the rolling VWAP adds a layer of analytical depth. These bands can serve as potential areas of support and resistance, highlighting deviations from the mean price.
Singularization and Interpretation:
The VWAP Rolling indicator is singularized by its ability to adapt to changing market conditions, offering a dynamic representation of the average price level influenced by volume. To use and interpret this indicator effectively:
• Rolling VWAP Line: The main line represents the rolling VWAP. When this line trends upwards, it suggests that recent trading has been occurring at higher prices weighted by volume, indicating potential bullish sentiment. Conversely, a downtrend in the rolling VWAP may indicate bearish sentiment.
• Standard Deviation Bands: The upper and lower bands (configurable as 1x and 2x standard deviations from the rolling VWAP) are used to identify potential overbought or oversold conditions. A price crossing above the upper band may indicate overbought conditions, signaling a potential reversal or correction downwards. Conversely, a price crossing below the lower band may suggest oversold conditions, potentially signaling a bounce or reversal upwards.
• Band Interaction: Watch for interactions between price and these bands. Repeated touches or breaches of the bands can provide clues about the strength of the prevailing trend or potential reversals.
Interpretative Insights:
• Trend Confirmation: The direction of the rolling VWAP can confirm or contradict the prevailing price trend. If the price is above the rolling VWAP and the VWAP is rising, it suggests a strong bullish sentiment. Conversely, a falling rolling VWAP with prices below might indicate a bearish trend.
• ean Reversion Signals: Extreme moves beyond the standard deviation bands may signal potential mean reversion. Traders can look for price to revert back towards the rolling VWAP after such deviations.
In summary, the VWAP Rolling indicator offers traders a flexible tool to gauge average price levels and potential deviations, incorporating both price and volume dynamics. Its adaptability and standard deviation bands provide valuable insights into market sentiment and potential trading opportunities.
VWAP Trend
**Overview**
The VWAP Trend indicator is a volume-weighted price analysis tool that visualizes the relationship between price and the anchored Volume Weighted Average Price (VWAP) over different timeframes. This script is designed to reveal when the market is trending above or below its volume-weighted equilibrium point, providing a clear framework for identifying directional bias, trend strength, and potential reversals.
By combining an anchored VWAP with exponential smoothing and a secondary trend EMA, the indicator helps traders distinguish between short-term price fluctuations and genuine volume-supported directional moves.
**Core Concept**
VWAP (Volume Weighted Average Price) represents the average price of an asset weighted by traded volume. It reflects where the majority of trading activity has taken place within a chosen period, serving as a critical reference level for institutions and professional traders.
This indicator extends the traditional VWAP concept by:
1. Allowing users to **anchor VWAP to different timeframes** (Daily, Weekly, or Monthly).
2. Applying **smoothing** to create a stable reference curve less prone to noise.
3. Overlaying a **trend EMA** to identify whether current price momentum aligns with or diverges from VWAP equilibrium.
The combination of these elements produces a visual representation of price’s relationship to its fair value across time, helping to identify accumulation and distribution phases.
**Calculation Methodology**
1. **Anchored VWAP Calculation:**
The script resets cumulative volume and cumulative volume–price data at the start of each new VWAP session (based on the selected anchor timeframe). It continuously accumulates the product of price and volume, dividing this by total volume to compute the current VWAP value.
2. **Smoothing Process:**
The raw VWAP line is smoothed using an Exponential Moving Average (EMA) of user-defined length, producing a cleaner, more stable trend curve that minimizes intraperiod noise.
3. **Trend Determination:**
An additional EMA is calculated on the closing price. By comparing the position of this EMA to the smoothed VWAP, the indicator determines the prevailing market bias:
* When the trend EMA is above the smoothed VWAP, the market is considered to be in an **uptrend**.
* When the trend EMA is below the smoothed VWAP, the market is classified as a **downtrend**.
**Visual Structure**
The indicator uses color dynamics and chart overlays to make interpretation intuitive:
* **Smoothed VWAP Line:** The main trend reference, colored blue during bullish conditions and orange during bearish conditions.
* **Price Fill Region:** The area between the smoothed VWAP and price is filled with a translucent color matching the current trend, visually representing whether price is trading above or below equilibrium.
* **Trend EMA (implicit):** Although not separately plotted, it drives the color state of the VWAP, ensuring seamless visual transitions between bullish and bearish conditions.
**Inputs and Parameters**
* **VWAP Timeframe:** Choose between Daily, Weekly, or Monthly anchoring. This determines the reset frequency for cumulative volume and price data.
* **VWAP Smoothing Length:** Defines how many periods are used to smooth the VWAP line. Shorter values produce a more reactive line; longer values create smoother, steadier signals.
* **Trend EMA Length:** Sets the period for the trend detection EMA applied to price. Adjust this to calibrate how quickly the indicator reacts to directional changes.
**Interpretation and Use Cases**
* **Trend Confirmation:** When price and the trend EMA both remain above the smoothed VWAP, the market is showing strong bullish control. Conversely, consistent price action below the VWAP suggests sustained bearish sentiment.
* **Fair Value Assessment:** VWAP serves as a dynamic equilibrium level. Price repeatedly reverting to this line indicates consolidation or fair value zones, while strong directional moves away from VWAP highlight momentum phases.
* **Institutional Benchmarking:** Because large market participants often benchmark entries and exits relative to VWAP, this indicator helps align retail analysis with institutional logic.
* **Reversal Detection:** Sudden crossovers of the trend EMA relative to the VWAP can signal potential reversals or shifts in momentum strength.
**Trading Applications**
* **Trend Following:** Use VWAP’s direction and color state to determine trade bias. Long entries are favored when the VWAP turns blue, while short entries align with orange phases.
* **Mean Reversion:** In ranging conditions, traders may look for price deviations far above or below VWAP as potential reversion opportunities.
* **Multi-Timeframe Confluence:** Combine the Daily VWAP Trend with higher anchor periods (e.g., Weekly or Monthly) to confirm larger trend structure.
* **Support and Resistance Mapping:** VWAP often acts as a strong intraday or session-level support/resistance zone. The smoothed version refines this behavior into a cleaner, more reliable reference.
**Originality and Innovation**
The VWAP Trend indicator stands apart from conventional VWAP scripts through several original features:
1. **Anchor Flexibility:** Most VWAP indicators fix the anchor to a specific session (like daily). This version allows switching between Daily, Weekly, and Monthly anchors dynamically, adapting to various trading styles and time horizons.
2. **Volume-Weighted Smoothing:** The use of an EMA smoothing layer over the raw VWAP provides enhanced stability without compromising responsiveness, delivering a more analytically consistent signal.
3. **EMA-Based Trend Comparison:** By introducing a second trend EMA, the indicator creates a comparative framework that merges volume-weighted price analysis with classical momentum tracking — a rare and powerful combination.
4. **Adaptive Visual System:** The color-shifting and shaded fill between VWAP and price are integrated into a single, lightweight structure, giving traders immediate insight into market bias without the clutter of multiple overlapping indicators.
**Advantages**
* Adaptable to any market, timeframe, or trading style.
* Provides both equilibrium (VWAP) and momentum (EMA) perspectives.
* Smooths out noise while retaining the integrity of volume-based price dynamics.
* Enhances situational awareness through intuitive color-coded visualization.
* Ideal for professional, swing, and intraday traders seeking context-driven market direction.
**Summary**
The VWAP Trend indicator is a modern enhancement of the classical VWAP methodology. By merging anchored volume-weighted analysis with smoothed trend detection and visual state feedback, it provides a comprehensive perspective on market equilibrium and directional strength. It is built for traders who seek more than static price references — offering an adaptive, volume-aware framework for identifying market trends, reversals, and fair-value zones with precision and clarity.

Anchored VWAP Polyline [CHE] Anchored VWAP Polyline — Anchored VWAP drawn as a polyline from a user-defined bar count with last-bar updates and optional labels
Summary
This indicator renders an anchored Volume-Weighted Average Price as a continuous polyline starting from a user-selected anchor point a specified number of bars back. It accumulates price multiplied by volume only from the anchor forward and resets cleanly when the anchor moves. Drawing is object-based (polyline and labels) and updated on the most recent bar only, which reduces flicker and avoids excessive redraws. Optional labels mark the anchor and, conditionally, a delta label when the current close is below the historical close at the anchor offset.
Motivation: Why this design?
Anchored VWAP is often used to track fair value after a specific event such as a swing, breakout, or session start. Traditional plot-based lines can repaint during live updates or incur overhead when frequently redrawn. This implementation focuses on explicit state management, last-bar rendering, and object recycling so the line stays stable while remaining responsive when the anchor changes. The design emphasizes deterministic updates and simple session gating from the anchor.
What’s different vs. standard approaches?
Baseline: Classic VWAP lines plotted from session open or full history.
Architecture differences:
Anchor defined by a fixed bar offset rather than session or day boundaries.
Object-centric drawing via `polyline` with an array of `chart.point` objects.
Last-bar update pattern with deletion and replacement of the polyline to apply all points cleanly.
Conditional labels: an anchor marker and an optional delta label only when the current close is below the historical close at the offset.
Practical effect: You get a visually continuous anchored VWAP that resets when the anchor shifts and remains clean on chart refreshes. The labels act as lightweight diagnostics without clutter.
How it works (technical)
The anchor index is computed as the latest bar index minus the user-defined bar count.
A session flag turns true from the anchor forward; prior bars are excluded.
Two persistent accumulators track the running sum of price multiplied by volume and the running sum of volume; they reset when the session flag turns from false to true.
The anchored VWAP is the running sum divided by the running volume whenever both are valid and the volume is not zero.
Points are appended to an array only when the anchored VWAP is valid. On the most recent bar, any existing polyline is deleted and replaced with a new one built from the point array.
Labels are refreshed on the most recent bar:
A yellow warning label appears when there are not enough bars to compute the reference values.
The anchor label marks the anchor bar.
The delta label appears only when the current close is below the close at the anchor offset; otherwise it is suppressed.
No higher-timeframe requests are used; repaint is limited to normal live-bar behavior.
Parameter Guide
Bars back — Sets the anchor offset in bars; default two hundred thirty-three; minimum one. Larger values extend the anchored period and increase stability but respond more slowly to regime changes.
Labels — Toggles all labels; default enabled. Disable to keep the chart clean when using multiple instances.
Reading & Interpretation
The polyline represents the anchored VWAP from the chosen anchor to the current bar. Price above the line suggests strength relative to the anchored baseline; price below suggests weakness.
The anchor label shows where the accumulation starts.
The delta label appears only when today’s close is below the historical close at the offset; it provides a quick context for negative drift relative to that reference.
A yellow message at the current bar indicates the chart does not have enough history to compute the reference comparison yet.
Practical Workflows & Combinations
Trend following: Anchor after a breakout bar or a swing confirmation. Use the anchored VWAP as dynamic support or resistance; look for clean retests and holds for continuation.
Mean reversion: Anchor at a local extreme and watch for approaches back toward the line; require structure confirmation to avoid early entries.
Session or event studies: Re-set the anchor around earnings, macro releases, or session opens by adjusting the bar offset.
Combinations: Pair with structure tools such as swing highs and lows, or with volatility measures to filter chop. The labels can be disabled when combining multiple instances to maintain chart clarity.
Behavior, Constraints & Performance
Repaint and confirmation: The line is updated on the most recent bar only; historical values do not rely on future bars. Normal live-bar movement applies until the bar closes.
No higher timeframe: There is no `security` call; repaint paths related to higher-timeframe lookahead do not apply here.
Resources: Uses one polyline object that is rebuilt on the most recent bar, plus two labels when conditions are met. `max_bars_back` is two thousand. Arrays store points from the anchor forward; extremely long anchors or very long charts increase memory usage.
Known limits: With very thin volume, the VWAP can be unavailable for some bars. Very large anchors reduce responsiveness. Labels use ATR for vertical placement; extreme gaps can place them close to extremes.
Sensible Defaults & Quick Tuning
Starting point: Bars back two hundred thirty-three with Labels enabled works well on many assets and timeframes.
Too noisy around the line: Increase Bars back to extend the accumulation window.
Too sluggish after regime changes: Decrease Bars back to focus on a shorter anchored period.
Chart clutter with multiple instances: Disable Labels while keeping the polyline visible.
What this indicator is—and isn’t
This is a visualization of an anchored VWAP with optional diagnostics. It is not a full trading system and does not include entries, exits, or position management. Use it alongside clear market structure, risk controls, and a plan for trade management. It does not predict future prices.
Inputs with defaults
Bars back: two hundred thirty-three bars, minimum one.
Labels: enabled or disabled toggle, default enabled.
Pine version: v6
Overlay: true
Primary outputs: one polyline, optional labels (anchor, conditional delta, and a warning when insufficient bars).
Metrics and functions: volume, ATR for label offset, object drawing via polyline and chart points, last-bar update pattern.
Special techniques: session gating from the anchor, persistent state, object recycling, explicit guards against unavailable values and zero volume.
Compatibility and assets: Designed for standard candlestick or bar charts across liquid assets and common timeframes.
Diagnostics: Yellow warning label when history is insufficient.
Disclaimer
The content provided, including all code and materials, is strictly for educational and informational purposes only. It is not intended as, and should not be interpreted as, financial advice, a recommendation to buy or sell any financial instrument, or an offer of any financial product or service. All strategies, tools, and examples discussed are provided for illustrative purposes to demonstrate coding techniques and the functionality of Pine Script within a trading context.
Any results from strategies or tools provided are hypothetical, and past performance is not indicative of future results. Trading and investing involve high risk, including the potential loss of principal, and may not be suitable for all individuals. Before making any trading decisions, please consult with a qualified financial professional to understand the risks involved.
By using this script, you acknowledge and agree that any trading decisions are made solely at your discretion and risk.
Do not use this indicator on Heikin-Ashi, Renko, Kagi, Point-and-Figure, or Range charts, as these chart types can produce unrealistic results for signal markers and alerts.
Best regards and happy trading
Chervolino
VWAP Multi Sessions + EMA + TEMA + PivotThis indicator combines several technical tools in one, designed for both intraday and swing traders to provide a complete view of market dynamics.
- VWAP Multi Sessions: calculates and plots five independent VWAPs, each based on a specific time range. This allows you to better identify value zones and price evolution during different phases of the trading day.
- Moving Averages (EMA): three strategic EMAs (55, 144, and 233 periods) are included to track the broader trend and highlight potential crossovers.
- TEMA (Triple Exponential Moving Average): two TEMAs (144 and 233 periods) offer a more responsive alternative to EMAs, reducing lag while filtering out some market noise.
- Daily Levels: the previous day’s open, close, high, and low are plotted as key support and resistance references.
- Pivot Point (P): also included is the classic daily pivot from the previous session, calculated as (High + Low + Close) / 3, which acts as a central level around which price often gravitates.
In summary, this indicator combines:
- intraday value references (session VWAPs),
- trend indicators (EMA and TEMA),
- and daily reference points (OHLC and Pivot).
It is particularly suited for intraday, scalping, and swing trading strategies, helping traders anticipate potential reaction zones in the market more effectively.

FlowSpike ES — BB • RSI • VWAP + AVWAP + News MuteThis indicator is purpose-built for E-mini S&P 500 (ES) futures traders, combining volatility bands, momentum filters, and session-anchored levels into a streamlined tool for intraday execution.
Key Features:
• ES-Tuned Presets
Automatically optimized settings for scalping (1–2m), daytrading (5m), and swing trading (15–60m) timeframes.
• Bollinger Band & RSI Signals
Entry signals trigger only at statistically significant extremes, with RSI filters to reduce false moves.
• VWAP & Anchored VWAPs
Session VWAP plus anchored VWAPs (RTH open, weekly, monthly, and custom) provide high-confidence reference levels used by professional order-flow traders.
• Volatility Filter (ATR in ticks)
Ensures signals are only shown when the ES is moving enough to offer tradable edges.
• News-Time Mute
Suppresses signals around scheduled economic releases (customizable windows in ET), helping traders avoid whipsaw conditions.
• Clean Alerts
Long/short alerts are generated only when all conditions align, with optional bar-close confirmation.
Why It’s Tailored for ES Futures:
• Designed around ES tick size (0.25) and volatility structure.
• Session settings respect RTH hours (09:30–16:00 ET), the period where most liquidity and institutional flows concentrate.
• ATR thresholds and RSI bands are pre-tuned for ES market behavior, reducing the need for manual optimization.
⸻
This is not a generic indicator—it’s a futures-focused tool created to align with the way ES trades day after day. Whether you scalp the open, manage intraday swings, or align to weekly/monthly anchored flows, FlowSpike ES gives you a clear, rules-based signal framework.

VWAP 2.0 with desv + Initial Balance by RiotWolftrading🌟 Overview
This powerful tool is designed for traders who want to harness the power of the Volume Weighted Average Price (VWAP) alongside session-based ranges to make informed trading decisions. Whether you're a day trader or a swing trader, this indicator provides a clean and effective way to identify support, resistance, and market trends—all in one place! 💡
✨ Key Features
Auto-Anchored VWAP 📊
Automatically calculates the VWAP based on a user-defined anchor period (e.g., Daily, Weekly, Monthly).
Resets at the start of each period (e.g., daily for a Daily anchor).
Displays a customizable VWAP line with standard deviation bands to highlight key price levels.
Standard Deviation Bands 📏
Plots up to three sets of standard deviation bands above and below the VWAP (multipliers: 1.0, 2.0, 3.0).
Includes volume percentage labels to show where trading volume is concentrated. 📉
Session High/Low Range 🕒
Identifies the high and low prices within a customizable session (default: 12:00 to 15:31).
Draws horizontal lines at the session high and low, with dotted deviation lines for additional reference points.
Perfect for spotting key levels during your trading session! 🔑
Time-Based Range Box ⏰
Highlights a specific time window (default: 15:40 to 15:50) with a colored box showing the high and low prices.
Ideal for tracking price action during high-impact events like news releases or market opens. 📅
Alerts 🚨
Set up alerts for when the price crosses above or below the VWAP—never miss a potential trading opportunity!
⚙️ Settings
Customize the indicator to fit your trading style with these easy-to-use settings:
VWAP Settings
Timezone 🌍: Select your timezone (default: GMT+2) to align calculations with your local time.
VWAP Source 📈: Choose the price source for VWAP (default: hlc3 - average of high, low, close).
Std Deviation Multipliers 📐: Adjust the multipliers for the bands (default: 1.0, 2.0, 3.0).
Line Width ✏️: Set the thickness of the VWAP and band lines (default: 1).
Session Time ⏳: Define the session window for VWAP calculations (default: 08:00-18:00, all days).
Show Upper/Lower Bands 👀: Toggle visibility for each set of bands (default: Band 1 visible, Bands 2 & 3 hidden).
Range Settings
Range Start/End Time 🕙: Set the time window for the range box (default: 15:40 to 15:50).
Box Color 🎨: Customize the border color (default: blue).
Box Background Color 🖌️: Adjust the background color (default: light aqua, 90% transparency).
I created this indicator to provide a streamlined, clutter-free tool for traders who rely on VWAP and session-based analysis. It focuses on the essentials—VWAP, standard deviation bands, session high/low, and range box—without unnecessary overlays. I hope it helps you in your trading journey! If you have feedback or suggestions, feel free to share—I’d love to hear from you! 😊

VWAP 8EMA Crossover Scalping IndicatorWhy?
Everybody, especially in Indian context, from 9:15 AM to 3:30 PM, wants to trade in BankNifty.
And even 15m is Too Big timeframe for The Great Indian Options buyers. Everyone knows how potentially BankNifty (& FinNifty on Tuesday and Sensex on Friday) can show dance within 15m.
So there always been an overarching longing among traders to have something in shorter timeframes. And this 5m timeframe, looks like a universally (sic) accepted Standard Timeframe for Indian Options traders.
So here is this.
What?
The time we are publishing this public indicator Indian market (Nifty) is in ATH at ~22200.
In any such super trending market it's always good to wait for a dip and then in suitable time, enter the trade in the direction of the larger trend. The reversal trading systems, in such a situation, proves to be ineffective.
Of course there are time when market is sideways and keeps on oscillating between +/2 standard deviation of the 20 SMA. In such a situation the reversal play works perfectly. But not so in such a trending market.
So the question comes up - after a dip what's the right point to enter.
Hence comes the importance of such a crossover based trading system.
In this indicator, it's a well-known technique (nothing originally from ours, it's taken from social media, exact one we forgot) to find out the 8EMA and VWAP crossover.
So we learned from social media, practice in our daily trading a bit, actuate it and now publishing it.
A few salient points
It does not make sense to jump into the trade just on the crossover (or crossunder).
So we added some more sugar to it, e.g. we check the color the candle. Also the next candle if crosses and closes above (or below) the breakout candle's high/low.
The polarity (color) of both the alert (breakout/breakdown) and confirmation candle to be same (green for crossover, red from crossunder).
Of course, it does provider BUY and SELL alerts separately.
These all we have found out doing backtesting and forward testing with 1/2 lots and saw this sort of approaches works.
Hence all of these are added to this script.
Nomenclature
Here green line is the 8EMA and the red line is the VWAP.
Also there is a black dotted line. That's 50 EMA. It's to show you the trend.
The recent trade is shown in the top right of the chart as green (for buy) or red (for sell) with SL and 1:1 target.
How to trade using this system?
This is roughly we have found the best possible use of this indicator.
Lets explain with a bullish BUY positive crossover (means 8EMA is crossing over the daily VWAP)
Keep timeframe as 5m
Check the direction/slope of the black dotted line (50 EMA). If it's upwards, only take bullish positions.
Open the chart which has the VWAP. (e.g. FinNifty spot or MidcapNifty spot does not have vwap). So in those cases Future is the way to go.
Wait for a breakout crossover and let the indicator gives a green, triangular UP arrow.
Draw a horizontal line to the close of that candle for next few (say 6 candles i.e. 30m) candles.
Wait for the price first to retest the 8EMA or even better the VWAP (or near to the 8EMA, VWAP)
Let the price moves and closes above the horizontal line drawn in the 4th step.
Take a bullish trade, keeping VWAP as the SL and 1:1 as the target.
Additionally, Options buyer can consult ADX also to see if the ADX is more than 25 and moving up for the bullish trade. (This has to be added seperately in the chart, it's not a part of the indicator).
Mention
The concept we have taken from some social media. Forget exactly where we heard this first time. We just coded it with some additional steps.
Statutory Disclaimer
There is no silver bullet / holy grail in trading. Nothing works 100% time. One has to be careful about the loss (s)he can bear in case of the trade goes against.
We, as the author of this script, is not responsible for any trading or position decision one is taken based on the outcome of this.
It is our sole discretion to change, add, delete the portion or withdraw the whole script without any prior notice or intimation.
In Indian Context: We are not SEBI registered.

VWAP Bollinger BandsWhat makes this different from vwap bands / bollinger bands?
This indicator takes a bit of inspiration from bollinger but instead of utilizing built in pine script std dev that uses simple moving average internally, this version replaces that with vwap.
Also instead of traditional bollinger band basis of 20 period simple moving average, the basis here for the bands is the vwap.
How to use it?
Usage is similar to vwap itself, though the standard deviation bands will expand and contract like normal bollinger bands instead of vwap bands that just widen as the market movement continues. The bands tell a slightly different story from bollinger bands as the underlying data utilized is the vwap itself.
Which markets is this meant for?
Any market.
What conditions?
This aids in finding conditions of entry standard to vwap, but the bands could give key areas of focus for entries and exits better than standard bollinger bands or vwap bands.
Mike's VWAP Pop/Crack StratWill signal based on the VWAP Pop and Crack strategy. You can change the time frame -- default is set to current chart -- to 5 minute if you wish to use 5 minute alerts on a 1 minute, 15-second, etc. chart.
Nubia - Auto Midas Anchored VWAP [xdecow]This indicator looks for the highs and lows using the highest / lowest of 4 different periods. The default values are 17, 72, 305 and 1292 inspired by BO Williams phicube fractals.
The indicator will show anchored vwaps from those 8 dynamic points (4 tops and 4 bottoms).
A true trend is defined when 4 fractals line up without much opposite resistance (only the two smallest opposing vwaps).
When the price is between several vwaps it is a sign of consolidation or pullback. You can use larger timeframes to check for possible targets in large consolidations and pullbacks.

VWAP Timeframe Continuity (Multi-Period Anchored VWAP Alignment)Visualizes full timeframe continuity using anchored VWAPs from multiple periods — Yearly (12M), Quarterly (3M), Monthly, Weekly, Daily, 4H, 1H, 30m, and 15m (selectable).
Green candles & upper composite line:
Price above all selected VWAPs → strong bullish alignment
Red candles & lower composite line:
Price below all → strong bearish alignment
Gray/neutral: Mixed signals
Includes flip labels, customizable colors, and alerts when full continuity starts (up or down).
Great for trend confirmation, avoiding counter-trend trades, and spotting institutional bias across horizons. Toggle timeframes in settings to match your style!
(Pro tip: Longer anchors like Yearly/Quarterly carry more weight for swing/position trading.)

VWAP Gravity Oscillator (VGO) (Intraday Only)VWAP Gravity Oscillator (VGO)
The VWAP Gravity Oscillator (VGO) is an intraday analytical indicator designed to quantify price displacement from VWAP and the rate of change of that displacement.
The indicator models VWAP as a statistical equilibrium level and evaluates:
Price deviation from VWAP (Delta)
Momentum and acceleration of that deviation via MACD
This framework enables assessment of trend persistence versus mean-reversion pressure in intraday price action.
Methodology
VWAP Delta
Measures the signed distance between price and VWAP, representing directional bias relative to equilibrium.
MACD on Delta
Captures the first- and second-order dynamics of VWAP deviation, highlighting acceleration, deceleration, and potential inflection points.
Zero Line
Represents price–VWAP equilibrium. Crossings may indicate regime transitions.
Interpretation Guidelines
Positive Delta
Price is trading above VWAP with positive directional bias.
Negative Delta
Price is trading below VWAP with negative directional bias.
Increasing MACD
Expansion of VWAP deviation (trend reinforcement).
Decreasing or reversing MACD
Contraction of VWAP deviation (mean-reversion risk).
Intended Applications
Intraday trend validation
Early detection of trend exhaustion
Mean-reversion risk assessment
Filtering low-conviction or balanced market conditions
Implementation Notes
Designed exclusively for intraday timeframes
Automatically suppressed on higher-timeframe charts
Intended as a contextual analysis tool, not a standalone signal generator
Conceptual Summary
VGO evaluates whether price is diverging from, stabilising around, or reverting toward VWAP by analysing both displacement and its rate of change.

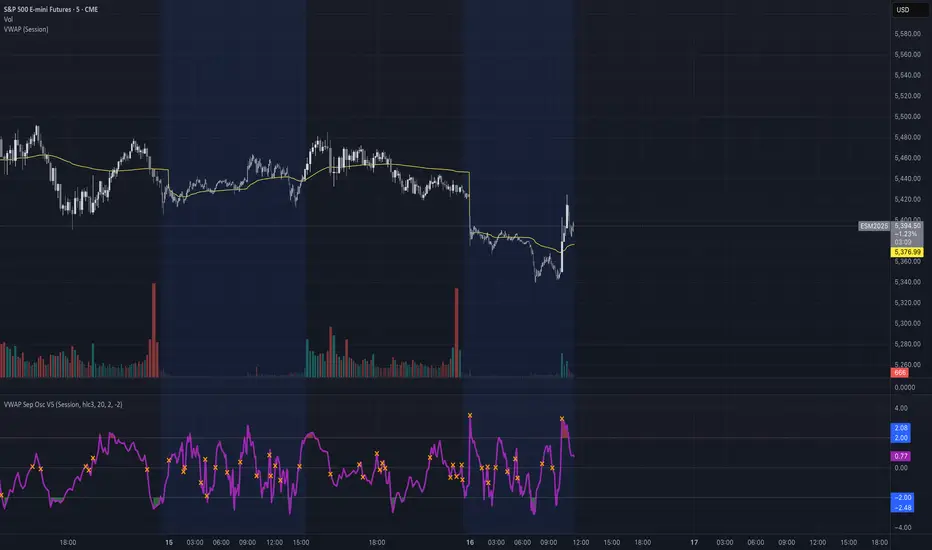
VWAP Separation Oscillator V5 (No Arrows)Okay, here is a draft description you can adapt for your TradingView publication. It starts from the basics and explains the concepts behind the indicator and how to interpret its visual elements.
VWAP Separation Oscillator
Summary
This indicator provides a normalized view of how far the current price has deviated from its Volume-Weighted Average Price (VWAP), helping traders identify potentially overbought or oversold conditions relative to recent VWAP dynamics. It calculates the price separation from VWAP and expresses it in terms of standard deviations (a Z-score), making it easier to gauge the statistical significance of the deviation.
Core Concepts Explained
What is VWAP?
VWAP stands for Volume-Weighted Average Price. It's a trading benchmark calculated by taking the total dollar value traded for every transaction (price multiplied by volume) and dividing it by the total shares traded for the day (or other chosen period).
Unlike a simple moving average, VWAP gives more weight to price levels where more volume occurred. Many institutional traders use it as a reference point for execution quality.
This indicator allows you to choose the "Anchor Period" (Session, Week, Month, etc.) which determines when the VWAP calculation resets.
What is VWAP Separation?
P
rice doesn't always stay at the VWAP; it naturally fluctuates above and below it.
"VWAP Separation" is simply the difference between the current price (Source) and the calculated VWAP value (Separation = Price - VWAP). A positive separation means the price is above VWAP; negative means below.
How Standard Deviation is Used:
While knowing the separation is useful, its significance can vary wildly between different stocks or market conditions. A $1 separation might be huge for one stock but tiny for another.
Standard Deviation is a statistical measure of how spread out data points are from their average. In this indicator, we calculate the standard deviation of the VWAP Separation over a specified Lookback Length. This tells us how volatile or dispersed the separation has been recently.
The Oscillator Line (Z-Score):
The main purple (or Green/Red) line plotted by this indicator is the Z-score of the VWAP Separation.
Formula conceptually: Oscillator Value = (Current Separation - Average Separation) / Standard Deviation of Separation
Interpretation: It tells you how many standard deviations the current separation is away from the average separation over the lookback period.
A value of +2.0 means the current separation is 2 standard deviations higher (more extended to the upside) than the average separation.
A value of -1.5 means the current separation is 1.5 standard deviations lower (more extended to the downside) than the average separation.
This normalization makes it easier to compare readings across different assets or timeframes and to define consistent thresholds for "extreme" deviations.
Visual Elements Explained
Oscillator Line: The primary line showing the Z-score value (explained above). Can optionally be colored Green/Red based on its slope (rising/falling).
Overbought Line (Solid Red): A user-defined level (default: 2.0). When the oscillator moves above this line, it suggests the price deviation above VWAP is statistically significant compared to recent history.
Oversold Line (Solid Green): A user-defined level (default: -2.0). When the oscillator moves below this line, it suggests the price deviation below VWAP is statistically significant compared to recent history.
Overbought/Oversold Zone Fills (Transparent Red/Green): These shaded areas appear only when the oscillator line enters the respective Overbought or Oversold territory (defined by the OB/OS Lines), visually highlighting these periods.
Zero Line (Dotted Gray): Represents the point where the current VWAP separation is exactly equal to the average VWAP separation over the lookback period. Crossings indicate shifts relative to this mean.
Zero Cross Markers (Orange 'X'): Small 'x' marks plotted directly on the oscillator line whenever it crosses the Zero Line, pinpointing these moments.
Potential Usage / Interpretation
Identifying Extremes: High positive values (above OB Level) or low negative values (below OS Level) can suggest the price move relative to VWAP might be over-extended and potentially due for a pause or pullback. Look for the oscillator turning back from these extremes.
Spotting Divergences: Look for discrepancies between price action and the oscillator.
Bearish Divergence: Price makes a new high, but the oscillator makes a lower high (often in the OB zone). Suggests weakening upside momentum relative to VWAP dynamics.
Bullish Divergence: Price makes a new low, but the oscillator makes a higher low (often in the OS zone). Suggests weakening downside momentum relative to VWAP dynamics.
Context is Key: This oscillator measures deviation from a specific benchmark (VWAP). Its interpretation should always be done within the context of the overall market trend, price structure (support/resistance), volume analysis, and potentially other confirming indicators.
Disclaimer: This indicator is a tool for analysis, not a standalone trading system. It does not provide financial advice. Always use risk management.
Settings Overview
Anchor Period: Determines how often the VWAP calculation resets (Session, Week, Month, etc.).
Source: The price data used for the separation calculation (default: hlc3).
Lookback Length: The number of bars used to calculate the average and standard deviation of the separation, influencing the oscillator's responsiveness.
Overbought/Oversold Levels: User-defined thresholds for identifying extreme Z-score values.
Color Oscillator Line: Option to color the oscillator line based on whether it's rising or falling.
VWAP Bollinger Band Crossover Breakout with ResistanceCredit to © Jesus_Salvatierra for VWAP script
This script help you find a trend in momentum stock that is about to breakout and shows resistance point. This script utilizes Bollinger bands VWAP and is good for intra day charts.
VWAP, or Volume Weighted Average Price, is a technical analysis tool used to measure the average price a security trades at during a given time period, weighted by the trading volume for each price level. It is commonly used by traders and investors to identify the true average price of a security and to assess whether they are buying or selling at a fair price.
A Bollinger Band is a technical analysis tool that uses standard deviation to measure the volatility of a security. The Bollinger Band is typically composed of three lines: the upper band, the lower band, and the middle band. The middle band is a simple moving average of the security's price, while the upper and lower bands are calculated based on the standard deviation of the security's price.
A Bollinger Band crossover occurs when the price of a security crosses above or below one of the bands. When the price crosses above the upper band, it is considered overbought, while when it crosses below the lower band, it is considered oversold. Traders often use Bollinger Band crossovers as a signal to enter or exit a position, depending on their trading strategy.
The VWAP and Bollinger Band crossover are two separate technical analysis tools that can be used in conjunction with each other. When a security's price crosses above or below the Bollinger Band, traders may look to the VWAP to confirm whether the security is trading at a fair price. If the security is trading above the VWAP, it may be overvalued, while if it is trading below the VWAP, it may be undervalued. Similarly, traders may use the Bollinger Band crossover as a signal to enter or exit a position, while also taking into account the VWAP to assess whether the price is fair.

JS-TechTrading: VWAP Momentum_Pullback StrategyGeneral Description and Unique Features of this Script
Introducing the VWAP Momentum-Pullback Strategy (long-only) that offers several unique features:
1. Our script/strategy utilizes Mark Minervini's Trend-Template as a qualifier for identifying stocks and other financial securities in confirmed uptrends.
NOTE: In this basic version of the script, the Trend-Template has to be used as a separate indicator on TradingView (Public Trend-Template indicators are available on TradingView – community scripts). It is recommended to only execute buy signals in case the stock or financial security is in a stage 2 uptrend, which means that the criteria of the trend-template are fulfilled.
2. Our strategy is based on the supply/demand balance in the market, making it timeless and effective across all timeframes. Whether you are day trading using 1- or 5-min charts or swing-trading using daily charts, this strategy can be applied and works very well.
3. We have also integrated technical indicators such as the RSI and the MA / VWAP crossover into this strategy to identify low-risk pullback entries in the context of confirmed uptrends. By doing so, the risk profile of this strategy and drawdowns are being reduced to an absolute minimum.
Minervini’s Trend-Template and the ‘Stage-Analysis’ of the Markets
This strategy is a so-called 'long-only' strategy. This means that we only take long positions, short positions are not considered.
The best market environment for such strategies are periods of stable upward trends in the so-called stage 2 - uptrend.
In stable upward trends, we increase our market exposure and risk.
In sideways markets and downward trends or bear markets, we reduce our exposure very quickly or go 100% to cash and wait for the markets to recover and improve. This allows us to avoid major losses and drawdowns.
This simple rule gives us a significant advantage over most undisciplined traders and amateurs!
'The Trend is your Friend'. This is a very old but true quote.
What's behind it???
• 98% of stocks made their biggest gains in a Phase 2 upward trend.
• If a stock is in a stable uptrend, this is evidence that larger institutions are buying the stock sustainably.
• By focusing on stocks that are in a stable uptrend, the chances of profit are significantly increased.
• In a stable uptrend, investors know exactly what to expect from further price developments. This makes it possible to locate low-risk entry points.
The goal is not to buy at the lowest price – the goal is to buy at the right price!
Each stock goes through the same maturity cycle – it starts at stage 1 and ends at stage 4
Stage 1 – Neglect Phase – Consolidation
Stage 2 – Progressive Phase – Accumulation
Stage 3 – Topping Phase – Distribution
Stage 4 – Downtrend – Capitulation
This strategy focuses on identifying stocks in confirmed stage 2 uptrends. This in itself gives us an advantage over long-term investors and less professional traders.
By focusing on stocks in a stage 2 uptrend, we avoid losses in downtrends (stage 4) or less profitable consolidation phases (stages 1 and 3). We are fully invested and put our money to work for us, and we are fully invested when stocks are in their stage 2 uptrends.
But how can we use technical chart analysis to find stocks that are in a stable stage 2 uptrend?
Mark Minervini has developed the so-called 'trend template' for this purpose. This is an essential part of our JS-TechTrading pullback strategy. For our watchlists, only those individual values that meet the tough requirements of Minervini's trend template are eligible.
The Trend Template
• 200d MA increasing over a period of at least 1 month, better 4-5 months or longer
• 150d MA above 200d MA
• 50d MA above 150d MA and 200d MA
• Course above 50d MA, 150d MA and 200d MA
• Ideally, the 50d MA is increasing over at least 1 month
• Price at least 25% above the 52w low
• Price within 25% of 52w high
• High relative strength according to IBD.
NOTE: In this basic version of the script, the Trend-Template has to be used as a separate indicator on TradingView (Public Trend-Template indicators are available in TradingView – community scripts). It is recommended to only execute buy signals in case the stock or financial security is in a stage 2 uptrend, which means that the criteria of the trend-template are fulfilled.
This strategy can be applied to all timeframes from 5 min to daily.
The VWAP Momentum-Pullback Strateg y
For the JS-TechTrading VWAP Momentum-Pullback Strategy, only stocks and other financial instruments that meet the selected criteria of Mark Minervini's trend template are recommended for algorithmic trading with this startegy.
A further prerequisite for generating a buy signals is that the individual value is in a short-term oversold state (RSI).
When the selling pressure is over and the continuation of the uptrend can be confirmed by the MA / VWAP crossover after reaching a price low, a buy signal is issued by this strategy.
Stop-loss limits and profit targets can be set variably.
Relative Strength Index (RSI)
The Relative Strength Index (RSI) is a technical indicator developed by Welles Wilder in 1978. The RSI is used to perform a market value analysis and identify the strength of a trend as well as overbought and oversold conditions. The indicator is calculated on a scale from 0 to 100 and shows how much an asset has risen or fallen relative to its own price in recent periods.
The RSI is calculated as the ratio of average profits to average losses over a certain period of time. A high value of the RSI indicates an overbought situation, while a low value indicates an oversold situation. Typically, a value > 70 is considered an overbought threshold and a value < 30 is considered an oversold threshold. A value above 70 signals that a single value may be overvalued and a decrease in price is likely , while a value below 30 signals that a single value may be undervalued and an increase in price is likely.
For example, let's say you're watching a stock XYZ. After a prolonged falling movement, the RSI value of this stock has fallen to 26. This means that the stock is oversold and that it is time for a potential recovery. Therefore, a trader might decide to buy this stock in the hope that it will rise again soon.
The MA / VWAP Crossover Trading Strategy
This strategy combines two popular technical indicators: the Moving Average (MA) and the Volume Weighted Average Price (VWAP). The MA VWAP crossover strategy is used to identify potential trend reversals and entry/exit points in the market.
The VWAP is calculated by taking the average price of an asset for a given period, weighted by the volume traded at each price level. The MA, on the other hand, is calculated by taking the average price of an asset over a specified number of periods. When the MA crosses above the VWAP, it suggests that buying pressure is increasing, and it may be a good time to enter a long position. When the MA crosses below the VWAP, it suggests that selling pressure is increasing, and it may be a good time to exit a long position or enter a short position.
Traders typically use the MA VWAP crossover strategy in conjunction with other technical indicators and fundamental analysis to make more informed trading decisions. As with any trading strategy, it is important to carefully consider the risks and potential rewards before making any trades.
This strategy is applicable to all timeframes and the relevant parameters for the underlying indicators (RSI and MA/VWAP) can be adjusted and optimized as needed.
Backtesting
Backtesting gives outstanding results on all timeframes and drawdowns can be reduced to a minimum level. In this example, the hourly chart for MCFT has been used.
Settings for backtesting are:
- Period from April 2020 until April 2021 (1 yr)
- Starting capital 100k USD
- Position size = 25% of equity
- 0.01% commission = USD 2.50.- per Trade
- Slippage = 2 ticks
Other comments
• This strategy has been designed to identify the most promising, highest probability entries and trades for each stock or other financial security.
• The RSI qualifier is highly selective and filters out the most promising swing-trading entries. As a result, you will normally only find a low number of trades for each stock or other financial security per year in case you apply this strategy for the daily charts. Shorter timeframes will result in a higher number of trades / year.
• As a result, traders need to apply this strategy for a full watchlist rather than just one financial security.

VWAP Supply and Demand ZonesThis is my 1st indicator enjoy.
Description of the VWAP Supply and Demand Zones indicator:
This indicator uses the Volume Weighted Average Price (VWAP) to identify potential supply and demand zones in the market. The VWAP is a popular indicator that shows the average price of a security weighted by volume over a specified period of time. It can be used as a benchmark to measure the efficiency of trading and to identify trends and price levels.
The indicator plots the VWAP as a blue line on the chart, and also plots two other lines above and below it, which represent the upper and lower bounds of the supply and demand zones. The width of these zones can be adjusted by changing the “Zone Width” input parameter.
The indicator also plots shapes on the chart to mark when a supply or demand zone is formed. A supply zone is formed when the price crosses above the VWAP and then falls back below it, indicating that there is more selling pressure than buying pressure at that level. A red triangle is plotted above the bar where this happens, and a red zone is drawn between the previous close and previous VWAP values.
A demand zone is formed when the price crosses below the VWAP and then rises back above it, indicating that there is more buying pressure than selling pressure at that level. A green triangle is plotted below the bar where this happens, and a green zone is drawn between the previous close and previous VWAP values.
The supply and demand zones can be used as potential areas of support and resistance, where traders can look for reversal or continuation signals. For example, if the price enters a supply zone from below, it may indicate that sellers are willing to sell at higher prices, which could lead to a bearish reversal. Conversely, if the price enters a demand zone from above, it may indicate that buyers are willing to buy at lower prices, which could lead to a bullish reversal.
The indicator can be applied to any timeframe or market, but it may work better on higher timeframes where volume data is more reliable. It can also be combined with other indicators or tools to confirm or filter signals.

VWAP + EMA Analysis [Joshlo]Overview and Use Case
VWAP Analysis gives the possibility to combine multiple time frames of VWAP along with a triplet of exponential moving averages. This can provide insight into potential scalp, swing and longer term trades, depending on your time frame. The use of this indicator with it's setup is based off the the Scalp Setup Alerts provided by Roensch Capital.
The primary use for this script is to help with intraday scalp set ups. Using the Daily VWAP, turned on by default, we can look for price to respect and bounce from one of the VWAP lines (support or resistance) back toward equilibrium, we can also look for price to bounce off of equilibrium and move back toward VWAP support or resistance.
The chart attached shows AMD bouncing off of the Daily time frame VWAP Resistance level multiple times (see yellow boxes), often with confirmation given by an increase in volume which is often far higher than the average volume. In many of these cases a short position could've been opened or put option could have been placed with a profitable outcome.
Every line projected onto the chart via this indicator has the potential to create support or resistance as well as causing 'hang ups', meaning price loses it's momentum, slows down and hangs out in the particular area. This is shown on the chart within the green box.
Chart walkthrough - See attached chart
After a rejection off of the Daily VWAP Resistance line (depicted by the white circle), price starts to move back toward Daily VWAP Equilibrium. In order to reach this line, price needs to move through the 20EMA (white) and 50EMA (purple), the Weekly VWAP Resistance (red circles) and the 200EMA (orange). All of these lines are a part of this single indicator.
The 20EMA seems to offer little resistance but follows the price on it's move, offering some resistance to a volatile move upward. Initially upon contact with the 50EMA, price hangs up and bounces above and below the line whilst finding support on the Weekly VWAP Resistance at the same time. This causes a 'hang up' or sideways movement for around 20 minutes of trading. A potential trade may have entered at the white circle with a VWAP Resistance rejection and exited upon contact with the 50EMA in anticipation of multiple EMAs and support / resistance lines converging which is known to cause price movement to slow.
Eventually with an increase in volume, price breaks below the 20EMA (white), 50EMA (purple) and the Weekly VWAP Resistance level (red circles). Price then finds support on the 200EMA (orange), although there was potential for the price to fall to the Daily VWAP Equilibrium (solid blue). As the Red VWAP lines tend to act more often as resistance as opposed to support (price is rarely above these lines for extended periods), the trade from earlier may have profited more by awaiting contact with the 200EMA before exiting, taking the assumption that the Weekly VWAP Resistance was more likely to act as resistance than support.
A period of consolidation in the green box, around the Weekly VWAP Resistance, 20EMA, 50EMA and with support from the 200EMA eventually resulted in another break out where the price came back up to the Daily VWAP Resistance. Prior to the end of this trading day, there were two more opportunities for scalp setups based off of the price showing consistent rejections off the Daily VWAP Resistance back down to the 50EMA.
In the final example, price breaks above the Daily VWAP Resistance but quickly rejects off of the Monthly VWAP Resistance. For examples where the VWAP Resistance or Support or broken, it can help to look at an indicator such as the RSI to look for bullish divergence or bearish divergence.
Just as this example shows bounces and rejection off of VWAP Resistance, the same applies around the Equilibrium and Support VWAP lines.
The perfect scenario would be to find a ticker where there has already been two or three bounces off of one of these levels, with the goal of taking the trade on the next bounce and either using a percentage price target or technical price target based off of the EMAs or VWAP lines. If there are EMAs close in the direction you want to take the trade, there is a higher chance of hang ups and reversals, so a clear run is the more desired trade set up.
You can also look for these indicator lines to stack up in order to form a stronger support and resistance. For example the 200EMA and Daily VWAP Equilibrium being close to each other may suggest it would take more of an effort to break both of these levels, but one by itself may break more easily.
Indicator Setup
In the settings for the indicator, almost everything you might want to change can be done from the Input tab.
The three options for VWAP (daily, weekly and monthly) allow for analysis on multiple time frames. Daily is turned on as standard.
Standard Deviation Multiplier is set to 2 as standard, this effects the distance of the VWAP support and resistance from the equilibrium line. This seems to be a level that works well with finding support and resistance lines, however if there is excessively high or low volume, occasionally the lines can be thrown off. You can adjust this level if required to find a 'sweet spot' where price likes to reject or find support.
The colors for all VWAPs can be adjusted via the Inputs tab, however if you'd like to change the type of line these are depicted as, this can be done from the Styles tab.
The 3 EMAs (20, 50 and 200) can be toggled on or off and also have their color changed. The style of the lines can be adjusted from with the Styles tab if required.

Multi-Timeframe VWAPShows the Daily, Weekly, Monthly, Quarterly, and Yearly VWAP.
Also shows the previous closing VWAP, which is usually very near the HLC3 standard pivot for the previous time frame. i.e. The previous daily VWAP closing price is usually near the current Daily Pivot. Tickers interact well with the previous Daily and Weekly closing VWAP.
Enabling the STDEV bands shows 3 separate standard deviation levels, defaulted at 1, 2, and 3. The lookback period for the bands is always changing with each new bar, since the standard deviation is calculated from the current bar to the beginning of the period. This is different from bollinger bands, as the lookback is constant (usually 20 periods is the textbook default).
The STDEV bands interval of interest can be changed from Day (D), Week (W), Month (M), Quarter (Q), Year (Y).
Tickers tend to bounce very well on Daily, Weekly, and Yearly VWAP (Yes... Year). Use this code and observe the Year VWAP on several major symbols through the past few years and eyes will be opened.