Wavelet Filter with Adaptive Upsampling [BackQuant]Wavelet Filter with Adaptive Upsampling
The Wavelet Filter with Adaptive Upsampling is an advanced filtering and signal reconstruction tool designed to enhance the analysis of financial time series data. It combines wavelet transforms with adaptive upsampling techniques to filter and reconstruct price data, making it ideal for capturing subtle market movements and enhancing trend detection. This system uses high-pass and low-pass filters to decompose the price series into different frequency components, applying adaptive thresholding to eliminate noise and preserve relevant signal information.
Shout out to Loxx for the Least Squares fitting of trigonometric series and Quinn and Fernandes algorithm for finding frequency
www.tradingview.com
Key Features
1. Frequency Decomposition with High-Pass and Low-Pass Filters:
The indicator decomposes the input time series using high-pass and low-pass filters to separate the high-frequency (detail) and low-frequency (trend) components of the data. This decomposition allows for a more accurate analysis of underlying trends, while mitigating the impact of noise.
2. Soft Thresholding for Noise Reduction:
A soft thresholding function is applied to the high-frequency component, allowing for the reduction of noise while retaining significant market signals. This function adjusts the coefficients of the high-frequency data, removing small fluctuations and leaving only the essential price movements.
3. Adaptive Upsampling Process:
The upsampling process in this script can be customized using different methods: sinusoidal upsampling, advanced upsampling, and simple upsampling. Each method serves a unique purpose:
Sinusoidal Upsample uses a sine wave to interpolate between data points, providing a smooth transition.
Advanced Upsample utilizes a Quinn-Fernandes algorithm to estimate frequency and apply more sophisticated interpolation techniques, adapting to the market’s cyclical behavior.
Simple Upsample linearly interpolates between data points, providing a basic upsampling technique for less complex analysis.
4. Reconstruction of Filtered Signal:
The indicator reconstructs the filtered signal by summing the high and low-frequency components after upsampling. This allows for a detailed yet smooth representation of the original time series, which can be used for analyzing underlying trends in the market.
5. Visualization of Reconstructed Data:
The reconstructed series is plotted, showing how the upsampling and filtering process enhances the clarity of the price movements. Additionally, the script provides the option to visualize the log returns of the reconstructed series as a histogram, with positive returns shown in green and negative returns in red.
6. Cumulative Series and Trend Detection:
A cumulative series is plotted to visualize the compounded effect of the filtered and reconstructed data. This feature helps traders track the overall performance of the asset over time, identifying whether the asset is following a sustained upward or downward trend.
7. Adaptive Thresholding and Noise Estimation:
The system estimates the noise level in the high-frequency component and applies an adaptive thresholding process based on the standard deviation of the downsampled data. This ensures that only significant price movements are retained, further refining the trend analysis.
8. Customizable Parameters for Flexibility:
Users can customize the following parameters to adjust the behavior of the indicator:
Frequency and Phase Shift: Control the periodicity of the wavelet transformation and the phase of the upsampling function.
Upsample Factor: Adjust the level of interpolation applied during the upsampling process.
Smoothing Period: Determine the length of time used to smooth the signal, helping to filter out short-term fluctuations.
References
Enhancing Cross-Sectional Currency Strategies with Context-Aware Learning to Rank
arxiv.org
Daubechies Wavelet - Wikipedia
en.wikipedia.org
Quinn Fernandes Fourier Transform of Filtered Price by Loxx
Note on Usage for Mean-Reversion Strategy
This indicator is primarily designed for trend-following strategies. However, by taking the inverse of the signals, it can be adapted for mean-reversion strategies. This involves buying underperforming assets and selling outperforming ones. Caution: This method may not work effectively with highly correlated assets, as the price movements between correlated assets tend to mirror each other, limiting the effectiveness of mean-reversion strategies.
Final Thoughts
The Wavelet Filter with Adaptive Upsampling is a powerful tool for traders seeking to improve their understanding of market trends and noise. By using advanced wavelet decomposition and adaptive upsampling, this system offers a clearer, more refined picture of price movements, enhancing trend-following strategies. It’s particularly useful for detecting subtle shifts in market momentum and reconstructing price data in a way that removes noise, providing more accurate insights into market conditions.
Cari dalam skrip untuk "wave"

WAVES by WestmontWAVES by Westmont is a trading indicator that combines WaveTrend analysis with VWAP dynamics to provide traders with insights into market momentum , volatility , and trends . Users can rely on this tool to help identify market shifts , potential trend reversals , and momentum changes . The script integrates custom logic with standard public domain functions to enhance signal accuracy and market analysis.
WAVES builds on familiar tools, such as the Exponential Moving Average ( EMA ), Simple Moving Average ( SMA ), and basic fractal analysis , to create a comprehensive view of price behavior. Users can interpret this indicator to gain a clearer picture of market conditions, utilizing both WaveTrend’s trend-following signals and VWAP’s volume-weighted price reference.
How the Components Work Together:
Divergence Functions
WAVES uses the bottom_fractal and bot_fractal functions to detect local highs and lows, helping identify potential reversal points in the market. These functions work alongside the WaveTrend and VWAP analysis to confirm or challenge potential turning points.
WaveTrend Calculation
ESA (Exponential Smoothing Average): Provides a smoothed base for price direction.
DE (Deviation): Measures volatility, indicating how much price is fluctuating.
CI (Commodity Channel Index): Tracks cycles between price and the smoothed ESA, identifying potential price shifts.
These values are smoothed using EMA and SMA for greater stability. Users can rely on these smoothed signals to reduce noise and improve trend clarity.
VWAP Area Calculation
Users can observe the VWAP area , calculated from the difference between two WaveTrend lines ( wavetrend1 and wavetrend2 ), to understand market equilibrium in relation to volume-weighted price action. The VWAP area provides a clearer picture of price movement relative to market volume.
Signal Dots and Visualization
Bullish Signals: Users can look for blue dots when the VWAP area crosses upwards , indicating that price is above the VWAP and suggesting upward momentum .
Bearish Signals: Users can look for purple dots when the VWAP area crosses downwards , indicating that price is below the VWAP and suggesting downward momentum .
Smooth VWAP Gradient Fill
Users can visually track momentum using the smooth gradient fill between the VWAP plot and the center line . The fill color changes from blue ( positive momentum ) to purple ( negative momentum ), and turquoise ( neutral ), helping traders quickly assess market sentiment and trend strength.
How to Use WAVES by Westmont :
Bullish Momentum : Users can look for blue dots when the VWAP area crosses upward . This suggests the market is in an uptrend as price moves above the VWAP , potentially indicating upward price action .
Bearish Momentum : Users can look for purple dots when the VWAP area crosses downward . This suggests the market is in a downtrend as price moves below the VWAP , indicating potential for downward price action .
Neutral Market Conditions : Users can observe when the VWAP area remains near the center line ( turquoise ), indicating market consolidation or indecision .
Code Usage :
The indicator uses TradingView’s built-in functions (EMA, SMA, and fractals), which are well-optimized for standard technical analysis. These functions serve as a foundation for the indicator’s calculations. Users can trust that the public domain functions ensure efficient performance, while the added customizations enhance signal quality by integrating WaveTrend and VWAP dynamics.

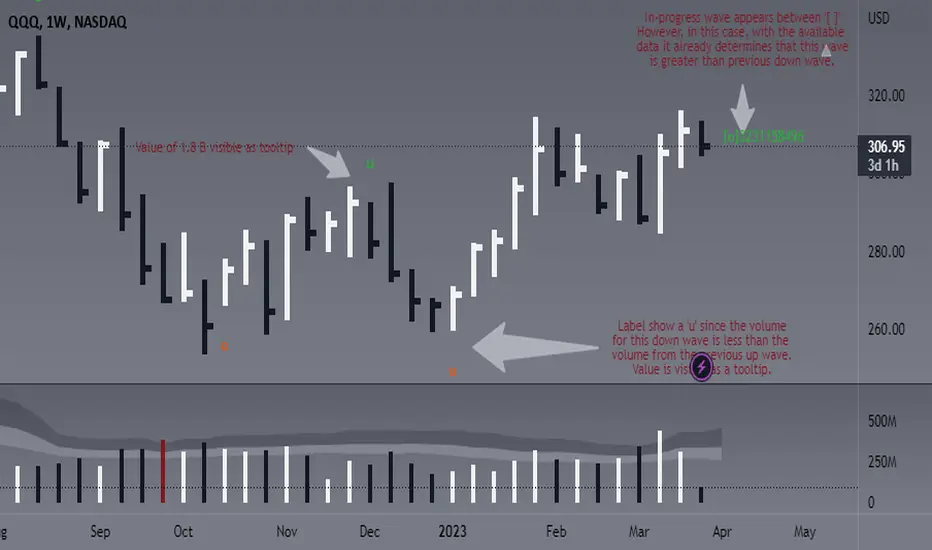
Weis Wave Volume - Simple labels and comparisonThis script is designed to identify and display the Weis Wave Volume on a chart. The Weis Wave Volume is a volume-based indicator that helps traders analyze market waves, identify trend reversals, and assess the strength of a trend. The script calculates wave volume based on user-defined input parameters, detects price waves, and displays the results as labels on the chart.
This version in particular is based on ideas from @the_MarketWhisperer and some other pieces of the script from @LucF.
The overall functionality of the script is to identify price waves and their corresponding volume. It does this by determining the trend direction and detecting trend reversals based on user-defined inputs such as the Trend reversal length and Price source for trend detection. The script also calculates and displays the cumulative volume of the current wave, the number of bars in the wave, the average volume in the wave, and consecutive increasing average volume bars in the same wave:
- An 'o' is printed to show that the volume of the current wave was 'O'ver/ above the count of the volume from preceding wave (regardless of it being up or down).
- An 'u' is printed to show that the volume of the current wave was 'U'nder/ below the count of the volume from preceding wave (regardless of it being up or down).
- Current wave will be between ' ' signaling that the wave is not confirmed yet.
- Actual values for the wave are available as tooltips. You decide how many bars to show the labels for, but for now and since I am a fan of clean charts, this is set to 50.
The user can adjust various inputs that affect the output of the script, such as Trend reversal length, Price source for trend detection, Labels for X last bars. Adjusting these inputs allows the trader to customize the script's behavior to better suit their trading style or specific market conditions. For example, by increasing the Trend reversal length, the script will require more consecutive bars in the opposite direction to confirm a trend reversal, potentially filtering out shorter-term price fluctuations. Similarly, adjusting the Price source for trend detection allows the user to base trend calculations on different price values, such as the high, low, or close of each bar.
In addition to the customizable inputs, the user can enable or disable the display of pivot markers and choose the colors for the up and down volume labels. This helps the trader to easily visualize and analyze the wave volume information on the chart.
In summary, this script offers traders a powerful tool for visualizing and analyzing the Weis Wave Volume on a chart. By identifying price waves, detecting trend reversals, and providing insights into the strength of a trend based on volume, the script can be a valuable addition to a trader's technical analysis toolbox. Please note this is not meant to provide any buy or sell signals, it should be rather used to complement your existing analysis.
Have fun and trade wisely ;)
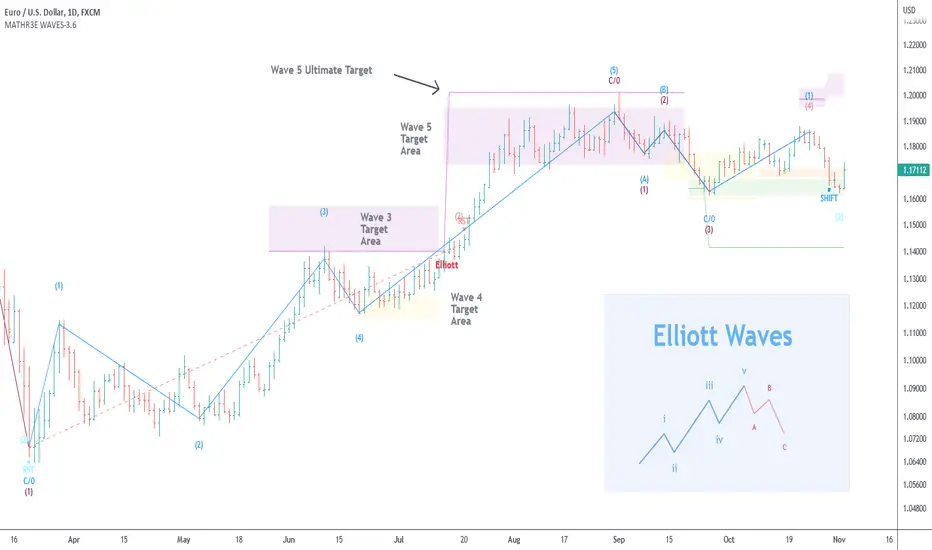
MATHR3E WAVES█ OVERVIEW
MATHR3E WAVES automatically draws Elliott Waves on your charts with their potential associated targets.
█ CONCEPTS
Disclaimer
MATHR3E RETRACEMENTS indicator is intended for advanced traders and may fit your profile, whether you are a day trader or a long-term investor.
It was originally developed by a renowned market analyst and documented in numerous books. Among them is the author Jason Perl.
It is recommended to have read the trading techniques mentioned in the books covering this indicator beforehand.
How to use:
MATHR3E WAVES indicator can provide a roadmap of market direction that you can use to determine price targets and isolate exhaustion points from potential trends in conjunction with other indicators by the same author.
Be aware the indicator's approach is derived from the Elliott wave theory and may slightly diverge from the cardinal rules of Elliott waves.
Principle of the Elliott Wave Theory
Movement in the direction of the trend is unfolding in 5 waves (called motive wave) while any correction against the trend is in three waves (called corrective wave). The movement in the direction of the trend is labeled as 1, 2, 3, 4, and 5. The three-wave correction is labeled as a, b, and c. These patterns can be seen in the long term as well as short term charts.
Wave 1:
Wave one is rarely obvious at its inception. When the first wave of a new bull market begins, the fundamental news is almost universally negative. The previous trend is considered still strongly in force. Fundamental analysts continue to revise their earnings estimates lower; the economy probably does not look strong. Sentiment surveys are decidedly bearish, put options are in vogue, and implied volatility in the options market is high. Volume might increase a bit as prices rise, but not by enough to alert many technical analysts.
Wave 2:
Wave two corrects wave one, but can never extend beyond the starting point of wave one. Typically, the news is still bad. As prices retest the prior low, bearish sentiment quickly builds, and "the crowd" haughtily reminds all that the bear market is still deeply ensconced. Still, some positive signs appear for those who are looking: volume should be lower during wave two than during wave one, prices usually do not retrace more than 61.8% of the wave one gains, and prices should fall in a three-wave pattern.
Wave 3:
Wave three is usually the largest and most powerful wave in a trend. The news is now positive and fundamental analysts start to raise earnings estimates. Prices rise quickly, corrections are short-lived and shallow. Anyone looking to "get in on a pullback" will likely miss the boat. As wave three starts, the news is probably still bearish, and most market players remain negative; but by wave three's midpoint, "the crowd" will often join the new bullish trend. Wave three often extends wave one by a ratio of 1.618:1.
Wave 4:
Wave four is typically clearly corrective. Prices may meander sideways for an extended period, and wave four typically retraces less than 38.2% of wave three. Volume is well below that of wave three. This is a good place to buy a pullback if you understand the potential ahead for wave 5. Still, fourth waves are often frustrating because of their lack of progress in the larger trend.
Wave 5:
Wave five is the final leg in the direction of the dominant trend. The news is almost universally positive and everyone is bullish. Unfortunately, this is when many average investors finally buy-in, right before the top. Volume is often lower in wave five than in wave three, and many momentum indicators start to show divergences (prices reach a new high but the indicators do not reach a new peak).
Wave A:
Corrections are typically harder to identify than impulse moves. In wave A of a bear market, the fundamental news is usually still positive. Most analysts see the drop as a correction in a still-active bull market. Some technical indicators that accompany wave A include increased volume, rising implied volatility in the options markets, and possibly a turn higher in open interest in related futures markets.
Wave B:
Prices reverse higher, which many see as a resumption of the now long-gone bull market. Those familiar with classical technical analysis may see the peak as the right shoulder of a head and shoulders reversal pattern. The volume during wave B should be lower than in wave A. By this point, fundamentals are probably no longer improving, but they most likely have not yet turned negative.
Wave C:
Prices move impulsively lower in five waves. Volume picks up, and by the third leg of wave C, almost everyone realizes that a bear market is firmly entrenched. Wave C is typically at least as large as wave A and often extends to 1.618 times wave A or beyond.
█ FEATURES & BENEFITS
Versatile
The indicator works on relative price action, so you can apply it without having to change any of the default settings.
Targets:
Customize the high and low wave targets to identify possible price target areas.
Adjustable Rules:
• Shift Wave 2: if Wave 4 closes below the low close of Wave 2.
• Shift Wave 4: if Wave A closes below the low close of Wave 4.
• Allow Wave 4 to overlap Wave 1
• Allow truncated Wave 5
• Allow truncated Wave C
Price ratio:
Force waves 2/4 to retrace to a specific Fibonacci level.
Force Waves 3/5 size to a specific Fibonacci level.
Time Ratio:
Force selected waves to last a required number of bars.
Alerts:
Set up your alerts and receive notifications on wave completion.
Alerts format can be adapted to be received on Discord servers.
WaveTrend 3D█ OVERVIEW
WaveTrend 3D (WT3D) is a novel implementation of the famous WaveTrend (WT) indicator and has been completely redesigned from the ground up to address some of the inherent shortcomings associated with the traditional WT algorithm.
█ BACKGROUND
The WaveTrend (WT) indicator has become a widely popular tool for traders in recent years. WT was first ported to PineScript in 2014 by the user @LazyBear, and since then, it has ascended to become one of the Top 5 most popular scripts on TradingView.
The WT algorithm appears to have origins in a lesser-known proprietary algorithm called Trading Channel Index (TCI), created by AIQ Systems in 1986 as an integral part of their commercial software suite, TradingExpert Pro. The software’s reference manual states that “TCI identifies changes in price direction” and is “an adaptation of Donald R. Lambert’s Commodity Channel Index (CCI)”, which was introduced to the world six years earlier in 1980. Interestingly, a vestige of this early beginning can still be seen in the source code of LazyBear’s script, where the final EMA calculation is stored in an intermediate variable called “tci” in the code.
█ IMPLEMENTATION DETAILS
WaveTrend 3D is an alternative implementation of WaveTrend that directly addresses some of the known shortcomings of the indicator, including its unbounded extremes, susceptibility to whipsaw, and lack of insight into other timeframes.
In the canonical WT approach, an exponential moving average (EMA) for a given lookback window is used to assess the variability between price and two other EMAs relative to a second lookback window. Since the difference between the average price and its associated EMA is essentially unbounded, an arbitrary scaling factor of 0.015 is typically applied as a crude form of rescaling but still fails to capture 20-30% of values between the range of -100 to 100. Additionally, the trigger signal for the final EMA (i.e., TCI) crossover-based oscillator is a four-bar simple moving average (SMA), which further contributes to the net lag accumulated by the consecutive EMA calculations in the previous steps.
The core idea behind WT3D is to replace the EMA-based crossover system with modern Digital Signal Processing techniques. By assuming that price action adheres approximately to a Gaussian distribution, it is possible to sidestep the scaling nightmare associated with unbounded price differentials of the original WaveTrend method by focusing instead on the alteration of the underlying Probability Distribution Function (PDF) of the input series. Furthermore, using a signal processing filter such as a Butterworth Filter, we can eliminate the need for consecutive exponential moving averages along with the associated lag they bring.
Ideally, it is convenient to have the resulting probability distribution oscillate between the values of -1 and 1, with the zero line serving as a median. With this objective in mind, it is possible to borrow a common technique from the field of Machine Learning that uses a sigmoid-like activation function to transform our data set of interest. One such function is the hyperbolic tangent function (tanh), which is often used as an activation function in the hidden layers of neural networks due to its unique property of ensuring the values stay between -1 and 1. By taking the first-order derivative of our input series and normalizing it using the quadratic mean, the tanh function performs a high-quality redistribution of the input signal into the desired range of -1 to 1. Finally, using a dual-pole filter such as the Butterworth Filter popularized by John Ehlers, excessive market noise can be filtered out, leaving behind a crisp moving average with minimal lag.
Furthermore, WT3D expands upon the original functionality of WT by providing:
First-class support for multi-timeframe (MTF) analysis
Kernel-based regression for trend reversal confirmation
Various options for signal smoothing and transformation
A unique mode for visualizing an input series as a symmetrical, three-dimensional waveform useful for pattern identification and cycle-related analysis
█ SETTINGS
This is a summary of the settings used in the script listed in roughly the order in which they appear. By default, all default colors are from Google's TensorFlow framework and are considered to be colorblind safe.
Source: The input series. Usually, it is the close or average price, but it can be any series.
Use Mirror: Whether to display a mirror image of the source series; for visualizing the series as a 3D waveform similar to a soundwave.
Use EMA: Whether to use an exponential moving average of the input series.
EMA Length: The length of the exponential moving average.
Use COG: Whether to use the center of gravity of the input series.
COG Length: The length of the center of gravity.
Speed to Emphasize: The target speed to emphasize.
Width: The width of the emphasized line.
Display Kernel Moving Average: Whether to display the kernel moving average of the signal. Like PCA, an unsupervised Machine Learning technique whereby neighboring vectors are projected onto the Principal Component.
Display Kernel Signal: Whether to display the kernel estimator for the emphasized line. Like the Kernel MA, it can show underlying shifts in bias within a more significant trend by the colors reflected on the ribbon itself.
Show Oscillator Lines: Whether to show the oscillator lines.
Offset: The offset of the emphasized oscillator plots.
Fast Length: The length scale factor for the fast oscillator.
Fast Smoothing: The smoothing scale factor for the fast oscillator.
Normal Length: The length scale factor for the normal oscillator.
Normal Smoothing: The smoothing scale factor for the normal frequency.
Slow Length: The length scale factor for the slow oscillator.
Slow Smoothing: The smoothing scale factor for the slow frequency.
Divergence Threshold: The number of bars for the divergence to be considered significant.
Trigger Wave Percent Size: How big the current wave should be relative to the previous wave.
Background Area Transparency Factor: Transparency factor for the background area.
Foreground Area Transparency Factor: Transparency factor for the foreground area.
Background Line Transparency Factor: Transparency factor for the background line.
Foreground Line Transparency Factor: Transparency factor for the foreground line.
Custom Transparency: Transparency of the custom colors.
Total Gradient Steps: The maximum amount of steps supported for a gradient calculation is 256.
Fast Bullish Color: The color of the fast bullish line.
Normal Bullish Color: The color of the normal bullish line.
Slow Bullish Color: The color of the slow bullish line.
Fast Bearish Color: The color of the fast bearish line.
Normal Bearish Color: The color of the normal bearish line.
Slow Bearish Color: The color of the slow bearish line.
Bullish Divergence Signals: The color of the bullish divergence signals.
Bearish Divergence Signals: The color of the bearish divergence signals.
█ ACKNOWLEDGEMENTS
@LazyBear - For authoring the original WaveTrend port on TradingView
@PineCoders - For the beautiful color gradient framework used in this indicator
@veryfid - For the inspiration of using mirrored signals for cycle analysis and using multiple lookback windows as proxies for other timeframes

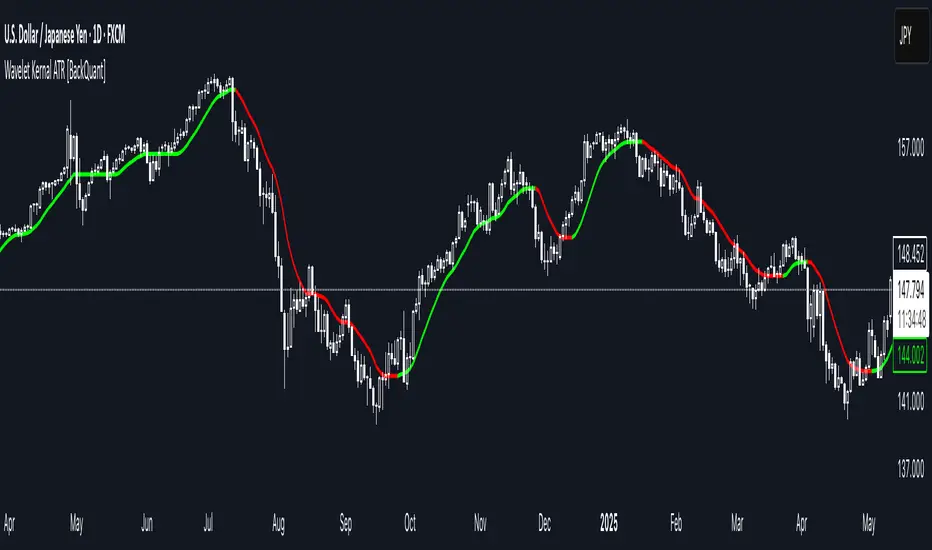
Wavelet Kernal ATR [BackQuant]Wavelet Kernal ATR
Introduction
Wavelet Kernal ATR is a closed-source, chart-side tool that fuses an edge-preserving “wavelet kernal” smoother with an ATR-aware regime line. The goal is simple: follow the real move, ignore the static, and give you clean, visual places to manage risk. It can color the trend directly on price, flip states when regime changes, and (optionally) add a secondary moving-average overlay for confirmation all while keeping the chart readable.
What it is
A single adaptive baseline designed to act like a “bias rail.” When it’s up, you favor longs; when it’s down, you favor shorts. It updates in a way that’s responsive to fresh information but resistant to insignificant wiggles. Around that baseline, an ATR-scaled envelope governs how and when the line concedes to volatility, which helps avoid flip-flopping in chop. Because this release is closed source, the following focuses on behavior and practical use rather than internal math.
What it’s used for
Bias & context: Read the backdrop with one glance; green = bullish regime, red = bearish regime.
Timing: Use slope changes and pullbacks to the line for entries aligned with the dominant push.
Risk placement: The line and its volatility envelope give intuitive zones for stops and targets.
Clarity: Paint candles by state and keep other overlays to a minimum to reduce decision noise.
Why “Wavelet Kernal” matters (plain English)
A wavelet kernal is a localized, scale-aware weighting profile. Instead of averaging every bar equally—or with a single, fixed decay—it emphasizes the most informative part of the recent window while softly down-weighting points that are either too old or too extreme. Three practical benefits result:
Edge preservation: Turning points are less “smeared” than with conventional smoothers, so the line can pivot sooner on genuine breakouts without chasing every tick.
Multi-scale sensitivity: The kernal “listens” to structure at multiple scales inside a compact window, helping it track swing-sized movement while suppressing micro-chop.
Lag vs. noise balance: Because the weighting is localized and shape-aware, you get a calmer line at similar responsiveness compared to common filters; fewer false flips, more meaningful ones.
You don’t need to know the internals to use it: think of the wavelet kernal as a smart stethoscope for price. It hears the heartbeat (trend/impulse) and ignores the coughs (random spikes).
How it behaves
Trend mode: When price expands directionally, the line “sticks” to the move and stays colored in that direction. Pullbacks that remain shallow relative to volatility usually do not flip the state.
Transition mode: After a large push, the line may flatten as volatility compresses. Flat + frequent small flips is the platform telling you: edge is low, wait for expansion.
Shock handling: On sudden spikes, the ATR envelope acts like a reality check—minor overreactions are absorbed, while statistically meaningful breaks force the baseline to concede and re-anchor.
Reading the line (quick heuristics)
Green + rising: Bias long; look for pullbacks toward the line that stall and resume.
Red + falling: Bias short; look for rallies into the line that fade.
Flat + rapid color flips: Stand down or scale down—let the next expansion choose the side.
Color flip at a prior S/R: Treat as a higher-quality signal than flips in the middle of nowhere.
Baseline + ATR corridor (concept)
The volatility envelope isn’t drawn as two fat bands here; it’s used internally to keep the baseline honest. You can think of it as a “breathing room” rule: the line is allowed to adapt with trend, but it shouldn’t jump the fence unless price movement is large enough relative to recent volatility. That’s why the tool feels calm in chop and decisive during actual breaks.
Optional MA Overlay (confluence)
You can overlay a moving average of the baseline itself for slower-regime confirmation. When both agree (baseline direction and its MA slope), you have trend alignment. When they diverge, expect digestion or a possible transition. Keep this overlay subtle; it’s a context layer, not another signal firehose.
What it plots
Wavelet ATR line — the adaptive baseline that flips color with regime.
Optional MA of the baseline — slower confirmation, on or off.
Candle painting — bars can inherit long/short state for instant read-through.
Alerts — available for state flips up/down.
Inputs explained (effect on behavior)
Wavelet ATR Calculation
Price Source — Default hlc3 ; choose your preferred composite of OHLC.
Kernal Calculation Length — The horizon the kernal “listens to.” Longer = steadier, fewer flips; shorter = snappier, more flips.
Kernal Alpha — How strongly the kernal prioritizes the freshest data inside that horizon. Higher alpha = quicker to acknowledge new pushes; lower alpha = more patience.
ATR Period — Determines the volatility memory. Shorter = envelope reacts faster; longer = envelope demands more evidence to concede.
ATR Factor — Scales how “strict” the envelope is. Larger factor = more tolerance (fewer flips); smaller = more sensitivity (earlier regime shifts).
Confluence
Show Atr Moving Average — Turns on the secondary overlay.
MA Type — Choose the flavor you read best (simple, exponential, linear regression, etc.).
Moving Average Period — The overlay’s horizon; treat it as a background current.
Volume Factor / Sigma (when applicable) — Specialized parameter used by certain MA types to shape smoothness.
Plotting & UI
Plot Wavelet ATR — Toggle the main line.
Paint Candles According to Trend — Color bars by the baseline’s state.
Long/Short Colors — Match your chart theme.
A practical playbook
Trend-pullback continuation
Setup: Baseline is green and rising. Price pulls back toward it, stalls (small bodies or wicks into the line), then resumes upward.
Idea: Enter on the resumption. Protective stop often lives just below the line or the last swing low. Scale targets through prior highs or measured projections.
Breakout + acceptance
Setup: Baseline flattens after consolidation. Price expands away; baseline turns green/red and stays that way as two or three bars “accept” the new area.
Idea: Join on the first controlled retest toward the line. If the line instantly loses color again, treat it as a fakeout.
Failed test / flip-and-go
Setup: Price challenges the line from the wrong side but cannot close through it convincingly; shortly after, the baseline flips color back in the original direction.
Idea: Use that failed test as a springboard—risk tucked beyond the failed side.
Quality checks before you click
Structure context: Is the flip happening near prior highs/lows, session opens, or well-observed levels? Flips at structure carry more information.
Volatility posture: If range is compressing, be picky. If range is expanding, respect the first pullback after the flip.
Clutter discipline: Use the fewest layers that earn their place. Trend line + candle painting is often enough.
Common questions
“Why did the line not flip on that spike?” Because the move wasn’t large or sustained enough relative to recent volatility. The envelope forces patience.
“Why did it flip and then flip back?” That’s what digestion looks like. The kernal preserves edges, but when the market truly has no edge, brief flips are information: sit tight.
“Do I need the overlay MA?” No. It’s optional context. If it helps you filter marginal trades, keep it. If it adds noise, turn it off.
Troubleshooting & fine-tuning (principles, not prescriptions)
Too many flips? Increase the Kernal Calculation Length or the ATR Factor. You’re asking for a steadier bias.
Feels late on strong trends? Nudge Kernal Alpha higher or shorten the Kernal Length. You’re asking for earlier acknowledgment.
Stops feel random? Place initial risk just beyond the baseline (or the last swing beyond it), then trail only when fresh structure appears.
Charts feel crowded? Keep the baseline + candle coloring; hide the overlay and other ornaments.
Alerts
Wavelet ATR Trend Up
Wavelet ATR Trend Down
Final notes
This tool is built to minimize analysis fatigue: one adaptive line, strong visual feedback, and enough discipline from volatility logic to avoid the “every blip is a signal” trap. The internal math, weighting shapes, and state logic are proprietary and intentionally not disclosed here; you still have full control of behavior through the inputs above. As always, align the settings with your own trade plan, keep the chart readable, and let confluence—not clutter—do the heavy lifting.
Wavetrend in Dynamic Zones with Kumo Implied VolatilityI was asked to do one of those, so here we go...
As always free and open source as it should be. Do not pay for such indicators!
A WaveTrend Indicator or also widely known as "Market Cipher" is an Indicator that is based on Moving Averages, therefore its an "lagging indicator". Lagging indicators are best used in combination with leading indicators. In this script the "leading indicator" component are Daily, Weekly or Monthly Pivots . These Pivots can be used as dynamic Support and Resistance , Stoploss, Take Profit etc.
This indicator combination is best used in larger timeframes. For lower timeframes you might need to change settings to your liking.
The general Wavetrend settings are the same that are used in Market Cipher, Market Liberator and such popular indicators.
What are these circles?
-These are the WaveTrend Divergences. Red for Regular-Bearish. Orange for Hidden-Bearish. Green for Regular-Bullish. Aqua for Hidden-Bullish.
What are these white, orange and aqua triangles?
-These are the WaveTrend Pivots. A Pivot counter was added. Every time a pivot is lower than the previous one, an orange triangle is printed, every time a pivot is higher than the previous one an aqua triangle is printed. That mimics a very common way Wavetrend is being used for trading when using those other paid Wavetrend indicators.
What are these Orange and Aqua Zones?
-These are Dynamic Zones based on the indicator itself, they offer more information than static zones. Of course static lines are also included and can be adjusted.
What are the lines between the waves?
-This is a Kumo Cloud Implied Volatility indicator. It is color coded and can be used to indicate if a major market move/bottom/top happened.
What are those numbers on the right?
-The first number is a Bollinger Band indicator that shows if said Bollinger Band is in a state of Oversold/Overbought, the second number is the actual Bollinger Band Width that indicates if the Bollinger Band squeezes, normally that happens right before the market makes an explosive move.
Please keep in mind that this indicator is a tool and not a strategy, do not blindly trade signals, do your own research first! Use this indicator in conjunction with other indicators to get multiple confirmations.

Waves + TrendsTrend visualization tool in Wave theory. This script allows to observe wave directions (trends) at 3 higher intervals.
For each candle, 3 rectangles are shown with their color, showing the current trend in a given interval/timeframe. By default, green is an uptrend and red is a downtrend.
Currently it supports 2 rulesets/wave variants:
Low - More sensitive (trend will change more ofter).
Meddium - Less sensitive ( trend will change less ofter).
Simultaneous observation of multiple timeframes reduces the time needed for analysis and facilitates making investment decisions.
Script with limited access, contact author to get authorization
Script settings:
Type – Specify which wave type should be used in trend visualization:
L(ow) – Low level waves
M(edium) – Medium level waves
Top trend timeframe – Timeframe and color mapping of the visualization top row.
Middle trend timeframe – Timeframe and color mapping of the visualization middle row.
Bottom trend timeframe – Timeframe and color mapping of the visualization bottom row.

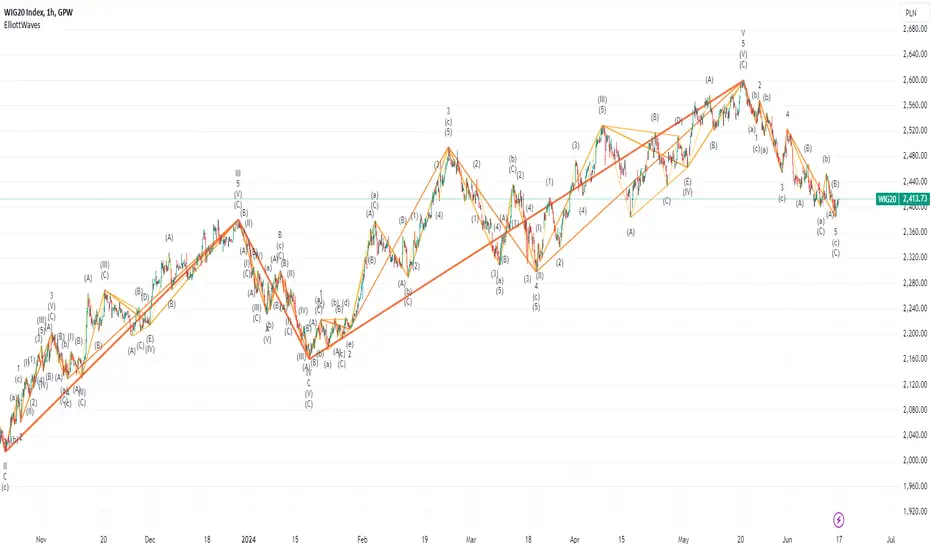
Elliot wavesA script marking Elliot waves on a chart.
This script can be used by any user. There is no need to have a PRO or PREMIUM account.
Script with limited access, contact author to get authorization
According to Elliott, a market cycle consists of eight waves. 5 upward waves and 3 downward waves following them, which are their corrections. In up and down movements, the odd waves are in the direction of the movement, and the even waves are their corrections. Analyzing in more detail, each direction movement again consists of 5 waves, and each correction consists of 3 waves.
The symbols used are non-standard (result of platform limitations):
Trend moves ⠀⠀⠀⠀⠀|⠀⠀Correction moves
𝐈 𝐈𝐈 𝐈𝐈𝐈 𝐈𝐕 𝐕 ⠀⠀⠀⠀⠀ |⠀⠀⠀ 𝐚 𝐛 𝐜
𝟏 𝟐 𝟑 𝟒 𝟓 ⠀⠀⠀⠀⠀⠀⠀|⠀⠀⠀ 𝐀 𝐁 𝐂
I II III IV V ⠀⠀⠀⠀⠀⠀⠀|⠀⠀⠀ a b c
1 2 3 4 5 ⠀⠀⠀⠀⠀⠀⠀ |⠀⠀⠀ A B C
(I) (II) (III) (IV) (V) ⠀ |⠀⠀⠀(a) (b) (c)
(1) (2) (3) (4) (5)⠀⠀ |⠀⠀⠀(A) (B) (C)
➀ ➁ ➂ ➃ ➄ ⠀⠀⠀⠀⠀ |⠀⠀⠀Ⓐ Ⓑ Ⓒ
❶ ❷ ❸ ❹ ❺ ⠀⠀⠀⠀⠀ |⠀⠀⠀🅐 🅑 🅒
This script is a part of the "Elliot waves" toolkit and require initial calibration done with separate script: "Elliot waves calibrator". Elliot waves calibrator will generate a set of numbers that you need to copy to Calibration params in script settings. Proper instruction will be shown on the screen.
Script settings:
Calibration - Fields used for script calibration.
Levels - Param deciding how many levels of waves should be shown on the chart. 0 is showing only the main waves, with +1 increase adding one more level of details.
Vertex filter - Filter eliminating highs and lows that are not an extreme over area width equal to vertex filter value.
8 sets of trend configurations, where you can specify: visiblity, line color, line width
Labels configuration where you can specify: visiblity, text size and text color.
Troubleshooting:
In case of any problems, please send error details to the author of the script.
Wavetrend DivergencesCreated for the MarketCipher Community and friends :)
This indicator is partly based on Wavetrend Oscillator by LazyBear / blue momentum waves on MarketCipher B.
The Wavetrend indicator is a combination of 2 oscillator lines that signals the short term direction of the price once the lines cross. The Wavetrend indicator is useful but only once a divergence has been identified based on the crosses and the price which is what this strategy partly uses to open trades. This indicator signals divergences in the wavetrend, both regular and hidden divergences.
This indicator utilizes support and resistances to make sure that the indicator only signals high probability winning divergences. Supports represents a low level a stock price reaches over time, while resistance represents a high level a stock price reaches over time. Support materializes when a stock price drops to a level that prompts traders to buy. This reactionary buying causes a stock price to stop dropping and start rising and this is where the indicator will be looking for a divergence at a price point of your choosing.
To make it easier i have added a support and resistance drawing indicator that will help you find price points on the chart that the price is likely to get a reaction from. There are right now only 4 support or resistances that can be drawn at one time so make sure to update the levels as the market changes.
I have helped update and modify from the original script. Here it is:
On top of these indicators i have added my own indicator that will signal a short term trend reversal that is based on pivot points and moving averages. This will usually signal reversals earlier than divergences and is very effective when following the trend and using support and resistances and can be used as an extra confirmation that there will be a reaction from the support or resistance and that the divergence will play out like you want it to. These trend reversal dots can also be used to take profit.
Trade setup example:
As seen in the picture below price comes down to a previously drawn support line, then there is a trend reversal dot that signal a potential reversal and finally a divergence is signalled once there is a clear reaction to the support. When all these signals come together there is a high probability that the trade will end up in profit. To take profit in this trade setup you can use the trend reversal dots, the drawn resistances or your own intuition and technical analysis with Marketcipher B and DBSI. A stop loss in this trade setup could be at the swing low, below the blue or teal line.
There are alerts for everything so that you wont miss a trade setup. Hope you like it :)
I have some ideas on how to improve the indicator so there will be updates in the future.

Waves Change SignalsAn extension (supporting script) for Waves series (e.g. Waves + ZOOnes). It detects candlestick patterns and:
supports merging few candles into one to get more sensitive candlestick patterns detection
supports filtering in the context of current wave (but it cannot draw the wave by itself)
It supports filtering based on 2 rulesets/wave variants:
Low - More sensitive (trend will change more ofter).
Meddium - Less sensitive ( trend will change less ofter).
Script with limited access, contact author to get authorization
Features:
- Detect candlestick formations
- Merge candles to detect hidden patterns
- Filter results with the current wave state (bullish signals for corrections, bearinsh signals for impulses) with use of Low or Medium waves.
- Limit results to last x patterns.
Script settings:
Trend type - You can switch what kind of waves should be used for filtering.
Limit - You can limit resutls to last X formations.
Include bar merges - You can pich which merge patters should be included. e.g. 3 2 2 means that 7 bars are merged into 3 with the sequence 3 bars as first, 2 bars as second, 2 bars as third.

Waves + ZOOnesTrend visualization tool in Wave theory. Unlike Elliot waves, it has a constant pattern length. The formation consists of impulse and 3 corrections.
The script analyzes candle relationships in the currect trend, trend will be continueted until candle are not breaking trend rules.
Currently it supports 2 rulesets/wave variants:
Low - More sensitive (trend will change more ofter).
Meddium - Less sensitive ( trend will change less ofter).
Simultaneous observation of both types allows to detect consolidation before the overlapping movement and increase the probability of indicating the moment of the movement occurrence.
Script with limited access, contact author to get authorization
Features:
- Show Low and Middle type/order waves
- Show support/resistance areas for the Low and Middle type/order waves.
- Types for waves and support areas are picked independently. Script can show Middle Waves with Low Waves support areas.
- Shadow mode that show second wave moved to the wave max/min bars.
- Show historical support/resistance areas that are not valid any more.
Script settings:
Trend type - You can switch what kind of waves should be drawn.
ImpulsMode - Picking graphical reprezentation of first bullish arrow.
Line width - With of drawn line. Separate setting for Low and Medium trend type.
Impuls - Color of the first bullish arrow.
Correction - Color for other arrows.
Trend shadow - Showing second reprezentation of the trend with drawing with the use of minimal and maximal values. It's usefull to determine the delay between the peak and a wave change signal.
ZOOnes type - Determines what type of trend is used to designate areas of support.
Only nearest zones - Drawing only one nearest zone above and below current price.
Only nearest potencial zones - Drawing only one nearest potencial zone above and below current price.
Show history - Showing zones in historical data
Zone precision - Determines how many bars are included in area calculation.
Alerts:
Low trend DOWN - When Low trend type is changing from UP to DOWN
Low trend UP - When Low trend type is changing from DOWN to UP
middle trend DOWN - When Middle trend type is changing from UP to DOWN
middle trend UP - When Middle trend type is changing from DOWN to UP
middle trend from ZOOnes DOWN - When Middle trend type is changing from UP to DOWN after hiting resistance area .
middle trend from ZOOnes UP = When Middle trend type is changing from DOWN to UP after hiting support area .
Troubleshooting:
In case of any problems, send error details to the author of the script.

WaveTrend Simple Chart [NinjaDawgz]This is a chart version of my WaveTrend Simple Oscillator (). Its been adapted visualize most of the basic and intermediate interpretations, patterns and signals found in the Oscillator.
Quality of life and simplicity was the goal here... no need to squint at the oscillator and lookup at the bars, now the signals are plotted on the chart for easy interpretation. Additionally, a bunch of alert conditions have been created to help you know when signal occurs as soon as it occurs. I recommend using "on bar close" for any alerts as the signal is not true until the bar closes.
Personally, I only use the "Wave Reset MFI" signals but SMA and a combination of both SMA+MFI variations are coded there as well. Hide the variations you don't use to keep the chart clean.
Use this in conjunction with nearly any other form of analysis, especially Wave Theory, to get a powerful trading strategy. This is inherently biased to trading with momentum as its an easier and safer trade. Wave Bounce signals are reversal signals and can have brilliant timing but as with any attempt at picking tops and bottoms, you do get more false positives. Good money management and trade management will be extraordinarily helpful here, with most signals averaging approximately 1:3 risk/reward.
If you like this script let me know, I'd love to know how you use it with your own strategies :)

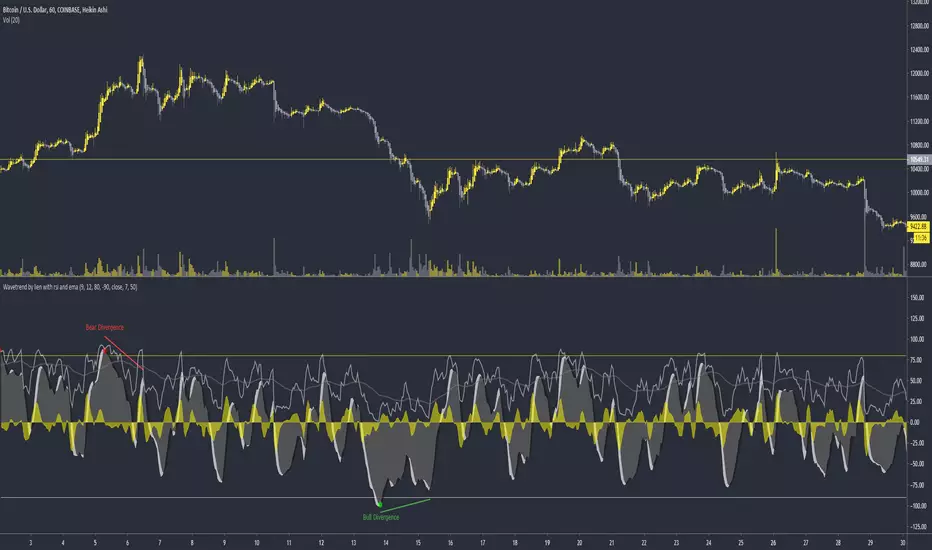
Liens wavetrend with rsi and emaWavetrend with rsi and ema. I would use the rsi and ema on high timeframes like the 4 hour to exit trades when it crosses.
Rsi and ema crosses can also be used to enter without divergence.
Test it out, try it on different TF. Enjoy :-)
WaveTrend With Divs & RSI(STOCH) Divs by WeloTradesWaveTrend with Divergences & RSI(STOCH) Divergences by WeloTrades
Overview
The "WaveTrend With Divergences & RSI(STOCH) Divergences" is an advanced Pine Script™ indicator designed for TradingView, offering a multi-dimensional analysis of market conditions. This script integrates several technical indicators—WaveTrend, Money Flow Index (MFI), RSI, and Stochastic RSI—into a cohesive tool that identifies both regular and hidden divergences across these indicators. These divergences can indicate potential market reversals and provide critical trading opportunities.
This indicator is not just a simple combination of popular tools; it offers extensive customization options, organized data presentation, and valuable trading signals that are easy to interpret. Whether you're a day trader or a long-term investor, this script enhances your ability to make informed decisions.
Originality and Usefulness
The originality of this script lies in its integration and the synergy it creates among the indicators used. Rather than merely combining multiple indicators, this script allows them to work together, enhancing each other's strengths. For example, by identifying divergences across WaveTrend, RSI, and Stochastic RSI simultaneously, the script provides multiple layers of confirmation, which reduces the likelihood of false signals and increases the reliability of trading signals.
The usefulness of this script is apparent in its ability to offer a consolidated view of market dynamics. It not only simplifies the analytical process by combining different indicators but also provides deeper insights through its divergence detection features. This comprehensive approach is designed to help traders identify potential market reversals, confirm trends, and ultimately make more informed trading decisions.
How the Components Work Together
1. Cross-Validation of Signals
WaveTrend: This indicator is primarily used to identify overbought and oversold conditions, as well as potential buy and sell signals. WaveTrend's ability to smooth price data and reduce noise makes it a reliable tool for identifying trend reversals.
RSI & Stochastic RSI: These momentum oscillators are used to measure the speed and change of price movements. While RSI identifies general overbought and oversold conditions, Stochastic RSI offers a more granular view by tracking the RSI’s level relative to its high-low range over a period of time. When these indicators align with WaveTrend signals, it adds a layer of confirmation that enhances the reliability of the signals.
Money Flow Index (MFI): This volume-weighted indicator assesses the inflow and outflow of money in an asset, giving insights into buying and selling pressure. By analyzing the MFI alongside WaveTrend and RSI indicators, the script can cross-validate signals, ensuring that buy or sell signals are supported by actual market volume.
Example Bullish scenario:
When a bullish divergence is detected on the RSI and confirmed by a corresponding bullish signal on the WaveTrend, along with an increasing Money Flow Index, the probability of a successful trade setup increases. This cross-validation minimizes the risk of acting on false signals, which might occur when relying on a single indicator.
Example Bearish scenario:
When a bearish divergence is detected on the RSI and confirmed by a corresponding bearish signal on the WaveTrend, along with an decreasing Money Flow Index, the probability of a successful trade setup increases. This cross-validation minimizes the risk of acting on false signals, which might occur when relying on a single indicator.
2. Divergence Detection and Market Reversals
Regular Divergences: Occur when the price action and an indicator (like RSI or WaveTrend) move in opposite directions. Regular bullish divergence signals a potential upward reversal when the price makes a lower low while the indicator makes a higher low. Conversely, regular bearish divergence suggests a downward reversal when the price makes a higher high, but the indicator makes a lower high.
Hidden Divergences: These occur when the price action and indicator move in the same direction, but with different momentum. Hidden bullish divergence suggests the continuation of an uptrend, while hidden bearish divergence suggests the continuation of a downtrend. By detecting these divergences across multiple indicators, the script identifies potential trend reversals or continuations with greater accuracy.
Example: The script might detect a regular bullish divergence on the WaveTrend while simultaneously identifying a hidden bullish divergence on the RSI. This combination suggests that while a trend reversal is possible, the overall market sentiment remains bullish, providing a nuanced view of the market.
A Regular Bullish Divergence Example:
A Hidden Bullish Divergence Example:
A Regular Bearish Divergence Example:
A Hidden Bearish Divergence Example:
3. Trend Strength and Sentiment Analysis
WaveTrend: Measures the strength and direction of the trend. By identifying the extremes of market sentiment (overbought and oversold levels), WaveTrend provides early signals for potential reversals.
Money Flow Index (MFI): Assesses the underlying sentiment by analyzing the flow of money. A rising MFI during an uptrend confirms strong buying pressure, while a falling MFI during a downtrend confirms selling pressure. This helps traders assess whether a trend is likely to continue or reverse.
RSI & Stochastic RSI: Offer a momentum-based perspective on the trend’s strength. High RSI or Stochastic RSI values indicate that the asset may be overbought, suggesting a potential reversal. Conversely, low values indicate oversold conditions, signaling a possible upward reversal.
Example:
During a strong uptrend, the WaveTrend & RSI's might signal overbought conditions, suggesting caution. If the MFI also shows decreasing buying pressure and the RSI reaches extreme levels, these indicators together suggest that the trend might be weakening, and a reversal could be imminent.
Example:
During a strong downtrend, the WaveTrend & RSI's might signal oversold conditions, suggesting caution. If the MFI also shows increasing buying pressure and the RSI reaches extreme levels, these indicators together suggest that the trend might be weakening, and a reversal could be imminent.
Conclusion
The "WaveTrend With Divergences & RSI(STOCH) Divergences" script offers a powerful, integrated approach to technical analysis by combining trend, momentum, and sentiment indicators into a single tool. Its unique value lies in the cross-validation of signals, the ability to detect divergences, and the comprehensive view it provides of market conditions. By offering traders multiple layers of analysis and customization options, this script is designed to enhance trading decisions, reduce false signals, and provide clearer insights into market dynamics.
WAVETREND
Display of WaveTrend:
Display of WaveTrend Setting:
WaveTrend Indicator Explanation
The WaveTrend indicator helps identify overbought and oversold conditions, as well as potential buy and sell signals. Its flexibility allows traders to adapt it to various strategies, making it a versatile tool in technical analysis.
WaveTrend Input Settings:
WT MA Source: Default: HLC3
What it is: The data source used for calculating the WaveTrend Moving Average.
What it does: Determines the input data to smooth price action and filter noise.
Example: Using HLC3 (average of High, Low, Close) provides a smoother data representation compared to using just the closing price.
Length (WT MA Length): Default: 3
What it is: The period used to calculate the Moving Average.
What it does: Adjusts the sensitivity of the WaveTrend indicator, where shorter lengths respond more quickly to price changes.
Example: A length of 3 is ideal for short-term analysis, providing quick reactions to price movements.
WT Channel Length & Average: Default: WT Channel Length = 9, Average = 12
What it is: Lengths used to calculate the WaveTrend channel and its average.
What it does: Smooths out the WaveTrend further, reducing false signals by averaging over a set period.
Example: Higher values reduce noise and help in identifying more reliable trends.
Channel: Style, Width, and Color:
What it is: Customization options for the WaveTrend channel's appearance.
What it does: Adjusts how the channel is displayed, including line style, width, and color.
Example: Choosing an area style with a distinct color can make the WaveTrend indicator clearly visible on the chart.
WT Buy & Sell Signals:
What it is: Settings to enable and customize buy and sell signals based on WaveTrend.
What it does: Allows for the display of buy/sell signals and customization of their shapes and colors.
When it gives a Buy Signal: Generated when the WaveTrend line crosses below an oversold level and then rises back, indicating a potential upward price movement.
When it gives a Sell Signal: Triggered when the WaveTrend line crosses above an overbought level and then declines, suggesting a possible downward trend.
Example: The script identifies these signals based on mean reversion principles, where prices tend to revert to the mean after reaching extremes. Traders can use these signals to time their entries and exits effectively.
WAVETREND OVERBOUGTH AND OVERSOLD LEVELS
Display of WaveTrend with Overbought & Oversold Levels:
Display of WaveTrend Overbought & Oversold Levels Settings:
WaveTrend Overbought & Oversold Levels Explanation
WT OB & OS Levels: Default: OB Level 1 = 53, OB Level 2 = 60, OS Level 1 = -53, OS Level 2 = -60
What it is: The default overbought and oversold levels used by the WaveTrend indicator to signal potential market reversals.
What it does: When the WaveTrend crosses above the OB levels, it indicates an overbought condition, potentially signaling a reversal or selling opportunity. Conversely, when it crosses below the OS levels, it indicates an oversold condition, potentially signaling a reversal or buying opportunity.
Example: A trader might use these levels to time entry or exit points, such as selling when the WaveTrend crosses into the overbought zone or buying when it crosses into the oversold zone.
Show OB/OS Levels: Default: True
What it is: Toggle options to show or hide the overbought and oversold levels on your chart.
What it does: When enabled, these levels will be visually represented on your chart, helping you to easily identify when the market reaches these critical thresholds.
Example: Displaying these levels can help you quickly see when the WaveTrend is approaching or has crossed into overbought or oversold territory, allowing for more informed trading decisions.
Line Style, Width, and Color for OB/OS Levels:
What it is: Options to customize the appearance of the OB and OS levels on your chart, including line style (solid, dotted, dashed), line width, and color.
What it does: These settings allow you to adjust how prominently these levels are displayed on your chart, which can help you better visualize and respond to overbought or oversold conditions.
Example: Setting a thicker, dashed line in a contrasting color can make these levels stand out more clearly, aiding in quick visual identification.
Example of Use:
Scenario: A trader wants to identify potential selling points when the market is overbought. They set the OB levels at 53 and 60, choosing a solid, red line style to make these levels clear on their chart. As the WaveTrend crosses above 53, they monitor for further price action, and upon crossing 60, they consider initiating a sell order.
WAVETREND DIVERGENCES
Display of WaveTrend Divergence:
Display of WaveTrend Divergence Setting:
WaveTrend Divergence Indicator Explanation
The WaveTrend Divergence feature helps identify potential reversal points in the market by highlighting divergences between the price and the WaveTrend indicator. Divergences can signal a shift in market momentum, indicating a possible trend reversal. This component allows traders to visualize and customize divergence detection on their charts.
WaveTrend Divergence Input Settings:
Potential Reversal Range: Default: 28
What it is: The number of bars to look back when detecting potential tops and bottoms.
What it does: Sets the range for identifying possible reversal points based on historical data.
Example: A setting of 28 looks back across the last 28 bars to find reversal points, offering a balance between responsiveness and reliability.
Reversal Minimum LVL OB & OS: Default: OB = 35, OS = -35
What it is: The minimum overbought and oversold levels required for detecting potential reversals.
What it does: Adjusts the thresholds that trigger a reversal signal based on the WaveTrend indicator.
Example: A higher OB level reduces the sensitivity to overbought conditions, potentially filtering out false reversal signals.
Lookback Bar Left & Right: Default: Left = 10, Right = 1
What it is: The number of bars to the left and right used to confirm a top or bottom.
What it does: Helps determine the position of peaks and troughs in the price action.
Example: A larger left lookback captures more extended price action before the peak, while a smaller right lookback focuses on the immediate past.
Lookback Range Min & Max: Default: Min = 5, Max = 60
What it is: The minimum and maximum range for the lookback period when identifying divergences.
What it does: Fine-tunes the detection of divergences by controlling the range over which the indicator looks back.
Example: A wider range increases the chances of detecting divergences across different market conditions.
R.Div Minimum LVL OB & OS: Default: OB = 53, OS = -53
What it is: The threshold levels for detecting regular divergences.
What it does: Adjusts the sensitivity of the regular divergence detection.
Example: Higher thresholds make the detection more conservative, identifying only stronger divergence signals.
H.Div Minimum LVL OB & OS: Default: OB = 20, OS = -20
What it is: The threshold levels for detecting hidden divergences.
What it does: Similar to regular divergence settings but for hidden divergences, which can indicate potential reversals that are less obvious.
Example: Lower thresholds make the hidden divergence detection more sensitive, capturing subtler market shifts.
Divergence Label Options:
What it is: Options to display and customize labels for regular and hidden divergences.
What it does: Allows users to visually differentiate between regular and hidden divergences using customizable labels and colors.
Example: Using different colors and symbols for regular (R) and hidden (H) divergences makes it easier to interpret signals on the chart.
Text Size and Color:
What it is: Customization options for the size and color of divergence labels.
What it does: Adjusts the readability and visibility of divergence labels on the chart.
Example: Larger text size may be preferred for charts with a lot of data, ensuring divergence labels stand out clearly.
FAST & SLOW MONEY FLOW INDEX
Display of Fast & Slow Money Flow:
Display of Fast & Slow Money Flow Setting:
Fast Money Flow Indicator Explanation
The Fast Money Flow indicator helps traders identify the flow of money into and out of an asset over a shorter time frame. By tracking the volume-weighted average of price movements, it provides insights into buying and selling pressure in the market, which can be crucial for making timely trading decisions.
Fast Money Flow Input Settings:
Fast Money Flow: Length: Default: 9
What it is: The period used for calculating the Fast Money Flow.
What it does: Determines the sensitivity of the Money Flow calculation. A shorter length makes the indicator more responsive to recent price changes, while a longer length provides a smoother signal.
Example: A length of 9 is suitable for traders looking to capture quick shifts in market sentiment over a short period.
Fast MFI Area Multiplier: Default: 5
What it is: A multiplier applied to the Money Flow area calculation.
What it does: Adjusts the size of the Money Flow area on the chart, effectively amplifying or reducing the visual impact of the indicator.
Example: A higher multiplier can make the Money Flow more prominent on the chart, aiding in the quick identification of significant money flow changes.
Y Position (Y Pos): Default: 0
What it is: The vertical position adjustment for the Fast Money Flow plot on the chart.
What it does: Allows you to move the Money Flow plot up or down on the chart to avoid overlap with other indicators.
Example: Adjusting the Y Position can be useful if you have multiple indicators on the chart and need to maintain clarity.
Fast MFI Style, Width, and Color:
What it is: Customization options for how the Fast Money Flow is displayed on the chart.
What it does: Enables you to choose between different plot styles (line or area), set the line width, and select colors for positive and negative money flow.
Example: Using different colors for positive (green) and negative (red) money flow helps to visually distinguish between periods of buying and selling pressure.
Slow Money Flow Indicator Explanation
The Slow Money Flow indicator tracks the flow of money into and out of an asset over a longer time frame. It provides a broader perspective on market sentiment, smoothing out short-term fluctuations and highlighting longer-term trends.
Slow Money Flow Input Settings:
Slow Money Flow: Length: Default: 12
What it is: The period used for calculating the Slow Money Flow.
What it does: A longer period smooths out short-term fluctuations, providing a clearer view of the overall money flow trend.
Example: A length of 12 is often used by traders looking to identify sustained trends rather than short-term volatility.
Slow MFI Area Multiplier: Default: 5
What it is: A multiplier applied to the Slow Money Flow area calculation.
What it does: Adjusts the size of the Money Flow area on the chart, helping to emphasize the indicator’s significance.
Example: Increasing the multiplier can help highlight the Money Flow in markets with less volatile price action.
Y Position (Y Pos): Default: 0
What it is: The vertical position adjustment for the Slow Money Flow plot on the chart.
What it does: Allows for vertical repositioning of the Money Flow plot to maintain chart clarity when used with other indicators.
Example: Adjusting the Y Position ensures that the Slow Money Flow indicator does not overlap with other key indicators on the chart.
Slow MFI Style, Width, and Color:
What it is: Customization options for the visual display of the Slow Money Flow on the chart.
What it does: Allows you to choose the plot style (line or area), set the line width, and select colors to differentiate positive and negative money flow.
Example: Customizing the colors for the Slow Money Flow allows traders to quickly distinguish between buying and selling trends in the market.
RSI
Display of RSI:
Display of RSI Setting:
RSI Indicator Explanation
The Relative Strength Index (RSI) is a momentum oscillator that measures the speed and change of price movements. It is typically used to identify overbought or oversold conditions in the market, providing traders with potential signals for buying or selling.
RSI Input Settings:
RSI Source: Default: Close
What it is: The data source used for calculating the RSI.
What it does: Determines which price data (e.g., close, open) is used in the RSI calculation, affecting how the indicator reflects market conditions.
Example: Using the closing price is standard practice, as it reflects the final agreed-upon price for a given time period.
MA Type (Moving Average Type): Default: SMA
What it is: The type of moving average applied to the RSI for smoothing purposes.
What it does: Changes the smoothing technique of the RSI, impacting how quickly the indicator responds to price movements.
Example: Using an Exponential Moving Average (EMA) will make the RSI more sensitive to recent price changes compared to a Simple Moving Average (SMA).
RSI Length: Default: 14
What it is: The period over which the RSI is calculated.
What it does: Adjusts the sensitivity of the RSI. A shorter length (e.g., 7) makes the RSI more responsive to recent price changes, while a longer length (e.g., 21) smooths out the indicator, reducing the number of signals.
Example: A 14-period RSI is commonly used for identifying overbought and oversold conditions, providing a balance between sensitivity and reliability.
RSI Plot Style, Width, and Color:
What it is: Options to customize the appearance of the RSI line on the chart.
What it does: Allows you to adjust the visual representation of the RSI, including the line width and color.
Example: Setting a thicker line width and a bright color like yellow can make the RSI more visible on the chart, aiding in quick analysis.
Display of RSI with RSI Moving Average:
RSI Moving Average Explanation
The RSI Moving Average adds a smoothing layer to the RSI, helping to filter out noise and provide clearer signals. It is particularly useful for confirming trend strength and identifying potential reversals.
RSI Moving Average Input Settings:
MA Length: Default: 14
What it is: The period over which the Moving Average is calculated on the RSI.
What it does: Adjusts the smoothing of the RSI, helping to reduce false signals and provide a clearer trend indication.
Example: A 14-period moving average on the RSI can smooth out short-term fluctuations, making it easier to spot genuine overbought or oversold conditions.
MA Plot Style, Width, and Color:
What it is: Customization options for how the RSI Moving Average is displayed on the chart.
What it does: Allows you to adjust the line width and color, helping to differentiate the Moving Average from the main RSI line.
Example: Using a contrasting color for the RSI Moving Average (e.g., magenta) can help it stand out against the main RSI line, making it easier to interpret the indicator.
STOCHASTIC RSI
Display of Stochastic RSI:
Display of Stochastic RSI Setting:
Stochastic RSI Indicator Explanation
The Stochastic RSI (Stoch RSI) is a momentum oscillator that measures the level of the RSI relative to its high-low range over a set period of time. It is used to identify overbought and oversold conditions, providing potential buy and sell signals based on momentum shifts.
Stochastic RSI Input Settings:
Stochastic RSI Length: Default: 14
What it is: The period over which the Stochastic RSI is calculated.
What it does: Adjusts the sensitivity of the Stochastic RSI. A shorter length makes the indicator more responsive to recent price changes, while a longer length smooths out the fluctuations, reducing noise.
Example: A length of 14 is commonly used to identify momentum shifts over a medium-term period, providing a balanced view of potential overbought or oversold conditions.
Display of Stochastic RSI %K Line:
Stochastic RSI %K Line Explanation
The %K line in the Stochastic RSI is the main line that tracks the momentum of the RSI over the chosen period. It is the faster-moving component of the Stochastic RSI, often used to identify entry and exit points.
Stochastic RSI %K Input Settings:
%K Length: Default: 3
What it is: The period used for smoothing the %K line of the Stochastic RSI.
What it does: Smoothing the %K line helps reduce noise and provides a clearer signal for potential market reversals.
Example: A smoothing length of 3 is common, offering a balance between responsiveness and noise reduction, making it easier to spot significant momentum shifts.
%K Plot Style, Width, and Color:
What it is: Customization options for the visual representation of the %K line.
What it does: Allows you to adjust the appearance of the %K line on the chart, including line width and color, to fit your visual preferences.
Example: Setting a blue color and a medium width for the %K line makes it stand out clearly on the chart, helping to identify key points of momentum change.
%K Fill Color (Above):
What it is: The fill color that appears above the %K line on the chart.
What it does: Adds visual clarity by shading the area above the %K line, making it easier to interpret the direction and strength of momentum.
Example: Using a light blue fill color above the %K line can help emphasize bullish momentum, making it visually prominent.
Display of Stochastic RSI %D Line:
Stochastic RSI %D Line Explanation
The %D line in the Stochastic RSI is a moving average of the %K line and acts as a signal line. It is slower-moving compared to the %K line and is often used to confirm signals or identify potential reversals when it crosses the %K line.
Stochastic RSI %D Input Settings:
%D Length: Default: 3
What it is: The period used for smoothing the %D line of the Stochastic RSI.
What it does: Smooths out the %D line, making it less sensitive to short-term fluctuations and more reliable for identifying significant market signals.
Example: A length of 3 is often used to provide a smoothed signal line that can help confirm trends or reversals indicated by the %K line.
%D Plot Style, Width, and Color:
What it is: Customization options for the visual representation of the %D line.
What it does: Allows you to adjust the appearance of the %D line on the chart, including line width and color, to match your preferences.
Example: Setting an orange color and a thicker line width for the %D line can help differentiate it from the %K line, making crossover points easier to spot.
%D Fill Color (Below):
What it is: The fill color that appears below the %D line on the chart.
What it does: Adds visual clarity by shading the area below the %D line, making it easier to interpret bearish momentum.
Example: Using a light orange fill color below the %D line can highlight bearish conditions, making it visually easier to identify.
RSI & STOCHASTIC RSI OVERBOUGHT AND OVERSOLD LEVELS
Display of RSI & Stochastic with Overbought & Oversold Levels:
Display of RSI & Stochastic Overbought & Oversold Settings:
RSI & Stochastic Overbought & Oversold Levels Explanation
The Overbought (OB) and Oversold (OS) levels for RSI and Stochastic RSI indicators are key thresholds that help traders identify potential reversal points in the market. These levels are used to determine when an asset is likely overbought or oversold, which can signal a potential trend reversal.
RSI & Stochastic Overbought & Oversold Input Settings:
RSI & Stochastic Level 1 Overbought (OB) & Oversold (OS): Default: OB Level = 170, OS Level = 130
What it is: The first set of thresholds for determining overbought and oversold conditions for both RSI and Stochastic RSI indicators.
What it does: When the RSI or Stochastic RSI crosses above the overbought level, it suggests that the asset might be overbought, potentially signaling a sell opportunity. Conversely, when these indicators drop below the oversold level, it suggests the asset might be oversold, potentially signaling a buy opportunity.
Example: If the RSI crosses above 170, traders might look for signs of a potential trend reversal to the downside, while a cross below 130 might indicate a reversal to the upside.
RSI & Stochastic Level 2 Overbought (OB) & Oversold (OS): Default: OB Level = 180, OS Level = 120
What it is: The second set of thresholds for determining overbought and oversold conditions for both RSI and Stochastic RSI indicators.
What it does: These levels provide an additional set of reference points, allowing traders to differentiate between varying degrees of overbought and oversold conditions, potentially leading to more refined trading decisions.
Example: When the RSI crosses above 180, it might indicate an extreme overbought condition, which could be a stronger signal for a sell, while a cross below 120 might indicate an extreme oversold condition, which could be a stronger signal for a buy.
RSI & Stochastic Overbought (OB) Band Customization:
OB Level 1: Width, Style, and Color:
What it is: Customization options for the visual appearance of the first overbought band on the chart.
What it does: Allows you to set the line width, style (solid, dotted, dashed), and color for the first overbought band, enhancing its visibility on the chart.
Example: A dashed red line with medium width can clearly indicate the first overbought level, helping traders quickly identify when this threshold is crossed.
OB Level 2: Width, Style, and Color:
What it is: Customization options for the visual appearance of the second overbought band on the chart.
What it does: Allows you to set the line width, style, and color for the second overbought band, providing a clear distinction from the first band.
Example: A dashed red line with a slightly thicker width can represent a more significant overbought level, making it easier to differentiate from the first level.
RSI & Stochastic Oversold (OS) Band Customization:
OS Level 1: Width, Style, and Color:
What it is: Customization options for the visual appearance of the first oversold band on the chart.
What it does: Allows you to set the line width, style (solid, dotted, dashed), and color for the first oversold band, making it visually prominent.
Example: A dashed green line with medium width can highlight the first oversold level, helping traders identify potential buying opportunities.
OS Level 2: Width, Style, and Color:
What it is: Customization options for the visual appearance of the second oversold band on the chart.
What it does: Allows you to set the line width, style, and color for the second oversold band, providing an additional visual cue for extreme oversold conditions.
Example: A dashed green line with a thicker width can represent a more significant oversold level, offering a stronger visual cue for potential buying opportunities.
RSI DIVERGENCES
Display of RSI Divergence Labels:
Display of RSI Divergence Settings:
RSI Divergence Lookback Explanation
The RSI Divergence settings allow traders to customize the parameters for detecting divergences between the RSI (Relative Strength Index) and price action. Divergences occur when the price moves in the opposite direction to the RSI, potentially signaling a trend reversal. These settings help refine the accuracy of divergence detection by adjusting the lookback period and range. ( NOTE: This setting only imply to the RSI. This doesn't effect the STOCHASTIC RSI. )
RSI Divergence Lookback Input Settings:
Lookback Left: Default: 10
What it is: The number of bars to look back from the current bar to detect a potential divergence.
What it does: Defines the left-side lookback period for identifying pivot points in the RSI, which are used to spot divergences. A longer lookback period may capture more significant trends but could also miss shorter-term divergences.
Example: A setting of 10 bars means the script will consider pivot points up to 10 bars before the current bar to check for divergence patterns.
Lookback Right: Default: 1
What it is: The number of bars to look forward from the current bar to complete the divergence pattern.
What it does: Defines the right-side lookback period for confirming a potential divergence. This setting helps ensure that the identified divergence is valid by allowing the script to check subsequent bars for confirmation.
Example: A setting of 1 bar means the script will look at the next bar to confirm the divergence pattern, ensuring that the signal is reliable.
Lookback Range Min: Default: 5
What it is: The minimum range of bars required to detect a valid divergence.
What it does: Sets a lower bound on the range of bars considered for divergence detection. A lower minimum range might capture more frequent but possibly less significant divergences.
Example: Setting the minimum range to 5 ensures that only divergences spanning at least 5 bars are considered, filtering out very short-term patterns.
Lookback Range Max: Default: 60
What it is: The maximum range of bars within which a divergence can be detected.
What it does: Sets an upper bound on the range of bars considered for divergence detection. A larger maximum range might capture more significant divergences but could also include less relevant long-term patterns.
Example: Setting the maximum range to 60 bars allows the script to detect divergences over a longer timeframe, capturing more extended divergence patterns that could indicate major trend reversals.
RSI Divergence Explanation
RSI divergences occur when the RSI indicator and price action move in opposite directions, signaling potential trend reversals. This section of the settings allows traders to customize the appearance and detection of both regular and hidden bullish and bearish divergences.
RSI Divergence Input Settings:
R. Bullish Div Label: Default: True
What it is: An option to display labels for regular bullish divergences.
What it does: Enables or disables the visibility of labels that mark regular bullish divergences, where the price makes a lower low while the RSI makes a higher low, indicating a potential upward reversal.
Example: A trader might use this to spot buying opportunities in a downtrend when a bullish divergence suggests the trend may be reversing.
Bullish Label Color, Line Width, and Line Color:
What it is: Settings to customize the appearance of regular bullish divergence labels.
What it does: Allows you to choose the color of the labels, adjust the width of the divergence lines, and select the color for these lines.
Example: Selecting a green label color and a distinct line width makes bullish divergences easily recognizable on your chart.
R. Bearish Div Label: Default: True
What it is: An option to display labels for regular bearish divergences.
What it does: Enables or disables the visibility of labels that mark regular bearish divergences, where the price makes a higher high while the RSI makes a lower high, indicating a potential downward reversal.
Example: A trader might use this to spot selling opportunities in an uptrend when a bearish divergence suggests the trend may be reversing.
Bearish Label Color, Line Width, and Line Color:
What it is: Settings to customize the appearance of regular bearish divergence labels.
What it does: Allows you to choose the color of the labels, adjust the width of the divergence lines, and select the color for these lines.
Example: Choosing a red label color and a specific line width makes bearish divergences clearly stand out on your chart.
H. Bullish Div Label: Default: False
What it is: An option to display labels for hidden bullish divergences.
What it does: Enables or disables the visibility of labels that mark hidden bullish divergences, where the price makes a higher low while the RSI makes a lower low, indicating potential continuation of an uptrend.
Example: A trader might use this to confirm an existing uptrend when a hidden bullish divergence signals continued buying strength.
Hidden Bullish Label Color, Line Width, and Line Color:
What it is: Settings to customize the appearance of hidden bullish divergence labels.
What it does: Allows you to choose the color of the labels, adjust the width of the divergence lines, and select the color for these lines.
Example: A softer green color with a thinner line width might be chosen to subtly indicate hidden bullish divergences, keeping the chart clean while providing useful information.
H. Bearish Div Label: Default: False
What it is: An option to display labels for hidden bearish divergences.
What it does: Enables or disables the visibility of labels that mark hidden bearish divergences, where the price makes a lower high while the RSI makes a higher high, indicating potential continuation of a downtrend.
Example: A trader might use this to confirm an existing downtrend when a hidden bearish divergence signals continued selling pressure.
Hidden Bearish Label Color, Line Width, and Line Color:
What it is: Settings to customize the appearance of hidden bearish divergence labels.
What it does: Allows you to choose the color of the labels, adjust the width of the divergence lines, and select the color for these lines.
Example: A muted red color with a thinner line width might be selected to indicate hidden bearish divergences without overwhelming the chart.
Divergence Text Size and Color: Default: S (Small)
What it is: Settings to adjust the size and color of text labels for RSI divergences.
What it does: Allows you to customize the size and color of text labels that display the divergence information on the chart.
Example: Choosing a small text size with a bright white color can make divergence labels easily readable without taking up too much space on the chart.
STOCHASTIC DIVERGENCES
Display of Stochastic RSI Divergence Labels:
Display of Stochastic RSI Divergence Settings:
Stochastic RSI Divergence Explanation
Stochastic RSI divergences occur when the Stochastic RSI indicator and price action move in opposite directions, signaling potential trend reversals. These settings allow traders to customize the detection and visual representation of both regular and hidden bullish and bearish divergences in the Stochastic RSI.
Stochastic RSI Divergence Input Settings:
R. Bullish Div Label: Default: True
What it is: An option to display labels for regular bullish divergences in the Stochastic RSI.
What it does: Enables or disables the visibility of labels that mark regular bullish divergences, where the price makes a lower low while the Stochastic RSI makes a higher low, indicating a potential upward reversal.
Example: A trader might use this to spot buying opportunities in a downtrend when a bullish divergence in the Stochastic RSI suggests the trend may be reversing.
Bullish Label Color, Line Width, and Line Color:
What it is: Settings to customize the appearance of regular bullish divergence labels in the Stochastic RSI.
What it does: Allows you to choose the color of the labels, adjust the width of the divergence lines, and select the color for these lines.
Example: Selecting a blue label color and a distinct line width makes bullish divergences in the Stochastic RSI easily recognizable on your chart.
R. Bearish Div Label: Default: True
What it is: An option to display labels for regular bearish divergences in the Stochastic RSI.
What it does: Enables or disables the visibility of labels that mark regular bearish divergences, where the price makes a higher high while the Stochastic RSI makes a lower high, indicating a potential downward reversal.
Example: A trader might use this to spot selling opportunities in an uptrend when a bearish divergence in the Stochastic RSI suggests the trend may be reversing.
Bearish Label Color, Line Width, and Line Color:
What it is: Settings to customize the appearance of regular bearish divergence labels in the Stochastic RSI.
What it does: Allows you to choose the color of the labels, adjust the width of the divergence lines, and select the color for these lines.
Example: Choosing an orange label color and a specific line width makes bearish divergences in the Stochastic RSI clearly stand out on your chart.
H. Bullish Div Label: Default: False
What it is: An option to display labels for hidden bullish divergences in the Stochastic RSI.
What it does: Enables or disables the visibility of labels that mark hidden bullish divergences, where the price makes a higher low while the Stochastic RSI makes a lower low, indicating potential continuation of an uptrend.
Example: A trader might use this to confirm an existing uptrend when a hidden bullish divergence in the Stochastic RSI signals continued buying strength.
Hidden Bullish Label Color, Line Width, and Line Color:
What it is: Settings to customize the appearance of hidden bullish divergence labels in the Stochastic RSI.
What it does: Allows you to choose the color of the labels, adjust the width of the divergence lines, and select the color for these lines.
Example: A softer blue color with a thinner line width might be chosen to subtly indicate hidden bullish divergences, keeping the chart clean while providing useful information.
H. Bearish Div Label: Default: False
What it is: An option to display labels for hidden bearish divergences in the Stochastic RSI.
What it does: Enables or disables the visibility of labels that mark hidden bearish divergences, where the price makes a lower high while the Stochastic RSI makes a higher high, indicating potential continuation of a downtrend.
Example: A trader might use this to confirm an existing downtrend when a hidden bearish divergence in the Stochastic RSI signals continued selling pressure.
Hidden Bearish Label Color, Line Width, and Line Color:
What it is: Settings to customize the appearance of hidden bearish divergence labels in the Stochastic RSI.
What it does: Allows you to choose the color of the labels, adjust the width of the divergence lines, and select the color for these lines.
Example: A muted orange color with a thinner line width might be selected to indicate hidden bearish divergences without overwhelming the chart.
Divergence Text Size and Color: Default: S (Small)
What it is: Settings to adjust the size and color of text labels for Stochastic RSI divergences.
What it does: Allows you to customize the size and color of text labels that display the divergence information on the chart.
Example: Choosing a small text size with a bright white color can make divergence labels easily readable without taking up too much space on the chart.
Alert System:
Custom Alerts for Divergences and Reversals:
What it is: The script includes customizable alert conditions to notify you of detected divergences or potential reversals based on WaveTrend, RSI, and Stochastic RSI.
What it does: Helps you stay informed of key market movements without constantly monitoring the charts, enabling timely decisions.
Example: Setting an alert for regular bearish divergence on the WaveTrend could notify you of a potential sell opportunity as soon as it is detected.
How to Use Alerts:
Set up custom alerts in TradingView based on these conditions to be notified of potential trading opportunities. Alerts are triggered when the indicator detects conditions that match the selected criteria, such as divergences or potential reversals.
By following the detailed guidelines and examples above, you can effectively use and customize this powerful indicator to suit your trading strategy.
For further understanding and customization, refer to the input settings within the script and adjust them to match your trading style and preferences.
How Components Work Together
Synergy and Cross-Validation: The indicator combines multiple layers of analysis to validate trading signals. For example, a WaveTrend buy signal that coincides with a bullish divergence in RSI and positive fast money flow is likely to be more reliable than any single indicator’s signal. This cross-validation reduces the likelihood of false signals and enhances decision-making.
Comprehensive Market Analysis: Each component plays a role in analyzing different aspects of the market. WaveTrend focuses on trend strength, Money Flow indicators assess market sentiment, while RSI and Stochastic RSI offer detailed views of price momentum and potential reversals.
Ideal For
Traders who require a reliable, multifaceted tool for detecting market trends and reversals.
Investors seeking a deeper understanding of market dynamics across different timeframes and conditions, whether in forex, equities, or cryptocurrency markets.
This script is designed to provide a comprehensive tool for technical analysis, combining multiple indicators and divergence detection into one versatile and customizable script. It is especially useful for traders who want to monitor various indicators simultaneously and look for convergence or divergence signals across different technical tools.
Acknowledgements
Special thanks to these amazing creators for inspiration and their creations:
I want to thank these amazing creators for creating there amazing indicators , that inspired me and also gave me a head start by making this indicator! Without their amazing indicators it wouldn't be possible!
vumanchu: VuManChu Cipher B Divergences.
MisterMoTa: RSI + Divergences + Alerts .
DevLucem: Plain Stochastic Divergence.
Note
This indicator is designed to be a powerful tool in your trading arsenal. However , it is essential to backtest and adjust the settings according to your trading strategy before applying it to live trading . If you have any questions or need further assistance, feel free to reach out.

WaveTrend Ribbon [AlgoAlpha]🌟🚀 Introducing the WaveTrend Ribbon by AlgoAlpha - Your Next-Level Trading Companion! 🚀🌟
Dive into the world of advanced trading with the WaveTrend Ribbon by AlgoAlpha, a cutting-edge indicator designed to elevate your trading strategy on TradingView. 📈💡 This powerful tool combines the efficiency of the WaveTrend oscillator with innovative Z-score analysis to offer clear, actionable trading signals. 🌊🎯
Key Features:
🔧 Customizable Parameters: Tailor the indicator to your trading needs with adjustable settings including Channel Length, Average Length, Overbought/Oversold Levels, and more.
📊 WaveTrend Oscillator: Utilizes a smoothed version of the average price to identify potential market reversals.
📉 Z-Score Analysis: Enhances signal reliability by measuring the standard deviation of the current price from the mean.
🎨 Dynamic Color Coding: Visual cues shift between up and down colors to indicate market trends, making it easy to read at a glance.
⚠️ Divergence Detection: Automatic identification of bullish and bearish divergences for early signal warnings.
🔔 Custom Alerts: Stay ahead with real-time alerts for key trading events like bullish/bearish divergences and trend reversals.
How to Use WaveTrend Ribbon :
Maximize your trading potential with the WaveTrend Ribbon by following these simple steps:
🔍 Add to Chart: Locate "WaveTrend Ribbon " in TradingView's Indicators & Strategies and apply it to your chart. Dive into the settings to customize the parameters like Channel Length, Average Length, and the Overbought/Oversold levels to match your trading strategy.
- Channel Length affects the sensitivity of the WaveTrend oscillator to price movements. A shorter Channel Length increases responsiveness, useful in volatile markets but may lead to false signals. It's ideal for traders looking for quick reactions to price changes.
- Average Length is used to smooth the oscillator further, influencing how quickly the indicator responds to trend changes. A shorter Average Length allows for a quicker response to the oscillator's movements, suitable for short-term trading strategies.
📊 Analyze the Market: Pay close attention to the color transitions and position of the Z-score in relation to its moving average for insights into market direction. Look out for the overbought and oversold conditions for potential reversal points.
🔔 Set Up Alerts: Utilize the built-in alert system to get notified of key events like trend reversals, bullish and bearish divergences, and more, so you can make timely decisions without having to constantly monitor the charts.
Basic Logic Explained:
The WaveTrend Ribbon is an advanced trading indicator that leverages the WaveTrend oscillator, enhanced by Z-score normalization and moving averages for precise market trend analysis. It calculates the average price deviation over a set period (Channel Length), smoothing it with an Average Length to identify trends. Z-score analysis further refines signals by comparing oscillator deviations against its historical performance, highlighting overbought or oversold conditions. The indicator generates signals for potential reversals and market entries/exits, visualized through dynamic color coding and customizable alerts for traders to act upon efficiently. This multi-layered approach provides a deeper insight into market dynamics, offering a blend of trend following and momentum strategies.
By highlighting overbought and oversold conditions with dynamic color changes and providing reversal signals, this indicator is a must-have tool for traders aiming to capitalize on market trends. 📈🚀
Elevate your trading experience with the WaveTrend Ribbon, your go-to indicator for navigating the markets with confidence and precision. Happy trading! 🌟🚀

Waves MultiTimeframe AlfredThe price on the charts moves quite chaotically, but when we look at a given interval (and eliminate the noise created on the lower interval), we can distinguish trend price movements up and down. They are almost never a straight line, but the price reaches higher and higher lows - we have up trend or lower and lower highs when we have a down trend.
There are many theories trying to describe trend movements, and many trend change detectors have been created on their basis.
In last centry we we had few famous researchers of investment theories, one of them was the Japanese journalist and investor Goichi Hosoda, creator of Ichimoku trading theory.
Goichi Hosoda proposed a trend change detector called Kyushu Legs. This detector compares the values of the current price with the price from 9 weeks ago and illustrates them using a candlestick chart. Than on the chart we can distinguishes B, P, Y formations that allow us to determine the trend and notify about trend change moment. This idea was developed further. The set of Kyushu Legs formations (B, P, Y) has been transferred to raw price chart and transformed into a set of rules detecting trend changes on the current price chart. A unique feature this method is the comparison of the parameters of neighboring candles in order to dynamically determine the values beyond which the trend changes. This eliminate the need of predefined threshold values and adjusting it to different price ranges.
Described trend detector is available on TradingView under the name "Waves" and was a starting point of a whole package of "Waves" scripts built around this detector.
"Waves MultiTimeframe Alfred" is part of the "Waves" package. It is an extension of trend detector with the ability to analyze in parallel candle data taken from higher intervals. Thanks to that this detector detects moments of trend changes on many intervals at once.
In top-right corner it displays a window with basic informations about trend (and potencial trend change moment) at higher intervals, such as:
- Trend direction confirmed on last closed candle
- In real time trend direction with the assumption that candle will be closes at current price level.
- Time to current candle close
- Price change done by the current candle
- Price's distance to the trend change threshold
Trend direction and potencial trend change are shown with a symbols:
↗ - Continuation of up trend
↘ - Continuation of down trend
↺ - Trend change to up trend
↷ - Trend change to down trend
This script supports 2 trend detection rulesets:
- Low - More sensitive trend detection ruleset, detects changes faster and more often than Medium, announcing potential changes in the Medium trend
- Medium - Less sensitive trend detection ruleset detecting trends on the chart.
Remember, until candle is not close price can move and trend indication can change. All trend indicators have a delay and are describing past till now. Future prediction cannot be done by software.
This script can be used alone, but the creator's intention was to use it together with other scripts from the "Waves" package. e.g. It can be used with the "Waves" script which draw trend lines and trend change moments on the current interval and we can use "Waves MultiTimeframe Alfred" as an assistant showing basic trends situation on up to 3 higher intervals.
Script settings:
Timeframe 1,2,3 - Option to pick 3 higher timeframes with text and background color settings.
Timer - Showing count down timer to the end of current bar on that interval
Candles - Showing candle symbol with current price change done on that interval. A separate candle color can be picked for price up and down candles.
Low wave row - Row with low trend symbol and price distance to the current low trend threshold (trend change price).
↗ - Continuation of up trend
↘ - Continuation of down trend
↺ - Trend change to up trend
↷ - Trend change to down trend
Low wave last bar symbol - Symbol of trend confirmed by previous bar. Drawn in the first line before interval symbol:
↗ - up trend
↘ - down trend
Mid wave row - Row with mid trend symbol and price distance to the current mid trend threshold (trend change price).
↗ - Continuation of up trend
↘ - Continuation of down trend
↺ - Trend change to up trend
↷ - Trend change to down trend
Mid wave last bar symbol - Symbol of trend confirmed by previous bar. Drawn in the first line after interval symbol:
↗ - up trend
↘ - down trend
Warnings - Showing explanation messages when interval data are not available.
Signal change - Experimental option to signal trend change with a different color.
Troubleshooting:
In case of any problems, please send error details to the author of the script.

DB KCBB%D Wave SignalsDB KCBB%D Wave Signals
What does the indicator do?
This indicator is a version of my DB KCBB%D indicator updated with signal detection. It results from weeks of analysis of the KCBB%D waves for patterns. I'm releasing it publicly to help those who like the KCBB%D indicator but desire a version with signals built into it.
The indicator plots the percent difference between the low and high prices against a combined Kelpler Channel Bollinger Bands for the current timeframe. The low percent difference and the high percent difference each have their own waves plotted. A mirror mode default allows both waves to be visualized in a mirrored plot that clearly shows when outer bands are present and when they swap. Each percent difference band is displayed with a 1 bar lookback to visualize local tops/bottoms.
The overall trend is displayed using two sets of green/red colors on the percent difference waves so that each wave is recognizable, but the overall price trend is visible. A fast 3 SMA is taken of each percent difference wave to obtain the overall trend and then averaged together. The trend is then calculated based on direction from the previous bar period.
How should this indicator be used?
By default, the indicator will display in a mirror mode which will display both the low and high percent change waves mirrored to allow for the most pattern recognition possible. You will notice the percent difference waves swap from inner to outer, showing the overall market direction for that timeframe. When each percent difference wave interacts with the zero line, it indicates either buys or sells opportunities depending on which band is on the inside. When the inner wave crosses zero, special attention should be paid to the outer wave to know if it's a significant move. Likewise, when the outer wave peaks, it can indicate buy or sell opportunities depending on which wave is on the outside.
A zero line and other lines are displayed from the highest of the high percent difference wave over a long period of time. The lines can measure movement and possible oversold/overbought locations or large volatility . You can also use the lines for crossing points for either wave as alerts to know when to buy or sell zones are happening.
When individual percent difference waves are designed to be reviewed without mirroring, the mirror checkbox can be unchecked in the settings. Doing so will display both the high and low percent difference waves separately. Using this display, you can more cleanly review how each wave interacts with various line levels.
For those who desire to only have half of the mirror or one set of waves inverted against each other, check the "mirrored" and the "mirrored flipped" checkboxes in the settings. Doing so will display the top half of the mirror indicator, which is the low percent difference wave with the high percent difference wave inverted.
The indicator will also change the background color of its own pane to indicate possible buy/sell periods (work in progress).
Does the indicator include any alerts?
Yes, they are a work in progress but starting out with this release, we have:
NOTE: This is an initial release version of this indicator. Please do not use these alerts with bots yet, as they will repaint in real-time.
NOTE: A later release may happen that will delay firing the events until 1/2 of the current bar time has passed.
NOTE: As with any indicator, watch your upper timeframe waves first before zooming into lower.
DB KCBB%D Buy Signal
DB KCBB%D Buy Warning Signal
DB KCBB%D Sell Signal
DB KCBB%D Sell Warning Signal
DB KCBB%D Death Cross Sell Signal
DB KCBB%D Trend Up Alert
DB KCBB%D Trend Down Alert
Use at your own risk and do your own diligence.
Enjoy!

Waves + XABCD v.1.0Advanced harmonic patterns scanner optimazed for Wave theory for Low or Medium wave rules.
It finds on the candle chart:
- Existing pattern with realized target in historic data.
- Potencial patterns with realized and potencial targets.
- Estimated patterns that may become potencial with their potencial targets (it updates instantly with the price change (before closing the bar). Such estimation can be confirmed or invalidated in minutes, but can give an advantage and be usefull on higher intervals.
Supports modified traiding patterns:
B.38
B.50
B.618
B.786
B.886
Shark
Cypher
Formation 5-0
Script with limited access, contact author to get authorization
Existing patterns visualization:
Potencial pattern visualization:
On the chart we can see few potencial patterns ( Sharks & Cyphers ). First target of first formation was realized and trend was changed. Chances of reaching targets in each pattern kind we can check by moving mouse over the label. tooltip will show:
- how many patterns are in historical data on this chart
- targets with % of cases in historical data on this chart when target was reached.
WARNING !!!
For each scanner configration and "D point limit" we can get different values. Also numbers of bars (traidingView account type) will change results. You can contact us for details how to optimaze settings for better performance.
Estimated patterns visualization:
On the chart we can see 2 estimated patterns based on current up trend. We can see that trend was already confirmed and will not change in this bar, but "if he had changed" the patterns will be accepted as potencial giving more arguments for move down.
Patterns performance data:
Below we can see chart with stats params set to "%". In the table on right we can see how many patterns were detected on the chart for the current configuration and how many of them reached particular level within the current D limit.
For each scanner configration and "D point limit" we can get different values. Also numbers of bars (traidingView account type) will change results. You can contact us for details how to optimaze settings for better performance.
Script settings:
| XABCD Scanner |
XABC dist limit - Specifies the maximum distance between successive pattern vertex .
Trend type - Specify which wave type should be used.
precision ‰ - It determines the maximum deviations from the conditions that must be met by the patterns. It also causes enlarge / blur of targets.
B.38, B.50, B.618, B.786, B.886, Shark, Cypher, Formation 5-0 - Filter specifying which patterns should be detected and allowing to set pattern color.
| XABCD Scanner Visualization |
You can configure visualziation for each pattern type separatelu:
Existing - Patterns in the historic data
Potencial - Patterns with known XABC vertrex, but without confirmed D.
Estimated - Dynamic patterns with not confirmed C vertex . After extreme formed they can be confirmed or invalidated.
Shape - Check if you want to see pattern shape.
Target - Check if you want to see posibble targets (In case of high precision value, lines become diagonal).
Label - Decide what format should have label. You can pick from: Fullname, shortname, vertical, hidden.
Targets: Filled/Not filled - Allow to change colors used for targets visualization.
Fill: targets/shape - Transparency param of the drawings.
| XABCD Scanner Statistics |
D point limit - A treshold for filter that counts statistics. If D will be reach after passing treshold it will not count as success in the statistics.
over limit color - Color used for patterns line visualization if D is over limit set in previous point.
pattern filter checkbox - Showing dialog with list of potencial patterns.
pattern filter - Field allowing to pick potencial pattern to show.
stats - Shows/hides stats table.
| Trend visualization |
Type - Specify switch what kind of wave should be drawn.
Confirmation - Draw "C" label if wave was confirmed and will not change in this bar. If wave is changing on this bar shows distance from the treshold.
Shadow - Draws second trendline based on the wave extremes.
Low/Mid line width and color - Wave drawing configuration.
| Impuls visualization |
Impuls - Picking graphical reprezentation of first bullish arrow.
Impuls color - Color of the first bullish arrow.
Draw arrow - Drawing arrow on the end of impuls wave.
Troubleshooting:
In case of any problems, please contact the author of the script. To improve speed of solving problem first check if script is drawn, and if there is a "!" character after script params. If you can see "!" character, move cursor over it for detail. Send message with error details, ticker and interval to us. The more precise will be your description the faster we will be able to help you.
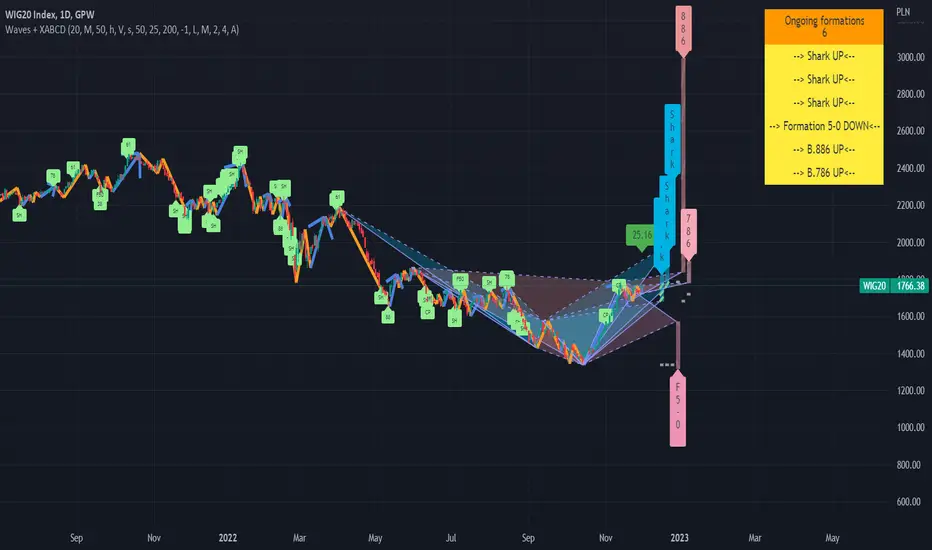
WaveTrend [LazyBear] vX by DGTDGT interpreted version of LazyBear's WaveTrend, visualizing on Price Chart
Original Author : LazyBear
Crosses above or below threshold are emphasized with bigger labels
- crosses above threshold : probable short indications with a bigger label and relativly small label for probable long indications
- crosses below threshold : probable long indications with a bigger label and relativly small label for probable short indications
All rest crosses within threshold boundaries with relatively small labels for both long and short probable indications

Wave Trend With Signals [ChuckBanger]A wave trend script based on LazyBears script but with added signals and a histogram...
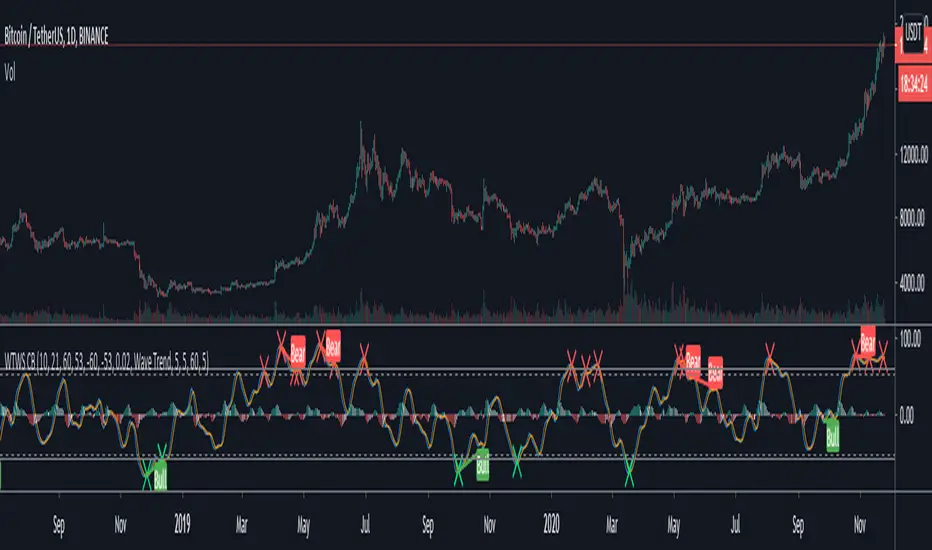
WaveTrend - Market Cipher BHey guys,
Just releasing a quick copy of LazyBear's wavetrend indicator slightly modified to be more reactive and contains a few other extras for people who don't have pro like a stochastic and RSI indicator above the wave to find more confluence.
The indicator will show crosses but shows them below the indicator as well if they are stronger removing some noise.

WaveTrend OscillatorSimilar to other Wave Trend Oscillators out there but I added "Buy" & "Sell" signals and alerts can set as well.
Entry and Exits:
Entry when Wave cross occurs below or within the bottom band
Exit when Wave cross occurs above or within the top band
Alert Settings:
"Buy" is less than "Over Sold Top"
"Sell" is greater than "Over Bought Bottom"
