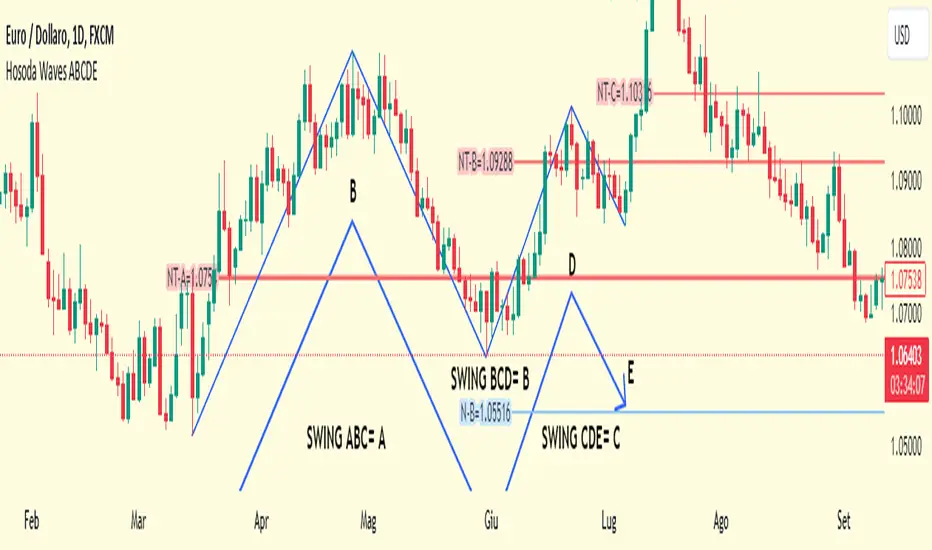
Hosoda Waves ABCDEThe Hosoda Waves indicator was devised by Goichi Hosoda, who is also the creator of the Ichimoku system, with the idea that previous highs and lows could determine future price ranges that the market would react to.
Hosoda's projections are the NT, N, V, and E waves, which are derived from calculations based on both upward and downward ABC swings.
Hosoda's waves are derived from the following calculations:
NT Wave = C + (C - A)
N Wave = B + (B - A)
V Wave = B + (B - C)
E Wave = C + (B - A)
There are already scripts for the Hosoda waves, and my idea is to project an ABCDE swing simultaneously, meaning projecting three swings:
ABC, indicated with an A, resulting in NT-A, N-A, V-A, E-A.
BCD, indicated with a B, resulting in NT-B, N-B, V-B, E-B.
CDE, indicated with a C, resulting in NT-C, N-C, V-C, E-C.
Once the indicator is applied to the chart, the interactive Pine Script tool version 5 will prompt you to identify 5 points of "low-high-low-high-low" or "high-low-high-low-high," both for upward and downward movements and mixed.
Once clicked, these price points can be moved. If you change the time frame or market instrument, the indicator must be removed because it remains tied to the prices where it was initially drawn.
Cari dalam skrip untuk "wave"
SSL + Wave Trend StrategyStrategy incorporates the following features:
Risk management:
Configurable X% loss per stop loss
Configurable R:R ratio
Trade entry:
Based on strategy conditions below
Trade exit:
Based on strategy conditions below
Backtesting:
Configurable backtesting range by date
Trade drawings:
Each entry condition indicator can be turned on and off
TP/SL boxes drawn for all trades. Can be turned on and off
Trade exit information labels. Can be turned on and off
NOTE: Trade drawings will only be applicable when using overlay strategies
Alerting:
Alerts on LONG and SHORT trade entries
Debugging:
Includes section with useful debugging techniques
Strategy conditions
Trade entry:
LONG
C1: SSL Hybrid baseline is BLUE
C2: SSL Channel crosses up (green above red)
C3: Wave Trend crosses up (represented by pink candle body)
C4: Entry candle height is not greater than configured threshold
C5: Entry candle is inside Keltner Channel (wicks or body depending on configuration)
C6: Take Profit target does not touch EMA (represents resistance)
SHORT
C1: SSL Hybrid baseline is RED
C2: SSL Channel crosses down (red above green)
C3: Wave Trend crosses down (represented by orange candle body)
C4: Entry candle height is not greater than configured threshold
C5: Entry candle is inside Keltner Channel (wicks or body depending on configuration)
C6: Take Profit target does not touch EMA (represents support)
Trade exit:
Stop Loss: Size configurable with NNFX ATR multiplier
Take Profit: Calculated from Stop Loss using R:R ratio
Credits
Strategy is based on the YouTube video "This Unique Strategy Made 47% Profit in 2.5 Months " by TradeSmart.
It combines the following indicators to determine trade entry/exit conditions:
Wave Trend: Indicator: WaveTrend Oscillator by @LazyBear
SSL Channel: SSL channel by @ErwinBeckers
SSL Hybrid: SSL Hybrid by @Mihkel00
Keltner Channels: Keltner Channels Bands by @ceyhun
Candle Height: Candle Height in Percentage - Columns by @FreeReveller
NNFX ATR: NNFX ATR by @sueun123

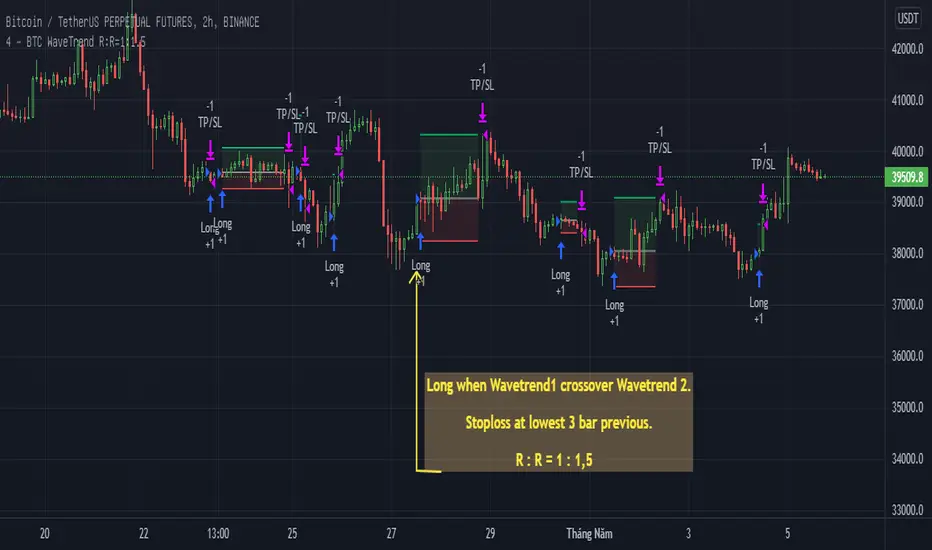
BTC WaveTrend R:R=1:1.5In this strategy, I used Wavetrend indicator (Lazy Bear).
It is very simple and easy to understanding: Long when Wavetrend1 crossover Wavetrend2 and they are less than a limit value (not buy when price overbought). Stoploss at lowest 3 bar previous. R:R = 1:1,5.
About other shortterm strategies for crypto market, you can view my published strategies.
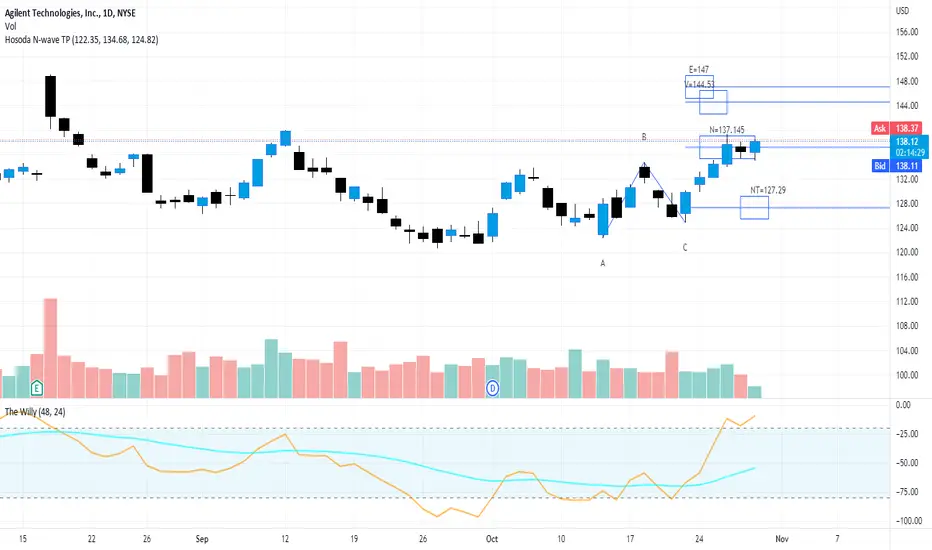
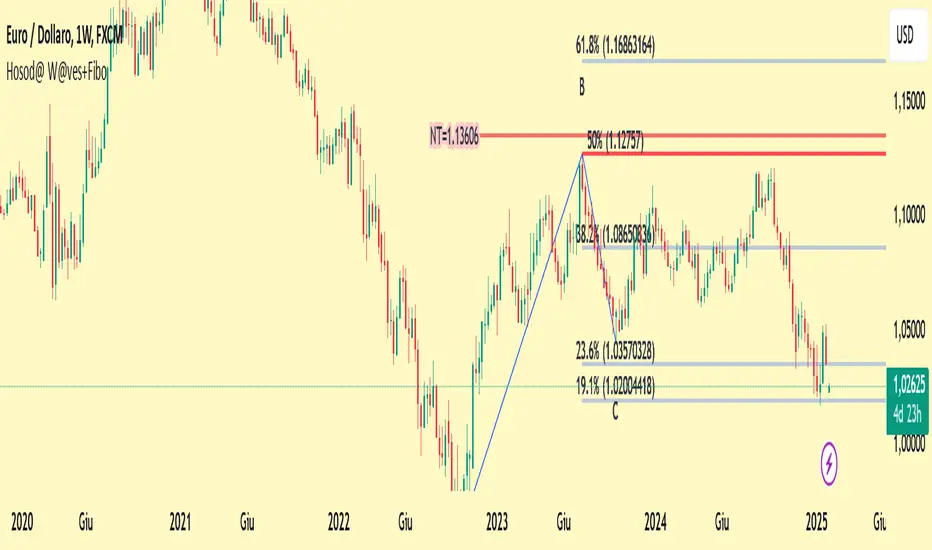
Hosoda N Wave and TPs {fmz}This script allows you to establish in a graphic and interactive way which are the N, NT, V and E targets for a Hosoda N wave.
Apply the indicator to the chart.
The interactive tool of Pine script version 5 will ask you to identify three points of "minimum-maximum-higher minimum" that form a bullish N wave of Hosoda (refer to the specific documentation for Hosoda N wave), or on the contrary three points "maximum-minimum-lower maximum" for a bearish N wave.
Once drawn, the price points can be moved.
When changing the market instrument, the indicator must be removed because it remains linked to the prices where it was first drawn.
TradingGroundhog - Strategy & Wavetrend V2#-- Public Strategy - No Repaint - Fractals - Wavetrend --
Here I come with another script, a nice and simple strategy based on fractals and Wavetrends.
#-- Synopsis --
A simple idea, on a small time frame (15 min) we buy when the opening price goes below a Bottom fractals and sell when it goes over a Top fractals, but in order to avoid bad and evil downtrends, we use Wavetrends based on a Daily time frame. From it, Tops and Bottoms are extracted. If the opening price goes above Wavetrend Tops, no trades will be conducted during the day. If the price goes below Wavetrend bottoms, no trades will be executed from 1 to N days, until a new Wavetrend bottom is generated.
I developed the strategy using BTC /EUR 15 MIN BINANCE but it can be applied to many other cryptos, I don't know for forex or others. You can use it for long term and automated trading, I implemented the Wavetrend indicator to do so, or for short term if you have spot a long coming uptrend. Test it, look at its profit and long or short period on your crypto of choice.
#-- Graph reading --
And now, how to read it ?
Wavetrends:
Red Backgrounds are associated to No Trade periods. These periods occur when the price goes below a Wavetrend bottom or above a Wavetrend Top. They are here to limit the loss.
Blue Gradient lines represent the past Tops. For each bar, only the increasing values of the Wavetrend tops are acquired. Going from light to dark blue based on the age of the Tops. Thus, if on line goes from dark to light, this means the price is approaching a previous Wavetrend top. In the opposite, if it darken, thus the price say 'buy buy' and go dropping.
Yellow Gradient lines represent the past Bottoms. They are based on the same principe that the blue lines.
Fractals:
Yellow Flags occur when the opening price goes below a Bottom fractal , it means Buy.
White Flags appear when the opening price goes over a Top fractal , it means Sell.
#-- Parameters --
*** Parameters have been intensively optimized using 10 cryptocurrency markets in order to have potent efficiency for each of them. I would recommend to only change the Can Be touch parameter. For the others, I don't recommend any modifications. The idea behind the script is to be able to switch between markets without having to optimize parameters, less work, easy to target active crypto and therefor limit the risks. ***
Can be touch :
'Combined Smoothness' : The number of open individuals used by the Wavetrend. (6 or 9, often 9 is better but with less volatile crypto it will be 6)
'Filter fractals' : Activate or Disable the filtering fractal operation. If Enable, buy during less risky periods. (Disable is often better)
Can be touch but not necessary :
'VolumeMA' : The Volume corrector used by the fractals
'Extreme window' : The number of price individuals to look for if we want to remove extreme fractals.
Not to touch :
'Limit_candle to look on' : Number of candles to use to compute the Wavetrend Tops and Bottoms.
'Length top bottom drawn' : Size of the lines
'Long Sop Loss (%)' : The minimal difference of price between a Fractal bottom and the opening price to buy.
#-- Time frame --
Should be used with the following time frames depending on the necessity:
1 MIN
3 MIN (Interesting for short term profit, may need some parameter ajustements)
5 MIN
15 MIN (Preferred for long term profit, the script was developed on it)
#-- Last words --
The script can be set up to send Tradingview signals to 3comma just by adding comment = " " in strategy.close_all() and strategy.entry().
Good trades !
Disclaimer (As it should always be one to any script)
***
This script is intended for and only to be used for personal purposes only. No such information provided by it constitutes advice or a recommendation for any investment or trading strategy for any specific person. There is no guarantee presented or implied as to the accuracy of specific forecasts, projections, or predictive statements offered by the script. Users of the script agree that its original developer does not take responsibility for any of your investment decisions. Please seek professional advice before trading.
***
# Here are the results from the 1rst of July 2021 with 100% of equity on the BTC /EUR 15 Min and with a capital of 1 000 EUR.
# As I saw, it goes from +20% to more than +100% depending on the selected crypto. Sometimes it's negative but it's quite rare on crypto using the EUR.

MTF Wave Trend CrossThis indicator is based on the famous "Wave Trend Oscillator" by LazyBear.
I have noticed that the Wave Trend Crosses (not the waves themselves) give a pretty good indication on the current status of the market (above Zero = bullish / below Zero = bearish ).
This new indicator is a Multi TF Version of this where it is possible to define 4 fixed Higher Time Frames and 4 fixed Lower Time Frames.
The results are then plotted above (higher TF) and below (lower TF) of the result of the current TF. (Offset can be flexibly changed in the settings)
This allows to judge the trend based on the various TFs.
Basically the greener it looks, the more bullish the situation is at the moment. More red color indicates a more bearish situation.
Enjoy.

EMA Wave Indicator [LazyBear]This is a 3 EMA visualization tool. Relative momentum across 3 timeframes are rendered as A/B/C waves. Also, helpful in identifying spike/exhaustion bars.
When all the waves are in the same direction, the momentum is very high on that direction. I have made all options configurable, have fun tuning for your instrument :)
Complete list of all my indicators:
docs.google.com

Low-High Waves for NeowaveOpen your chart at daily and hide the symbol graphic. Now you can see the waves. It’s including limited data sorry for this but I’m not a programmer and TradingView have limitations.

Elliott Wave — HYBRID BEAST MODE⭐ Elliott Wave — HYBRID BEAST MODE
Description (Copy/Paste for Publishing)
Elliott Wave — HYBRID BEAST MODE is an advanced, automated Elliott Wave detection engine that blends classical wave theory with modern algorithmic logic. This tool identifies impulsive waves, corrective structures, wave-strength conditions, and volume-enhanced Wave 3 confirmations — all while automatically adapting to any timeframe.
This script uses a hybrid approach:
• Elliott Oscillator (5/35 MA difference)
• Pivot-based wave structure detection
• Automated wave spacing (dynamic by timeframe)
• Fibonacci projection mapping
• Wave channels & structure geometry
• Dashboard for quick-read market conditions
• Automatic alerts for Wave 3, Wave 5, and corrective waves
Key Features
✔ Auto Wave Detection using pivot geometry and spacing logic
✔ Elliott Oscillator histogram for momentum confirmation
✔ Wave Labels (1–5, A–B–C) with intelligent spacing
✔ Adaptive Timeframe System that recalculates wave spacing automatically
✔ Wave 3 Strength Logic using your custom volume multiplier
✔ Fibonacci Levels for projection and confirmation
✔ Wave Channels for structure alignment
✔ Built-In Alerts for key high-probability moments
✔ Designed for 4H / Daily, but optimized for all timeframes
Use Cases
• Identifying impulsive wave cycles
• Confirming corrections & retracements
• Determining trend exhaustion
• Timing Wave 3 and Wave 5 extensions
• Integrating wave theory with oscillator momentum
This is a full Elliott Wave toolbox packed into one script — ideal for traders who want automatic structure detection without the subjectivity of manual wave counting.
WaveTrend with CrossesWaveTrend with Crosses — Spot Golden & Dead Crosses with Precision!
WaveTrend with Crosses is a customized version of the classic WaveTrend oscillator, enhanced with clean visual signals to help you pinpoint momentum shifts through golden and dead crosses.
✅ Key Features
Momentum analysis based on WaveTrend (WT1 & WT2)
Detects Golden Cross (WT1 crosses above WT2) and
Dead Cross (WT1 crosses below WT2)
Customizable Overbought/Oversold zones (defaults: ±60, ±53)
Visual circle markers on valid crossovers for easy recognition
Built-in alert system to notify you of real-time cross signals
📊 How to Use
Add the indicator to your chart and choose your desired symbol & timeframe.
The blue shaded area shows the divergence between WT1 and WT2 — a visual cue for momentum buildup.
Circle markers:
Red circle: Dead cross — potential bearish momentum
Green circle: Golden cross — potential bullish reversal
Customize the settings to fit your personal trading strategy if needed.
🛠 User Inputs
n1, n2: Channel lengths (default: 10 and 21)
obLevel, osLevel: Overbought/Oversold thresholds (default: ±60 / ±53)
standardValue: Threshold used to validate significant crossovers (default: 60)
🔔 Alert System
Get notified with alerts like "Golden Cross" or "Dead Cross" when key crossovers occur,
helping you react quickly and confidently.
⚠️ Notes
Past performance is not indicative of future results — always backtest and use in conjunction with other tools.
Low timeframes may generate frequent signals; filtering or confirmation is recommended.
💡 Author's Note
Simple and effective — this tool is designed to focus solely on cross-based entries.
Ideal for momentum-based scalping or swing trading strategies.
Feel free to customize and tweak as needed! 😄

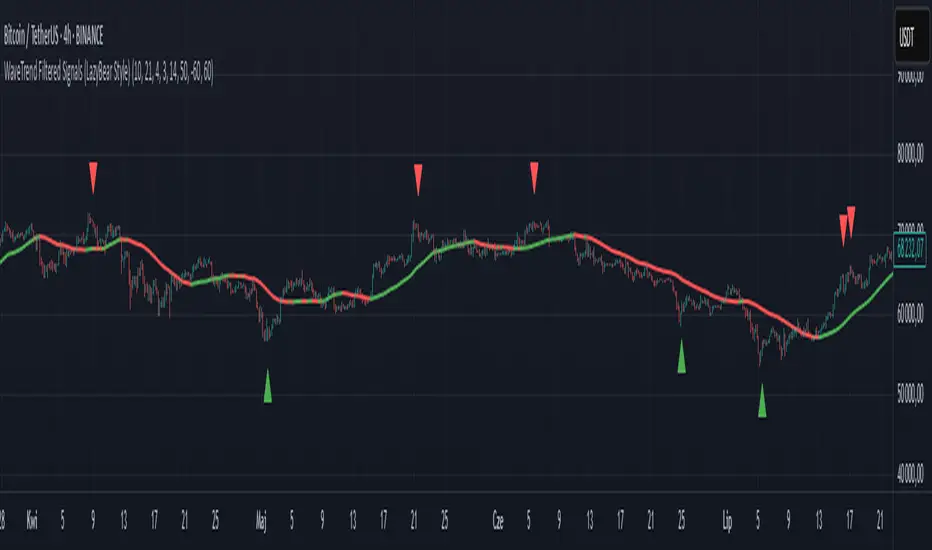
WaveTrend Filtered Signals (LazyBear Style)WaveTrend Filtered Signals (LazyBear Style)
This indicator is based on the popular WaveTrend oscillator (LazyBear) and adds several optional filters to improve signal quality:
✅ Available filters:
WT oversold/overbought zones – enabled by default. Signals are shown only if WT was previously in the specified zone (e.g., < -60 for longs, > 60 for shorts).
SMA trend filter – allows filtering signals in the direction of the moving average trend.
SMA position filter – signals appear only when price is above (for long) or below (for short) the moving average.
Consolidation filter – ignores signals during low-volatility sideways price movement.
💡 All filters are optional and can be enabled or disabled in the settings.
The default setup focuses on a clean approach: WaveTrend + oversold/overbought zones, with other filters left for customization.
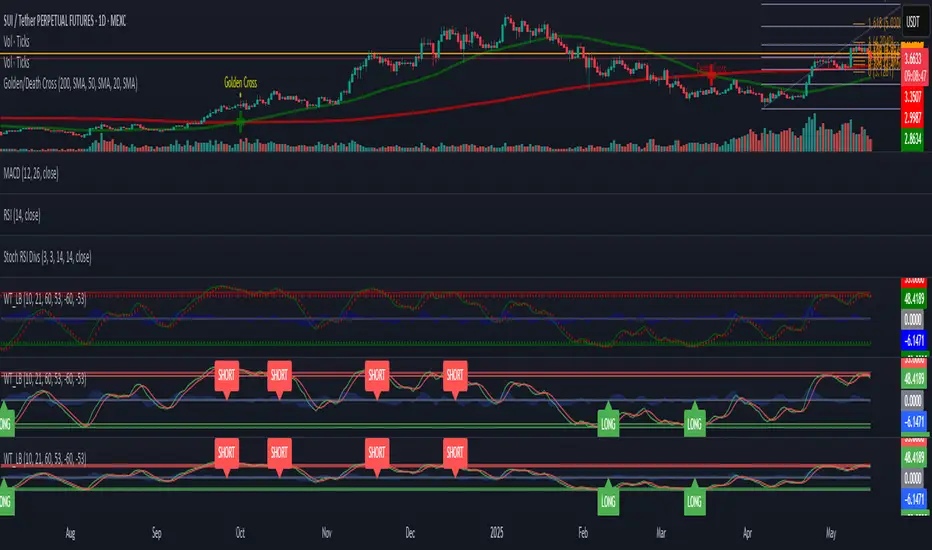
WaveTrend [LazyBear] with Long/Short LabelsWaveTrend Oscillator with Entry Signals (LONG/SHORT) – Advanced Edition
This indicator is based on the renowned WaveTrend Oscillator by LazyBear, a favorite among professional traders for spotting trend reversals with precision.
🚀 Features:
Original WaveTrend formula with dual-line structure (WT1 & WT2).
Customizable overbought and oversold zones for visual clarity.
Automatic LONG and SHORT signals plotted directly on the chart:
✅ LONG: When WT1 crosses above WT2 below the oversold zone.
❌ SHORT: When WT1 crosses below WT2 above the overbought zone.
Momentum histogram shows strength of market moves.
Fully optimized for Pine Script v5 and lightweight across all timeframes.
🔍 How to use:
Combine with support/resistance levels or candlestick reversal patterns.
Works best on 15min, 1H, or 4H charts.
Suitable for all markets: crypto, stocks, forex, indices.
📊 Ideal for:
Traders seeking clean, reliable entry signals.
Reversal strategies with technical confluence.
Visual confirmation of WaveTrend crossovers without manual interpretation.
💡 Pro Tip: Combine with EMA or RSI filters to further enhance accuracy.
Hosoda Waves ABCThe Hosoda Waves indicator was devised by Goichi Hosoda, the creator of the Ichimoku system, with the idea that previous highs and lows could determine future price ranges to which the market would react. Hosoda's projections include the NT, N, V, and E waves, derived from calculations based on both upward and downward ABC swings. The calculations for Hosoda's waves are as follows:
NT Wave = C + (C - A)
N Wave = B + (B - A)
V Wave = B + (B - C)
E Wave = C + (B - A)
This indicator visually represents the calculations by Hosoda. Additionally, Hosoda indicated time cycles: 9, 17, 26, 33, 42, 51, 65, 76, etc., which are not integrated into this indicator as they are not considered effective in contemporary times.
Once applied to the chart, the interactive Pine Script tool version 5 will prompt you to identify 3 points of "low-high-low" or "high-low-high," both for upward and downward movements. Once clicked, these price points can be moved. If you change the time frame or market instrument, the indicator must be removed because it remains tied to the prices where it was initially drawn.
Harmonic Sine Waves model plot Hey,
Here is another tool that I created. I could not find anything similar.
This script is creating a sine wave, based on the given length, amplitude, horizontal vertical offset.
After this it plots also nearest harmonics to the base sine wave and draws it on the chart.
At the last step it sums up the value for base sine wave with its harmonics.
This is a great way to experience how 4 basic sine waves, when summed up, are creating more complex chart.
This shows that the 'chaotic' chart can be built on just a few most important factors.
You do not have to "know every single fact" about the asset to make a proper forecast.
You just need those most important.
It is crucial though, to offset the chart in a correct way, so it is in phase with the asset that we work on.

Moving Average with Dynamic Color Gradient (WaveTrend Momentum)Similar scripts exist but I haven't seen one using WaveTrend and I haven't seen one that hand picks evenly divided colors between GREEN-YELLOW-RED.
The green is exact green, the yellow is exact yellow, and the red is exact red.
Not complicated, just useful.

On-chart Wavetrend Divergence with PivotsThis is an OnChart WaveTrend Divergence Indicator with Pivots and Alerts
LazyBears WaveTrend Indicator or also known as "Market Cipher" is an Indicator that is based on Moving Averages, therefore its an "lagging indicator". Lagging indicators are best used in combination with leading indicators. In this script the "leading indicator" component are Daily, Weekly or Monthly Pivots. These Pivots can be used as dynamic Support and Resistance, Stoploss, Take Profit etc.
This indicator combination is best used in larger timeframes. For lower timeframes you might need to change settings to your liking.
What are those circles?
-These are the WaveTrend Divergences. Red for Regular-Bearish. Orange for Hidden-Bearish. Green for Regular-Bullish. Aqua for Hidden-Bullish.
Please keep in mind that this indicator is a tool and not a strategy, do not blindly trade signals, do your own research first! Use this indicator in conjunction with other indicators to get multiple confirmations.

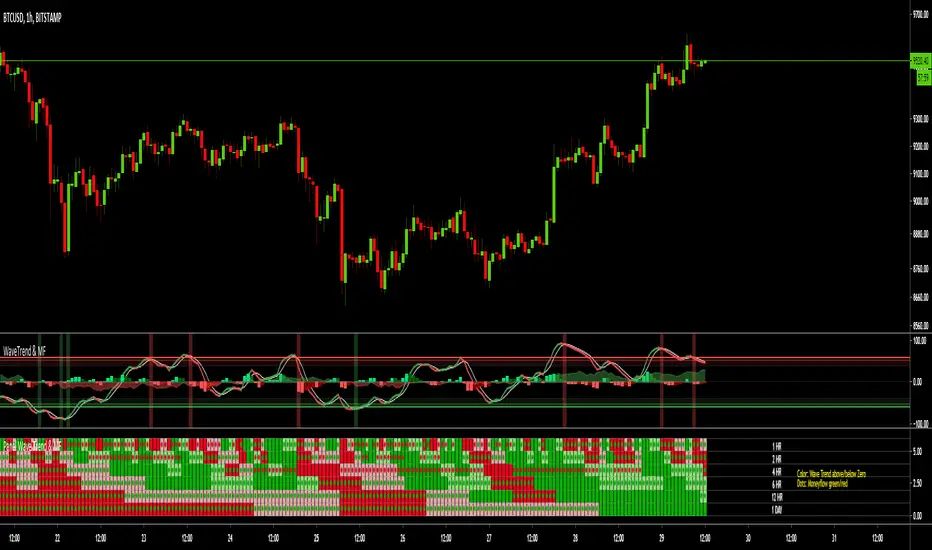
MTF Wave Trend & Money Flow - Monitoring PanelAnother indicator based on the famous "Wave Trend Oscillator" by LazyBear.
Monitoring panel showing the Wave Trend as color for 6 different timeframes. Additionaly the Money Flow (positive or negative) is indicated as green or red dots.
I find it helpful that with one glance the current Wave Trend and Money Flow on many timeframes is visible.
(Timeframes can be changed, but the description labels are currently hardcoded - if you want to change it, just copy the script and change them)
Meanings of the Colors:
WT above Zero and rising : Dark Green
WT above Zero and declining : Light Green
WT below Zero and declining : Dark Red
WT below Zero and rising : Light Red
Money flow positive : Green dot
Monet flow negative : Red dot
(Currently there are two additional timeframes commented in the code - if you want to use them, just copy the script and uncomment them)
Have fun and as always I am open for constructive feedback.
Cheers!
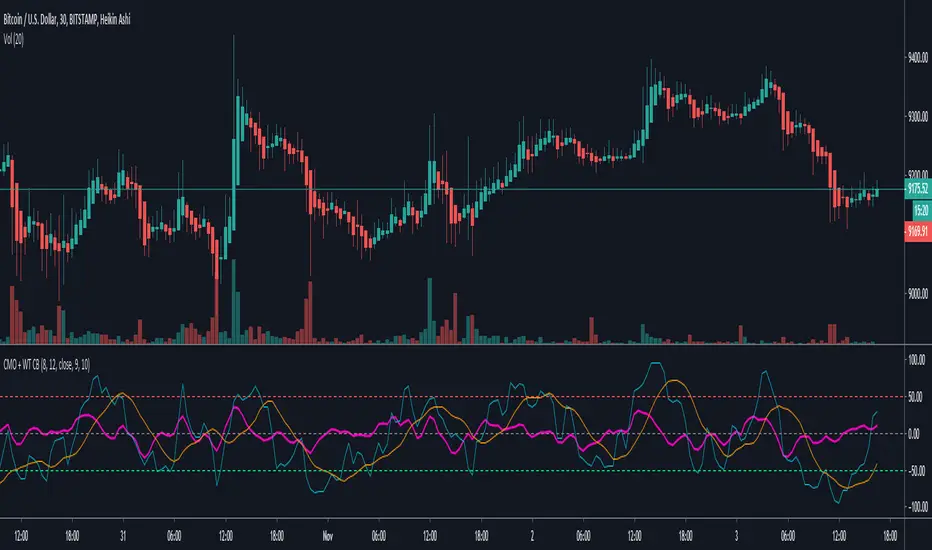
Chande Momentum Oscillator + WaveTrend Oscillator [ChuckBanger]This is a combination of Lazybears WaveTrend Oscillator (purple line) and Chande Momentum Oscillator (blue line with the orange line as a signal line). Use WaveTrend as a confirmation tool. It is consider as a selling point when CMO is over the red horizontal dotted line. The opposite applies if CMO line is under the red horizontal dotted line.
You can also use this with WaveTrand to confirm the sell or buy point. When WT line is over center line and CMO has crossed over it's signal line. It is a buy point. The opposite applies if WT line is under the center line and CMO is under its signal line.
Waddah Attar Explosion and WaveTrend Oscillator combinedWaddah Attar Explosion by LazyBear and WaveTrend Oscillator by Krypt.
All credits goes to LazyBear and Krypt, i have only done some combining with the two indicators, barcolors and BG colors to clarify entrys and exits.
Combine with CM_Williams Vix_Fix, Super Guppy R1.0 by JustUncleL and you have a powerful tool.
Barcolors to look for
Aggressive Buy 1 = Lime
Agressive Buy 2 = Aqua
Buy = Green
Sell 1 = Orange
Sell 2 = Red
This is my first try, so be nice to me :-)

RSI Bollinger WaveTrend Cycle Multi Free TSPMulti indicator
Bollinger Band x RSI
Wave Trend
Cycles
Free users will like it :)
Fell free to like share comments... and check my other stuff :]

Waves UltimateWaves Ultimate is a comprehensive Elliott Wave analysis tool designed to assist traders in identifying and validating wave structures in real-time. This indicator combines automatic wave detection with strict Elliott Wave rule validation, Fibonacci projections, and visual wave labeling to provide a complete wave analysis suite.

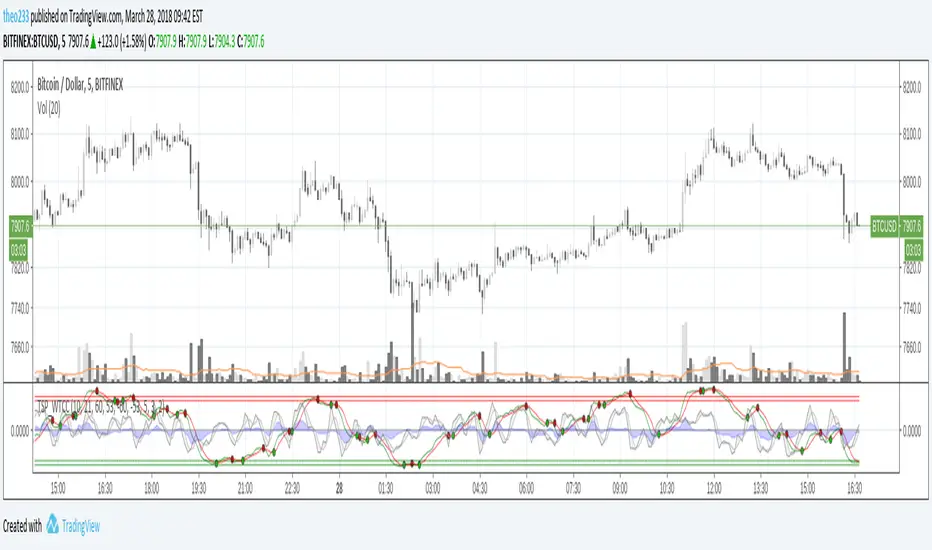
Vdubus Divergence Wave Pattern Generator V1The Vdubus Divergence Wave Theory
10 years in the making & now finally thanks to AI I have attempted to put my Trading strategy & logic into a visual representation of how I analyse and project market using Core price action & MacD. Enjoy :)
A Proprietary Structural & Momentum Confluence SystemPart 1: The Strategic Concept1. The Core Philosophy: "Geometry + Physics"Traditional technical analysis often fails because traders confuse location with timing.Geometry (Price Patterns): Tells us WHERE the market is likely to reverse (e.g., at a resistance level or harmonic D-point).Physics (Momentum): Tells us WHEN the energy driving the trend has actually shifted. The Vdubus Theory posits that a trade should never be taken based on Geometry alone. A valid signal requires a specific, fractal decay in momentum—a "Handshake" between price structure and energy exhaustion.2. The 3-Wave Momentum Filter (The Engine)Most traders look for simple divergence (2 points). The Vdubus Theory demands a 3-Wave Structure to confirm the true state of the market.A. The Standard Reversal (Exhaustion)This is the "Safe" entry, catching the slow death of a trend.Wave 1 $\rightarrow$ 2 (The Warning): Price pushes higher, but momentum is lower (Standard Divergence). This signals that the trend is tapping the brakes.Wave 2 $\rightarrow$ 3 (The Confirmation): Price pushes to a final extreme (often a stop-hunt), but momentum is flat or lower than Wave 2 ("No Divergence").The Logic: This confirms that the buyers have expended all remaining energy. The engine is dead.
B. The Climax Reversal (The Trap)This is the "Aggressive" entry, catching V-shape reversals.Wave 1 $\rightarrow$ 2 (The Bait): Price pushes higher, and momentum is Stronger/Higher (No Divergence). This sucks in retail traders who believe the trend is accelerating.Wave 2 $\rightarrow$ 3 (The Snap): Price pushes again, but momentum suddenly collapses (Divergence).The Logic: A "Strong to Weak" shift. The market traps traders with a show of strength before hitting a "concrete wall" of limit orders.C. The Predator (The Trend Continuation)The Logic: Trends rarely move in straight lines. The "Predator" looks for Hidden Divergence during a pullback.The Signal: Price makes a Higher Low (Trend Structure Intact), but Momentum makes a Lower Low (Oversold Trap). This signals the end of the correction and the resumption of the main trend.3. The "Clean Path" PrincipleA trade is only valid if there is no opposing force. If you are looking to Sell (Bearish Reversal), the opposing Bullish momentum must be weak or neutral. If the "Enemy" is strong, the trade is skipped.
Part 2: The Indicator Breakdown
Tool Name: Vdubus Divergence Wave Pattern Generator V1
This script automates your analysis by combining ZigZag Pattern Recognition (Geometry) with your Custom MACD Logic (Physics).
1. The "Golden" Settings
The physics engine is tuned to your specific discovery:
Fast Length: 8
Slow Length: 21
Signal Length: 5
Lookback: 3 (Sensitive enough to catch the exact pivot points).
2. Signal Generation Logic
The indicator scans for four distinct setups. Here is the exact logic code translated into English:
Signal 1: Standard Reversal (Green/Red Pattern)
Geometry: The ZigZag algorithm identifies a 5-point structure (X-A-B-C-D), such as a Gartley, Bat, or Butterfly.
Physics Check:
Finds the last 3 momentum peaks matching the price highs.
Rule: Momentum Peak 2 must be < Peak 1 (Divergence).
Rule: Momentum Peak 3 must be <= Peak 2 (Confirmation/No Div).
Output: Draws the colored pattern and labels it (e.g., "Bearish Gartley (Exhaustion)").
Signal 2: Climax Reversal (Orange Pattern)
Geometry: Identifies the same 5-point structures.
Physics Check:
Rule: Momentum Peak 2 is >= Peak 1 (Strength/No Div).
Rule: Momentum Peak 3 is < Peak 2 (Sudden Failure/Div).
Output: Draws the pattern in Orange labeled "⚠️ CLIMAX REVERSAL". This is your "Trap" detector.
Signal 3: Rounded Top/Bottom (Navy/Maroon Label)
Geometry: Price is compressing or rounding over.
Physics Check:
Scans for 4 consecutive waves of momentum decay.
Rule: Peak 1 > Peak 2 > Peak 3 > Peak 4.
Output: Places a label indicating a "Multi-Wave Decay," identifying turns that don't have sharp pivots.
Signal 4: The Predator (Purple Pattern)
Geometry: Identifies a trend pullback (Higher Low for Buys).
Physics Check:
Rule: Momentum makes a Lower Low while Price makes a Higher Low (Hidden Divergence).
Output: Draws a Purple pattern labeled "🦖 PREDATOR" to signal trend continuation.
3. The Confluence Dashboard
Located in the corner of the screen, this provides a final "Safety Check."
Logic: It compares the absolute value (strength) of the most recent Bearish Momentum Peak vs. the most recent Bullish Momentum Low.
Output:
Green (Bulls Strong): Buying pressure is dominant. Safe to Buy, Dangerous to Sell.
Red (Bears Strong): Selling pressure is dominant. Safe to Sell, Dangerous to Buy.
Grey (Neutral): Forces are balanced.
Summary of Potential
This system solves the "Trader's Dilemma" of entering too early or too late. By waiting for the 3rd Wave, you effectively filter out the market noise and only commit capital when the opposing side has structurally and physically collapsed. It transforms trading from a guessing game into a disciplined execution of identifying Geometric Exhaustion.
Logic 1 / PREVIOUS DIVERGENCE PROJECTS future TREND BREAKS / Reversals *Not in script*
Logic 2 / Wave 1 to 2 = Divergence / Wave 2 to 3 = NO divergence = Signal
Reverse logic: Wave 1 to 2 = NO Divergence / Wave 2 to 3 = Divergence = Signal
