WaveTrend LazyBear + BUY/SELL Labels (Custom Color)WaveTrend LazyBear + BUY/SELL Labels (Custom Color)
Cari dalam skrip untuk "wave"

Sequence Waves [OmegaTools]the sequence waves indicator, developed by omegatools, is a multi-functional tool designed to detect trends, sequences, and potential reversal signals based on price movements and volume. this indicator has two main modes, "trend" and "sequence," which determine how the indicator calculates directional changes. additional enhancements in this version include reversal signals, allowing users to identify potential long and short opportunities with specific entry cues.
input parameters
mode (mode): chooses the calculation basis for directional movement.
- "trend": uses a midline calculated from the highest high and lowest low over the "trend mode length" period to assess if the price is in an upward or downward trend.
- "sequence": compares the current price to the closing price of the previous "sequence mode length" period to detect shifts in direction.
counter mode (modec): sets whether the counter increments by a fixed amount (1 or -1) or the volume of the bar, impacting the indicator’s sensitivity.
- "fixed": increments or decrements the counter by 1.
- "volume": increments or decrements based on the period’s volume, making the indicator more responsive to high-volume periods.
percentile length (lntp): defines the lookback period for calculating overbought and oversold thresholds using a percentile method. shorter lengths make ob/os levels more reactive.
sensitivity (sens): controls the percentile-based ob/os thresholds, ranging from 10 to 100. higher values narrow ob/os zones, while lower values widen them, impacting signal frequency.
trend mode length (lnt1): sets the period length for midline calculation in trend mode, defaulting to 21. longer periods smooth the midline for detecting major trends.
sequence mode length (lnt2): sets the lookback period in sequence mode, with a default of 4. shorter lengths capture more frequent directional changes, while longer lengths smooth signals.
visual colors:
- up color (upc): sets the color for upward movements.
- down color (dnc): sets the color for downward movements.
calculation logic
midline calculation: in trend mode, a midline is derived from the average of the highest high and lowest low over the "trend mode length" period, acting as a reference to detect upward or downward movements.
counter calculation:
- in trend mode, if the close price is above the midline, the counter increases (or volume if volume mode is selected). it decreases when the price is below.
- in sequence mode, the counter increases if the close is above the closing price from "sequence mode length" periods ago and decreases if below.
the counter resets to zero on direction changes, creating clear directional transitions.
overbought/oversold percentiles: separate arrays track the counter’s values each time the direction changes, creating historical up and down values. ob and os thresholds are dynamically determined based on these arrays, with sizes limited by the percentile length and sensitivity inputs.
reversal signals: two new variables, "long" and "short," detect potential reversal points when the counter crosses specific thresholds:
- long: a long signal is generated when the counter switches to positive and exceeds the down percentile.
- short: a short signal is triggered when the counter switches to negative and exceeds the up percentile.
visual and display elements
counter plot: plots the counter value on the chart with color-coded columns, making it easy to spot directional momentum.
up and down percentiles: displays overbought (up percentile) and oversold (down percentile) thresholds to identify potential reversal zones.
regime background: the background color changes based on market regime:
- bullish (up percentile > down percentile): greenish background.
- bearish (down percentile > up percentile): reddish background.
- neutral (both percentiles equal): grayish background.
reversal signals: plotted as small triangles on the chart for visual confirmation of potential long (triangle up) and short (triangle down) reversal signals.
obs background: changes color when the counter exceeds ob or os thresholds, creating a visual cue for extreme market conditions:
- overbought: background changes to a faint down color.
- oversold: background changes to a faint up color.
status table: displayed on the right side of the chart, providing real-time status information:
- status: shows "overbought," "oversold," "long," "short," or "none" based on the current counter position.
- regime: indicates whether the market is in a "bullish," "bearish," or "neutral" state based on the percentile comparison.
- percentile up/down: displays the current up and down percentiles for quick reference.
how to use the indicator
trend following: in trend mode, use the midline-based counter to gauge if the market is in an uptrend (positive counter) or downtrend (negative counter).
reversal detection: the ob/os thresholds assist in identifying potential reversal points. when the counter exceeds the up percentile, it may indicate an overbought state, suggesting a bearish reversal. similarly, dropping below the down percentile may indicate an oversold state, suggesting a bullish reversal.
entry signals: use the long and short reversal signals for potential entry points, particularly in trending or range-bound markets. these signals are indicated by up and down triangles.
sequence trading: in sequence mode, the indicator tracks shorter-term directional shifts, making it suitable for detecting smaller momentum patterns based on recent price comparisons.
volume sensitivity: selecting volume mode enhances sensitivity to high-volume moves, allowing it to detect stronger market activity in both trend and sequence modes.
the sequence waves indicator is suited to both short-term and long-term traders. it allows for detailed trend analysis, reversal detection, and dynamic ob/os signals. the inclusion of visual reversal cues makes it a flexible tool adaptable to a variety of trading strategies.

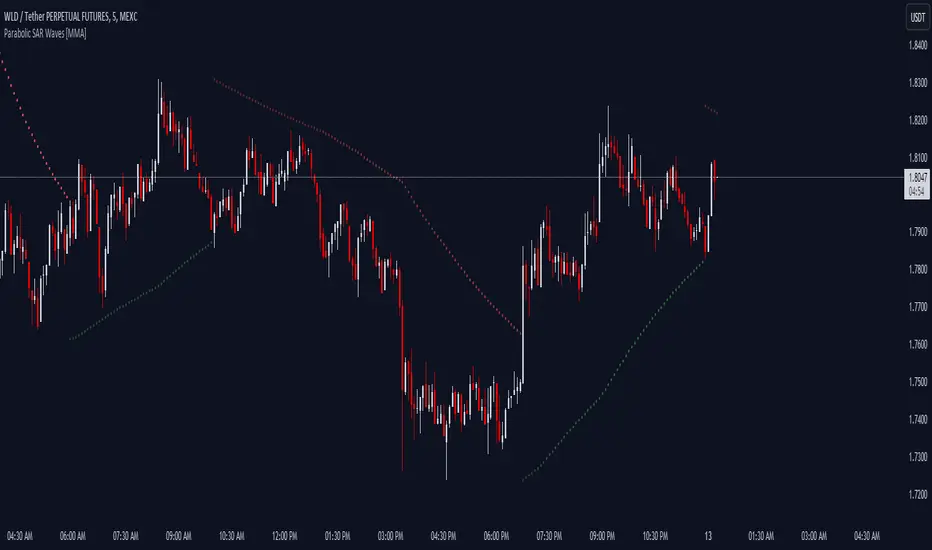
Parabolic SAR Waves [MMA]Parabolic SAR Waves
Description:
The "Parabolic SAR Waves " is an advanced version of the traditional Parabolic SAR indicator, customized for TradingView. This script incorporates dynamic acceleration factors and optional gradient coloration to enhance visual interpretation and utility for traders aiming to accurately capture trends and predict potential reversals.
Features:
- Dynamic Acceleration: Adjust the initial, incremental, and maximum values of the acceleration factor to suit various market conditions and trading preferences.
- Gradient Coloring: Use gradient colors to indicate the strength and stability of the trend, providing visual cues that are easy to interpret.
- Trend Visibility: The SAR dots are plotted directly on the price chart, making it easy to spot trend changes and maintain situational awareness.
- Overlay Feature: Designed to overlay directly on the price charts, allowing for seamless integration with other technical analysis tools.
Benefits:
- Trend Detection: Helps in identifying the beginning and potential reversal of trends, aiding in timely decision-making.
- Stop-Loss Management: Utilizes the positions of the SAR dots as dynamic stop-loss points, which helps in risk management.
- Visual Simplicity: Enhances the decision-making process through a straightforward visual representation of trend data.
Parameters:
- Acceleration Start (accel_start): The initial value for the acceleration, set to 0.02 by default.
- Acceleration Increment (accel_inc): The amount by which the acceleration increases, set to 0.005 by default.
- Acceleration Maximum (accel_max): The maximum limit of the acceleration factor, set to 0.1 by default.
- Use Gradient Colors (use_gradient): A boolean toggle to enable or disable gradient coloring, enabled by default.
Indicator Usage:
1. To apply, select this indicator from TradingView's indicator library.
2. Adjust the acceleration parameters based on your specific trading strategy and market analysis.
3. Interpret the indicator signals:
- Green SAR dots below the price bars indicate a bullish trend.
- Red SAR dots above the price bars signify a bearish trend.
- Gradient colors, if enabled, provide insights into the acceleration factor's intensity relative to trend strength.
Alerts:
- Bullish Reversal Alert: Issues a notification if there is a potential upward reversal when the trend shifts to bullish.
- Bearish Reversal Alert: Alerts when there's potential for a downward move as the trend turns bearish.
The "Parabolic SAR Waves " is a robust tool, ideal for traders who need precise, customizable trend-following capabilities that integrate seamlessly with other market analysis strategies. Enhance your trading with detailed trend insights and adaptive parameter controls.
ZigZag Smart Trend [TradingFinder] Major & Minor Structured Wave🔵 Introduction
🟣 Zigzag
Zigzag is a lagging indicator; this indicator identifies points on a price chart that have more significant changes than its previous wave and then by connecting these lines to each other, it assists traders in trend detection.
This indicator reduces random price fluctuations and attempts to make the primary price trend clearer.
🟣 Pivot
Pivots are points where the price chart changes direction. Pivots, also called reversal points, form when supply and demand forces dominate one another.
Different types of technical analysis pivots can be introduced into two categories, minor pivots, and major pivots, each of which has a specific meaning in analysis.
Major Pivot : These pivots actually indicate major changes in the direction of the chart and occur at the end of trends. Analysts seeking to reach the primary analysis focus more on major pivot points. In fact, most technical analysis tools are examined and determined based on major pivots.
Minor Pivot : This type of pivot focuses more on small and subsidiary points and directions. Therefore, it occurs at the end of corrections. Analysts focusing on minor pivots represent small trends, and it should be noted that minor pivots are not suitable for use in primary technical tools.
How to identify minor and major pivots :
Minor pivots are pivots formed between two major pivots and fail to break the opposite major pivot.
Major pivots are pivots that have either successfully broken the opposite pivot or have moved more than the previous pivot of the same type.
🔵 How to use
Based on identifying pivots and drawing zigzag lines, you can have various uses for this indicator.
Identifying support and resistance levels :
Identifying Elliott Waves :
Identifying classic patterns :
Identifying pivots with higher validity :
Identifying internal and external breakouts :
Identifying trends and range areas :
Identifying pivot types along with major and minor recognition :
MHH : Major Higher High
MLH : Major Lower High
MLL : Major Lower Low
MHL : Major Higher Low
mHH : Minor Higher High
mLH : Minor Lower High
mLL : Minor Lower Low
mHL : Minor Higher Low
🔵 Settings
Pivot Period Zigzag Line : Using this input, you can determine the pivot period for identifying zigzag swings.
Show Zigzag Line : To show or not to show the zigzag line.
Zigzag Line Color : Change the color of the zigzag line.
Zigzag Line Style : Change the Style of the zigzag line.
Zigzag Line Width : Change the Width of the zigzag line.
Show Label : To show or not to show Pivot Type.
Color Label : Change the color of the Pivot Type Label.

Hull WavesThe Hull Waves indicator is based on the Hull Moving Averages (HMA), which are special moving averages that stand out for their ability to filter out market noise and offer a clearer view of price trends. Compared to traditional moving averages, HMAs are more responsive yet smoother, allowing traders to capture significant price movements without getting overwhelmed by short-term fluctuations.
The HMAs integrated into Hull Waves provide two distinct perspectives on the price trend:
8-period HMA: This short-term HMA is extremely reactive and closely follows price changes. It is ideal for capturing short-term trading signals while the medium-term 21-period HMA offers a more balanced view of price trends and identifies medium-term trends.
By crossing HMAs, traders can efficiently identify trend reversal points or strong market continuations.
Another feature of the indicator is the “fan” of dynamic lines, which acts as a visual float for price candles, allowing traders to quickly evaluate trading opportunities.
The "fan" or float of dynamic lines represents a visual representation of the candle's price movements. These lines extend from the start point to the end point, like an open fan. This visual approach makes the market dynamics immediately evident.
Strategy:
Long Entry Signal (Buy):
When the Hull Waves range shows a series of upward sloping lines and the Hull Moving Averages (e.g. 8-period HMA) crosses the 21-period HMA upwards, it is a long entry signal.
Confirmation of the signal can come from an increase in trader volume or other supporting indicators.
Place a buy order at the next closing price.
Short Entry Signal (Sell):
When the Hull Waves range shows a series of downward sloping lines and the Hull Moving Averages (e.g. 8-period HMA) crosses the 21-period HMA downward, it is a short entry signal.
Confirm the signal with an increase in trader volume or other relevant indicators.
Place a sell order at the next closing price.
Exit Signal (Closing a Position):
To close a long position, wait for a signal reversal, such as the Hull Moving Averages crossing downwards or a change in the Hull Waves range.
To close a short position, wait for a signal reversal, such as the Hull Moving Averages crossing higher or a change in the Hull Waves range.

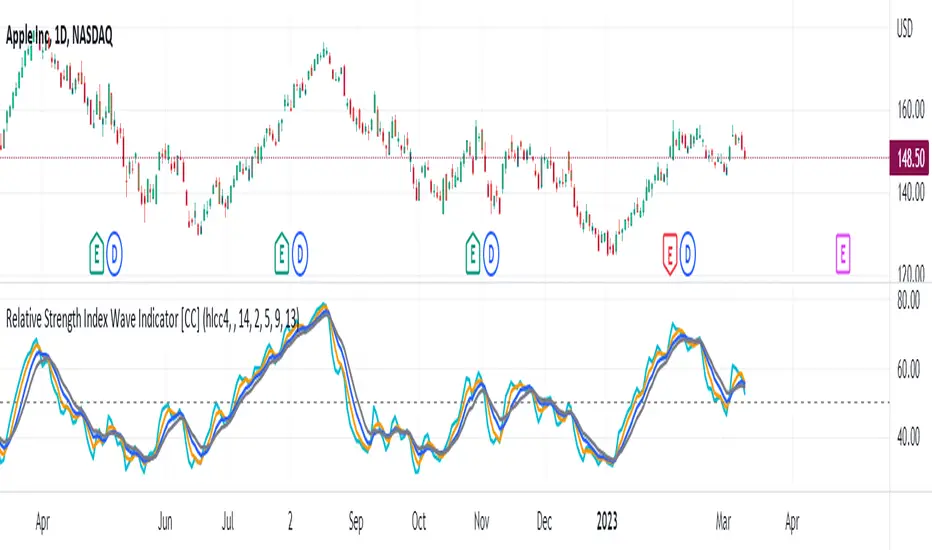
Relative Strength Index Wave Indicator [CC]The Relative Strength Index Wave Indicator was created by Constance Brown (Technical Analysis for the Trading Professional), and this is a unique indicator that uses the weighted close formula, but instead of using the typical price values, it uses the RSI calculated from the various prices. It then creates a rainbow by smoothing the weighted RSI with four different lengths. As far as the buy or sell signals with this indicator go, I did change things from the original source, so feel free to experiment and let me know if anything works better for you. I decided to do a variation of the original source and create buy and sell signals based on crossovers, but my version only uses the first and second smoothed RSI lines. You could also average all of the lines and buy when the average is rising and sell when it starts to fall. I have used my typical buy and sell signals to use darker colors for strong signals and lighter colors for normal signals. Because of the rainbow effect from the wave, the color changes will only appear for the bar itself when you enable that setting.
Let me know if there is any other script you would like to see me publish! I will have plenty more RSI scripts to publish in the next week. Let me know if you like this indicator series.
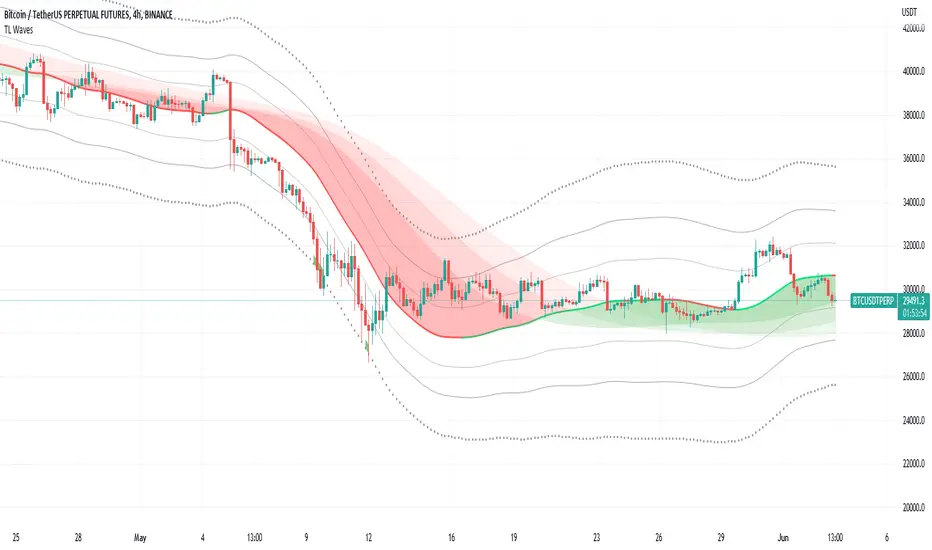
TL WavesI created this indicator inspired by the miyuki waves indicator by eto_miyuki. In my indicator we have 17 types of moving averages which can be selected in the settings.
It is a trend indicator, the base of the wave is a moving average and 4 Average True Range (ATR) Bands derived from the baseline are formed.
There are also 3 moving averages in a guppy style, these 3 moving averages can also be configured.
The moving average options are:
SMA ---> Simple
WMA ---> Weighted
VWMA ---> Volume Weighted
EMA ---> Exponential
DEMA ---> Double EMA
ALMA ---> Arnaud Legoux
HMA ---> Hull MA
SMMA ---> Smoothed
LSMA ---> Least Squares
KAMA ---> Kaufman Adaptive
TEMA ---> Triple EMA
ZLEMA ---> Zero Lag
FRAMA ---> Fractal Adaptive
VIDYA ---> Variable Index Dynamic Average
JMA ---> Jurik Moving Average
T3 ---> Tillson
TRIMA ---> Triangular
All settings are available for changing inputs.
Volume Pump WaveThis indicator displays volume as a pump wave. Can be useful for chart analysis and easy detection of anomalies/trends.

Technical Ratings Pro - Pump WaveThis script uses the built in Technical Ratings indicator but interprets the data visually. It plots the results for "total", "MA" and "other" as pump waves. It uses MA to plot a trend line (can be turned off in settings) . Candles are colored to the rating strength and a percentage number was added to the results. For more informations on the Technical Ratings indicator please refer to official documentation.

Function Square WaveThis is a script to draw a square wave on the chart, with an indicator for current price.
Markets undergoing Dow Jones or Wyckoff Accumulation/Distribution cycles tend to move in such waves, and if the period of the cycles are detected, a signal for accumulation/distribution phases can be created as an early warning.
Useful inputs:
- Average True Range as the wave height.
- Assumed Wave period as the wave duration.
I divided the current price wave by 2 to make the indicator more visually friendly.
GLHF
- DPT

cRSI + Waves Strategy with VWMA overlayStrategy based on my cRSI with motive/corrective wave indicator. Please note that it is far from perfect. I use it mostly to help me identify good entry and exit points when combined with my other technical analysis. It misses some obvious points, but on average it does pretty well. The challenge often is indicating when you have sufficient change in the cRSI to know that the trend has changed, that means sometimes it can be a little early or late. It definitely helps take a lot of the guess work out of things. It works better on some equities than others and better on some time frames than others. You just have to play with it. At the minimum, it is a good template to learn how to write your own.


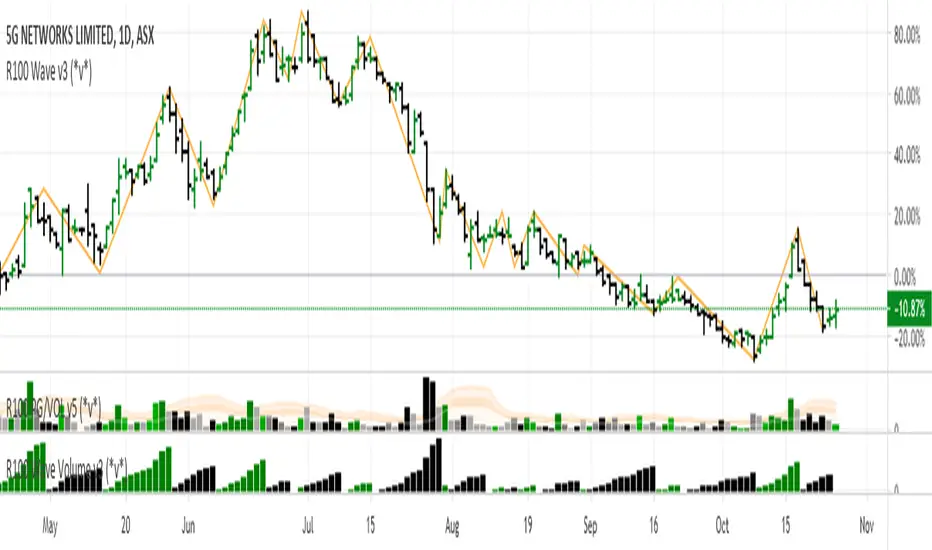
R100 Wave Volume v2 (*v*)This indicator is similar to the Weis Wave Volume indicator in that it shows cumulative volume for each up and down price wave. However it is calculated differently, using the Jurik moving average to determine turning points. Use this in conjunction with the R100 Wave indicator to determine the best fit Jurik length and power settings.
A great indicator to help analyse the strength of pullbacks, continuation moves and changes in behaviour.
I hope you get some value out of it. Only conditions of use are that if you improve it, let me know and if you publish something that uses it, don't hide the code! Enjoy!
Code pinched and modified from Zero Lag ZigZag by Duyck - thankyou
Jurik Moving Average (for turning points) by Everget - thankyou
and Weis Wave by Modhelius - thankyou
WaveTrend + Alert + LSMA + CrossWaveTrend inspired by LazyBear's WT indicator with addition of crossing dots, crossing alert and LSMA
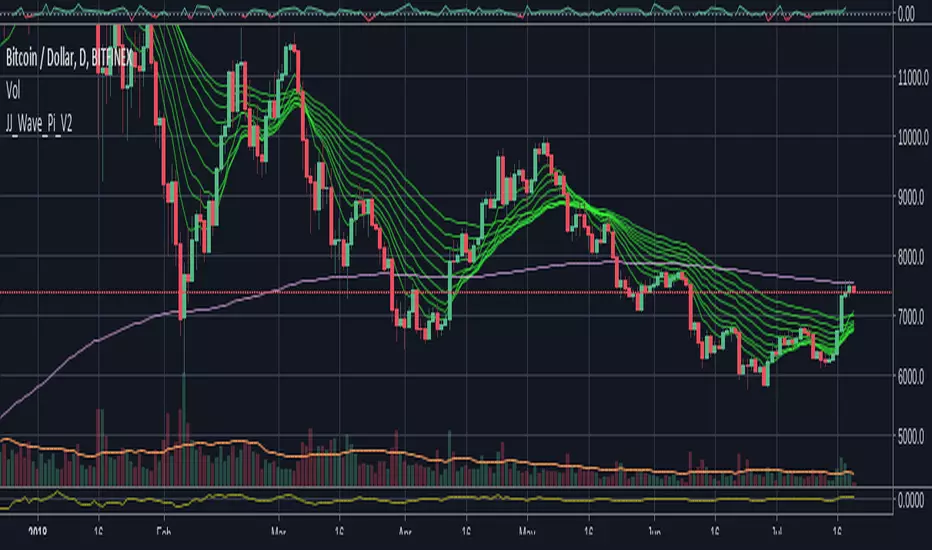
Jason Jenkins Wave plus Pi [Ver. 2] EMA & brighter colors.The Moving Average Wave and Pi Line. A little boredom led me to brighten the colors a bit and try out EMA instead of SMA, which I think produces a better wave. Enjoy
Fibonacci WavesFirst of all, ignore all other lines in the example chart except the four FAT lines. The four fat lines are the ones that define the fibonacci price leves. The lines have different extension offset to the right. The shortest one is the end of the second wave ( or leg B ), the next one is the end of C, the one following that is the end of D and the final one is the end of the final leg E.
The two input parameters is the start of A and the end of A.
If the start of A is larger than then end of A, the calculated series is a downward trend, else it is an upward trend.
Calculation based on old EWT simple wave expansion by fibonacci sequence.
0.618, 1.618, 0.382
Based on this source:
www.ino.com
Best Regards,
/Hull, 2015.05.20.15:50 ( placera.se )

Momentogram - WaveThis is another way you can plot the Momentum Histograms. This can be manipulated to Wave A, B, C from trade the market.
TTM WAVES - if you can manipulate the settings, this will work. 100%
List of All my Indicators - www.tradingview.com

VMMA Wave Edges [MTF]The VMMA Wave Edges is a multi-timeframe (MTF) overlay indicator that plots dynamic upper and lower edges formed by a band of Volume-Weighted Moving Averages (VWMAs) of varying lengths. It computes N VWMAs with lengths increasing arithmetically from start_len by incr, then plots:The maximum of all VWMAs → Upper Edge
The minimum of all VWMAs → Lower Edge
These edges are calculated on a higher timeframe (mtf_tf) and projected onto the current chart, creating a smooth, volume-sensitive envelope that adapts to volatility and trend strength.Use & InterpretationFeature
Purpose
Upper Edge
Dynamic resistance zone; price often reacts when approaching or breaking above.
Lower Edge
Dynamic support zone; price tends to bounce or consolidate near it.
Edge Contraction
Low volatility → potential breakout setup.
Edge Expansion
High volatility → trend continuation or exhaustion.
MTF Projection
Avoids repainting & noise by using cleaner higher-timeframe data.
Trading ApplicationsMean ReversionBuy near Lower Edge, sell near Upper Edge (especially in ranging markets).
Breakout ConfirmationPrice closing above Upper Edge on MTF → bullish breakout.
Below Lower Edge → bearish.
Trend FilterIn uptrend: price above Upper Edge → strong momentum.
In downtrend: price below Lower Edge → strong bearish control.
Support/Resistance FlipBroken Upper Edge → becomes future support (and vice versa).

Elliott Wave Probability System Pro v2🎯 Major Improvements Made to Elliott Wave Script
Key Changes:
1. Advanced Trend Detection (Lines 55-82)
Uses 5 different methods to determine trend over last 75 bars:
Price position in range
Linear regression slope
Moving average alignment
Higher highs/lows pattern
Up vs down bar count
Combines all methods into a trendScore for accurate direction
2. Adaptive Target Direction
New input: adaptiveTargets (line 28) - can toggle on/off
When ON: Targets follow the 75-bar trend regardless of short-term indicators
When OFF: Works like original (based on current momentum)
3. Improved Target Calculation
Bullish targets use extensions from current price to recent high
Bearish targets use retracements from current price to recent low
More realistic price levels based on actual market structure
4. Enhanced Status Display
Added "Trend (75 bars)" row showing BULLISH/BEARISH/NEUTRAL
Helps you see why targets are pointing a certain direction
5. Better Probability Calculation
Base probability adjusts with trend strength (70% if strong trend, 50% if not)
Gradual probability decay with distance
Minimum 15% probability (more realistic than 10%)
New Features:
Trend-Based Alerts
Alerts when 75-bar trend changes from bullish to bearish (or vice versa)
Trend Weight in Scoring
Added trendWeight to the total score calculation
Makes signals more aligned with larger trend
Visual Improvements
Projection lines now show at 40% probability (was 50%)
Better visibility of likely targets
How It Works Now:
If last 75 bars show a downtrend , targets will be bearish (even if RSI is oversold)
If last 75 bars show an uptrend , targets will be bullish (even if RSI is overbought)
The probability adjusts based on trend strength
This solves the issue where the script was showing bullish targets in a clear downtrend. Now it properly reflects the dominant trend direction while still considering short-term indicators for probability calculations.

Fractal Wave MarkerFractal Wave Marker is an indicator that processes relative extremes of fluctuating prices within 2 periodical aspects. The special labeling system detects and visually marks multi-scale turning points, letting you visualize fractal echoes within unfolding cycles dynamically.
What This Indicator Does
Identifies major and minor swing highs/lows based on adjustable period.
Uses Phi in power exponent to compute a higher-degree swing filter.
Labels of higher degree appear only after confirmed base swings — no phantom levels, no hindsight bias. What you see is what the market has validated.
Swing points unfold in a structured, alternating rhythm . No two consecutive pivots share the same hierarchical degree!
Inspired by the Fractal Market Hypothesis, this script visualizes the principle that market behavior repeats across time scales, revealing structured narrative of "random walk". This inherent sequencing ensures fractal consistency across timeframes. "Fractal echoes" demonstrate how smaller price swings can proportionally mirror larger ones in both structure and timing, allowing traders to anticipate movements by recursive patterns. Cycle Transitions highlight critical inflection points where minor pivots flip polarity such as a series of lower highs progress into higher highs—signaling the birth of a new macro trend. A dense dense clusters of swing points can indicate Liquidity Zones, acting as footprints of institutional accumulation or distribution where price action validates supply and demand imbalances.
Visualization of nested cycles within macro trend anchors - a main feature specifically designed for the chartists who prioritize working with complex wave oscillations their analysis.

Wave N + KDJ + Volumi + SMC + IchimokuWave N + KDJ + Volume + SMC + Ichimoku Indicator
Overview
This script is a multi-layered technical indicator designed to provide traders with enhanced market insights by combining five key methodologies:
• Wave N Pattern (Price Action)
• KDJ Oscillator (Momentum)
• Volume Filtering (Confirmation)
• Smart Money Concepts (Order Blocks) (Institutional Activity)
• Ichimoku Cloud (Trend and Support/Resistance)
By integrating these components, the indicator identifies high-probability trading signals, early warnings of trend shifts, and institutional price zones to improve decision-making in volatile markets.
⸻
How It Works
1️⃣ Wave N Pattern (Price Action Structure)
The Wave N pattern is a classic price action formation that helps spot potential trend reversals and continuations:
• A Bullish Wave N is detected when a higher low and a higher high structure appears.
• A Bearish Wave N is detected when a lower high and a lower low structure forms.
2️⃣ KDJ Oscillator (Momentum & Trend Strength)
The KDJ Indicator is a variation of the Stochastic Oscillator that adds a third line, J, to amplify sensitivity to trend movements.
• J > 50 indicates bullish momentum.
• J < 50 indicates bearish momentum.
• The script includes an early warning signal when J crosses 50, suggesting a possible trend shift.
3️⃣ Volume Filtering (Trade Confirmation)
To avoid false signals, the script integrates volume confirmation:
• A signal is valid only if the volume is above the 20-period EMA of volume.
• This ensures that trade signals are supported by strong market participation.
4️⃣ Smart Money Concepts (Order Blocks)
Order Blocks represent areas of institutional interest, where large traders accumulate or distribute positions.
• The script detects bullish order blocks (potential support) and bearish order blocks (potential resistance).
• These areas help identify optimal entry and exit points.
5️⃣ Ichimoku Cloud (Trend & Dynamic Support/Resistance)
The Ichimoku Cloud is used to confirm trend direction:
• Baseline (Kijun-sen) acts as a key trend filter.
• Senkou Span A & B form the cloud (Kumo), indicating dynamic support/resistance.
• Buy signals require price to be above the baseline, while sell signals require price to be below the baseline.
⸻
Trading Signals & Visual Elements
✅ BUY Signal (Green Arrow)
Occurs when:
• A Bullish Wave N forms
• J > 50 (Bullish KDJ Signal)
• Volume is above EMA threshold
• Price is above the Ichimoku Baseline
❌ SELL Signal (Red Arrow)
Occurs when:
• A Bearish Wave N forms
• J < 50 (Bearish KDJ Signal)
• Volume is above EMA threshold
• Price is below the Ichimoku Baseline
⚠️ Early Warning (Trend Shift Signal)
• An early warning appears when J crosses 50, indicating a possible upcoming trend shift.
• The line color changes based on the potential move:
• Green/Blue → Possible Uptrend
• Red/Orange → Possible Downtrend
⸻
Why This Indicator is Unique?
Unlike simple trend-following indicators, this script:
• Combines Price Action, Momentum, Volume, and Institutional Order Flow for a multi-dimensional approach.
• Filters out weak signals using volume confirmation and Ichimoku.
• Provides early warnings before major trend shifts.
• Visualizes Smart Money Order Blocks, giving traders an edge in spotting institutional zones.
⸻
Best Timeframes & Markets
📊 Recommended Timeframes:
• 1H & 1D (works best on medium/long-term trends)
💹 Markets:
• Crypto, Forex, and Stocks
This indicator is designed for traders who value confluence and strong confirmation in their strategies. Whether you are a trend trader, swing trader, or institutional flow analyst, this tool can help refine your decision-making process.
🚀 Optimize your trades with Wave N + KDJ + Volume + SMC + Ichimoku! 🚀

Wave Trend -V2Wave Trend -V2 is here to give you a serious edge.
This upgraded version of the popular LazyBear script takes wave trend analysis to the next level.
Here's the deal:
Multi-Timeframe Analysis: Beyond Short-Term Noise:
Novice traders often focus solely on the current timeframe (let's say, the 5-minute chart).
Wave Trend -V2 breaks free from this limitation by analyzing price action across multiple timeframes (1-minute to 1-week).
---This holistic view helps you:
Identify larger trends: Are we in a bullish uptrend on the daily chart, even if the hourly chart is showing some short-term weakness? Wave Trend -V2 helps you see the bigger picture.
Avoid false breakouts: Short-term price spikes can create false signals. By looking at higher timeframes, you can filter out these "noise" and focus on sustainable trends.
---Pressure Analysis: Gauging Market Strength:
Wave Trend -V2 goes beyond simple trend identification.
It incorporates "pressure" analysis to gauge the strength and direction of the current market trend.
This helps you:
Enter trades with confidence: When the trend is strong and the pressure is high, you can enter trades with greater conviction.
Minimize risk: If the pressure is waning or conflicting signals arise, you can avoid entering trades or adjust your risk parameters accordingly.
Impact Point Analysis: Predicting Future Price Moves:
Wave Trend -V2 analyzes the price impact of the last four wave trend crossovers.
Let's say the last impact point was "X", the previous one "X-1", the one before that "X-2", and so on.
The indicator calculates the average price movement between these points using the following simplified formula:
Average Impact = (X - X-1) + (X-1 - X-2) + (X-2 - X-3) / 3
This average provides a valuable estimate of the potential price movement of the next crossover.
Multiple Take Profit Levels: Setting Strategic Targets:
Wave Trend -V2 offers three dynamic take profit levels (TP1, TP2, TP3).
TP1: Based on the estimated average impact.
TP2: Twice the estimated average impact.
TP3: Three times the estimated average impact.
This allows you to set your profit targets strategically, maximizing potential gains while managing risk effectively.
Why don't use the Estmated impact point to stop the trade?
In order to eliminated the WHIPSAW effect! There is no other way...
Wave Trend -V2 is designed for traders who seek a deeper understanding of trend dynamics and desire a more sophisticated approach to trading. By combining multi-timeframe analysis, pressure assessment, and advanced impact point calculations, this indicator empowers you to make more informed trading decisions and potentially improve your trading outcomes.
The indicator work best with combination of other trend type indicators.
Please dont forget that indicators are not miracle medicines , it cannot give you exact results , market was always volative , use at your own discretion.
Jason's Simple Moving Averages WaveUnderstanding the Script:
Purpose: This script identifies potential trend direction and momentum using a moving average and wave amplitude calculation. It shows a green line when the price is trending upwards and a red line when trending downwards.
Strategy: This script doesn't provide a complete trading strategy. It's an indicator designed to be used alongside other tools.
Parameters: You can adjust the "Moving Average Length" input to change the sensitivity of the indicator. A shorter length will react quicker to price changes, while a longer length will be smoother but less responsive.
How to Use it:
Load the Script: In TradingView, navigate to the indicator creation section and paste the provided script code.
Adjust Parameters: Set the "Moving Average Length" based on your preferred timeframe and trading style.
Combine with Other Tools: Use the indicator along with other technical indicators or price action analysis to confirm potential entry and exit points for trades.
Here are some additional points to consider:
Crossovers: You could look for buy signals when the price crosses above the green line and sell signals when it crosses below the red line. However, these can be prone to false signals.
Divergence: Look for divergences between the price movement and the wave indicator. For example, a rising price with a falling wave could indicate overbought conditions and a potential reversal.
Confirmation: Don't rely solely on this indicator. Use it alongside other confirmations from price action, volume analysis, or other indicators to identify higher probability trades.
Important Note:
