ZigZag Smart Trend [TradingFinder] Major & Minor Structured Wave🔵 Introduction
🟣 Zigzag
Zigzag is a lagging indicator; this indicator identifies points on a price chart that have more significant changes than its previous wave and then by connecting these lines to each other, it assists traders in trend detection.
This indicator reduces random price fluctuations and attempts to make the primary price trend clearer.
🟣 Pivot
Pivots are points where the price chart changes direction. Pivots, also called reversal points, form when supply and demand forces dominate one another.
Different types of technical analysis pivots can be introduced into two categories, minor pivots, and major pivots, each of which has a specific meaning in analysis.
Major Pivot : These pivots actually indicate major changes in the direction of the chart and occur at the end of trends. Analysts seeking to reach the primary analysis focus more on major pivot points. In fact, most technical analysis tools are examined and determined based on major pivots.
Minor Pivot : This type of pivot focuses more on small and subsidiary points and directions. Therefore, it occurs at the end of corrections. Analysts focusing on minor pivots represent small trends, and it should be noted that minor pivots are not suitable for use in primary technical tools.
How to identify minor and major pivots :
Minor pivots are pivots formed between two major pivots and fail to break the opposite major pivot.
Major pivots are pivots that have either successfully broken the opposite pivot or have moved more than the previous pivot of the same type.
🔵 How to use
Based on identifying pivots and drawing zigzag lines, you can have various uses for this indicator.
Identifying support and resistance levels :
Identifying Elliott Waves :
Identifying classic patterns :
Identifying pivots with higher validity :
Identifying internal and external breakouts :
Identifying trends and range areas :
Identifying pivot types along with major and minor recognition :
MHH : Major Higher High
MLH : Major Lower High
MLL : Major Lower Low
MHL : Major Higher Low
mHH : Minor Higher High
mLH : Minor Lower High
mLL : Minor Lower Low
mHL : Minor Higher Low
🔵 Settings
Pivot Period Zigzag Line : Using this input, you can determine the pivot period for identifying zigzag swings.
Show Zigzag Line : To show or not to show the zigzag line.
Zigzag Line Color : Change the color of the zigzag line.
Zigzag Line Style : Change the Style of the zigzag line.
Zigzag Line Width : Change the Width of the zigzag line.
Show Label : To show or not to show Pivot Type.
Color Label : Change the color of the Pivot Type Label.
Cari dalam skrip untuk "wave"

Hull WavesThe Hull Waves indicator is based on the Hull Moving Averages (HMA), which are special moving averages that stand out for their ability to filter out market noise and offer a clearer view of price trends. Compared to traditional moving averages, HMAs are more responsive yet smoother, allowing traders to capture significant price movements without getting overwhelmed by short-term fluctuations.
The HMAs integrated into Hull Waves provide two distinct perspectives on the price trend:
8-period HMA: This short-term HMA is extremely reactive and closely follows price changes. It is ideal for capturing short-term trading signals while the medium-term 21-period HMA offers a more balanced view of price trends and identifies medium-term trends.
By crossing HMAs, traders can efficiently identify trend reversal points or strong market continuations.
Another feature of the indicator is the “fan” of dynamic lines, which acts as a visual float for price candles, allowing traders to quickly evaluate trading opportunities.
The "fan" or float of dynamic lines represents a visual representation of the candle's price movements. These lines extend from the start point to the end point, like an open fan. This visual approach makes the market dynamics immediately evident.
Strategy:
Long Entry Signal (Buy):
When the Hull Waves range shows a series of upward sloping lines and the Hull Moving Averages (e.g. 8-period HMA) crosses the 21-period HMA upwards, it is a long entry signal.
Confirmation of the signal can come from an increase in trader volume or other supporting indicators.
Place a buy order at the next closing price.
Short Entry Signal (Sell):
When the Hull Waves range shows a series of downward sloping lines and the Hull Moving Averages (e.g. 8-period HMA) crosses the 21-period HMA downward, it is a short entry signal.
Confirm the signal with an increase in trader volume or other relevant indicators.
Place a sell order at the next closing price.
Exit Signal (Closing a Position):
To close a long position, wait for a signal reversal, such as the Hull Moving Averages crossing downwards or a change in the Hull Waves range.
To close a short position, wait for a signal reversal, such as the Hull Moving Averages crossing higher or a change in the Hull Waves range.

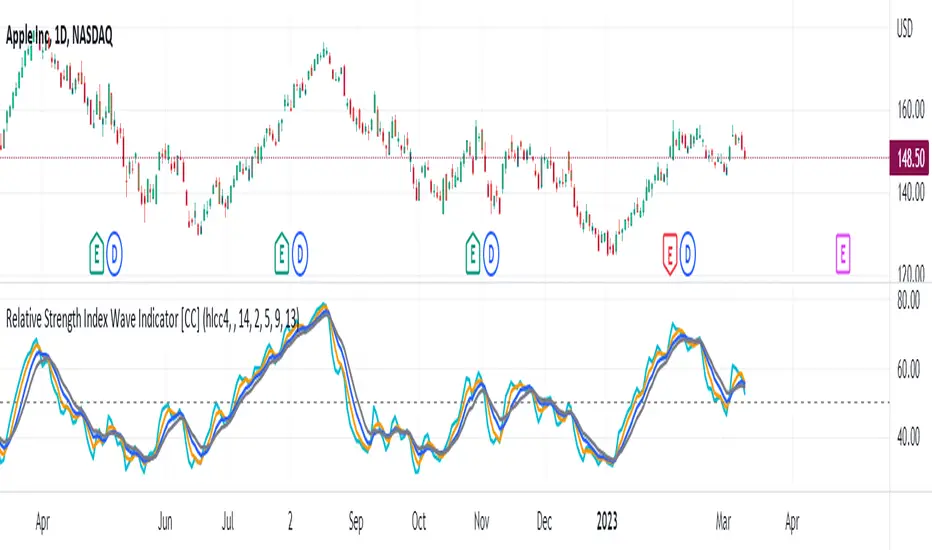
Relative Strength Index Wave Indicator [CC]The Relative Strength Index Wave Indicator was created by Constance Brown (Technical Analysis for the Trading Professional), and this is a unique indicator that uses the weighted close formula, but instead of using the typical price values, it uses the RSI calculated from the various prices. It then creates a rainbow by smoothing the weighted RSI with four different lengths. As far as the buy or sell signals with this indicator go, I did change things from the original source, so feel free to experiment and let me know if anything works better for you. I decided to do a variation of the original source and create buy and sell signals based on crossovers, but my version only uses the first and second smoothed RSI lines. You could also average all of the lines and buy when the average is rising and sell when it starts to fall. I have used my typical buy and sell signals to use darker colors for strong signals and lighter colors for normal signals. Because of the rainbow effect from the wave, the color changes will only appear for the bar itself when you enable that setting.
Let me know if there is any other script you would like to see me publish! I will have plenty more RSI scripts to publish in the next week. Let me know if you like this indicator series.
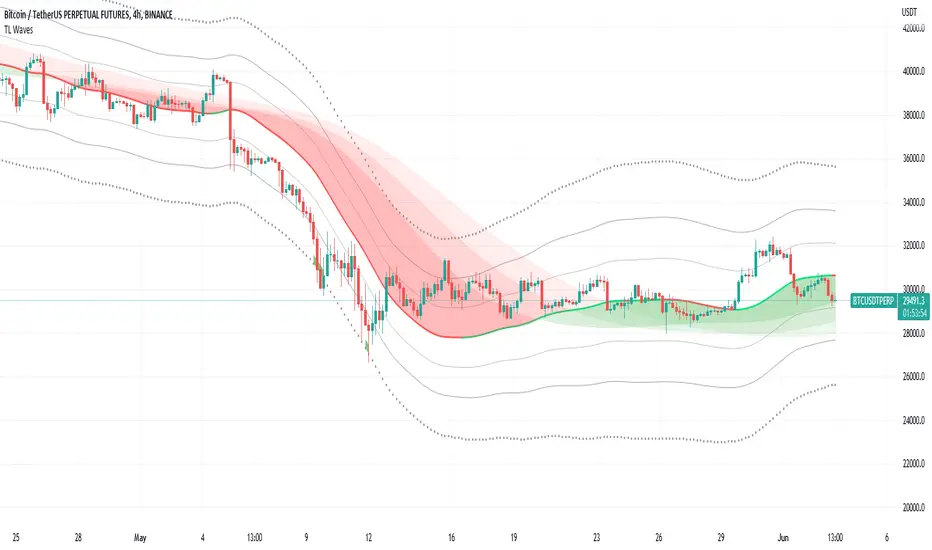
TL WavesI created this indicator inspired by the miyuki waves indicator by eto_miyuki. In my indicator we have 17 types of moving averages which can be selected in the settings.
It is a trend indicator, the base of the wave is a moving average and 4 Average True Range (ATR) Bands derived from the baseline are formed.
There are also 3 moving averages in a guppy style, these 3 moving averages can also be configured.
The moving average options are:
SMA ---> Simple
WMA ---> Weighted
VWMA ---> Volume Weighted
EMA ---> Exponential
DEMA ---> Double EMA
ALMA ---> Arnaud Legoux
HMA ---> Hull MA
SMMA ---> Smoothed
LSMA ---> Least Squares
KAMA ---> Kaufman Adaptive
TEMA ---> Triple EMA
ZLEMA ---> Zero Lag
FRAMA ---> Fractal Adaptive
VIDYA ---> Variable Index Dynamic Average
JMA ---> Jurik Moving Average
T3 ---> Tillson
TRIMA ---> Triangular
All settings are available for changing inputs.
Chirped Sine Wave GeneratorINTRODUCTION:
The title pretty much sums up what this tool is, but not what it's for. It's NOT an indicator, just a chirped sine wave generator intended as a developer tool. Basically it sweeps from a very high frequency near the "Nyquist frequency" by chosen starting, step, and repetition rates to an ever decreasing lower frequency. This is typically viewed best on ALL, 5Y, or 1Y charts starting at bar_index==0 onward. Also, with the chart interval being intraday, you may use (ALT + SHIFT + ◀) keyboard shortcuts to jump back to barstate.isfirst. I will say, to witness a much broader scope of the sweep, having 4K is better for viewing it with the highest detailed resolution when making comparisons.
VISUAL AIDS:
When a frequency steps to another frequency a label displays the cycle period of the new frequency. This may be disabled to remove it's obstruction of view when overlaying indicators on top of it. I also included RMS levels that may be enabled.
USAGE:
As you can see above, I sourced TV built-in indicators to the "cSine Wave" plot, having varying results across the varying frequencies generated. Oscillating indicators and filters (ema, sma, etc...) of all sorts can be applied to it to inspect lag, amplitudes, or anomalies that render across the flux on the sweeping sine wave. Keep in mind market data has near infinite frequencies existing at any given time that can pop up or disappear instantly, so performance in theory on this swept synthetic waveform does not equate to performance on ANY ticker. It's gives you "ONE" totally different perspective to evaluate novel indicators.
OBSERVATIONS:
Witnessing the antiquated RSI on higher short frequencies, you will see it has a few issues, hmm. The amplitude is clamped near 50 at the Nyquist frequency growing with increasing amplitude in a funnel like shape. That doesn't imply it's a bad indicator, only there could be room for improvements... potentially. Wilder was calculating the RSI on paper basically, and the calculations were made as simple as possible in late 1970's. With advances in modern computing, many exotic permutations of RSI now exist attempting to improve upon it's original characteristics. EMA sourced to this tool appears in similar fashion to the RSI with it's own peculiarities. I suspect this occurs because EMA and RSI both use an IIR filter. CCI has a better representation across the spectral flux in this case, but that doesn't imply it's a perfect indicator on market data either. CCI could be improved as well...
REVELATIONS:
The chirped sine wave is only revealing a partial story about RSI's, EMA's, and CCI's attributes. In conclusion, how various frequencies affect our indicators, can be a bit more visually obvious using this tool, but it doesn't reveal all. For example, a 3D-RSI tells a different story when viewed in that perspective. Using a chirped sine wave, observations of ringing, weird frequency excitations, or no plot (na) may elude to more serious issues with an algorithm. In many cases, I often move the testing indicator pane to overlay the chirped sine wave pane for a more direct and precise inspection on 4K. I hope that gives you a better idea of this developer tool's intention and it's potentially limited but profound usage. I will be employing this upon nearly indicator fit for evaluation that I can utilize, upgrade, or invent in the future...

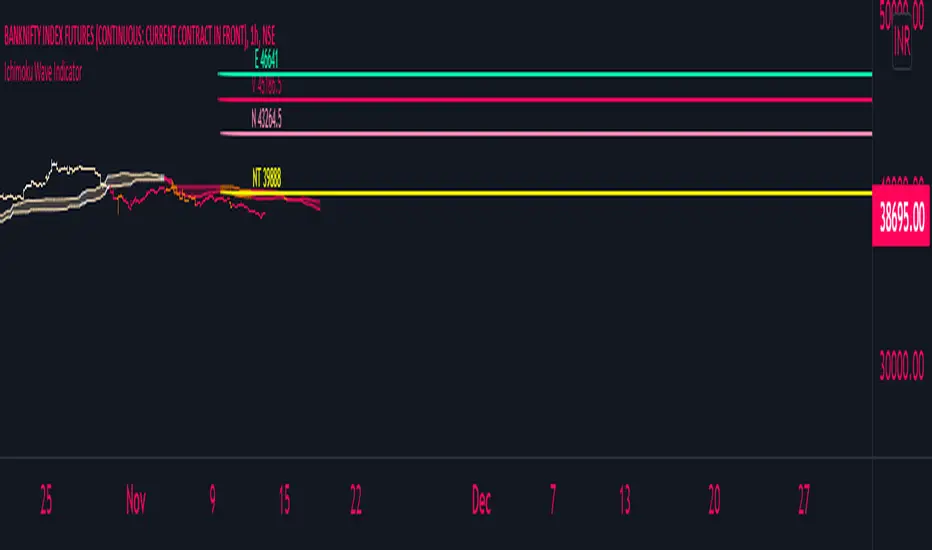
Ichimoku with Waves Created in 1940's by Goichi Hosoda withe the help of University students in Japan.
Ichimoku is one of the best trend following indicators that works nearly perfect in all markets and time frames.
Fill price in setup of indicator and you will find potential target zone of the wave
Volume Pump WaveThis indicator displays volume as a pump wave. Can be useful for chart analysis and easy detection of anomalies/trends.

Technical Ratings Pro - Pump WaveThis script uses the built in Technical Ratings indicator but interprets the data visually. It plots the results for "total", "MA" and "other" as pump waves. It uses MA to plot a trend line (can be turned off in settings) . Candles are colored to the rating strength and a percentage number was added to the results. For more informations on the Technical Ratings indicator please refer to official documentation.

Function Square WaveThis is a script to draw a square wave on the chart, with an indicator for current price.
Markets undergoing Dow Jones or Wyckoff Accumulation/Distribution cycles tend to move in such waves, and if the period of the cycles are detected, a signal for accumulation/distribution phases can be created as an early warning.
Useful inputs:
- Average True Range as the wave height.
- Assumed Wave period as the wave duration.
I divided the current price wave by 2 to make the indicator more visually friendly.
GLHF
- DPT

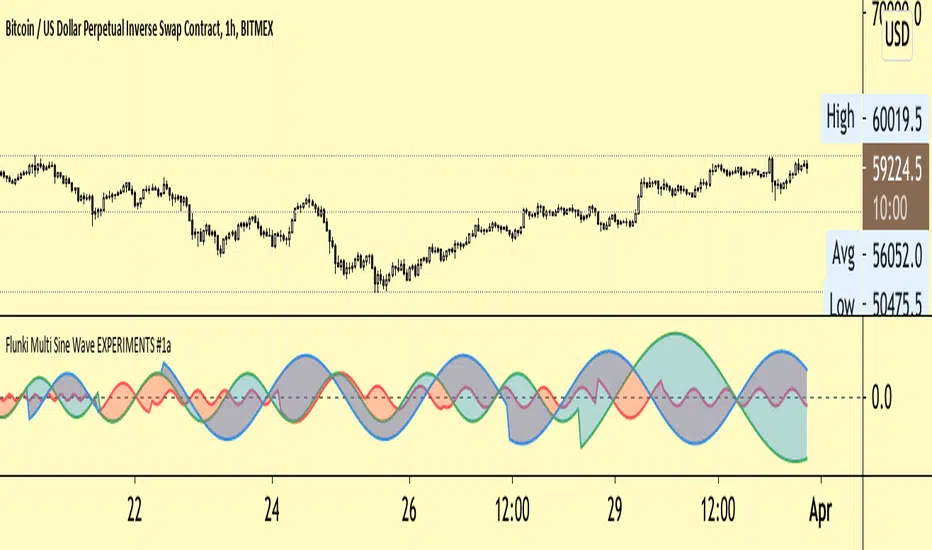
Flunki Multi Sine Wave EXPERIMENTS #1a** EXPERIMENTAL **
Herewith further sine wave experiments..
So you have 3 sine waves modulated by pivot points with look back / forward ranges
You can globally modulate the amplitude by the period, more fun than it sounds
You can flip phase individually
You can adjust offset individually
There is a global offset and a global period multiplier
See what you want to see !
Enjoy
ps. published this at xmas but it got kicked back by the mods for reasons
Dual Weis Wave VolumeIt took but left, a Weis wave volume that shows the main wave and the fractal wave, thinking of everyone who wants to save space with indicators, you can adjust 2 indicators within 1, it is the dual indicator.
This indicator calculates the volume waves, being created initially by David Weis, largely behind the wyckoff method that unfortunately died, being very useful in reading flow, replacing even Times in Trades in Tape Reading, since he makes the information more accurate visually.
The novelty is the addition of a fractal flow, that is, if the main one misses an information, the fractal will show, in addition to saving space to add another indicator and not the same with other values.

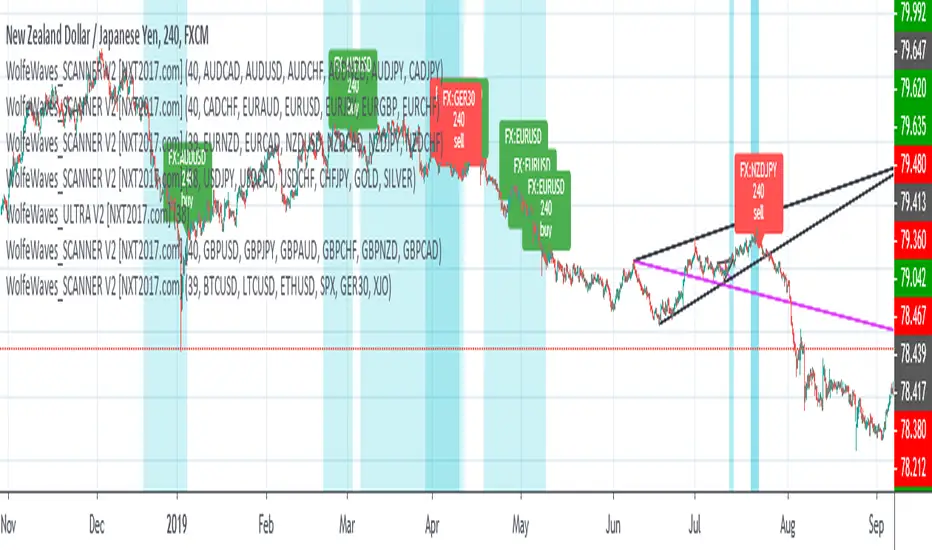
WolfeWaves SCANNER V2 - Market Scanner for Wolfe Wave Pattern
HI BIG PLAYERS AROUND THE WORLD,
this script allow to find Wolfe Wave Pattern in any market at the same time. One indicator can scan 6 markets/symbols - what ever you choose. For more markets you have to take the indicator more then once in your chart (look on my posting chart above).
Parallel the indicator gives signals as soon as Wolfe Waves are near finish pattern on point 5. In the default settings, the signals are displayed with a blue background on the chart. The markets with Wolfe Waves can you then read on the label in your chart.
The timeframe you currently has open is also the timeframe where the market scanner analyze the other markets / symbols in the background.
WolfeWaves SCANNER V2 is offered for sale. More information can be found below in the signature.
However, anyone can test this indicator for once without any registration in a 3 day trial. You can request access with a simple message to me.
Another trial of 7 days is included in the offer on my website - before the first payment will done.
When testing, please check whether your system requirements are sufficient. The many labels require a lot of memory from your computer.
For more great indicators everyone is invited to follow me on TradingView.
Kind regards
NXT2017
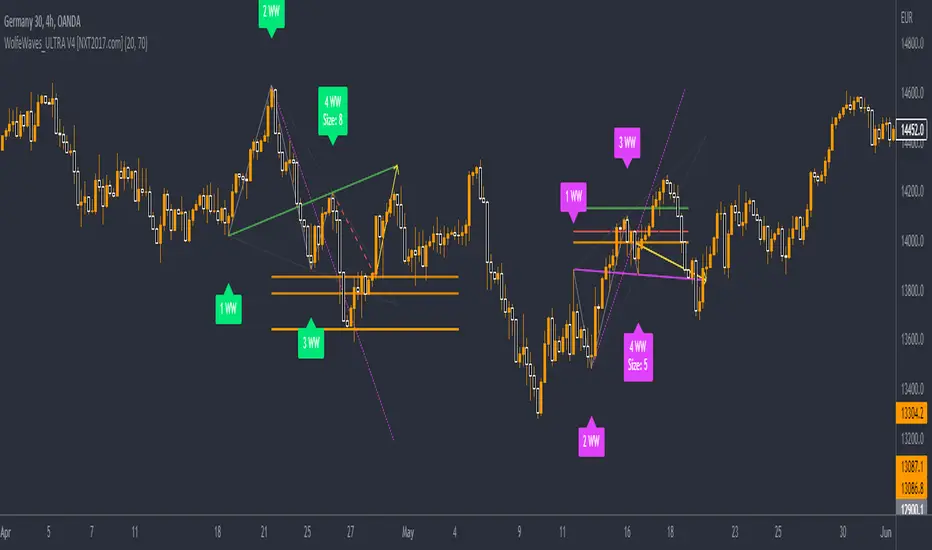
WolfeWaves_ULTRA V2 - Wolfe Wave auto lines drawing incl. SignalHI BIG PLAYERS AROUND THE WORLD,
this script allow to draw automatically lines of Wolfe Wave pattern.
Parallel to the automatic drawing, the indicator can give signals as soon as the 5 point of the Wolfe wave is immediately reached or has been reached. This allows the indicator WolfeWaves_ULTRA V2 to give early signals. In the default settings, the signals are displayed with a blue background on the chart.
WolfeWaves_ULTRA V2 is offered for sale. More information can be found below in the signature.
However, anyone can test this indicator for once without any registration in a 3 day trial. You can request access with a simple message to me.
Another trial of 7 days is included in the offer on my website - before the first payment will done.
In the settings it is possible to change the degree of details. This is sometimes necessary because TradingView limited only 55 lines per indicator in Pinescript Version 4.
In extreme cases it is therefore possible to change the settings that the Wolfe Wave pattern represent waves only from 3 lines. This allows the indicator to detect far more wolf waves on the same chart.
For more great indicators everyone is invited to follow me on TradingView.
Kind regards
NXT2017

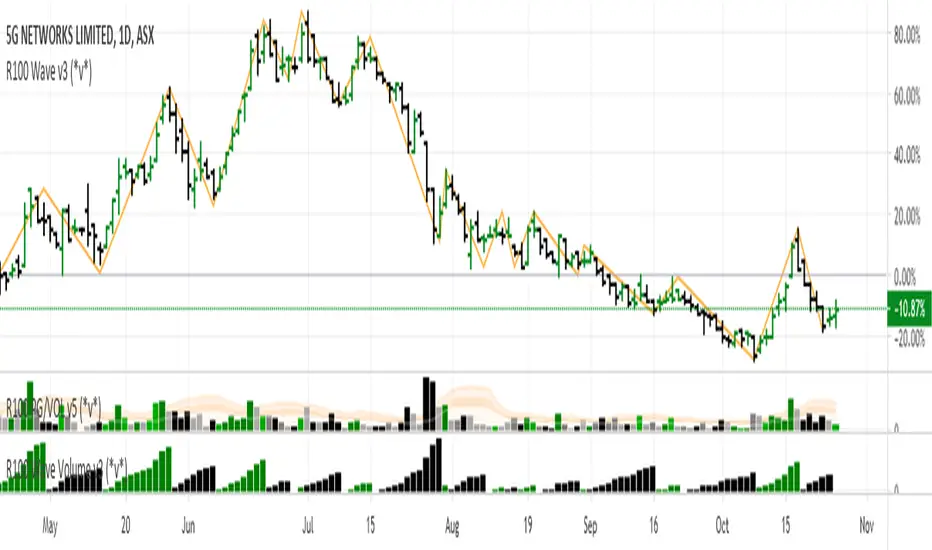
R100 Wave Volume v2 (*v*)This indicator is similar to the Weis Wave Volume indicator in that it shows cumulative volume for each up and down price wave. However it is calculated differently, using the Jurik moving average to determine turning points. Use this in conjunction with the R100 Wave indicator to determine the best fit Jurik length and power settings.
A great indicator to help analyse the strength of pullbacks, continuation moves and changes in behaviour.
I hope you get some value out of it. Only conditions of use are that if you improve it, let me know and if you publish something that uses it, don't hide the code! Enjoy!
Code pinched and modified from Zero Lag ZigZag by Duyck - thankyou
Jurik Moving Average (for turning points) by Everget - thankyou
and Weis Wave by Modhelius - thankyou
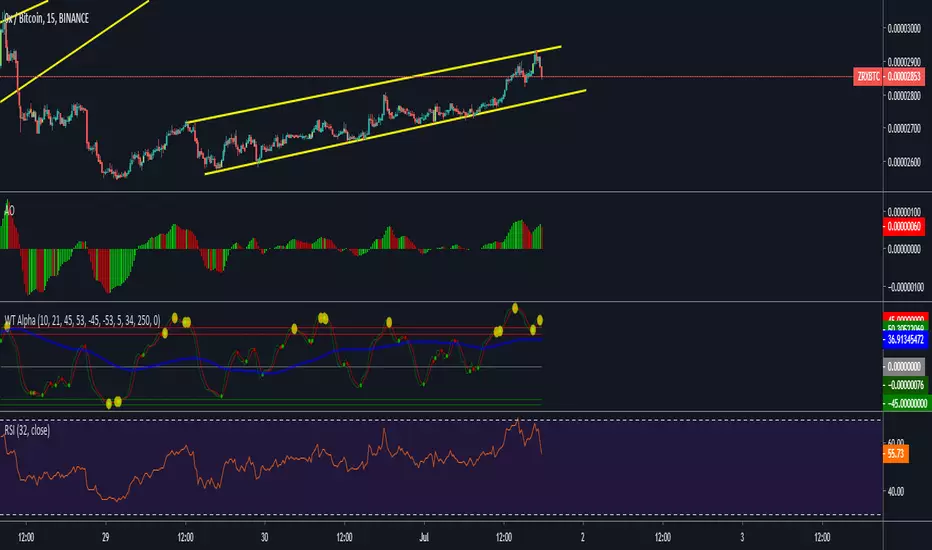
WaveTrend + Alert + LSMA + CrossWaveTrend inspired by LazyBear's WT indicator with addition of crossing dots, crossing alert and LSMA


Wave Volume OverlayWaves of price action are created based on periods of sustained direction volume. This indicator allows you to see the rating of volume in each of these waves relative to others.

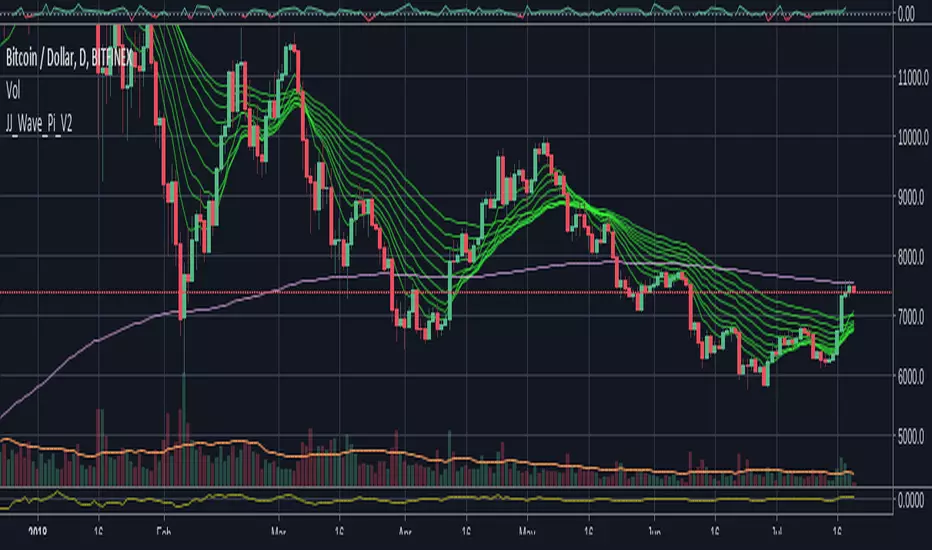
Jason Jenkins Wave plus Pi [Ver. 2] EMA & brighter colors.The Moving Average Wave and Pi Line. A little boredom led me to brighten the colors a bit and try out EMA instead of SMA, which I think produces a better wave. Enjoy
Fibonacci WavesFirst of all, ignore all other lines in the example chart except the four FAT lines. The four fat lines are the ones that define the fibonacci price leves. The lines have different extension offset to the right. The shortest one is the end of the second wave ( or leg B ), the next one is the end of C, the one following that is the end of D and the final one is the end of the final leg E.
The two input parameters is the start of A and the end of A.
If the start of A is larger than then end of A, the calculated series is a downward trend, else it is an upward trend.
Calculation based on old EWT simple wave expansion by fibonacci sequence.
0.618, 1.618, 0.382
Based on this source:
www.ino.com
Best Regards,
/Hull, 2015.05.20.15:50 ( placera.se )

Momentogram - WaveThis is another way you can plot the Momentum Histograms. This can be manipulated to Wave A, B, C from trade the market.
TTM WAVES - if you can manipulate the settings, this will work. 100%
List of All my Indicators - www.tradingview.com
