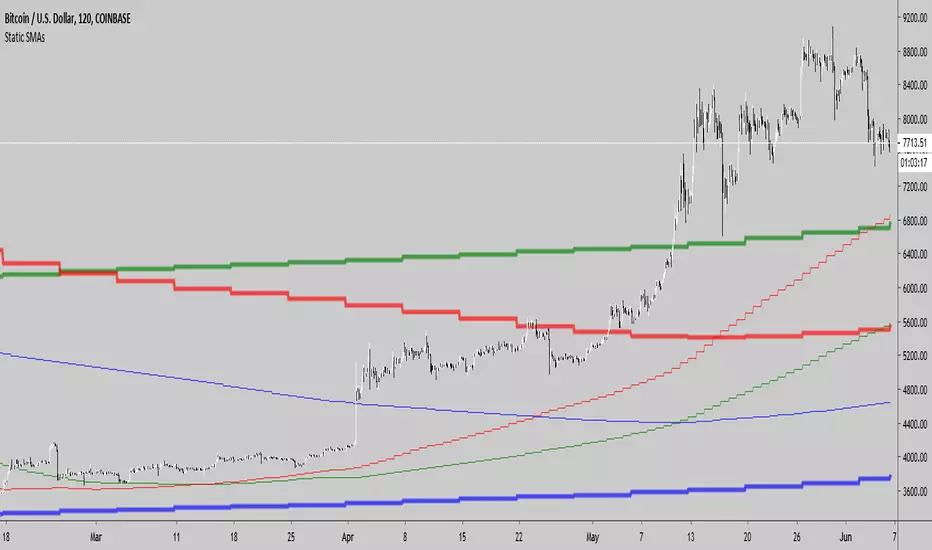
Weekly and Daily SMAs on any timeframeThis script just plots the weekly and daily SMAs on any timeframe. I'd imagine most traders already have this or something like this available to them, but I couldn't find a way to cross the timeframe barrier on a single graph, so I did this. It ain't pretty, but it's accurate.
Cari dalam skrip untuk "weekly"
Weekly FibonacciThis indicator displays the Fibonacci ratio using high and low prices of previous week
Bold dotted lines is high and low prices
The other dotted lines is the level values you can set.
You can use Fibonacci strategies with this indicator.
This indicator can be set to any of 19 values.
My youtube Chaneel

weekly-vwapAuthor: Andrew Palladino
Date: 1/12/2016
Description: Volume Weighted Moving Average calculated weekly on the start of a specified week day. Default is set to Sunday.
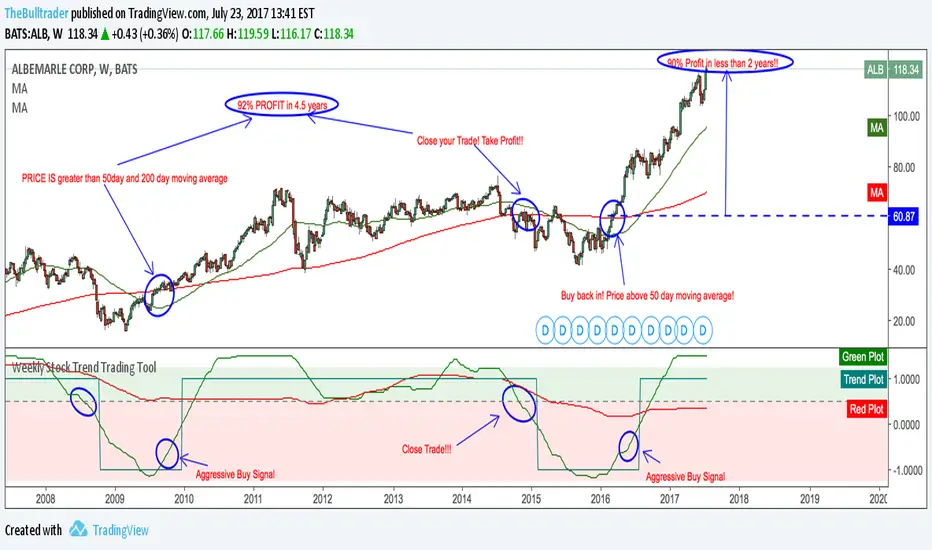
Weekly Stock Trend Trading Tool// Created by TheBullTrader, 2017.
// Hi everyone, welcome to my Weekly Trend Trading Tool with the 50 day and 200 day moving averages
// This indicator scores each stock/ index individually and scores them on a simple scale -1.5 to +1.5
// This indicator has 2 zones: green zone = bullish, and red zone = bearish
// There are 3 plots: green = 50 day sma, red = 200 day sma, and trend signal= teal
// Buying Signal is when the green plot crosses teal plot or AGGRESSIVE Buy = green plot beginning to curve up from bearish zone.
// Sell Signal is when the green plot enters the RED ZONE
// By using this indicator as described, it will help you pick stock bottoms and COULD GET YOU OUT OF A STOCK CRASH!
// Recommendations is to scan this indicator against the top 100 US stocks with a long stock history greater than 10 years.
// I usually find 5-10 really good deals every few months. Slow and Easy way to build wealth. **Thanks for reading**
Weekly closeIt turned out not to be that easy to plot the close of the previous week in hourly or daily charts. In my first experiments things went wrong on Friday or intraday if you simply use the security function. So here is the thing with an algorithm that guaranties the correct value.

TPCharts HighOfWeekShows the days on which highs and lows for a week occurred (Sunday through Saturday).
Yeah, you could download data feeds and write some Python, but not everybody wants to do that.
Usage:
Get probability on your side when entering or taking profits.
If 60% of the weekly lows are on a Tuesday, what day probably works best to buy?
Keep in mind that many altcoins have slightly different weekly patterns.
Options in settings:
1. Show each day's name in a bubble underneath.
2. Display "summary" total stats for highs / lows when over 50 SMA.
Future updates:
Handle bear markets for final stats. Currently only calculates high/lows in summary bubble when over the 50 SMA.

Intraday Quarter Points- Psychological LevelsThis template can be used for Higher Time Frame analysis in forex. Using the Bar Replay, develop a technical bias and mark psychological levels on the H4 timeframe. This can be used with Supply and demand and Quarter Points Theory.
Monthly- Default setting
Weekly- Default setting
Daily- On Sund-Mon
H4- On Sund-Mon, Show Weekly High + Low
H1- Show Quarter Points
Dynamic Levels This indicator plots key price levels (Open, High, Low, Mid, Close) from multiple higher timeframes (Monday, Daily, Weekly, Monthly, Yearly).
It allows you to track how price interacts with important reference levels without switching timeframes.
🔑 Features
✅ Monday levels (MO, MH, MM)
By default: shows the last completed Monday (fixed values).
Option: “live mode” to update Monday High/Low/Mid while Monday’s candle is forming.
✅ Daily levels (DO, DH, DL, DM, DC)
Live: Daily High/Low/Mid update dynamically while today’s candle is forming.
Previous Daily Close (DC) is always fixed.
✅ Weekly levels (WO, WH, WL, WM)
Live: Weekly High/Low/Mid update dynamically while this week’s candle is forming.
Weekly Open is fixed.
✅ Monthly levels (MO(n), MH(n-1), ML(n-1), MM(n-1), MC(n-1))
Shows last completed month’s values (constant, never changing).
Current Monthly Open is also shown (naturally fixed).
✅ Yearly levels (YO(n), YH(n-1), YL(n-1), YM(n-1), YC(n-1))
Shows last completed year’s values (constant, never changing).
Current Yearly Open is also shown (naturally fixed).
🎨 Customization
Toggle each level (on/off) in indicator settings.
Individual color settings for Monday, Daily, Weekly, Monthly, and Yearly.
Adjustable line width and transparency.
Optional short labels (MO, DO, WM, etc.) displayed on the right side of the chart.
🔄 Dynamic Logic
Daily and Weekly → update dynamically while their candle is forming.
Monday, Monthly, and Yearly → use fixed values from the last completed bar (do not “breathe”).
📌 Use cases
Quickly see where price stands relative to previous close, current open, or mid-levels.
Use Monday Open/High/Mid as strong intraday references.
Use Monthly/Yearly levels as long-term support/resistance zones.
SPX Weekly Expected Moves# SPX Weekly Expected Moves Indicator
A professional Pine Script indicator for TradingView that displays weekly expected move levels for SPX based on real options data, with integrated Fibonacci retracement analysis and intelligent alerting system.
## Overview
This indicator helps options and equity traders visualize weekly expected move ranges for the S&P 500 Index (SPX) by plotting historical and current week expected move boundaries derived from weekly options pricing. Unlike theoretical volatility calculations, this indicator uses actual market-based expected move data that you provide from options platforms.
## Key Features
### 📈 **Expected Move Visualization**
- **Historical Lines**: Display past weeks' expected moves with configurable history (10, 26, or 52 weeks)
- **Current Week Focus**: Highlighted current week with extended lines to present time
- **Friday Close Reference**: Orange baseline showing the previous Friday's close price
- **Timeframe Independent**: Works consistently across all chart timeframes (1m to 1D)
### 🎯 **Fibonacci Integration**
- **Five Fibonacci Levels**: 23.6%, 38.2%, 50%, 61.8%, 76.4% between Friday close and expected move boundaries
- **Color-Coded Levels**:
- Red: 23.6% & 76.4% (outer levels)
- Blue: 38.2% & 61.8% (golden ratio levels)
- Black: 50% (midpoint - most critical level)
- **Current Week Only**: Fibonacci levels shown only for active trading week to reduce clutter
### 📊 **Real-Time Information Table**
- **Current SPX Price**: Live market price
- **Expected Move**: ±EM value for current week
- **Previous Close**: Friday close price (baseline for calculations)
- **100% EM Levels**: Exact upper and lower boundary prices
- **Current Location**: Real-time position within the EM structure (e.g., "Above 38.2% Fib (upper zone)")
### 🚨 **Intelligent Alert System**
- **Zone-Aware Alerts**: Separate alerts for upper and lower zones
- **Key Level Breaches**: Alerts for 23.6% and 76.4% Fibonacci level crossings
- **Bar Close Based**: Alerts trigger on confirmed bar closes, not tick-by-tick
- **Customizable**: Enable/disable alerts through settings
## How It Works
### Data Input Method
The indicator uses a **manual data entry approach** where you input actual expected move values obtained from options platforms:
```pinescript
// Add entries using the options expiration Friday date
map.put(expected_moves, 20250613, 91.244) // Week ending June 13, 2025
map.put(expected_moves, 20250620, 95.150) // Week ending June 20, 2025
```
### Weekly Structure
- **Monday 9:30 AM ET**: Week begins
- **Friday 4:00 PM ET**: Week ends
- **Lines Extend**: From Monday open to Friday close (historical) or current time + 5 bars (current week)
- **Timezone Handling**: Uses "America/New_York" for proper DST handling
### Calculation Logic
1. **Base Price**: Previous Friday's SPX close price
2. **Expected Move**: Market-derived ±EM value from weekly options
3. **Upper Boundary**: Friday Close + Expected Move
4. **Lower Boundary**: Friday Close - Expected Move
5. **Fibonacci Levels**: Proportional levels between Friday close and EM boundaries
## Setup Instructions
### 1. Data Collection
Obtain weekly expected move values from options platforms such as:
- **ThinkOrSwim**: Use thinkBack feature to look up weekly expected moves
- **Tastyworks**: Check weekly options expected move data
- **CBOE**: Reference SPX weekly options data
- **Manual Calculation**: (ATM Call Premium + ATM Put Premium) × 0.85
### 2. Data Entry
After each Friday close, update the indicator with the next week's expected move:
```pinescript
// Example: On Friday June 7, 2025, add data for week ending June 13
map.put(expected_moves, 20250613, 91.244) // Actual EM value from your platform
```
### 3. Configuration
Customize the indicator through the settings panel:
#### Visual Settings
- **Show Current Week EM**: Toggle current week display
- **Show Past Weeks**: Toggle historical weeks display
- **Max Weeks History**: Choose 10, 26, or 52 weeks of history
- **Show Fibonacci Levels**: Toggle Fibonacci retracement levels
- **Label Controls**: Customize which labels to display
#### Colors
- **Current Week EM**: Default yellow for active week
- **Past Weeks EM**: Default gray for historical weeks
- **Friday Close**: Default orange for baseline
- **Fibonacci Levels**: Customizable colors for each level type
#### Alerts
- **Enable EM Breach Alerts**: Master toggle for all alerts
- **Specific Alerts**: Four alert types for Fibonacci level breaches
## Trading Applications
### Options Trading
- **Straddle/Strangle Positioning**: Visualize breakeven levels for neutral strategies
- **Directional Plays**: Assess probability of reaching target levels
- **Earnings Plays**: Compare actual vs. expected move outcomes
### Equity Trading
- **Support/Resistance**: Use EM boundaries and Fibonacci levels as key levels
- **Breakout Trading**: Monitor for moves beyond expected ranges
- **Mean Reversion**: Look for reversals at extreme Fibonacci levels
### Risk Management
- **Position Sizing**: Gauge likely price ranges for the week
- **Stop Placement**: Use Fibonacci levels for logical stop locations
- **Profit Targets**: Set targets based on EM structure probabilities
## Technical Implementation
### Performance Features
- **Memory Managed**: Configurable history limits prevent memory issues
- **Timeframe Independent**: Uses timestamp-based calculations for consistency
- **Object Management**: Automatic cleanup of drawing objects prevents duplicates
- **Error Handling**: Robust bounds checking and NA value handling
### Pine Script Best Practices
- **v6 Compliance**: Uses latest Pine Script version features
- **User Defined Types**: Structured data management with WeeklyEM type
- **Efficient Drawing**: Smart line/label creation and deletion
- **Professional Standards**: Clean code organization and comprehensive documentation
## Customization Guide
### Adding New Weeks
```pinescript
// Add after market close each Friday
map.put(expected_moves, YYYYMMDD, EM_VALUE)
```
### Color Schemes
Customize colors for different trading styles:
- **Dark Theme**: Use bright colors for visibility
- **Light Theme**: Use contrasting dark colors
- **Minimalist**: Use single color with transparency
### Label Management
Control label density:
- **Show Current Week Labels Only**: Reduce clutter for active trading
- **Show All Labels**: Full information for analysis
- **Selective Display**: Choose specific label types
## Troubleshooting
### Common Issues
1. **No Lines Appearing**: Check that expected move data is entered for current/recent weeks
2. **Wrong Time Display**: Ensure "America/New_York" timezone is properly handled
3. **Duplicate Lines**: Restart indicator if drawing objects appear duplicated
4. **Missing Fibonacci Levels**: Verify "Show Fibonacci Levels" is enabled
### Data Validation
- **Expected Move Format**: Use positive numbers (e.g., 91.244, not ±91.244)
- **Date Format**: Use YYYYMMDD format (e.g., 20250613)
- **Reasonable Values**: Verify EM values are realistic (typically 50-200 for SPX)
## Version History
### Current Version
- **Pine Script v6**: Latest version compatibility
- **Fibonacci Integration**: Five-level retracement analysis
- **Zone-Aware Alerts**: Upper/lower zone differentiation
- **Dynamic Line Management**: Smart current week extension
- **Professional UI**: Comprehensive information table
### Future Enhancements
- **Multiple Symbols**: Extend beyond SPX to other indices
- **Automated Data**: Integration with options data APIs
- **Statistical Analysis**: Success rate tracking for EM predictions
- **Additional Levels**: Custom percentage levels beyond Fibonacci
## License & Usage
This indicator is designed for educational and trading purposes. Users are responsible for:
- **Data Accuracy**: Ensuring correct expected move values
- **Risk Management**: Proper position sizing and risk controls
- **Market Understanding**: Comprehending options-based expected move concepts
## Support
For questions, issues, or feature requests related to this indicator, please refer to the code comments and documentation within the Pine Script file.
---
**Disclaimer**: This indicator is for informational purposes only. Trading involves substantial risk of loss and is not suitable for all investors. Past performance does not guarantee future results.

WON WeekliesWilliam O'Neil was a big proponent of using weekly charts, often highlighting the significance of 3 or more tight weekly closes, or a sequence of five or more consecutive up weeks. This indicator recognizes both of these conditions providing clear visual cues to signify this institutional buying activity. When three tight weekly closes or more occur a circle will be drawn around the middle close or the background will change color, depending on user preference. If five or more consecutive up weeks are detected a box is drawn around all the price action of those weeks.
User Options:
- Choose to display both or only one condition
- Customizable colors
- Define what a tight close is (default is less than 1.5%)
- Change background color or display smaller circles for 3 weeks tight
- Alerts for both
Note: 5 weekly closes wont print until the 5th weeks candle is closed.

WIB & 3WTCThis indicator plots the Weekly inside bar and 3 Weekly tight close.
i : Weekly inside bar
- : Weekly tight close
1. Weekly inside bar (WIB)
Which shows the price contraction where the current bar's range is lower than the previous bar's range
Conditions:
Current bar's low is higher than previous low and high less than the previous bar
Range of the current bar should be at least 30% less than the previous bar (Can be modified in the input settings)
Distance between Current bar's low and 50 D Simple Moving average should be at least less than 5% (Can be modified in the input settings)
sometimes low or high of current bar could be few points fluctuated from the previous so tolerance percentage has been set to 1 (Can be modified in the input settings)
Candle range should not be more than 10%. More the compression in the candle better it is for taking a position
Position:
Long could be initiate when the high of the current bar is broken
2. 3 Weeks Tight Close (3 WTC)
where the last three weeks close are within 1.5% range
Conditions:
Last three weeks close is with in 1.5% range (Can be modified in the input settings)
Position:
Long could be initiated current market price
Note: Below conditions apply for both the patterns
Close should be higher than Moving Average(40)
Volume should be less than Volume moving average(10)
Tip
Candle range is visible in the tooltip by hovering over the plots of WIB and WTC characters
Play with Indicator settings for the study purpose

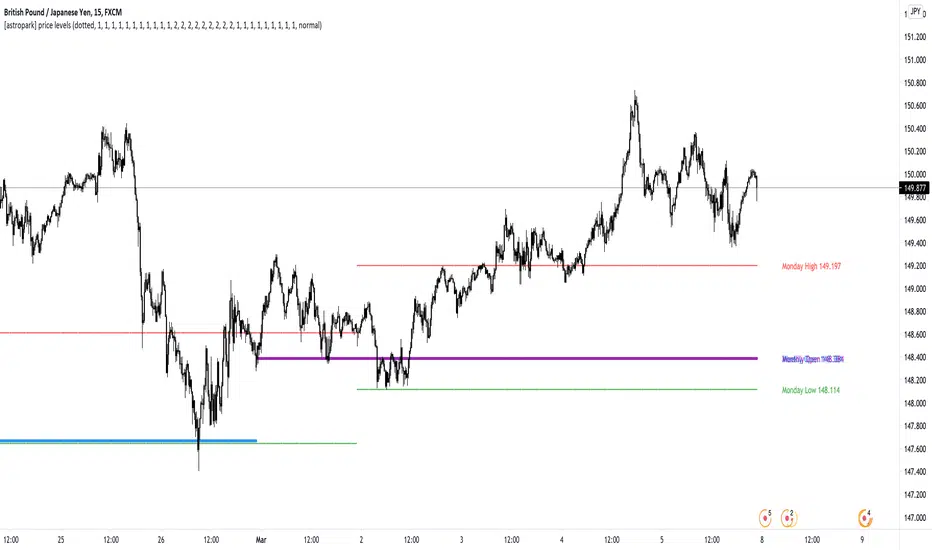
[astropark] price levelsDear Followers,
today another awesome Analysis Tool, that you can use in your trading journey: Price Levels !
Are you a range trading player? a scalper? or maybe a day-trader or a swing-trader? This is for you then. Indeed it's for everyone.
This indicator works on every timeframe, market and pair.
It keeps track of recent important levels generated by price action:
Monday high, low and middle range level
Tuesday high and low
Wednesday high and low
Thursday high and low
Friday high and low
Weekly open, high and low
Monthly open, high and low
Yearly open, high and low
Previous weekly open, high and low
Previous monthly open, high and low
Previous yearly open, high and low
You can:
choose price levels to hide and show
change each level color / thickness / display style (solid or dotted)
choose to show or hide price labels and change their size
Why such indicator should be helpful? How can I use it to do profit?
In multiple ways! Let's talk about Monday Range :
when Monday range is formed, price acceptance below Monday low is a bearish signal, so will more likely want to short / sell
equally price acceptance above Monday high is a bullish signal, so will more likely want to long / buy
it can happen that Monday high is simply retested, with price not being able to stay above it: this is called a retest (in case of a simple wick) or a deviation (in case of price staying above the level just for some candles) and what usually happens is price falling back to Monday middle range level and even back to Monday low.
the opposite can happen of course: you will become bullish if Monday low is tested or a deviation appears below Monday low: price tends to bounce on such occasions back to Monday middle range or even Monday high
Tuesday is usually a marker day within a trading week:
if Monday was pretty bullish, Tuesday high may mark the weekly top, following some red days
if Monday was pretty bearish, Tuesday low may mark the weekly bottom, following some green days
Thursday is the day when big players start to take profits, as the trading week is going to end the next day, so in an all-green week Thursday may be a red one, while in an all-red week it may be a bullish day
Thursday is the day when big players start to take profits, as the trading week is going to end the next day:
in an all-green week, Thursday may be a red one and it's low tends to mark the weekly low
while in an all-red week, it tends to be a bullish day, so here you will refill your shorts for the next blooding day
Let's talk now about the Weekly, Monthly and Yearly price levels : here it is the interesting part for Swing Traders
Weekly open is usually a defining level: on retest, if price keeps staying below then more downside is expected, if price keeps staying above then more upside is expected (similarly to what we said about Monday high and low)
Monthly and Yearly open price levels are usually a "no-brainer" buy level in a bullish trend or equally a sell level in a bearish trend: in this scenarios, a deviation structure is even more powerful in term of price reaction and efficiency
We trade Weekly, Monthly and Yearly high and low price levels as explained for the Monday high and low, but with a swing traders perspective (so a medium-long term trade)
Previous Weekly/Monthly/Yearly price levels are usually very useful as targets in your trades
Here below some screenshots that resumes what said above.
Weekly Open as support (bullish) and Monday High deviation (bearish)
Tuesday High, Weekly Open failing as support: bearish
Monday Low deviation (bullish)
Price Acceptance above Monday High and Weekly Open (bullish)
Yearly Open retests as buy opportunities
Deviation below Monthly Open (bullish), Price Acceptance below Monthly and Yearly Open (bearish)
This is a premium indicator , so send me a private message in order to get access to this script.
Trademania - PVSRA IndicatorTrademania - PVSRA Indicator
The Trademania - PVSRA Indicator is based on a proven MT4 indicator suite that has been in use since 2013. Over time, it has been expanded with additional features and tools. Originally developed for the Forex market, it also works well for cryptocurrencies, stocks, and other assets. The goal of this indicator is to combine classic chart analysis with PVSRA analysis, allowing for a clean mixed chart analysis. Traders gain access to a wide range of important information and can use it to form their trading assumptions. The indicator is designed to make it as simple as possible: identifying price levels at the breakout of key support/resistance, for confirmations above/below an imbalance, or recognizing and validating standard structures.
Important: This indicator is designed to be used across all timeframes. It works equally well for scalping on lower timeframes and for larger timeframes, such as spot trading on the 4H or daily chart.
The following core features are available:
- PVSRA Candles
- Dynamic Zones for PVSRA Candles (Imbalance)
- Market sessions with high/low points
- Integrated EMAs (daily, weekly, higher time frames)
- Fully customizable EMAs
- Pivot points with mid/50% level
- Price ranges from yesterday and last week
- Average daily range (also available for weekly and monthly)
- Psychological levels (for Forex)
- Daily open
- High/Low Point of Control (POC) indicators for wicks and candle bodies
- WIL (Weekly Interest Level) - High/Low of the Asian session
- On-chart labels for nearly all elements
Key Features:
- PVSRA, integrated POC levels, and WIL levels distinguish this indicator.
- Integrated EMAs and the daily, weekly, high time frame EMAs can be supplemented or replaced by custom EMAs for maximum flexibility.
Special Feature:
- Lite Mode for better visibility and simplified chart analysis.
Instructions and Notes
PVSRA Candles
Display volume or tick volume on the chart.
- Candles with more than 200% average volume of the last 10 candles, where the product of candle spread and volume is greater than the last 10 candles/timeframes, are shown in green (bullish) and red (bearish).
- Blue and purple candles show the same with 150% average volume of the last 10 candles.
**Note:** To obtain valid information, the trading volume should be as large as possible. If you're viewing the chart of an exchange with low trading volume, you can use the PVSRA override to display the volume from another exchange. For example, you can view the Phemex chart but display the tick/volume of the Binance chart as PVSRA/Vector candles.
Dynamic Zones for PVSRA Candles (Imbalance)
Zones that match the color of the respective vector candle display imbalance on the chart.
- In PVSRA analysis, it is assumed that such imbalances will be revisited and corrected. It can be customized whether this should happen with candle wicks or just the candle bodies.
Market Sessions with High/Low Points (DST)
Relevant market sessions: Sydney/NZX, Tokyo, Hong Kong, EU, New York, as well as the Brinks sessions pre EU/NY, are marked with high/low points and labeled on the chart.
- In PVSRA/Mixed analysis, these represent important liquidity zones of the individual trading sessions, often serving as key support/resistance levels.
WIL (Weekly Interest Level) - High/Low of the Asian Session
The new WIL levels represent the market open/Asian session of the new trading week: Sydney open to Hong Kong close.
- This forms an important price range for the trading week and is always a key breakout zone or rejection area in mixed analysis. Additional liquidity is needed to break through these levels.
- Higher effort against the start of the week – an imbalance (above/below).
High/Low Point of Control (POC) Indicators for Wicks and Candle Bodies
Additionally, the indicator includes pivot-based POC markers at key highs/lows on the chart.
- A POC is generated from the candle footprint (1000 resolution) and displayed on the chart.
- **Note:** If the POC is in a wick, it is shown as a line; if the POC is only in the candle body, it is displayed in small text.
- In mixed analysis, POCs in volume-heavy wicks are always a key indication of price levels that will be revisited and a potential enhancer for a wick-fill upwards or downwards.
EMA/Pivot Points/Psychological Levels Classic/Average Ranges:
Daily/ADR - Weekly/AWR / High/Low values for day/week, as well as the daily open of the current trading day, form the foundation of the indicator.
- Base structures that account for imbalance must break certain price levels to confirm or invalidate a previous movement (bullish or bearish).
- 13/50/200/800 EMA retrace: Breaking these in either direction without addressing an imbalance on the opposite side requires confirmation after the break.
- Pivot-level trading operates on the same principle.
- **Note:** Pivot levels in this indicator have additional M-levels, which represent 50% markers to provide better insights into potential retraces or upward moves.
- For example: Breaking M1, retracing, and confirming at M1 with a target at M2.
To recognize a standard 3-level rise or retrace scenario in mixed analysis, as well as a potential extended chart progression, these levels are essential.
**Note:** Average ranges such as High/Low ADR are particularly important levels where interruptions are expected. Profit-taking, long/short, is common at these points, independent of standard structures. This also applies to the high/low levels of the last trading day and the weekly versions of these levels.
The daily open helps identify possible SPOT/Futures gaps (depending on the asset, such as a missing futures market over the weekend: NAS/DAX).
Important:
The Lite Mode is designed to help traders reduce the chart to essential core functions (PVSRA/EMA/WIL/Psy/Daily Open/Hi-Lo) to apply classic TA effectively and strengthen a mixed analysis or challenge certain assumptions regarding confirmation and imbalance.
**Note:** It is recommended to additionally use a MACD indicator to identify potential trends and momentum.
- For example, a positive MACD trend supporting a 50 EMA breakout with a target of the 200 EMA under positive imbalance (standard mixed pattern).
To cater to personal preferences or trading strategies, it is possible to add custom EMA values to the indicator without the need for a second or third separate indicator.
All functions are fully customizable within the indicator settings.

Previous Day and Week RangesI've designed the "Previous Day and Week Ranges" indicator to enhance your trading strategy by clearly displaying daily and weekly price levels. This tool shows Open-Close and High-Low ranges for both daily and weekly timeframes directly on your trading chart.
Key Features :
Potential Support and Resistance: The indicator highlights previous day and week ranges that may serve as key support or resistance levels in subsequent trading sessions.
Customizable Display Options: Offers the flexibility to show or hide daily and weekly ranges based on your trading needs.
Color Customization: Adjust the color settings to differentiate between upward and downward movements, enhancing visual clarity and chart readability.
This indicator is ideal for traders aiming to understand market dynamics better, offering insights into potential pivot points and zones of price stability or volatility.

Monday_Weekly_Range/ErkOzi/Deviation Level/V1"Hello, first of all, I believe that the most important levels to look at are the weekly Fibonacci levels. I have planned an indicator that automatically calculates this. It models a range based on the weekly opening, high, and low prices, which is well-detailed and clear in my scans. I hope it will be beneficial for everyone.
***The logic of the Monday_Weekly_Range indicator is to analyze the weekly price movement based on the trading range formed on Mondays. Here are the detailed logic, calculation, strategy, and components of the indicator:
***Calculation of Monday Range:
The indicator calculates the highest (mondayHigh) and lowest (mondayLow) price levels formed on Mondays.
If the current bar corresponds to Monday, the values of the Monday range are updated. Otherwise, the values are assigned as "na" (undefined).
***Calculation of Monday Range Midpoint:
The midpoint of the Monday range (mondayMidRange) is calculated using the highest and lowest price levels of the Monday range.
***Fibonacci Levels:
// Calculate Fibonacci levels
fib272 = nextMondayHigh + 0.272 * (nextMondayHigh - nextMondayLow)
fib414 = nextMondayHigh + 0.414 * (nextMondayHigh - nextMondayLow)
fib500 = nextMondayHigh + 0.5 * (nextMondayHigh - nextMondayLow)
fib618 = nextMondayHigh + 0.618 * (nextMondayHigh - nextMondayLow)
fibNegative272 = nextMondayLow - 0.272 * (nextMondayHigh - nextMondayLow)
fibNegative414 = nextMondayLow - 0.414 * (nextMondayHigh - nextMondayLow)
fibNegative500 = nextMondayLow - 0.5 * (nextMondayHigh - nextMondayLow)
fibNegative618 = nextMondayLow - 0.618 * (nextMondayHigh - nextMondayLow)
fibNegative1 = nextMondayLow - 1 * (nextMondayHigh - nextMondayLow)
fib2 = nextMondayHigh + 1 * (nextMondayHigh - nextMondayLow)
***Fibonacci levels are calculated using the highest and lowest price levels of the Monday range.
Common Fibonacci ratios such as 0.272, 0.414, 0.50, and 0.618 represent deviation levels of the Monday range.
Additionally, the levels are completed with -1 and +1 to determine at which level the price is within the weekly swing.
***Visualization on the Chart:
The Monday range, midpoint, Fibonacci levels, and other components are displayed on the chart using appropriate shapes and colors.
The indicator provides a visual representation of the Monday range and Fibonacci levels using lines, circles, and other graphical elements.
***Strategy and Usage:
The Monday range represents the starting point of the weekly price movement. This range plays an important role in determining weekly support and resistance levels.
Fibonacci levels are used to identify potential reaction zones and trend reversals. These levels indicate where the price may encounter support or resistance.
You can use the indicator in conjunction with other technical analysis tools and indicators to conduct a more comprehensive analysis. For example, combining it with trendlines, moving averages, or oscillators can enhance the accuracy.
When making investment decisions, it is important to combine the information provided by the indicator with other analysis methods and use risk management strategies.
Thank you in advance for your likes, follows, and comments. If you have any questions, feel free to ask."

Key LevelsKey Levels Indicator
Description
The Key Levels indicator is a powerful tool for traders, displaying major institutional price levels from daily, weekly, and monthly timeframes on your chart. It plots horizontal lines for previous period highs, lows, and midpoints (50% levels), as well as current period opens, helping you identify critical support and resistance zones used by institutional traders. Labels are provided for the most recent levels, positioned at the rightmost bar for easy reference.
Features
Daily Levels: Plots Previous Day High, Previous Day Low, Day Open, and Previous Day 50% Level.
Weekly Levels: Plots Previous Week High, Previous Week Low, Week Open, and Previous Week 50% Level.
Monthly Levels: Plots Previous Month High, Previous Month Low, Month Open, and Previous Month 50% Level.
Customizable Colors: Adjust the color of each line via the settings panel to suit your chart preferences.
Customizable Labels: Enable/disable labels, adjust label size, and change the label background color for optimal visibility.
Clean Visualization: Lines are plotted with breaks at the start of each period, ensuring a clear and uncluttered display.
Settings
Show Labels: Toggle to show or hide all labels (default: enabled).
Label Size: Choose from "tiny," "small," "normal," "large," or "huge" to adjust label text size (default: normal).
Label Background Color: Customize the background color of labels to ensure text visibility (default: black).
Line Colors: Individual color pickers for each level (e.g., Previous Day High, Day Open), allowing full customization of line colors.
Usage
The Key Levels indicator is designed for futures markets, such as S&P 500 futures (ES), Nasdaq futures (NQ), or crude oil futures (CL), where institutional price levels like daily, weekly, and monthly highs, lows, and opens are key for getting into positions. For day trading, use these levels to identify short-term support and resistance for intraday entries and exits. For long-term trading, they provide context for swing positions or trend continuation, helping you align with institutional flow. Apply the indicator to a 1-hour or 15-minute timeframe to capture precise market structure. While optimized for futures, the indicator's key levels apply to every single thing that can be traded, including forex, stocks, and cryptocurrencies, making it versatile for all asset classes.
Notes
Labels are shown only for the current day, week, and month to focus on recent price action.
For best visibility, adjust the label background color if text blends into your chart background.
Ideal for traders analyzing major institutional levels for market structure and trading decisions.

[GrandAlgo] MTF Historical Highs and LowsMany traders rely on weekly highs and lows to identify key market levels, but what if you could see how price reacted to these levels in past weeks, months, or even years? With MTF Historical Highs and Lows, you can visualize all past highs, lows, and midpoints from any timeframe, allowing you to refine your strategy and make more informed trading decisions.
This indicator retrieves and plots historical highs, lows, and midpoints based on a user-selected timeframe (default: Weekly). It dynamically updates, ensuring that all significant price levels remain visible on your chart. Additionally, smart filtering helps you focus only on relevant levels, and alerts notify you when price interacts with key zones.
Key Features:
✅ Automatically Fetches & Plots Historical Highs, Lows, and Midpoints
✅ Customizable Timeframes (default: Weekly, but adjustable)
✅ Visibility Filtering – Hides lines that are too far from the current price
✅ Alerts for Key Levels – Get notified when price touches an important historical level
✅ Customizable Colors & Display Preferences for clarity
How It Works:
1️⃣ Select a Date Range – Focus on historical levels that are most relevant to the current market conditions
2️⃣ Choose a Timeframe – Use Weekly, Monthly, or any timeframe that suits your strategy.
3️⃣ Enable Highs, Lows, and Midpoints – Customize what you want to see.
4️⃣ Adjust Filtering – Hide lines that are too far from the current price to reduce clutter.
5️⃣ Get Alerts – Be notified when price reaches a historical level for potential trade setups.
Ideal for Traders Who:
Trade Support & Resistance Levels – Understand how price reacts at historical highs and lows.
Analyze Market Structure – Identify key areas where price may reverse or break out.
Want Smart Alerts – Stay informed without staring at charts all day.

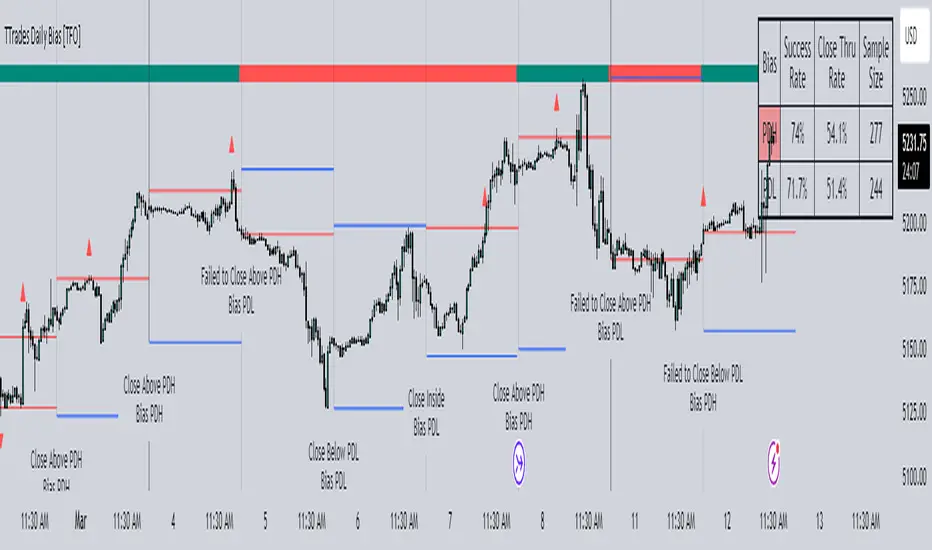
TTrades Daily Bias [TFO]Inspired by @TTrades_edu video on daily bias, this indicator aims to develop a higher timeframe bias and collect data on its success rate. While a handful of concepts were introduced in said video, this indicator focuses on one specific method that utilizes previous highs and lows. The following description will outline how the indicator works using the daily timeframe as an example, but the weekly timeframe is also an included option that functions in the exact same manner.
On the daily timeframe, there are a handful of possible scenarios that we consider: if price closes above its previous day high (PDH), the following day's bias will target PDH; if price trades above its PDH but closes back below it, the following day's bias will target its previous day low (PDL).
Similarly, if price closes below its PDL, the following day's bias will target PDL. If price trades below its PDL but closes back above it, the following day's bias will target PDH.
If price trades as an inside bar that doesn't take either PDH or PDL, it will refer to the previous candle for bias. If the previous day closed above its open, it will target PDH and vice versa. If price trades as an outside bar that takes both PDH and PDL, but closes inside that range, no bias is assigned.
With a rigid framework in place, we can apply it to the charts and observe the results.
As shown above, each new day starts by drawing out the PDH and PDL levels. They start out as blue and turn red once traded through (these are the default colors which can be changed in the indicator's settings). The triangles you see are plotted to indicate the time at which PDH or PDL was traded through. This color scheme is also applied to the table in the top right; once a bias is determined, that cell's color starts out as blue and turns red once the level is traded through.
The table indicates the success rate of price hitting the levels provided by each period's bias, followed by the success rate of price closing through said levels after reaching them, as well as the sample size of data collected for each scenario.
In the above crude oil futures (CL1!) 30m chart, we can glean a lot of information from the table in the top right. First we may note that the "PDH" cell is red, which indicates that the current day's bias was targeting PDH and it has already traded through that level. We might also note that the "PWH" cell is blue, which indicates that the weekly bias is targeting the previous week high (PWH) but price has yet to reach that level.
As an example of how to read the table's data, we can look at the "PDH" row of the crude oil chart above. The sample size here indicates that there were 279 instances where the daily bias was assigned as PDH. From this sample size, 76.7% of instances did go on to trade through PDH, and only 53.7% of those instances actually went on to close through PDH after hitting that level.
Of course, greater sample sizes and therefore greater statistical significance may be derived from higher timeframe charts that may go further back in time. The amount of data you can observe may also depend on your TradingView plan.
If we don't want to see the labels describing why bias is assigned a certain way, we can simply turn off the "Show Bias Reasoning" option. Additionally, if we want to see a visual of what the daily and weekly bias currently is, we can plot that along the top and bottom of the chart, as shown above. Here I have daily bias plotted at the top and weekly bias at the bottom, where the default colors of green and red indicate that the bias logic is expecting price to draw towards the given timeframe's previous high or low, respectively.
For a compact table view that doesn't take up much chart space, simply deselect the "Show Statistics" option. This will only show the color-coded bias column for a quick view of what levels are being anticipated (more user-friendly for mobile and other smaller screens).
Alerts can be configured to indicate the bias for a new period, and/or when price hits its previous highs and lows. Simply enable the alerts you want from the indicator's settings and create a new alert with this indicator as the condition. There will be options to use "Any alert() function call" which will alert whatever is selected from the settings, or you can use more specific alerts for bullish/bearish bias, whether price hit PDH/PDL, etc.
Lastly, while the goal of this indicator was to evaluate the effectiveness of a very specific bias strategy, please understand that past performance does not guarantee future results.
Day/Week/Month Metrics (Zeiierman)█ Overview
The Day/Week/Month Metrics (Zeiierman) indicator is a powerful tool for traders looking to incorporate historical performance into their trading strategy. It computes statistical metrics related to the performance of a trading instrument on different time scales: daily, weekly, and monthly. Breaking down the performance into daily, weekly, and monthly metrics provides a granular view of the instrument's behavior.
The indicator requires the chart to be set on a daily timeframe.
█ Key Statistics
⚪ Day in month
The performance of financial markets can show variability across different days within a month. This phenomenon, often referred to as the "monthly effect" or "turn-of-the-month effect," suggests that certain days of the month, especially the first and last days, tend to exhibit higher than average returns in many stock markets around the world. This effect is attributed to various factors including payroll contributions, investment of monthly dividends, and psychological factors among traders and investors.
⚪ Edge
The Edge calculation identifies days within a month that consistently outperform the average monthly trading performance. It provides a statistical advantage by quantifying how often trading on these specific days yields better returns than the overall monthly average. This insight helps traders understand not just when returns might be higher, but also how reliable these patterns are over time. By focusing on days with a higher "Edge," traders can potentially increase their chances of success by aligning their strategies with historically more profitable days.
⚪ Month
Historically, the stock market has exhibited seasonal trends, with certain months showing distinct patterns of performance. One of the most well-documented patterns is the "Sell in May and go away" phenomenon, suggesting that the period from November to April has historically brought significantly stronger gains in many major stock indices compared to the period from May to October. This pattern highlights the potential impact of seasonal investor sentiment and activities on market performance.
⚪ Day in week
Various studies have identified the "day-of-the-week effect," where certain days of the week, particularly Monday and Friday, show different average returns compared to other weekdays. Historically, Mondays have been associated with lower or negative average returns in many markets, a phenomenon often linked to the settlement of trades from the previous week and negative news accumulation over the weekend. Fridays, on the other hand, might exhibit positive bias as investors adjust positions ahead of the weekend.
⚪ Week in month
The performance of markets can also vary within different weeks of the month, with some studies suggesting a "week of the month effect." Typically, the first and the last week of the month may show stronger performance compared to the middle weeks. This pattern can be influenced by factors such as the timing of economic reports, monthly investment flows, and options and futures expiration dates which tend to cluster around these periods, affecting investor behavior and market liquidity.
█ How It Works
⚪ Day in Month
For each day of the month (1-31), the script calculates the average percentage change between the opening and closing prices of a trading instrument. This metric helps identify which days have historically been more volatile or profitable.
It uses arrays to store the sum of percentage changes for each day and the total occurrences of each day to calculate the average percentage change.
⚪ Month
The script calculates the overall gain for each month (January-December) by comparing the closing price at the start of a month to the closing price at the end, expressed as a percentage. This metric offers insights into which months might offer better trading opportunities based on historical performance.
Monthly gains are tracked using arrays that store the sum of these gains for each month and the count of occurrences to calculate the average monthly gain.
⚪ Day in Week
Similar to the day in the month analysis, the script evaluates the average percentage change between the opening and closing prices for each day of the week (Monday-Sunday). This information can be used to assess which days of the week are typically more favorable for trading.
The script uses arrays to accumulate percentage changes and occurrences for each weekday, allowing for the calculation of average changes per day of the week.
⚪ Week in Month
The script assesses the performance of each week within a month, identifying the gain from the start to the end of each week, expressed as a percentage. This can help traders understand which weeks within a month may have historically presented better trading conditions.
It employs arrays to track the weekly gains and the number of weeks, using a counter to identify which week of the month it is (1-4), allowing for the calculation of average weekly gains.
█ How to Use
Traders can use this indicator to identify patterns or trends in the instrument's performance. For example, if a particular day of the week consistently shows a higher percentage of bullish closes, a trader might consider this in their strategy. Similarly, if certain months show stronger performance historically, this information could influence trading decisions.
Identifying High-Performance Days and Periods
Day in Month & Day in Week Analysis: By examining the average percentage change for each day of the month and week, traders can identify specific days that historically have shown higher volatility or profitability. This allows for targeted trading strategies, focusing on these high-performance days to maximize potential gains.
Month Analysis: Understanding which months have historically provided better returns enables traders to adjust their trading intensity or capital allocation in anticipation of seasonally stronger or weaker periods.
Week in Month Analysis: Identifying which weeks within a month have historically been more profitable can help traders plan their trades around these periods, potentially increasing their chances of success.
█ Settings
Enable or disable the types of statistics you want to display in the table.
Table Size: Users can select the size of the table displayed on the chart, ranging from "Tiny" to "Auto," which adjusts based on screen size.
Table Position: Users can choose the location of the table on the chart
-----------------
Disclaimer
The information contained in my Scripts/Indicators/Ideas/Algos/Systems does not constitute financial advice or a solicitation to buy or sell any securities of any type. I will not accept liability for any loss or damage, including without limitation any loss of profit, which may arise directly or indirectly from the use of or reliance on such information.
All investments involve risk, and the past performance of a security, industry, sector, market, financial product, trading strategy, backtest, or individual's trading does not guarantee future results or returns. Investors are fully responsible for any investment decisions they make. Such decisions should be based solely on an evaluation of their financial circumstances, investment objectives, risk tolerance, and liquidity needs.
My Scripts/Indicators/Ideas/Algos/Systems are only for educational purposes!

Diddly - Charts (Asian, London & New York Session + Weekdays)Overview:
Diddly Charts is for providing intraday context to where we are in the market. It does this through a series of ranges displayed throughout the day, typically broken down into the Asian, London, and New York sessions.
This indicator also highlights key market structures like monthly, weekly, and previous day's highs and lows. Lines are provided for weekday and weekend separators, with the days of the week at the bottom of the chart, making it extremely useful for traders when identifying weekly cycles.
Usage:
All aspects of this indicator are changeable within the settings, allowing you to utilise the elements that are most important to your trading strategy.
The default layout is extremely useful for currency pairs, where traders use the London and New York boxes as windows of when to engage with the market. The times of these trading sessions can be changed to suit the trading periods that you want to trade.
Adhering to trading windows can help improve discipline to ensure that you are only taking entries within the time periods that match your trading strategy.
Some traders prefer a cleaner interface and don't want any indicator to detract from the price action they are reading, this can be achieved through changing the colour and their transparency in settings. In this example, you will see different labels used to annotate key structures, these can be changed to something that is relevant to your strategy in the settings.
It can also be used for trading Stocks where sessions are broken down into pre-market, market hours and post-market. This can be helpful to see those stocks that breakout of pre-market session highs and lows and also provide trading windows to keep traders out of trades that do not comply with their trading strategy.
Using higher time frames like a 4 hour chart or even the 1 hour chart, the intraday sessions are hidden away so traders can get a broader perspective without the clutter when zooming out. Although there are options to turn it on if you would prefer.
Here on a zoomed out 1 hour chart we have the option to only display the weekly line separator, which can help get an overview of weekly cycles.
Helpful Information
The main setting that you may want to change is at the top of the indicator settings, which is asking "what asset type" is the symbol being looked at. The indicator needs to know how to display the session range information. For example for currencies, the range size will be displayed in pips. For stocks or Futures it would display the financial amount. Beyond the visual display of information, this setting has no other impact on the indicator behaviour. The default setting is "Currencies".
We often get asked what the labels that appear on the chart mean. These can all be changed to your requirements, but by default what you will see when you apply the indicator to the chart is:
Under the Asian Range appears a couple of labels.
A = x : This is the range size of the session in pips for forex or amount for other assets, from the lowest to the highest price traded during that window.
ADR = y : This is the Average Daily Range over the last 21 days for this ticker
Under the London and New York session you will see a L = x or NY = y . This is the range size of each session in pips for forex or amount for other assets.
Structure Labels
YH = Yesterday's High
YL = Yesterday's Low
WH = Current Week's High
WL = Current Week's Low
MH = Current Month's High
ML = Current Month's Low
We greatly appreciate the support and feedback from the Trading View community, and we are dedicated to continuing to improve our indicators with your support.
We want to help you manage risk, and that's why we emphasise that trading is risky and any technology used to support our trading decisions is based on information from the past. We encourage traders to take responsibility for their trading businesses and always prioritise risk management.

Week & Day Boxes Projected forward; with day-of-week labelsProjecting Week and Day boxes forward into the future, as an aide in framing the shape/profile of the coming week(s)/day(s).
////user inputs////
~toggle on/off daily and/or weekly boxes.
~input number of 2week blocks or number of 2day blocks to project forward.
~independently format colors and opacities of weekly and daily boxes.
~toggle on/off day-of-week labels (if you just want day labels, make opacity of day boxes&borders zero).
////notes////
-I have limited the project-forward numbers to keep it neat. If you want to play around with them, edit UP the FIRST integer in lines 56, 58, 62, 64 (currently set to 11,10, 41, 40 respectively). And edit UP maxvals in lines 9 and 15.
-To change the height of weekly and/or daily boxes, tweak the SECOND integer in lines 56, 58, 62, 64.
-Written for ES (S&P); tested/working on FX and BTC too.
-Starts painting/Resets at the beginning of a new week (i.e. Sunday eve).
-Sunday is blended into Monday; day's are defined as finishing at 6pm (New York Time).
